Solar/Wind Hybrid Renewable Power Generators for Minnesota Rural Transportation Applications
|
|
|
- Grant Sullivan
- 6 years ago
- Views:
Transcription
1 Solar/Wind Hybrid Renewable Power Generators for Minnesota Rural Transportation Applications Taek Kwon and Ryan Weidemann University of Minnesota-Duluth Ray Starr, Kevin Schmidt and Roger Sowder Minnesota Department of Transportation
2 Outline Introduction Renewable light pole Renewable power station for DMS Conclusion
3 Renewable Energy for Rural ITS The types of ITS technologies that could benefit: Traffic-activated advisory signs Advance warning signals/flashers for hazardous locations Variable message signs Road-weather condition detection systems Remote rural areas Lack of easily accessible power sources High cost of bringing electric utility Solar/wind generated power is independent of distance No monthly electric fees

4 Renewable Light Pole

5 Lighting at Night
6 Why Solar/Wind Hybrid? Complementing resources Lack of winds but more sunlight in summer Lack of sunlight but more winds on bad weather System Redundancy If PV breaks down, wind still generates power, or vice versa. Increased power and system reliability
7 November 18, 2006 Rainy, windy, and cloudy
8 December 31, 2006 Ice and snow storm

9 June 12, 2007 Sunny, calm, and no precipitation

10 June 19, 2007 Sunny, windy, and no precipitation

11 Summary of Daily Power Generation Using the NREL website for fall and spring Solar Energy Fall and Spring about 75% of Summer Wind Energy Fall and Spring about 50% of Winter
12 Purchased Component List
13 Summary Wind/Solar hybrid renewable system Complementing Many rural ITS applications could benefit Because power budget is independent of distance
14 Renewable Power Station for DMS: Project Tasks Analyze DMS power requirements Develop prototype renewable power station Design controller Install prototype unit at rural location Collect data and evaluate prototype system Develop design and procurement specs Final Report
15 ENTERPRISE Program A pooled-fund organization with member agencies in US, Canada, and Netherlands Support jointly-sponsored ITS projects of shared interest Provide test beds in a variety of environments and locations for emerging ITS technologies Identify common needs within the group and proceed with appropriate technical activities
16 ENTERPRISE Members Arizona Department of Transportation Colorado Department of Transportation Dutch Ministry of Transportation Federal Highway Administration Iowa Department of Transportation Kansas Department of Transportation Ministry of Transportation of Ontario Minnesota Department of Transportation Transport Canada Virginia Department of Transportation Washington State Department of Transportation
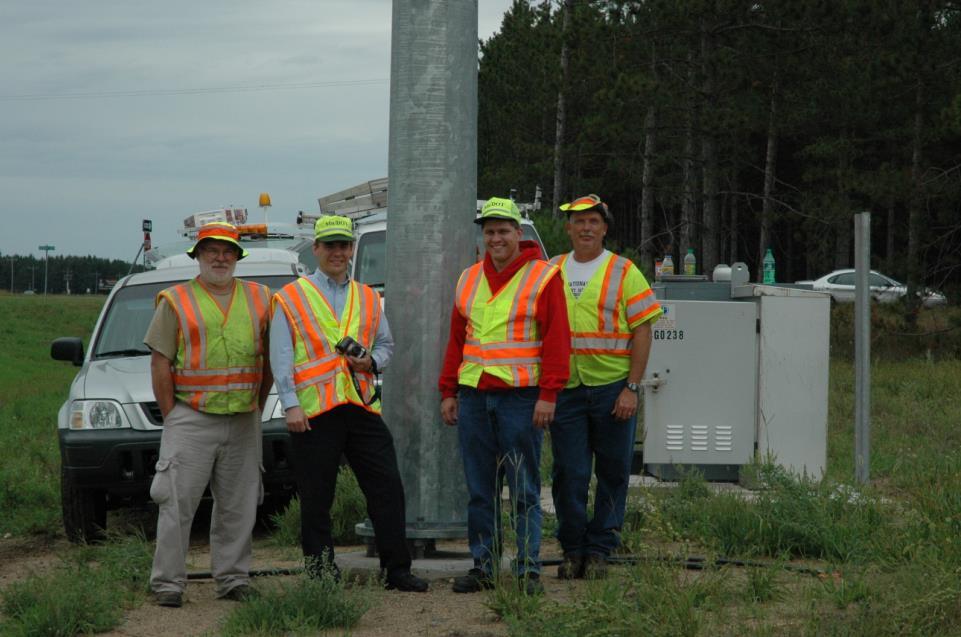
17 Rural Renewable Power Station Site Hwy 371 at 250 th St., south of Ft. Ripley, MN Rural location T intersection Power station in SE quadrant VMS in NW quadrant

18 Renewable Power Station Site

19 Project Location

20 Rural Renewable Power Station Site (Looking North)

21 Summer Solar Energy

22 Winter Wind Energy
23 Available Solar/Wind Energy Solar Radiation KWh/m 2 /day during the summer KWh/m 2 /day during the winter Wind Density Class 2 during the summer: W/m 2 Class 3 during the winter: W/m 2
 Power Safety SW Turbine Controller (COTS) Solar Controller (COTS) Solar Panels Wind Turbine (COTS) (COTS) NOTES: COTS = Commercial Off the Shelf = Power")
24 VMS VMS Controller (COTS) (COTS) AC Inverter 120 VAC (COTS) System Overview Control Cabinet Battery Cabinet Data Logger Analyzer (Custom) 48 VDC Battery Bank (Assembled) Power Safety SW Turbine Controller (COTS) Solar Controller (COTS) Solar Panels Wind Turbine (COTS) (COTS) NOTES: COTS = Commercial Off the Shelf = Power Flow = Sensing
25 DMS Sign & Controller ADDCO Brick 3 Line x 12 Character 5x7 Pixels per Character, 8 LEDs per Pixel 80 Watts Idle 258 Watts on 35 bricks ON Amber Monochrome Roadside Mounted

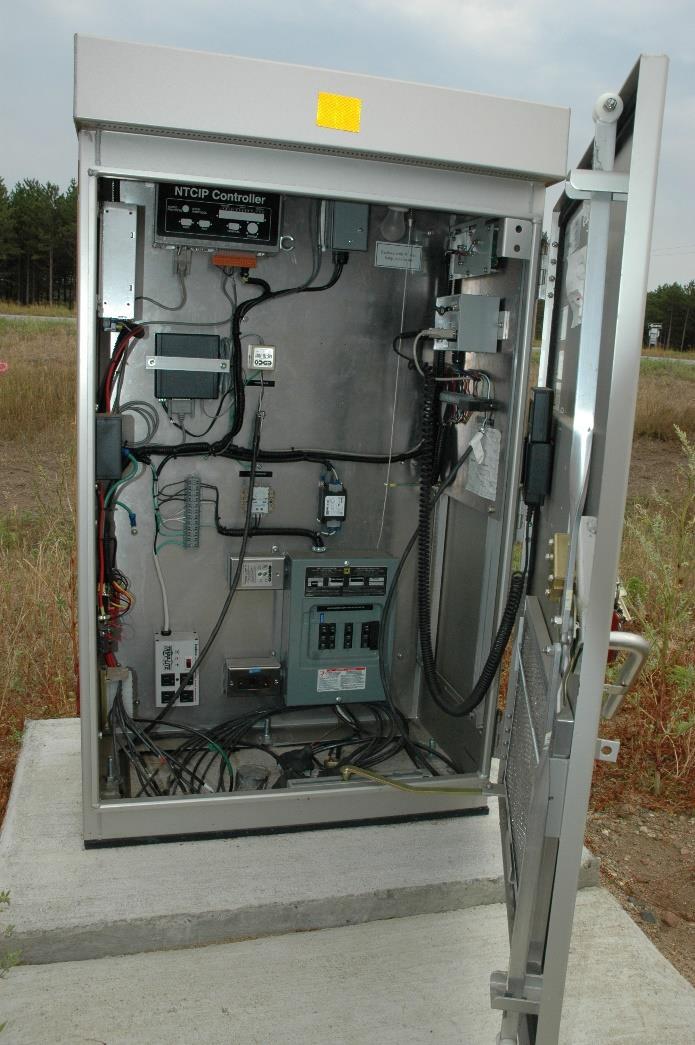
26 DMS and Control Cabinet
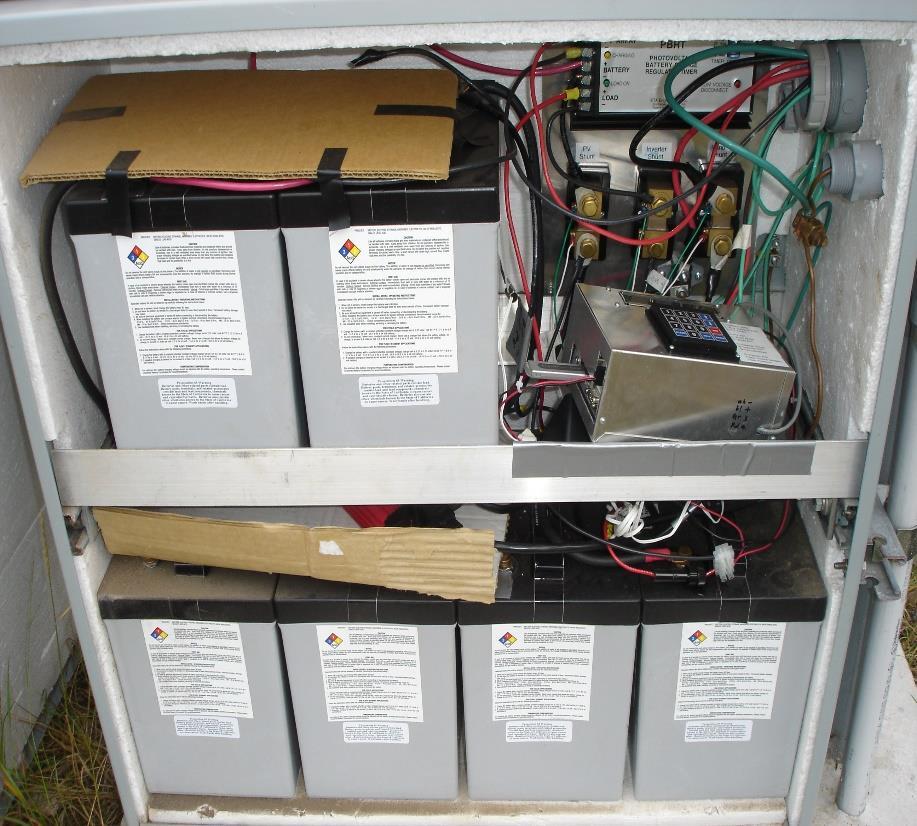
27 Battery Bank 6V 220Ah AGM deep cycle batteries 32 batteries Total 42,240Wh Capacity Provide 7 days of power without charge for DMS Cabinet Custom designed Insulated and ventilated


28 Battery Bank
29 Solar Panel

30 Three Solar Panels 3 * 170W=510W Max Three panels in series connection Charge controller converts 23*3=69V to 48V

31 Solar Panel Controller OutBack MX60 Maximum Power Point Tracking (MPPT) charge controller Standby power consumption: less than 1W Set to 48V charge system 60 Amp max current


32 Wind Turbine and Controller Whisper 200, Southwest Windpower 1,000W at 26mph

33 AC Inverter Outback VFX3638 Off-Grid Inverter 48V DC to 120AC/60Hz 3,600W Cont., 6,000W surge Idle power: 23W Reliable
34 Power Monitoring System TS-7260 Single Board Computer (SBC) manufactured by Technological Systems Large flash memory capable of storing more than 10 years of data Real-time clock for time-stamping of the data Measure currents using shunts A/D Converter PentaMetric manufactured by Bogart Engineering No memory 24/7 continuous monitoring
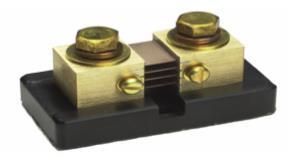


35 Power Monitoring System


36 Installation (1)


37 Installation (2)

38 Installation (3)

39 After Installation
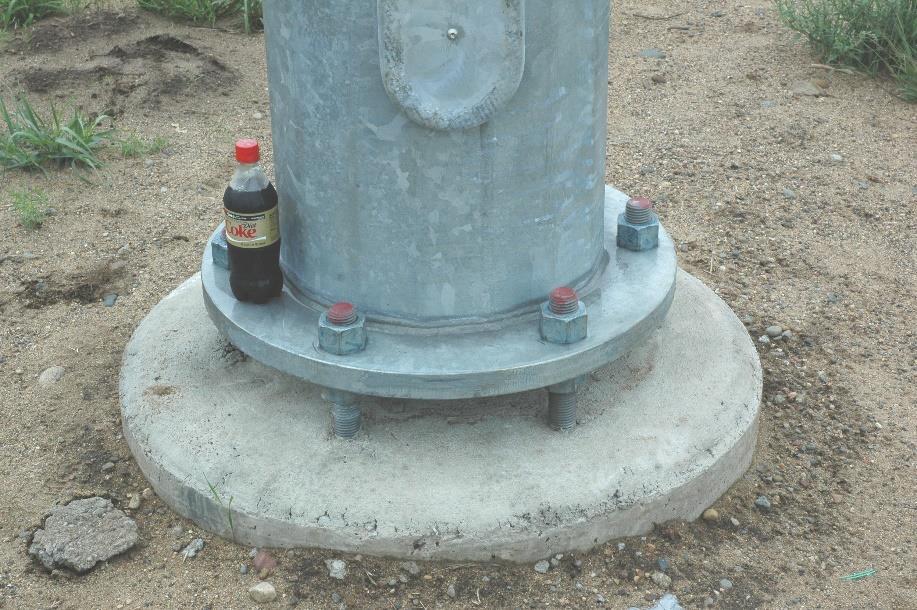
40 Pole
41 Cost Description Qty Unit cost Extended Solar panel 3 $839 $2,517 Wind turbine w/ Controller 1 $2,521 $2,521 Battery 32 $187 $5,980 Mounting Pole 1 $5,786 $5,786 Inverter 1 $1,899 $1,899 Power data logger 1 $5,94 $5,94 Battery cabinet 1 $1,900 $1,900 Pole foundation 1 $5,270 $5,270 Misc cables, shunts $360 $360 Total $30,003

42
43
44

45
46 Tests Signs 8 13 BUCKLE UP DRIVE WITH CARE SIGN TEST IN PROGRESS TEST 01 TEST ABCDEFGHIJKL MNOPQRSTUVWX 18 34
47 Sign Tests (7/2-8/21,08) 7/7 12:05pm 7/14 8:30am, 18 characters ON (132 hours) 7/15 8:30am 7/23 9:45am, 34 characters ON (193 hours) 8/7-8/20, 13 characters ON (312 hours) 8/21 high load test
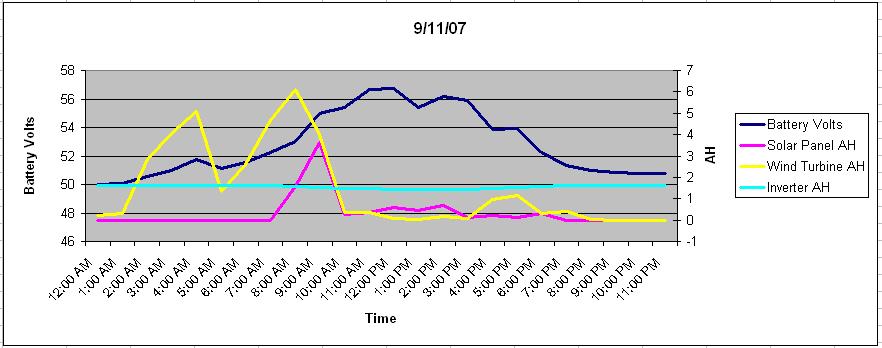
48 Daily Power Data (7/2-8/21,08) Daily Avg Power State Ah /2/08 7/4/08 7/6/08 7/8/08 7/10/08 7/12/08 7/14/08 7/16/08 7/18/08 7/20/08 7/22/08 7/24/08 7/26/08 7/28/08 7/30/08 8/1/08 8/3/08 8/5/08 8/7/08 8/9/08 8/11/08 8/13/08 8/15/08 8/17/08 8/19/08 8/21/ Volt Solar Ah Wind Ah Inverter Ah Battery V
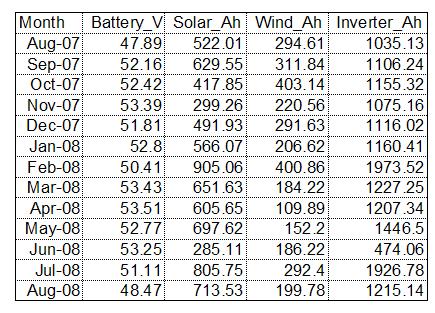
49 Monthly Power Generation/Consumption Data
50 Monthly Power Data Monthly Ah and Volts Amp Hours Volts Solar_Ah Wind_Ah Inverter_Ah Battery_V Aug- 07 Sep- 07 Oct- 07 Nov- 07 Dec- 07 Jan- 08 Feb- 08 Mar- 08 Apr- 08 May- 08 Jun- 08 Jul-08 Aug- 08

51

52

53
54
55

56

57

58
59 Conclusion Wind/Solar hybrid renewable power station was successfully constructed and tested Solar/Wind combination is complementary and increases power reliability Higher capacity wind turbine, PV panels and battery banks can increase power reliability Higher capacity inverter was more reliable Large battery bank created an effect of water level on a large lake, i.e., voltage level changes little from the load or charge.
60 Questions? Dr. Taek Kwon Phone: (218)
Solar/Wind Hybrid Renewable Power Generator for Powering Rural Dynamic Message Sign
 Solar/Wind Hybrid Renewable Power Generator for Powering Rural Dynamic Message Sign Taek Kwon (Prof.) and Ryan Weidemann (GRA) University of Minnesota-Duluth Ray Starr, Kevin Schmidt and Roger Sowder Minnesota
TDRL Projects: Solar/Wind Hybrid Renewable Light Pole, Gravel-Road Traffic Counter, DLL-Based Traffic Software Development Kit
 TDRL Projects: Solar/Wind Hybrid Renewable Light Pole, Gravel-Road Traffic Counter, DLL-Based Traffic Software Development Kit Final Report Prepared By: Taek Mu Kwon, Ph.D. (Principal Investigator) Ryan
Modeling and Comparison of Dynamics of AC and DC Coupled Remote Hybrid Power Systems
 Modeling and Comparison of Dynamics of AC and DC Coupled Remote Hybrid Power Systems Presenter: Tanjila Haque Supervisor : Dr. Tariq Iqbal Faculty of Engineering and Applied Science Memorial University
Commercial-in-Confidence Ashton Old Baths Financial Model - Detailed Cashflow
 Year 0 1 2 3 4 5 6 7 8 9 10 11 12 13 Oct-16 Nov-16 Dec-16 Jan-17 Feb-17 Mar-17 Apr-17 May-17 Jun-17 Jul-17 Aug-17 Sep-17 Oct-17 2,038 2,922 4,089 4,349 6,256 7,124 8,885 8,885 8,885 8,885 8,885 8,885 9,107
COMPARISON OF FIXED & VARIABLE RATES (25 YEARS) CHARTERED BANK ADMINISTERED INTEREST RATES - PRIME BUSINESS*
 CHARTERED BANK ADMINISTERED INTEREST RATES - PRIME BUSINESS*") COMPARISON OF FIXED & VARIABLE RATES (25 YEARS) 2 Fixed Rates Variable Rates For Internal Use Only. FIXED RATES OF THE PAST 25 YEARS AVERAGE RESIDENTIAL MORTGAGE LENDING RATE - 5 YEAR* (Per cent) Year
COMPARISON OF FIXED & VARIABLE RATES (25 YEARS) 2 Fixed Rates Variable Rates For Internal Use Only. FIXED RATES OF THE PAST 25 YEARS AVERAGE RESIDENTIAL MORTGAGE LENDING RATE - 5 YEAR* (Per cent) Year
COMPARISON OF FIXED & VARIABLE RATES (25 YEARS) CHARTERED BANK ADMINISTERED INTEREST RATES - PRIME BUSINESS*
 CHARTERED BANK ADMINISTERED INTEREST RATES - PRIME BUSINESS*") COMPARISON OF FIXED & VARIABLE RATES (25 YEARS) 2 Fixed Rates Variable Rates FIXED RATES OF THE PAST 25 YEARS AVERAGE RESIDENTIAL MORTGAGE LENDING RATE - 5 YEAR* (Per cent) Year Jan Feb Mar Apr May Jun
COMPARISON OF FIXED & VARIABLE RATES (25 YEARS) 2 Fixed Rates Variable Rates FIXED RATES OF THE PAST 25 YEARS AVERAGE RESIDENTIAL MORTGAGE LENDING RATE - 5 YEAR* (Per cent) Year Jan Feb Mar Apr May Jun
TRAFFIC VOLUME TRENDS July 2002
 TRAFFIC VOLUME TRENDS July 2002 Travel on all roads and streets changed by +2.3 percent for July 2002 as compared to July 2001. Estimated Vehicle-Miles of Travel by Region - July 2002 - (in Billions) West
Design Criteria Data
 DULUTH MN Latitude = 46.83 N WMO No. 72745 Longitude = 92.18 W Elevation = 1417 feet Period of Record = 1973 to 1996 Average Pressure = 28.43 inches Hg Design Criteria Data Mean Coincident (Average) Values
DIN W.-Nr AISI 304
 Position Qty. Description 1 SP 11-20 Product No.: 98809286 Submersible borehole pump, suitable for pumping clean water. Can be installed vertically or horizontally. All steel components are made in stainless
TRAFFIC VOLUME TRENDS
 Page 1 U. S. Department Transportation Federal Highway Administration Office Highway Policy Information TRAFFIC VOLUME TRENDS September Travel on all roads and streets changed by +2.5 (5.8 billion vehicle
Design Criteria Data
 OKLAHOMA CITY OK Latitude = 35.4 N WMO No. 72353 Longitude = 97.6 W Elevation = 133 feet Period of Record = 1973 to 1996 Average Pressure = 28.62 inches Hg Design Criteria Data Mean Coincident (Average)
Design Criteria Data
 MEDFORD/JACKSON CO. OR Latitude = 42.37 N WMO No. 72597 Longitude =122.8 W Elevation = 1329 feet Period of Record = 1973 to 1996 Average Pressure = 28.61 inches Hg Design Criteria Data Mean Coincident
Economics of Integrating Renewables DAN HARMS MANAGER OF RATE, TECHNOLOGY & ENERGY POLICY SEPTEMBER 2017
 Economics of Integrating Renewables DAN HARMS MANAGER OF RATE, TECHNOLOGY & ENERGY POLICY SEPTEMBER 2017 Presentation Outline Understanding LPEA s expenses and what drives them Economics of net metering
Design Criteria Data
 DES MOINES IA Latitude = 41.53 N WMO No. 72546 Longitude = 93.65 W Elevation = 965 feet Period of Record = 1973 to 1996 Average Pressure = 28.96 inches Hg Design Criteria Data Mean Coincident (Average)
Design Criteria Data
 LAS VEGAS/MCCARRAN NV Latitude = 36.8 N WMO No. 72386 Longitude =115.1 W Elevation = 2179 feet Period of Record = 1973 to 1996 Average Pressure = 27.67 inches Hg Design Criteria Data Mean Coincident (Average)
Design Criteria Data
 PHOENIX/SKY HARBOR AZ Latitude = 33.43 N WMO No. 72278 Longitude =112. W Elevation = 116 feet Period of Record = 1973 to 1996 Average Pressure = 28.72 inches Hg Design Criteria Data Mean Coincident (Average)
Design Criteria Data
 MINNEAPOLIS-ST PAUL MN Latitude = 44.88 N WMO No. 72658 Longitude = 93.22 W Elevation = 837 feet Period of Record = 1973 to 1996 Average Pressure = 29.7 inches Hg Design Criteria Data Mean Coincident (Average)
Design Criteria Data
 BURLINGTON VT Latitude = 44.47 N WMO No. 72617 Longitude = 73.15 W Elevation = 341 feet Period of Record = 1973 to 1996 Average Pressure = 29.61 inches Hg Design Criteria Data Mean Coincident (Average)
Design Criteria Data
 PIERRE SD Latitude = 44.38 N WMO No. 726686 Longitude =1.2 W Elevation = 1742 feet Period of Record = 1973 to 1996 Average Pressure = 28.1 inches Hg Design Criteria Data Mean Coincident (Average) Values
Design Criteria Data
 PHILADELPHIA PA Latitude = 39.88 N WMO No. 7248 Longitude = 75.25 W Elevation = 3 feet Period of Record = 1973 to 1996 Average Pressure = 29.98 inches Hg Design Criteria Data Mean Coincident (Average)
Design Criteria Data
 HONOLULU/OAHU HI Latitude = 21.35 N WMO No. 91182 Longitude =157.9 W Elevation = 16 feet Period of Record = 1967 to 1996 Average Pressure = 29.96 inches Hg Design Criteria Data Mean Coincident (Average)
Design Criteria Data
 INDIANAPOLIS IN Latitude = 39.73 N WMO No. 72438 Longitude = 86.27 W Elevation = 87 feet Period of Record = 1973 to 1996 Average Pressure = 29.15 inches Hg Design Criteria Data Mean Coincident (Average)
Design Criteria Data
 COLUMBIA SC Latitude = 33.95 N WMO No. 7231 Longitude = 81.12 W Elevation = 226 feet Period of Record = 1973 to 1996 Average Pressure = 29.8 inches Hg Design Criteria Data Mean Coincident (Average) Values
Design Criteria Data
 RAPID CITY SD Latitude = 44.5 N WMO No. 72662 Longitude =3. W Elevation = 3169 feet Period of Record = 1973 to 1996 Average Pressure = 26.67 inches Hg Design Criteria Data Mean Coincident (Average) Values
Design Criteria Data
 MACON/LEWIS WILSON GA Latitude = 32.7 N WMO No. 72217 Longitude = 83.65 W Elevation = 361 feet Period of Record = 1973 to 1996 Average Pressure = 29.66 inches Hg Design Criteria Data Mean Coincident (Average)
Design Criteria Data
 ANCHORAGE AK Latitude = 61.17 N WMO No. 7273 Longitude =15. W Elevation = 131 feet Period of Record = 1973 to 1996 Average Pressure = 29.6 inches Hg Design Criteria Data Mean Coincident (Average) Values
Design Criteria Data
 DENVER/STAPLETON CO Latitude = 39.75 N WMO No. 72469 Longitude =14.8 W Elevation = 5332 feet Period of Record = 1973 to 1995 Average Pressure = 24.66 inches Hg Design Criteria Data Mean Coincident (Average)
Design Criteria Data
 JACKSONVILLE FL Latitude = 3.5 N WMO No. 7226 Longitude = 81.7 W Elevation = 3 feet Period of Record = 1973 to 1996 Average Pressure = 3.1 inches Hg Design Criteria Data Mean Coincident (Average) Values
Design Criteria Data
 SPOKANE WA Latitude = 47.63 N WMO No. 72785 Longitude =117.5 W Elevation = 2366 feet Period of Record = 1973 to 1996 Average Pressure = 27.5 inches Hg Design Criteria Data Mean Coincident (Average) Values
Design Criteria Data
 DAYTON/JAMES M COX OH Latitude = 39.9 N WMO No. 72429 Longitude = 84.2 W Elevation = 14 feet Period of Record = 1973 to 1996 Average Pressure = 28.95 inches Hg Design Criteria Data Mean Coincident (Average)
Design Criteria Data
 LOUISVILLE/STANDIFORD KY Latitude = 38.18 N WMO No. 72423 Longitude = 85.73 W Elevation = 489 feet Period of Record = 1973 to 1996 Average Pressure = 29.49 inches Hg Design Criteria Data Mean Coincident
Design Criteria Data
 SPRINGFLD MO Latitude = 37.23 N WMO No. 7244 Longitude = 93.38 W Elevation = 127 feet Period of Record = 1973 to 1996 Average Pressure = 28.66 inches Hg Design Criteria Data Mean Coincident (Average) Values
Design Criteria Data
 BIRMINGHAM AL Latitude = 33.57 N WMO No. 72228 Longitude = 86.75 W Elevation = 63 feet Period of Record = 1973 to 1996 Average Pressure = 29.36 inches Hg Design Criteria Data Mean Coincident (Average)
Design Criteria Data
 BOSTON/LOGAN MA Latitude = 42.37 N WMO No. 7259 Longitude = 71.3 W Elevation = 3 feet Period of Record = 1967 to 1996 Average Pressure = 29.95 inches Hg Design Criteria Data Mean Coincident (Average) Values
Design Criteria Data
 MIDLAND TX Latitude = 31.95 N WMO No. 72265 Longitude =2. W Elevation = 2861 feet Period of Record = 1973 to 1996 Average Pressure = 27.3 inches Hg Design Criteria Data Mean Coincident (Average) Values
Design Criteria Data
 WASHINGTON/DULLES VA Latitude = 38.95 N WMO No. 7243 Longitude = 77.45 W Elevation = 322 feet Period of Record = 1973 to 1996 Average Pressure = 29.68 inches Hg Design Criteria Data Mean Coincident (Average)
Design Criteria Data
 NEW YORK/JOHN F KENNEDY NY Latitude = 4.65 N WMO No. 74486 Longitude = 73.78 W Elevation = 23 feet Period of Record = 1973 to 1996 Average Pressure = 29.98 inches Hg Design Criteria Data Mean Coincident
Design Criteria Data
 LANDER/HUNT WY Latitude = 42.82 N WMO No. 72576 Longitude =18.7 W Elevation = 5558 feet Period of Record = 1973 to 1996 Average Pressure = 24.44 inches Hg Design Criteria Data Mean Coincident (Average)
Design Criteria Data
 ALBUQUERQUE NM Latitude = 35.5 N WMO No. 72365 Longitude =16.6 W Elevation = 5315 feet Period of Record = 1967 to 1996 Average Pressure = 24.72 inches Hg Design Criteria Data Mean Coincident (Average)
Design Criteria Data
 MINOT AFB ND Latitude = 48.42 N WMO No. 727675 Longitude =11.3 W Elevation = 1667 feet Period of Record = 1967 to 1996 Average Pressure = 28.16 inches Hg Design Criteria Data Mean Coincident (Average)
Design Criteria Data
 CHARLESTON/KANAWHA WV Latitude = 38.37 N WMO No. 72414 Longitude = 81.6 W Elevation = 981 feet Period of Record = 1973 to 1996 Average Pressure = 29. inches Hg Design Criteria Data Mean Coincident (Average)
Design Criteria Data
 CHICAGO/O HARE IL Latitude = 41.98 N WMO No. 7253 Longitude = 87.9 W Elevation = 673 feet Period of Record = 1967 to 1996 Average Pressure = 29.27 inches Hg Design Criteria Data Mean Coincident (Average)
Design Criteria Data
 MADISON/DANE CO. RGNL WI Latitude = 43.13 N WMO No. 72641 Longitude = 89.33 W Elevation = 866 feet Period of Record = 1973 to 1996 Average Pressure = 29.5 inches Hg Design Criteria Data Mean Coincident
Design Criteria Data
 RENO/CANNON INTL NV Latitude = 39.5 N WMO No. 72488 Longitude =119.7 W Elevation = 44 feet Period of Record = 1973 to 1996 Average Pressure = 25.57 inches Hg Design Criteria Data Mean Coincident (Average)
Solardyne Corporation Renewable Home Power Design Guide Call
 Solardyne Corporation Renewable Home Power Design Guide Call 503-830-8739 Solardyne Corporation Renewable Home Power Design Guide Call 503-830-8739 1 TABLE OF CONTENTS DESIGN OVERVIEW 2 STEP 1 - YOUR LOAD
ANCR CRU Statistics February 2007 to December 2007
 ANCR CRU Statistics February 2007 to December 2007 o Jan/07 Feb/07* Mar/07 Apr/07 May/07 Jun/07 Jul/07 Aug/07 Sep/07 Oct/07 Nov/07 Dec/07 Total notes data from Perimeter phone system unavailable prior
Up and Down Months of the Stock Market
 Up and Down Months of the Stock Market 1926-2017 Positive years (66) in the stock market were not good all year long and losing years (24) were not losers throughout the year. Winning years produce losing
Local Climatological (Data Summary Molim, Illinois
 SWS Miscellaneous Publication 98-13 STATE OF ILLINOIS DEPARTMENT OF ENERGY AND NATURAL RESOURCES Local Climatological (Data Summary Molim, Illinois 1872-1992 by Audrey A. Bryan and Wayne Wendland Climatological
PRESENTATION ON STRATEGIC APPROACH TOWARDS WIND SOLAR HYBRID SYSTEMS (SWES) FOR REMOTE TELECOM SITES IN INDIA & CASE STUDY OF RAJASTHAN
 FOR REMOTE TELECOM SITES IN INDIA & CASE STUDY OF RAJASTHAN") PRESENTATION ON STRATEGIC APPROACH TOWARDS WIND SOLAR HYBRID SYSTEMS (SWES) FOR REMOTE TELECOM SITES IN INDIA & CASE STUDY OF RAJASTHAN WORKSHOP ON SMALL WIND ENERGY AND HYBRID SYSTEMS & ITS RELEVANCE
PRESENTATION ON STRATEGIC APPROACH TOWARDS WIND SOLAR HYBRID SYSTEMS (SWES) FOR REMOTE TELECOM SITES IN INDIA & CASE STUDY OF RAJASTHAN WORKSHOP ON SMALL WIND ENERGY AND HYBRID SYSTEMS & ITS RELEVANCE
EVALUATION RESULT OF THE ALERT-2 RURAL INTERSECTION CONFLICT WARNING SYSTEM
 EVALUATION RESULT OF THE ALERT-2 RURAL INTERSECTION CONFLICT WARNING SYSTEM Taek M. Kwon, Ph.D University of Minnesota Duluth Victor Lund (St. Louis County), Robert Ege, Alan Rindels (MnDOT) Outline Introduction
NJ Solar Market Update
 NJ Solar Market Update April 16, 20 Renewable Energy Committee Meeting Trenton, NJ Prepared by Charlie Garrison Solar Installed Capacity Data The preliminary installed solar capacity as of 3/31/ is approximately
Electrical Power Analysis of the Cal Poly Organic Farm for the Cal Poly SuPER Project
 Electrical Power Analysis of the Cal Poly Organic Farm for the Cal Poly SuPER Project Presentation For SARC March 21, 2008 Senior Project By Alex Liang Agenda Terminology Introduction to SuPER and This
December 2018 RenewableGenerations Monthly Report
 2018 RenewableGenerations Monthly Report Ecosystem of Clean Energy Programs Contractor Training Webinar Table of Contents Solar Electric... 3 Solar Thermal Heating (Northern Nevada Gas Customers)... 5
Company name: Created by: Phone:
 Qty. Description 1 SQF 2.5-2 Note! Product picture may differ from actual product Product No.: 95027330 The 3" SQFlex pump with helical rotor is for high heads and low flow rates. The SQFlex system is
NE (SE) Beam
 Beam") Predicted clear day beam and diffuse irradiances (/ W m 2 ) on vertical and horizontal surfaces on specified days in northern (N) and southern (S) hemispheres (see notes at foot of table): LATITUDE 60
Predicted clear day beam and diffuse irradiances (/ W m 2 ) on vertical and horizontal surfaces on specified days in northern (N) and southern (S) hemispheres (see notes at foot of table): LATITUDE 60
Sunrise: 05:48 N (S) Beam
 Beam") Predicted clear day beam and diffuse irradiances (/ W m 2 ) on vertical and horizontal surfaces on specified days in northern (N) and southern (S) hemispheres (see notes at foot of table): LATITUDE 40
Predicted clear day beam and diffuse irradiances (/ W m 2 ) on vertical and horizontal surfaces on specified days in northern (N) and southern (S) hemispheres (see notes at foot of table): LATITUDE 40
Florida s Turnpike Enterprise. Incident Management Program for All Levels & Specialty Towing & Roadside Repair (STARR)
") Florida s Turnpike Enterprise Incident Management Program for All Levels & Specialty Towing & Roadside Repair (STARR) Florida s Turnpike System Largest Toll System in Florida 460 Centerline Miles 2 Million
Florida s Turnpike Enterprise Incident Management Program for All Levels & Specialty Towing & Roadside Repair (STARR) Florida s Turnpike System Largest Toll System in Florida 460 Centerline Miles 2 Million
NJ Solar Market Update As of 6/30/15
 NJ Solar Market Update As of 6/30/ Prepared by Charlie Garrison July 17, 20 SOLAR INSTALLED CAPACITY DATA The preliminary installed solar capacity as of 6/30/ is approximately 1,500.7 MW. Approximately
Local Climatological Data Summary Aurora, Illinois
 SWS Miscellaneous Publication 98-15 STATE OF ILLINOIS DEPARTMENT OF NATURAL RESOURCES Local Climatological Data Summary Aurora, Illinois 1901-1996 Herbert Hoffman 1, Audrey A. Bryan 2 and Wayne Wendland
ISES Solar Charging Station
 ISES Solar Charging Station Ze Chen, Tyler Faulkner, Alexa Kearns, Yaqoub Molany, Thomas Penner December 11, 2013 Overview The need and goal Objectives and constraints Previous designs Decision matrices
D G A G R I D A S H B O A R D : T O M A T O E S Last update: EU AVG PRICES
 tonnes Weightedaverages by volume of production per MS Ongoing adjustments on weights by variety group 000 tonnes D G A G R I D A S H B O A R D : T O M A T O E S Last update: 20.04.2018 EU AVG PRICES MS
W (W) Beam
 Beam") Predicted clear day beam and diffuse irradiances (/ W m 2 ) on vertical and horizontal surfaces on specified days in northern (N) and southern (S) hemispheres (see notes at foot of table): LATITUDE 0 N/S
Predicted clear day beam and diffuse irradiances (/ W m 2 ) on vertical and horizontal surfaces on specified days in northern (N) and southern (S) hemispheres (see notes at foot of table): LATITUDE 0 N/S
Vunivau, Bua Province Vanua Levu, Fiji Solar Home System Design. Luis A. Vega, Ph.D.
 Vunivau, Bua Province Vanua Levu, Fiji Solar Home System Design Luis A. Vega, Ph.D. Design Approach Choose design Insolation Determine battery capacity and relationship between controller LVD and DOD Determine
MARKET RATES UPDATE Paula Gold-Williams Cory Kuchinsky
 MARKET RATES UPDATE I N T R O D U C T I O N BY: Paula Gold-Williams President & Chief Executive Officer (CEO) P R E S E N T E D BY: Cory Kuchinsky Interim Vice President, Financial Services September 24,
November 2017 Customer Switching Report for the Electricity and Gas Retail Markets
 An Coimisiún um Rialáil Fóntas Commission for Regulation of Utilities November 2017 Customer Switching Report for the Electricity and Gas Retail Markets Information Paper Reference: CRU18011 Date Published:
Your electricity bill
 Your electricity bill Bill date: February 22, 2017 Summary of what you owe Amount due on your last bill $1,271.36 Payment made on Jan 30, thank you -$1,271.36 Your balance forward $0.00 Your new charges
2012 DFW Solar Home Tour October 6, 2012 Reference Solar PV
 October 6, 2012 Reference Bill Neukranz bneukranz@verizon.net 972-516-0909 10/6/12 Bill Neukranz - 2012 1 The Basics Grid Tied, No Batteries Power grid Solar panels Electric meter AC loads DC to AC Converter
Year to Date Summary. Average and Median Sale Prices
 A Publication of RMLS, The Source for Real Estate Statistics in Your Community Residential Review: Southwest Washington September 2018 Reporting Period September Residential Highlights Southwest Washington
Renewable Energy Analysis For Afghanistan
 40 Years of Excellence in Analysis Renewable Energy Analysis For Afghanistan Approved for Public Release Distribution is unlimited David Carrier APGR-AMSA-MPE@us.army.mil 2 Agenda Purpose & Background
ANCR CRU Statistics Februa.. to December 2007
 ANCR CRU Statistics Februa.. to December 2007 Jan/07 Feb/07* Mar/07 Apr/07 May/07 Jun/07 Jul/07 Aug/07 Sep/07 Oct/07 Nov/07 Dec/07 Total notes Answered dato from Perimeter phone system unavailable prior
Measured Performance of a High-Efficiency Solar-Assisted Heat Pump Water Heater
 Measured Performance of a High-Efficiency Solar-Assisted Heat Pump Water Heater International Conference on Energy Efficiency in Domestic Appliances and Lighting September 2017 Danny Parker/Carlos Colon
Foothill Transit Battery Electric Bus Performance Results
 Foothill Transit Battery Electric Bus Performance Results Leslie Eudy Matt Jeffers EV Summit, Cocoa Beach, Florida October 18, 2016 Presentation Outline NREL overview Zero emission bus (ZEB) evaluation
Now There is a New Source of Energy Independence Your Backyard.
 Now There is a New Source of Energy Independence Your Backyard. Renewable Energy Company dedicated to providing you with affordable products and services to save money on energy over the long term. Services
November 2018 Customer Switching Report for the Electricity and Gas Retail Markets
 An Coimisiún um Rialáil Fóntas Commission for Regulation of Utilities November 2018 Customer Switching Report for the Electricity and Gas Retail Markets Information Paper Reference: CRU18266 Date Published:
Initial Project and Group Identification Document. Senior Design I EEL Off-Grid Clean Energy Power Generation
 Initial Project and Group Identification Document Senior Design I EEL 4914 Off-Grid Clean Energy Power Generation Group Pablo Pozo (Electrical Engineer) Patrick O Connor (Electrical Engineer) Cory Bianchi
Thomas Alston Director of Business and Policy Development. Presented By N. Scottsdale Rd, Suite 410 Scottsdale Arizona 85257
 Residential Solar Workshop May 7 th 2008 Thomas Alston Director of Business and Policy Development Presented By 1475 N. Scottsdale Rd, Suite 410 Scottsdale Arizona 85257 Workshop Agenda An Overview of
Graph #1. Micro-Generation Generating Units in Alberta 20
 2, Graph #1. Micro-Generation Generating Units in Alberta 2 Cumulative # of Generating Units 1,9 1,8 1,7 1,6 1,5 1,4 1,3 1,2 1,1 1, 9 8 7 6 5 4 3 2 Number of MGG Units as of 216 Mar 31 Number of Solar
Solar Electric Reliable and Pollution-Free Electricity
 Solar Electric Reliable and Pollution-Free Electricity Power Systems Engineer at General Dynamics Cara Humphrey Solar Consultant at Astrum Solar Outline Concept Plan Design Installation Picture tour Rough
ENVIRONMENTAL & ENGINEERING SERVICES DEPARTMENT
 CITY OF LONDON ENVIRONMENTAL & ENGINEERING SERVICES DEPARTMENT WASTEWATER TREATMENT OPERATIONS VAUXHALL WASTEWATER TREATMENT PLANT 2013 ANNUAL REPORT FEBRUARY 2014 Vauxhall Wastewater Treatment Plant 2013
Designing Stand Alone Systems. Overview, components and function, Elements in Design
 Designing Stand Alone Systems Overview, components and function, Elements in Design What Stand Alone System Does Loads that are Reasonable for a Stand Alone System to Power: Yes or No Dishwasher? Refrigerator
Making Electricity since December Melody Collis Facilities Engineering Assistant Manager Toyota Motor Manufacturing Canada
 Making Electricity since December 2015 Melody Collis Facilities Engineering Assistant Manager Toyota Motor Manufacturing Canada Cambridge 1 Company Culture Vision Woodstock TMMC's goal is to maintain a
OFF GRID PV POWER SYSTEMS SYSTEM DESIGN GUIDELINES FOR THE PACIFIC ISLANDS
 OFF GRID PV POWER SYSTEMS SYSTEM DESIGN GUIDELINES FOR THE PACIFIC ISLANDS OFF GRID PV POWER SYSTEMS SYSTEM DESIGN GUIDELINES FOR THE PACIFIC ISLANDS These guidelines have been developed by the Sustainable
Action Requested From AMWG
 Action Requested From AMWG NONE, These Two Presentations Are For Information Transfer Only The information is derived from a multi-year synthesis research effort related to existing data on flow, sediment-transport
Box 6504 Drayton Valley, Alberta CANADA T7A1R Engineered To Build A Cleaner World
 Box 6504 Drayton Valley, Alberta CANADA T7A1R9 1-780-514-0160 email: alterpowersolutions@gmail.com Engineered To Build A Cleaner World Wind solar hybrid off-grid power system A typical stand-alone system
Meteorology of Monteverde, Costa Rica 2005
 Meteorology of Monteverde, Costa Rica 2005 Technical Report submitted to the Monteverde Institute Andrew J. Guswa, Asst Professor, Picker Engineering Program Amy L. Rhodes, Asst Professor, Department of
WIM #37 was operational for the entire month of September Volume was computed using all monthly data.
 SEPTEMBER 2016 WIM Site Location WIM #37 is located on I-94 near Otsego in Wright county. The WIM is located only on the westbound (WB) side of I-94, meaning that all data mentioned in this report pertains
Optimal Sizing, Modeling, and Design of a Supervisory Controller of a Stand-Alone Hybrid Energy System
 Optimal Sizing, Modeling, and Design of a Supervisory Controller of a Stand-Alone Hybrid Energy System Mohamed El Badawe Faculty of Engineering and Applied Science Memorial University of Newfoundland,
SUBJECT: Russell Hill Subway Train Accident Of August 11, 1995 Due Diligence Checklist Update
 MEETING DATE: August 31, 2005 SUBJECT: Russell Hill Subway Train Accident Of August 11, 1995 Due Diligence Checklist Update RECOMMENDATION It is recommended that the Commission: i) Receive for information
Operational Opportunities to Minimize Renewables Curtailments
 Operational Opportunities to Minimize Renewables Curtailments Clyde Loutan Principal, Renewable Energy Integration July 24, 2017 2017 CAISO - Public Page 1 Agenda Background Real-time control performance
Monthly Statistics November 2011
 For Immediate Release: December 9, 211 CONTACT: Greg Hollman MLS President (52) 577-7433 Tucson Association of REALTORS Multiple Listing Service Monthly Statistics November 211 Below are some highlights
DATASHEET PLECTRE - SOLAR CELL LIGHTING COLUMN
 PLECTRE - SOLAR CELL LIGHTING COLUMN BY SUnTech energie DATA SHEET PLECTRE SUN PRODUCT DECRIPTION PLECTRE SUN is a stand-alone, self-sufficient solar cell column for professional exterior LED lighting
Glendale Water & Power Smart Grid Project
 Glendale Water & Power Smart Grid Project Key Dates in Project History Key Dates Project History On July 10, 2007, City Council directed GWP to develop a long term plan for smart meters On October 23,
Energy storage - two Canadian Case Studies ESA Annual Conference, Washington, June 4th. Alex Bettencourt Managing Director
 Energy storage - two Canadian Case Studies ESA Annual Conference, Washington, June 4th Alex Bettencourt Managing Director National Association Made Up of Entire Industry Utilities Industry Academia / R&D
NJ Solar Market Update As of 2/29/16
 NJ Solar Market Update As of 2/29/16 Prepared by Charlie Garrison March 24, 2016 SOLAR INSTALLED CAPACITY DATA The installed solar capacity as of 2/29/16 is approximately 1,644.3 MW. Approximately 20.3
Scaling Successful Mini-grid Programs: Experience of Bangladesh
 Frontier Developments in Mini-grids Scaling Successful Mini-grid Programs: Experience of Bangladesh Farzana Rahman Unit Head (Investment), Renewable Energy IDCOL, Bangladesh 6 December 2017 Abuja, Nigeria
NJ Solar Market Update As of 10/31/15
 NJ Solar Market Update As of 10/31/15 Prepared by Charlie Garrison Renewable Energy Committee Meeting November 10, 2015 SOLAR INSTALLED CAPACITY DATA The preliminary installed solar capacity as of 10/31/15
NEU Electric and Natural Gas Price Update
 $ / MWH Jan-11 May-11 Sep-11 Sep-12 Jan-13 Electric: Short-Term Outlook The NYMEX Northern Illinois Hub 12-month forward price at the end of August 2016 for the September 2016 to August 2017 period was
SOLAR (PV) - GRID/DG GREEN POWER SUPPLY FOR RURAL INDIA
 - GRID/DG GREEN POWER SUPPLY FOR RURAL INDIA") SOLAR (PV) - GRID/DG GREEN POWER SUPPLY FOR RURAL INDIA Shiva Nand SINGH 1, Arun Kumar SINGH 2 Department of Electronics Engineering 1, Department of Electrical Engineering 2 National Institute of Technology,
SOLAR (PV) - GRID/DG GREEN POWER SUPPLY FOR RURAL INDIA Shiva Nand SINGH 1, Arun Kumar SINGH 2 Department of Electronics Engineering 1, Department of Electrical Engineering 2 National Institute of Technology,
Yield Reduction Due to Shading:
 x Fronius International NA-E35L5 35 W FRONIUS IG Plus 20 V-3 2 0,0kW x Fronius International NA-E35L5 35 W FRONIUS IG Plus 20 V-3 4 0,0kW 84 x SHARP Corporation x Fronius International NA-E35L5 35 W FRONIUS
NEU Electric and Natural Gas Price Update
 Exelon s $24 Billion Energy Bill Senate Bill 2814 Short-Term Energy Price Outlook On November 15, 2016, Exelon, through its legislative supporters, introduced Senate Bill 2814, a massive 446 page document