AvH analyst presentation 25 November The Connection to the world of Sustainable Tropical Agriculture
|
|
|
- Valentine Watson
- 5 years ago
- Views:
Transcription


1 AvH analyst presentation 25 November 2016 The Connection to the world of Sustainable Tropical Agriculture
2 Summary SIPEF group Company profile Palm oil in the world SIPEF group Expansion SIPEF group Productions & prices SIPEF group Financial performance Peer review
3 SIPEF group Company yprofile The Connection to the world of Sustainable Tropical Agriculture Agriculture 1st segmentof the supply chain commodities Tropical Recent industrialised countries Sustainable Audited certifications Connection Publicly l quoted
4 SIPEF group Company yprofile The Connection to the world of Sustainable Tropical Agriculture Continuous production Continuous crops Diversified in product Palm oil : basic commodity for food (and recently energy) Rubber : cyclic business tire industry Diversified in origin Indonesia : leading producing country within Asian market PNG : export oriented with strong agronomical basics
5 SIPEF group Company yprofile
6 SIPEF group Company yprofile Indonesia
7 SIPEF group Company yprofile Papua New Guinea
8 SIPEF group Planted hectares summary 30 june 2016 Palm Rubber Tea Bananas Other Total % Group share Indonesia % PNG % Ivory coast % % % 87% 9% 3% 1% 0% 100,0% Group share
9 Summary SIPEF group Company profile Palm oil in the world SIPEF group expansion SIPEF group Productions & prices SIPEF group Financial performance Peer review


10 Palm oil in the world Population growth In the coming 40 years, mankind will have to produce more food than in the previous years put together Population growth will have a huge impact on future food demands Rising middle class is causing diet changes in developing countries Agricultural land is increasingly becoming scarcer
11 Palm oil in the world Meat consumption Meat consumption per capita is increasing worldwide due to the disposable income growth in developing countries. Kg of grains used to produce 1kg of: Beef Pork Poultry 7kg 4kg 2kg Any change in meat consumption patterns will have a major effect on the demand for meal, grain and corn. Source: Food and agriculture organization of the UN
12 Palm oil in the world Land input Available land 1, ,4 1,38 Hectares Bn 1,36 1,34 1, ,3 1,28 Decline: land desertification, salinization, erosion, road and urban expansion 1,26 1,24 1, ,
13 Palm oil in the world Land input Increased demand for meat/fat/processed foods Increased demand for biofuel Decreasing Agricultural land per capita Disposable income growth in developing countries
14 Palm oil in the world Oil and fat consumption
15 Palm oil in the world Vegetable oils Vegetable oils are oils or fats extracted from a plant. Their texture can be described as liquid, oily and fatty Most vegetable oils can either be used as cooking oil, be used for food and cosmetics or for fuel and diesel production The most common oil types include palm oil soybean oil canola The most common oil types include palm oil, soybean oil, canola (rapeseed) oil and sunflower oil


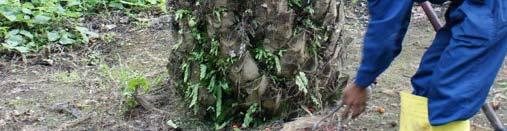


16 Palm oil in the world Oil palm plantations Oil palm plantations


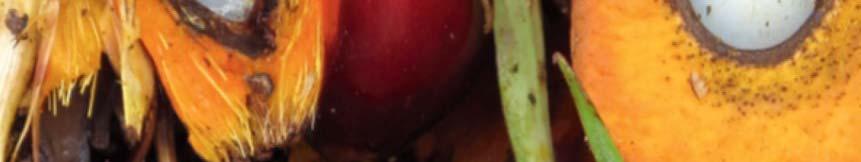


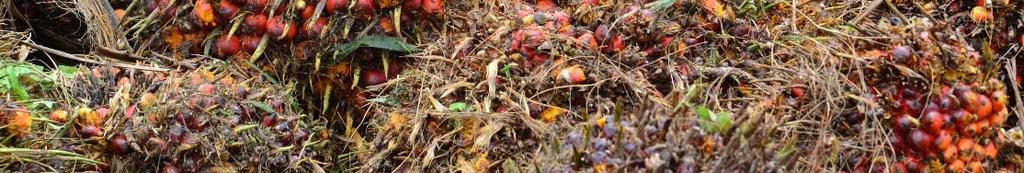
17 Palm oil in the world Fresh fruit bunches Fresh fruit bunches
18 Palm oil in the world Vegetable oils 2014/15: 201,7 million tonnes 1994/95: 93,1 million tonnes 21% 30% 16% 5% 37% 8% 21% 13% 23% 6% 9% 11% Palm oil Rapeoil Palm kernel and coconut oil Soya oil Sunflower oil Other oils/animal fats Palm oil Rape oil Palm kernel and coconut oil Soya oil Sunflower oil Other oils/animal fats Source: oilworld.de, May 2015
19 Palm oil in the world Palm oil production 2014/15 Palm oil world production Palm oil production is primarily done in Asia: 1% 6% 1% 4% 3% Indonesia and Malaysia represent 85% of the world s palm oil production 32% 53% Oceania includes our subsidiary bidi Hargy Pl Palm Oils Ltd Total Sipef production represents 0,44% of the world production. Indonesia Malaysia Thailand Africa Oceania South America Oth countries Source: oilworld.de, May 2015
20 Palm oil in the world Palm oil consumption 2014/15 World consumption Asia and the Middle east consists mainly of China, India, Indonesia, 0% 11% Malaysia and Pakistan 14% 2% 2% 6% Africa consists mainly of Nigeria, Egypt, Ghana and Kenya Very limited CPO consumption in North and South America 65% Europe Russia North America South America Asia and the middle east Africa Oceania Source: oilworld.de, May 2015
21 Palm oil in the world Advantages of Palm oil Pl Palm oil has many advantages: Highest yielding ih ildi vegetable oil crop: less than a third of the land required compared to other crops Usable in a wide range of products, from margarine and chocolate to ice cream, soaps, cosmetics and fuel India, China, Indonesia and Europe are the main consumers, while Indonesia and Ml Malaysia are the main producers > relatively close to the consumer market
22 Palm oil in the world Comparison to other oils Resources used per vegetable tbl oil:
23 Palm oil in the world Sustainable palm oil
24 Summary SIPEF group Company profile Palm oil in the world SIPEF group Expansion SIPEF group Productions & prices SIPEF group Financial performance Peer review
25 SIPEF group Strategy and expansion SIPEF group= Ha planted (group share) Focus on core business ess Palmoil Rubber Bananas Tea Indonesia Papua New Guinea Focus on Sustainable Agriculture (RSPO) Expansion of existing activities Acquisition of new investments Balanced leverage
26 SIPEF group Expansion Indonesia Beneficial interest from Ha (dec 2015) to Ha Future expansion of Ha Musi Rawas and South Sumatra expansion Further increase participation interests in existing subsidiaries Both in oil palm and rubber PNG Beneficial interest from (dec 2015) to Ha Finalize palm oil expansion with an additional 1 544Ha In area where we are operating Sale of our Ha rubber plantation in PNG Ivory Coast Beneficial interest from 672 (dec 2015) to 924 Ha Additional bananas development of 252Ha
27 SIPEF group Future expansion North Sum North Sum expansion Bengkulu Bengkulu expansion PNG PNG expansion Musi Rawas Ivory Coast Ivory Coast expansion


28 SIPEF group Umbul Mas Wisesa Toton Usaha Mandiri Development of PT Umbul Mas Wisesa and PT Toton Usaha Mandiri


29 SIPEF group Umbul Mas Wisesa Toton Usaha Mandiri Historical timeline Location Planting started (Previous owner) 1996 to 2005 Land license Jul 2006 HGU applied Feb b2008 Land acquired Nov 2011 Planting completed Dec 2011 Building started Sep 2009 Mill completed Aug 2014 HGU acquired Feb 2015 RSPO certified Mar 2015 First RSPO certification on peat soil!
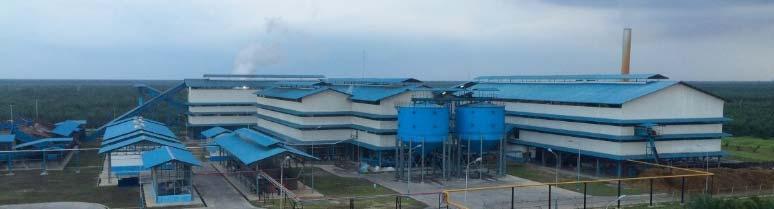
30 SIPEF group Umbul Mas Wisesa Toton Usaha Mandiri Area Statement 30 June 2016 Total invested amount Planted Ha Emplacement, roads, mill, Ha Total area Ha approx USD/ha Realised expected production/ha (in tonnes)* Mill construction finished August FFB CPO * New mill oil extraction rate is expected to be 24%


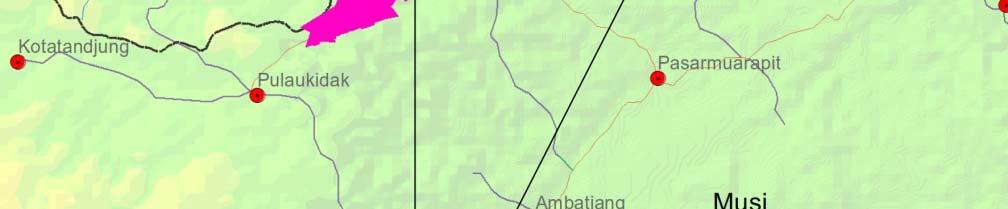

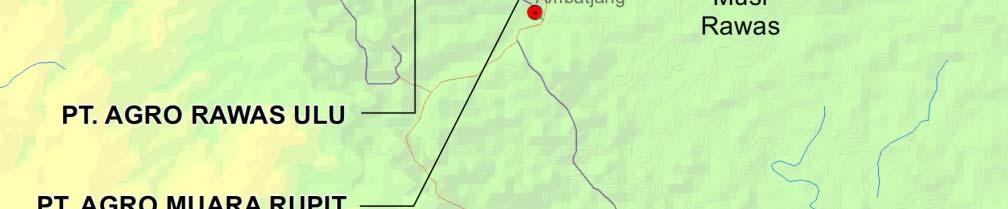

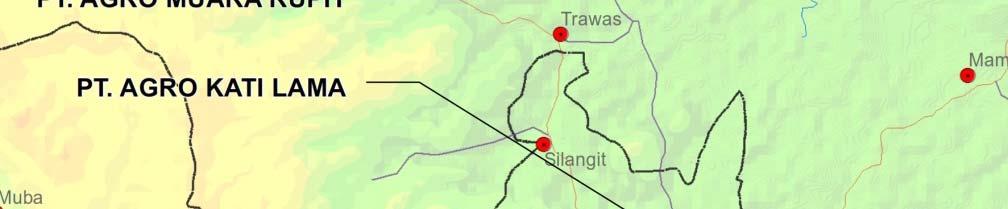
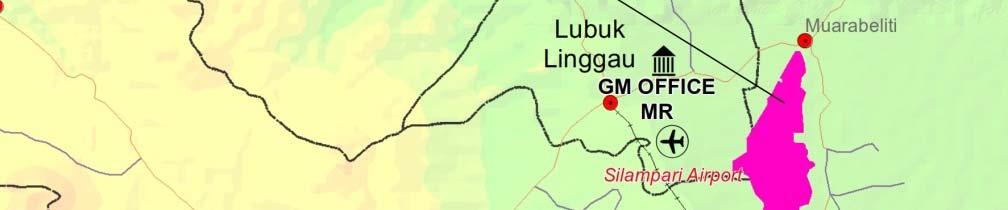
31 Musi Rawas Expansion: Area Map Sumatra
32 SIPEF group Musi Rawas progress October 2016 Description PT AKL PT ARU PT AMR TOTAL Izin lokasi Ha Izin lokasi Ha revised OWN Compensated Oct % Identified Ha % Potantial Ha % PLASMA Incorporated June % Identified Ha % Potantial Ha % TOTAL HA (at IDR/USD ) Compensation Oct/Ha USD Potential comp/ha USD Total average cost/ha USD Own planted Oct Own cleared Oct Plasma planted Total cleared/planted Oct
33 Musi Rawas progress 2016 Compensation Ha Cleared/Planted Ha Area YTD 2015 Oct/16 TOTAL YTD 2015 Oct/16 cleared TOTAL Planted/ compensated AKL % ARU % AMR % Plasma TOTAL %
34 Musi Rawas Compensated area up to October 2016 Cumulative Compensated Area (Ha). AKL ARU AMR okt 11 dec 11 feb 12 apr 12 jun 12 aug 12 okt 12 dec 12 feb 13 apr 13 jun 13 aug 13 okt 13 dec 13 feb 14 apr 14 jun 14 aug 14 okt 14 dec 14 feb 15 apr 15 jun 15 aug 15 okt 15 dec 15 feb 16 apr 16 jun 16 aug 16 okt 16 dec 16
35 Musi Rawas Planted area up to October Cumulative Planted Area (Ha) AKL ARU AMR Hectares

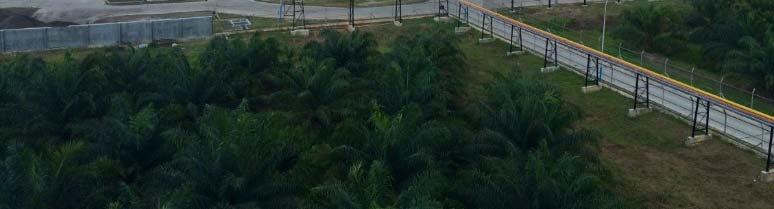
36 SIPEF group MUSI RAWAS New milestone First bunches harvested din AKL in August t2016 Loading of the first fruit
37 Summary SIPEF group Company profile Palm oil in the world SIPEF group Expansion SIPEF group Productions & prices SIPEF group Financial performance Peer review
38 SIPEF group September production In Tonnes: Sept 2016 Sept 2015 YoY% Palm oil own Tolan Tiga Group ,7% UMW/TUM Group ,4% PT Agro Muko ,6% Hargy Oil Palms ,3% Ttl Total palm oil own ,2% 02% Total palm oil outgrowers ,9% Total palm oil ,3% In Tonnes: Sept 2016 Sept 2015 YoY% Total rubber ,7% Total tea ,0% Total bananas ,2%
39 SIPEF group CPO price CIF Rotterdam USD CPO prices Jan Feb Mar Apr May Jun Jul Aug Sep Oct Nov Dec
40 SIPEF group Rubber price FOB Malaysia USD Rubber prices Jan Feb Mar Apr May Jun Jul Aug Sep Oct Nov Dec
41 SIPEF group Tea prices FOB Indonesia USD Tea prices Jan Feb Mar Apr May Jun Jul Aug Sep Oct Nov Dec
42 Summary Sipef group Company profile Palm oil in the world The El Niño phenomenon SIPEF group Productions & prices SIPEF group Financial performance Peer review
43 SIPEF group Sales Gross margin Total consolidated turnover (including corporate) June 2016: KUSD June 2015: KUSD ,9% 24,1% % ,3% 18% 9% 24% 13% Palm Rubber Tea Bananas
44 SIPEF group Gross margin per product (based on internal management reporting) Gross margin (June YTD) In KUSD 2016 in % 2015 in % Palm ,0% ,8% Rubber 41 0,1% % 2,1% Tea 335 1,1% 648 2,1% Bananas 873 2,8% ,0% Corporate ,3% ,0% Total ,0% ,0%
45 SIPEF group Profit and loss statement (based on internal management reporting) Profit and loss (June YTD) In KUSD Gross Margin Services and administration Other operating income/(charges) Financial income/charges Exchange result Result before tax Tax Insurance Result after tax Effect of the IAS 41 restatement Result after tax after IAS 41 restatement
46 SIPEF group Prospects Result 800 Given the improving production outlook for the second half of the year and the sales already achieved, we are in the meantime more positive about the 2016 recurring result, which should surpass that of last year. Palm oil prices Jan Feb Mar Apr May Jun Jul Aug Sep Oct Nov Dec
47 SIPEF group Consolidated balance sheet Balance sheet In KUSD June 2016 Dec 2015 Biological assets bearer plants Other fixed assets Net assets held for sale Net current assets, net of cash Nt Net cash position Total net assets Shareholders equity, y,group share Non controlling interest Provisions and deferred tax liabilities Total net liabilities
48 SIPEF group Historical evolution 600,00 500,00 Turnover 400,00 300,00 Equity USD In MUSD 200,00 Net financial 100,00 position USD 0,00 100,00 Result, share of the Group 200, * restatement PT Agro Muko (decrease in turnover) 2014** restatement IAS 41R (decrease in equity & result)
49 Summary Sipef group Company profile Palm oil in the world SIPEF group expansion SIPEF group Productions & prices SIPEF group Financial performance Peer review
50 Peer review Disclaimer The information contained in this section is provided for your general information only and is not designed nor intended to offer anything more than information only. The information with respect to the companies included in the Peer Review was retrieved from publicly available information being annual reports and company websites on the one hand and from analyst reports we received on the other hand. In some cases we had to give our own interpretation to the available information in order to get comparable indicators. As a consequence of using different sources combined with giving our own interpretation to the available information, the information may not always be correct and SIPEF does not accept any liability for loss and damage that may arise from relying upon this information.

51 Peer review Owned Planted Oil Palm Hectares in KHa (2015) 2014 * 2015 Var % Total ,0% Sipef 55,69 58,32 4,7% * Restated (mainly taking into account the acquisition of NBPOL by Sime Darby)
52 Peer review Age Profile : Average Age Planted Hectares (2015) Var % Average 11,7 12,1 3,6% Sipef 9,9 9,8 1,1%
53 Peer review FFB Yields MT/ha (2015) Var % Average 19,5 19,4 0,6% Sipef 22,2 22,6 1,8%
54 Peer review Extraction Rate from FFB to CPO (2015) Var % Average 22,3% 22,2% 0,4% Sipef 22,6% 22,9% 1,4%
55 Peer review CPO Yields MT/ha (2015) Var % Average 4,35 4,31 1,0% Sipef 5,01 5,17 3,2%
56 Peer review Market Cap in MUSD (July 2016) Var % Total ,7%, Sipef ,7%
57 Peer review Market Cap Evolution (Average)
58 Peer review Market Cap Evolution (Plantations)
59 Peer review Dividend Yields (Based on Average Market Cap 2015) * No dividend pay-out
60 Peer review Price Earnings Ratio (Based on Average Market Cap 2015) * Not included as irrelevant (profit close to break-even or loss for the year)
61 Peer review Net financial debt/equity Ratio (2015) * Preferential shares with fixed cumulative dividend are excluded
62
VFB happening 24 maart The Connection to the world of Sustainable Tropical Agriculture
 VFB happening 24 maart 2018 The Connection to the world of Sustainable Tropical Agriculture Summary SIPEF group Company profile SIPEF group Palm oil in the world SIPEF group Expansion SIPEF group Financial
Degroof analyst presentation February The Connection to the world of Sustainable Tropical Agriculture
 Degroof analyst presentation February 2018 The Connection to the world of Sustainable Tropical Agriculture Summary SIPEF group Company profile SIPEF group Expansion SIPEF group Productions & prices SIPEF
DISCLAIMER. Indofood Agri Resources Ltd.
 INTEGRATED PLANTATION WITH LEADING BRANDS Company Presentation Q 2008 Results 29 April 2008 DISCLAIMER This presentation was prepared solely and exclusively for the parties presently being invited for
U.S. Soybean Prices Fall as Buyers Focus Turns to South America
 United States Department of Agriculture Foreign Agricultural Service Circular Series FOP 2-10 ruary 2010 U.S. Soybean Prices Fall as Buyers Focus Turns to South America $11.00 Daily U.S. Soybean Cash Price
Soybean Oil Prices Diverge on Different Supply Situations
 United States Department of Agriculture Foreign Agricultural Service Circular Series FOP 10-09 October 2009 Soybean Oil Prices Diverge on Different Supply Situations Soybean Oil Price ($/ton) $900 $850
Growing Fuel Use Limits Exports of Soybean Oil by South America
 United States Department of Agriculture Foreign Agricultural Service Circular Series FOP 11-09 ember 2009 Growing Fuel Use Limits of Soybean Oil by South America 2006/07 Soybean Oil Distribution Soybean
Argentine Exporters Switch to Soybean Oil as Biodiesel Exports Fall
 United States Department of Agriculture Foreign Agricultural Service Circular Series FOP 08-13 Argentine Exporters Switch to Soybean Oil as Biodiesel Exports Fall Argentina s soybean oil exports have surged
Indian Soybean Meal Exports Unlikely to Recover in 2015/16
 United States Department of Agriculture Foreign Agricultural Service November 2015 Indian Soybean Meal Exports Unlikely to Recover in Though once a significant regional exporter of soybean meal, India
China s Global Peanut Export Share Declines
 United States Department of Agriculture Foreign Agricultural Service Circular Series FOP 07-13 China s Global Peanut Export Share Declines U.S. 10% Others 19% Argentina 17% U.S. 11% Others 16% Argentina
Drought in South America to Limit Soybean Exports
 United States Department of Agriculture Foreign Agricultural Service Circular Series FOP 2-09 ruary 2009 Drought in South America to Limit Soybean Exports Million Tons 16 14 12 10 8 6 4 2 Annual Change
China Soybean Imports Stagnant Despite Record Consumption as Production Rebounds
 United States Department of Agriculture Foreign Agricultural Service Circular Series FOP 9-08 tember 2008 China Soybean Stagnant Despite Record Consumption as Rebounds Million Tons 60 50 40 30 20 10 0
Soybean Trade Growth: A Story of Brazil, the United States, and China
 United States Department of Agriculture Foreign Agricultural Service October 2017 Soybean Trade Growth: A Story of Brazil, the United States, and China 12-Month Soybean Export Growth Year Ending September
Weak Real to Boost Brazil s Soybean Exports in 2016
 United States Department of Agriculture Foreign Agricultural Service October 2015 Weak Real to Boost Brazil s Soybean Exports in 2016 Brazil s exchange rate is having a significant impact on domestic and
As China s Soybean Oil Imports Fall, Production Expands
 United States Department of Agriculture Foreign Agricultural Service Circular Series FOP 10-10 October 2010 As China s Soybean Oil Fall, Expands 12 10 Million Metric Tons 8 6 4 2 0 2006/07 2007/08 China
Brazil s Soybean Oil Exports Squeezed by Rising Biodiesel Demand
 United States Department of Agriculture Foreign Agricultural Service Circular Series FOP 6-09 e 2009 Brazil s Soybean Oil Exports Squeezed by Rising Biodiesel Demand Soybean Oil Exports and Industrial
Sharp Decline in Vegetable Oil Stocks Leads to Steeply Higher Prices
 United States Department of Agriculture Foreign Agricultural Service Circular Series FOP 1-11 Sharp Decline in Vegetable Oil Leads to Steeply Higher Prices Commodity prices have been on an upward trend
Growing Soybean Oil Price Raises Oil s Contribution to Total Soybean Value
 United States Department of Agriculture Foreign Agricultural Service Circular Series FOP 10-07 October 2007 Growing Soybean Oil Price Raises Oil s Contribution to Total Soybean Value Relative Share Value:
Early-Season U.S. Soybean Meal Sales Surge
 United States Department of Agriculture Foreign Agricultural Service November 2014 Early-Season U.S. Soybean Meal Sales Surge U.S. soybean meal export commitments (accumulated exports plus outstanding
Rising Coconut Oil Prices Foreshadow Tight Supplies in 2007
 United States Department of Agriculture Foreign Agricultural Service Circular Series FOP 2-07 ruary 2007 Rising Coconut Oil Prices Foreshadow Tight Supplies in 2007 800 Coconut Oil Price: CIF Rotterdam
Palm and Soy Oil Use Expands at Expense of Other Oils
 United States Department of Agriculture Foreign Agricultural Service September 2015 Revised on September 15, 2015 Palm and Soy Oil Use Expands at Expense of Other Oils As global demand for vegetable oil
Pakistan Oilseed Processors Seize Opportunity to Crush Soybeans
 United States Department of Agriculture Foreign Agricultural Service December 2015 Pakistan Oilseed Processors Seize Opportunity to Crush Soybeans Pakistan, long an importer of soybean meal, is transitioning
ANALYST BRIEFING FOR THE FOURTH QUARTER ENDED FEBRUARY 2017
 ANALYST BRIEFING FOR THE FOURTH QUARTER ENDED 2016 22 FEBRUARY 2017 MSM Malaysia Holdings Berhad Analyst Briefing Q4 2016 22/2/2017 1 CONTENTS 01 02 03 04 05 Group Financial Highlights Performance Review
Regional Vegetable Oil Situation: Cut in Sun Oil Production, Imports Leaves North Africa & the Middle East Looking for Soy & Palm Oil to Fill Demand
 United States Department of Agriculture Foreign Agricultural Service Circular Series FOP 09-07 tember 2007 Regional Vegetable Oil Situation: Cut in Sun Oil, Leaves North Africa & the Middle East Looking
2016/17 Global Olive Oil Production Down But Prices Stabilize
 United States Department of Agriculture Foreign Agricultural Service November 2016 Global Olive Oil Down But Prices Stabilize Global Olive Oil and Stocks 4000 3500 5000 Extra Virgin Olive Oil Prices Stabilizing
Soybean and Oilseed Meal Import Prospects Higher as Severe Weather Damages EU Crops
 Million Tons Million Tons Million Tons United States Department of Agriculture Foreign Agricultural Service August 2018 Soybean and Oilseed Meal Import Prospects Higher as Severe Weather Damages EU Crops
Coconut Oil Prices Spike
 United States Department of Agriculture Foreign Agricultural Service Coconut Oil Prices Spike Coconut oil prices have surged over the past year in contrast to the general downward trend in other vegetable
Explosive Growth in Vegetable Oil Demand Exacerbates Chinese Supply Deficit, Reliance on Imports. Imports
 United States Department of Agriculture Foreign Agricultural Service Circular Series FOP 12-07 ember 2007 Million tons 35 Explosive Growth in Vegetable Oil Demand Exacerbates Chinese Supply Deficit, Reliance
ANALYST BRIEFING FOR THE THIRD QUARTER ENDED NOV 2016
 ANALYST BRIEFING FOR THE THIRD QUARTER ENDED 2016 21 NOV 2016 MSM Malaysia Holdings Berhad Analyst Briefing Q3 2016 21/11/2016 1 CONTENTS 01 02 03 04 05 Group Financial Highlights Performance Review Sugar
Devaluation Energizes Argentine Soybean Crush
 United States Department of Agriculture Foreign Agricultural Service March 2016 Devaluation Energizes Argentine Soybean Crush Argentina Quarterly Soybean Crush Volume Exchange Rate* and Constant Dollar
CHARTS AND PRICE PROJECTIONS
 CHARTS AND PRICE PROJECTIONS 18 / Charts and Price Projections: FAPRI 27 Agricultural Outlook Average Annual GDP Growth Percent Change 9 8 7 6 4 3 2 1 26-216 Canada China EU NMS EU- India Japan Latin America
Oilseeds and Products
 Oilseeds and Products Oilseeds compete with major grains for area. As a result, weather impacts soybeans, rapeseed, and sunflowerseed similarly to the grain and other crops grown in the same regions. The
Oilseeds and Products
 Oilseeds and Products Oilseeds compete with major grains for area. As a result, weather impacts soybeans, rapeseed, and sunflowerseed similarly to grain and other crops grown in the same regions. The same
CHARTS AND PRICE PROJECTIONS
 CHARTS AND PRICE PROJECTIONS 18 / Charts and Price Projections: FAPRI 28 Agricultural Outlook Average Annual GDP Growth, 27-217 Percent Change 1 8 8.4 7.92 6 4 4.44 3.67 4.6 4.34 2 2.37 2.17 1.38 2.44
282m 75% +575m. Net sales Operating income before non-recurring items. Operating margin before non-recurring items. Net Loss.
 First-Half 2009 Financial Highlights Net sales Operating income before non-recurring items Operating margin before non-recurring items Net Loss Net debt-to-equity ratio Free cash flow** 7,134m 282m 4.0%
First Resources Limited First Quarter 2017 Results Presentation 11 May 2017
 First Resources Limited First Quarter 2017 Results Presentation 11 May 2017 Delivering Growth and Returns Table of Contents Executive Summary 3 Financial Performance 4 Operational Performance 9 Growth
U.S. Soybean Exports Forecast to Reach Record
 United States Department of Agriculture Foreign Agricultural Service July 2017 U.S. Soybean Exports Forecast to Reach Record 60 Accumulated Exports by Week Total Commitments of Soybeans as of End of June
INTEGRATED PLANTATION WITH LEADING BRANDS. Company Presentation - Q Results
 INTEGRATED PLANTATION WITH LEADING BRANDS Company Presentation - Q1 2007 Results April 2007 DISCLAIMER This presentation was prepared solely and exclusively for the parties presently being invited for
FY2017 Results. February 26, 2018
 FY2017 Results February 26, 2018 Our background & development Registered capital increased to 12 MB Started International marine transportation ( Myanmar route ) Registered capital increased to 100 MB
China s Rapeseed Meal Imports Rise as Seed Imports Decline
 United States Department of Agriculture Foreign Agricultural Service February 2017 China s Rapeseed Meal Rise as Seed Decline Trend in China Rapeseed 12-Month Moving Totals Trend In China Rapeseed Meal
FY H1 Financial Results
 FY2011 1 H1 Financial Results November 8, 2010 1 Copyright(C) 2010 Isuzu Motors Limited All rights reserved Contents Ⅰ. President and Representative Director : Susumu Hosoi :FY2011 H1 Financial Summary
China 2017/18 Soybean Imports Soar on Appetite for Pork, Aquaculture, and Dairy
 United States Department of Agriculture Foreign Agricultural Service June 2017 China Soybean Soar on Appetite for Pork, Aquaculture, and Dairy China: Booming Farmed Aquaculture Production China: Record
Share of Brazil s Soybean Exports to China Spikes in August
 United States Department of Agriculture Foreign Agricultural Service September 2018 Share of Brazil s Soybean Exports to China Spikes in August Monthly Share of Brazil's Soybean Exports to China 85% 75%
FY2012. H1 Financial Results. November 8, Copyright(C) 2011 Isuzu Motors Limited All rights reserved
 2011 Isuzu Motors Limited All rights reserved") FY2012 H1 Financial Results November 8, 2011 1 Copyright(C) 2011 Isuzu Motors Limited All rights reserved Ⅰ. President and Representative Director : Susumu Hosoi :FY2012 H1 Financial Summary Outline Ⅱ.
FY2012 H1 Financial Results November 8, 2011 1 Copyright(C) 2011 Isuzu Motors Limited All rights reserved Ⅰ. President and Representative Director : Susumu Hosoi :FY2012 H1 Financial Summary Outline Ⅱ.
ASTRA AGRO LESTARI PT (AALI IJ) BHINNEKA INVESTMENT GROUP
 BHINNEKA INVESTMENT GROUP") 1-Nov-16 1-Dec-16 1-Jan-17 1-Feb-17 1-Mar-17 1-Apr-17 1-May-17 1-Jun-17 1-Jul-17 1-Aug-17 1-Sep-17 1-Oct-17 ASTRA AGRO LESTARI PT (AALI IJ) BHINNEKA INVESTMENT GROUP PT Astra Agro Lestari Tbk operates
1-Nov-16 1-Dec-16 1-Jan-17 1-Feb-17 1-Mar-17 1-Apr-17 1-May-17 1-Jun-17 1-Jul-17 1-Aug-17 1-Sep-17 1-Oct-17 ASTRA AGRO LESTARI PT (AALI IJ) BHINNEKA INVESTMENT GROUP PT Astra Agro Lestari Tbk operates
July New Britain Palm Oil Limited
 July 2009 New Britain Palm Oil Limited New Britain Palm Oil (NBPOL) New Britain Palm Oil Limited Large plantation company (over 46,000 hectares planted), producing palm oil, founded in 1967 Total land
February New Britain Palm Oil Limited
 February 2009 New Britain Palm Oil Limited New Britain Palm Oil (NBPOL) New Britain Palm Oil Limited Large plantation company (over 46,000 hectares planted), producing palm oil, founded in 1967 Total
China is Key to Slow Pace of U.S. Soybean Exports
 United States Department of Agriculture Foreign Agricultural Service January 2018 China is Key to Slow Pace of U.S. Soybean Exports U.S. and Brazil Soybean Exports by Destination (Accumulated Exports:
India Soybean Meal Exports: Revised and Rebounding
 United States Department of Agriculture Foreign Agricultural Service January 2017 India Soybean Meal Exports: Revised and Rebounding India Soybean Meal Exports Forecast to Rise in 8.0 Data Series Comparison
2Q06 Results. Investor Relations
 2Q06 Results Investor Relations Content 1. 2Q06 Key Results 2. Summarized Income Statement 3. Balance Sheet as of Jun. 2006 4. Outlook for 2006 5. Result & Outlook By Division Appendix : 2Q06 Results Breakdown
2017/18 Olive Oil Export Forecast Rises with Slight Growth in Production
 United States Department of Agriculture Foreign Agricultural Service November 2017 Olive Oil Export Forecast Rises with Slight Growth in Production Million Metric Tons 3.4 3.2 3.0 2.8 2.6 Olive Oil Prices
Drought Forecast to Reduce Australian Rapeseed Exports in 2007
 United States Department of Agriculture Foreign Agricultural Service Circular Series FOP 11-06 November 2006 Drought Forecast to Reduce Australian Rapeseed Exports in 2007 1800 1600 1400 1200 1000 800
Port Botany Trade Statistics Bulletin. 1 July May 2017
 Port Botany Trade Statistics Bulletin 1 July 2016 31 May 2017 YTD May 2017 Port Botany Container Trade Jul 2016 Aug 2016 Sep 2016 Oct 2016 Nov 2016 Dec 2016 Jan 2017 Feb 2017 Mar 2017 Apr 2017 May 2017
U.S. Soybeans Facing Stiff Competition from Brazil. Brazil Soybean Export Price (Dollars and Reals) and Exchange Rate
 and Exchange Rate") United States Department of Agriculture Foreign Agricultural Service June, 2018 U.S. Soybeans Facing Stiff Competition from Brazil Brazil Soybean Export Price (Dollars and Reals) and Exchange Rate FOB
United States Department of Agriculture Foreign Agricultural Service June, 2018 U.S. Soybeans Facing Stiff Competition from Brazil Brazil Soybean Export Price (Dollars and Reals) and Exchange Rate FOB
Palm Oil the Leader in Global Oils & Fats Supply
 Palm Oil the Leader in Global Oils & Fats Supply Presentation at the Malaysia / Myanmar Palm Oil Trade Fair & Seminar in Yangon on June, 13 there somebody to pick me up tomorrow at the airport Thomas Mielke,
FAPRI Food and Agricultural Policy Research Institute
 26 WORLD OUTLOOK Presentation Food and Agricultural Policy Research Institute Global Macroeconomic Overview Sustained and widespread real economic growth for the decade averaging 3.1%. Industrialized countries
Q3 Results November 16, 2006 Analyst Presentation
 Q3 Results 2006 November 16, 2006 Analyst Presentation Group Sales (in million Euro) Total Sales 2,395 +3.3% (+2.4%)* 2,474 Split per Business Group (YTD) Specialty Products 7% Q3 797 +1.0% (+2.5%)* 805
Bangladesh: A Growing Market for U.S. Soybeans
 United States Department of Agriculture Foreign Agricultural Service December 2017 Bangladesh: A Growing Market for U.S. Soybeans 100% 310 3 Meal Equivalent Share 90% 80% 70% 60% 50% 40% 30% 20% 10% Animal
Soybean Prices Fall on Rising South American Production
 United States Department of Agriculture Foreign Agricultural Service April 2017 Soybean Prices Fall on Rising South American Production Million Tons Change in South America Soybean Production Forecast
Global Network Investment Competition
 Global Network Investment Competition 2017-18 Bhinneka Investment Group Juli Hartawan 1606938416 Julius V Sihombing 1606851075 Teja Amanda Putra 1606938901 Teuku Fahmi Ariandar 1606851693 Yulius Kurniawan
Results for the Three Months ended June 30, 2018
 Reference Translation Results for the Three Months ended June 30, 2018 July 31, 2018 AUTOBACS SEVEN CO., LTD. FY March 2019 Consolidated P/L Profit Loss/Gain: Net sales and gross profit decreased, and
1 Copyright(C) 2012 Isuzu Motors Limited All rights reserved
 2012 Isuzu Motors Limited All rights reserved") FY2012 Financial Results May 10, 2012 1 Copyright(C) 2012 Isuzu Motors Limited All rights reserved Contents Ⅰ. President and Representative Director : Susumu Hosoi FY2012 Overview Ⅱ. Director Director
FY2012 Financial Results May 10, 2012 1 Copyright(C) 2012 Isuzu Motors Limited All rights reserved Contents Ⅰ. President and Representative Director : Susumu Hosoi FY2012 Overview Ⅱ. Director Director
CPO Supporting Fund and Its Impact On Indonesian Palm Oil Market. Fadhil Hasan Indonesian Palm Oil Association
 CPO Supporting Fund and Its Impact On Indonesian Palm Oil ket Fadhil Hasan Indonesian Palm Oil Association Background There are several reasons the government imposes the new levy imposed on CPO and its
Growing Dependence on Palm Oil in World Trade and Consumption
 Growing Dependence on Palm Oil in World Trade and Consumption Plenary Lecture at the Malaysia Russia Palm Oil Trade Fair & Seminar (POTS) there somebody in Moscow to pick on me 16 Sept up tomorrow 2013
Strong Brazilian Soybean Sales Expected to Slow Rebound in Argentine Exports
 United States Department of Agriculture Foreign Agricultural Service December 2018 Strong Brazilian Soybean Sales Expected to Slow Rebound in Argentine Exports Oct. 1 - Nov. 30 Brazil Soybean Exports (Million
KCB GROUP PLC INVESTOR PRESENTATION. Q FINANCIAL RESULTS
 KCB GROUP PLC INVESTOR PRESENTATION. Q3 2018 FINANCIAL RESULTS MACRO-ECONOMIC HIGHLIGHTS Macro-Economic Highlights: Kenya KENYA 4.9% 5.3% GDP Growth Rate (%) 5.6% 5.8% 4.9% 6.3% 6.2% KENYA 2013 2014 2015
Where next for vegetable oil prices?
 Where next for vegetable oil prices? POTS Korea 2015 David Jackson, LMC International LMC International, 2015 1 The outline of this presentation We begin by looking at how oil demand in Korea is maturing.
Contents of Paper. 06-Jan-17 SIGNIFICANCE OF COMMODITIES SECTOR TO MALAYSIAN ECONOMY, WITH EMPHASIS ON OIL PALM
 SIGNIFICANCE OF COMMODITIES SECTOR TO MALAYSIAN ECONOMY, WITH EMPHASIS ON OIL PALM Ahmad Fauzi, Puasa Deputy Director Malaysian Institute of Economic Research (MIER) 17 January 2017 Contents of Paper World
Record U.S. Peanut Exports on Strong Shipments to China and Vietnam
 United States Department of Agriculture Foreign Agricultural Service September 2016 Record U.S. Peanut Exports on Strong Shipments to China and Vietnam Thousand Metric Tons 800 700 600 500 400 300 200
Palm Oil & Derivatives - Global Market Outlook ( )
") Published on Market Research Reports Inc. (https://www.marketresearchreports.com) Home > Palm Oil & Derivatives - Global Market Outlook (2015-2022) Palm Oil & Derivatives - Global Market Outlook (2015-2022)
Published on Market Research Reports Inc. (https://www.marketresearchreports.com) Home > Palm Oil & Derivatives - Global Market Outlook (2015-2022) Palm Oil & Derivatives - Global Market Outlook (2015-2022)
Unaudited Financial Statements for the Third Quarter ( 3Q ) and Nine Months ( 9M ) Ended 30 September 2017
 and Nine Months ( 9M ) Ended 30 September 2017") BUMITAMA AGRI LTD. Unaudited Financial Statements for the Third Quarter ( 3Q ) and Nine Months ( 9M ) Ended 30 September 2017 1(a)(i) Income statement (for the group) together with a comparative statement
BUMITAMA AGRI LTD. Unaudited Financial Statements for the Third Quarter ( 3Q ) and Nine Months ( 9M ) Ended 30 September 2017 1(a)(i) Income statement (for the group) together with a comparative statement
Role of Oil Palm in Poverty Alleviation
 Role of Oil Palm in Poverty Alleviation Zulkifli Alamsyah Agribusiness Department Faculty of Agriculture University of Jambi - Indonesia zalamsyah@unja,ac,id Presented in the Twentyfirst Session of the
Commercial-in-Confidence Ashton Old Baths Financial Model - Detailed Cashflow
 Year 0 1 2 3 4 5 6 7 8 9 10 11 12 13 Oct-16 Nov-16 Dec-16 Jan-17 Feb-17 Mar-17 Apr-17 May-17 Jun-17 Jul-17 Aug-17 Sep-17 Oct-17 2,038 2,922 4,089 4,349 6,256 7,124 8,885 8,885 8,885 8,885 8,885 8,885 9,107
DSN Group H Results Update
 DSN Group H1 2018 Results Update DSN Group is a growing, green, producer of palm oil and wood products for global markets. Established in 1980, our plantation has now grown to more than 90,000 planted
FIRST RESOURCES LIMITED
 FIRST RESOURCES LIMITED 1 Disclaimer The information contained in this document has not been independently verified. No representation or warranty express or implied is made as to, and no reliance should
About Czarnikow. The Premier Provider of Sugar Market Services. Czarnikow has been in the sugar business since 1861
 About Czarnikow The Premier Provider of Sugar Market Services Czarnikow has been in the sugar business since 1861 Czarnikow is the leading professional services company in the sugar market Czarnikow has
India. Oilseeds and Products Update. February 2012
 THIS REPORT CONTAINS ASSESSMENTS OF COMMODITY AND TRADE ISSUES MADE BY STAFF AND NOT NECESSARILY STATEMENTS OF OFFICIAL U.S. GOVERNMENT POLICY Required Report - public distribution India Oilseeds and Products
Global Palm Resources Holdings Limited 1QFY2010 Results 14 June 2010
 Global Palm Resources Holdings Limited 1QFY2010 Results 14 June 2010 Important Notice This presentation (this Presentation ) has been prepared by Global Palm Resources Holdings Limited (the Company ) for
Promoting The Growth And Use Of Sustainable Palm Oil
 Fact sheets Roundtable on Sustainable Palm Oil Promoting The Growth And Use Of Sustainable Palm Oil In the Roundtable on Sustainable Palm Oil (RSPO), oil palm growers, oil processors, food companies, retailers,
Financial Results for First Quarter of FY2015
 Financial Results for First Quarter of FY2015 (From April 1, 2014 to June 30, 2014) July 29, 2014 Hino Motors, Ltd. 1. Sales Turnover 2/15 Global Unit Sales (Retail Sales) 3/15 Sales Sales decreased decreased
Port Botany. Trade Statistics Bulletin 1 July April 2018
 Port Botany Trade Statistics Bulletin 1 July 2017 30 April 2018 YTD April 2018 Port Botany Container Trade Jul 2017 Aug 2017 Sep 2017 Oct 2017 Nov 2017 Dec 2017 Jan 2018 Feb 2018 Mar 2018 Apr 2018 Export
Months Investor Presentation
 2018 9 Months Investor Presentation 25.10.2018 Disclaimer Ereğli Demir Çelik Fabrikaları T.A.Ş. (Erdemir) may, when necessary, make written or verbal announcements about forward-looking information, expectations,
FAPRI 2006 Preliminary Baseline December 15-16, 2005
 FAPRI 26 Preliminary Baseline December 15-16, 25 INTERNATIONAL OILSEEDS Tun-Hsiang (Edward) Yu 515-294-815 edyucard@iastate.edu FAPRI Food and Agricultural Policy Research Institute Center for Agricultural
RSPO. PALMEX THAILAND. 8-9 September 2011 Sustainable Palm oil and the Environment
 www.rspo.org PALMEX THAILAND 8-9 September 2011 Sustainable Palm oil and the Environment By: Salahudin Yaacob, Technical Director on behalf of Darrel Webber, Secretary General of RSPO CONTENT Palm oil
D G A G R I D A S H B O A R D : A P P L E S
 Sources: Eurostat, MSs notifications, DG Agri, Comext, Comtrade, GTA, ITC, AMI, Expert groups, Freshfel, Wapa. 000 tonnes 39 41 31 22 29 22 32 27 17 18 9 27 15 12 6 6 6 4 5 6 5 4 11 25 15 9 9 93 62 51
DEMAND SCENARIOS Palm Oil Consumption Growth Major Consuming Countries Iran s Consumption Trend
 1 By: Msuhaili MPOC DEMAND SCENARIOS Palm Oil Consumption Growth Major Consuming Countries Iran s Consumption Trend MARKET TRENDS AND DRIVERS Palm oil price discount advantage High Productivity: A Favourable
China Tariffs Driving U.S. Soybean Exports To the European Union to a 30-Year High
 United States Department of Agriculture Foreign Agricultural Service March 2019 China Tariffs Driving U.S. Soybean Exports To the European Union to a 30-Year High 12-MONTH MOVING TOTAL U.S. SOYBEAN EXPORTS
Q Analyst Teleconference. 9 August 2018
 9 August 218 Disclaimer This presentation contains forward-looking statements that reflect the Company management s current views with respect to certain future events. Although it is believed that the
Mee#ng India s current and future demand for palm oil the global and domes#c supply and demand scenario Sushil Goenka Director: 3F Industries Ltd,
 Mee#ng India s current and future demand for palm oil the global and domes#c supply and demand scenario Sushil Goenka Director: 3F Industries Ltd, India Past President: SEA, India Vegetable Oil Consump#on:
AOF Forum Oilseeds Outlook October, 2006
 AOF Forum Oilseeds Outlook October, 2006 Josh Roberts Senior Trading Manager Grain Pool Pty Ltd 30 Delhi Street West Perth Tel: +61 8 9237 9859 josh.roberts@grainpool.com.au Oilseeds trends versus other
1 Copyright(C) 2012 Isuzu Motors Limited All rights reserved
 2012 Isuzu Motors Limited All rights reserved") FY2013 H1 Financial Results November 7, 2012 1 Copyright(C) 2012 Isuzu Motors Limited All rights reserved Contents Ⅰ. President and Representative Director : Susumu Hosoi :FY2013 H1 Financial Summary Outline
FY2013 H1 Financial Results November 7, 2012 1 Copyright(C) 2012 Isuzu Motors Limited All rights reserved Contents Ⅰ. President and Representative Director : Susumu Hosoi :FY2013 H1 Financial Summary Outline
Where are palm oil prices heading?
 Where are palm oil prices heading? Grepalma Congress August 2016 2016 LMC International. All rights reserved. www.lmc.co.uk Palm oil is still tied to petroleum today. El Niño and the Chinese Strategic
Port Botany. Trade Statistics Bulletin 1 July June 2018
 Port Botany Trade Statistics Bulletin 1 July 2017 30 June 2018 FY 2017/18 Port Botany Container Trade Jul 2017 Aug 2017 Sep 2017 Oct 2017 Nov 2017 Dec 2017 Jan 2018 Feb 2018 Mar 2018 Apr 2018 May 2018
CB Industrial Product Holding Berhad Equipping Palm Oil Industries Around The World. CBIP Financial Highlights FY 2012
 CB Industrial Product Holding Berhad Equipping Palm Oil Industries Around The World CBIP Financial Highlights FY 2012 Operational Highlights Leading engineering company specializing in construction and
Mid-term Outlook for World Agricultural Markets
 Mid-term Outlook for World Agricultural Markets Jacinto Fabiosa Co-Director, (515) 294-6183 jfabiosa@iastate.edu Food and Agricultural Policy Research Institute The Question of Interest? In 27 we asked,
Operational Profile 1. Main activities as a palm oil grower Palm oil grower & miller Operations and Certification Progress 2. Total landbank available
 PT Swakarsa Sinarsentosa Particulars Organisation Name Corporate Website Address Primary Activity or Product PT Swakarsa Sinarsentosa http://www.swakarsa.com Related Company(ies) Company Primary Activity
CB Industrial Product Holding Berhad Equipping Palm Oil Industries Around The World. CBIP Financial Highlights 2Q 2012
 CB Industrial Product Holding Berhad Equipping Palm Oil Industries Around The World CBIP Financial Highlights 2Q 2012 Operational Highlights Leading engineering company specializing in construction and
Palm Oil Policy. Policy Name: Palm Oil Issue Number 008 Date of Issue: Dec 2016 Date of Approval Dec 2016 Policy Originator: Clare Hazel Page 1 of 5
 Palm Oil Policy EXTERNAL STATEMENT Summary Premier Foods is a member of the Roundtable on Sustainable Palm Oil. Our membership commits us to actively support the continuation of the Roundtable process
Dave Carroll Capital Markets Day Markets Update
 Dave Carroll Capital Markets Day 2004 Markets Update Tomkins Operates in Diverse End Markets Breakdown 2003 Sales ( 3,150m, US$4,795m) Non-Residential Construction 11% Other 9% Automotive OE 27% Residential
Global Monthly March 2019
 Global Monthly March 19 Percent of world bonds outstanding 3 5 15 5 Jan-1 Jun-1 Nov-1 Apr-15 Sep-15 Feb-1 Jul-1 Dec-1 May-17 Oct-17 Mar-1 Aug-1 Dec-1 Mar-19 March 19 Percent, year-on-year 7 5 3 1 1Q1 1Q
2017 Rp bn. Net revenue 150, , Net income* 14,184 11, Net earnings per share As at 30th September 2017 Rp bn
 31st October 2017 PT ASTRA INTERNATIONAL TBK 2017 THIRD QUARTER FINANCIAL STATEMENTS PRESS RELEASE Highlights Net earnings per share up 26 at 350 Increased market share for both cars and motorcycles Positive