SURVEY OF SEAT BELT USE IN WYOMING
|
|
|
- Andrea Smith
- 5 years ago
- Views:
Transcription


1 SURVEY OF SEAT BELT USE IN WYOMING
2 2017 WYOMING SEAT BELT SURVEY The protocols implemented for this study were per the federal guidelines set up in 2012, which distinguish it from all prior surveys of seat belt use in Wyoming. The standards and protocols align with the Uniform Criteria for State Observational Surveys of Seat Belt Use, 23 CFR Part The 2017 survey analysis was the fifth survey conducted under the 2012 guidelines for seat belt use in the state of Wyoming


3 Acknowledgments DLN Consulting, Inc. expresses appreciation to several individuals who were essential to the completion of this project. Lydia DeJesus assisted with project coordination; observer training, supervised coding, data entry, and quality assurance procedures; and developed spreadsheets, charts, and graphs. Dawn Nelson performed the coordination for the training session and subsequently aided with data compilation. Bridget White coordinated and secured the acquisition of contractors to conduct the survey observations. Bridget White and Vicky Peterson conducted field monitoring. Without the dedicated challenging work of the people who conducted the field observations, we could not complete this survey: Monty Byers, Brooke Darden, Jaclyn Davison, Peggy Dowers, Dawn Edwards, Dixie Elder, Deb Eutsler, Candy Hunter, Molly Laidlaw, Russell Loestcher, Donna Lucas, Derald Maddison, Susan Parkinson, Doug Peterson, Vicky Peterson, Cindy Pope, Kayla Schear, Daleen Sebelius, Kris Smith, and Bill Spencer. Finally, special thanks to the staff of the Wyoming Highway Safety Program and Engineering Services for their support and help during the project period. Deb Nelson, DLN President Project Administrator Keith Fernsler, PhD Project Analyst James G. Leibert, PhD Project Statistician pg. 1
4 Table of Contents Acknowledgments... 1 Executive Summary... 4 Introduction to the Survey... 6 Seat Belt Observer Training... 7 Quality Control... 8 The Overall Estimates of Belt Use... 9 Occupant Belt Use for Selected Variables Seat Belt Use Rates by County Occupant Belt Use by Population Density Occupant Belt Use by Vehicle Registration Occupant Belt Use by Roadway Types Occupant Belt Use by Occupant Gender Occupant Belt Use by Vehicle Type Occupant Belt Use by Vehicle Type and Gender Drivers and Passengers Seat Belt Use from 2012 to Appendix A: State Seat Belt Use Reporting Form Appendix B: Survey Design certification form... Appendix C: NHTSA Approval NHTSA Approval... Appendix D: Data Tables Seat Belt Use Estimates... Occupant Frequencies... Occupant Seat Belt Use... Driver Seat Belt Estimates... Passenger Seat Belt Estimates... Driver & Passenger Comparisons... Appendix E: Observer Field Test Ratings Appendix F: SBU Unknown Rate Appendix G: Reporting requirements Appendix H: SPSS Data Codes pg. 2
5 Table of Figures Figure 1: Occupant Belt Use by County, Wyoming Figure 2: Occupant Belt Use by Population Density, Wyoming Figure 3: Occupant Belt Use by State Registration, Wyoming Figure 4: Occupant Frequencies by Type of Roadway, Wyoming Figure 5: Occupant Belt Use by Type of Roadway, Wyoming Figure 6: Occupant Frequencies by Occupant Gender, Wyoming Figure 7: Occupant Belt Use by Vehicle Type, Wyoming Figure 8: Occupant Percentages by Occupant Gender and Vehicle Type Figure 9: Occupant Belt Use by Occupant Gender and Vehicle Type, Wyoming Figure 10: Frequencies by Type of Vehicle Occupant, Wyoming Figure 11: Occupant Belt Use by Driver and Passenger, Wyoming Figure 12: Belt Use by Occupant and Population, Wyoming Figure 13: Belt Use by Occupant and County, Wyoming Figure 14: Belt Use by Occupant and Vehicle Registration Figure 15: Belt Use by Occupant and Type of Roadway Figure 16: Belt Use by Occupant & Gender, Wyoming Figure 17: Belt Use by Occupant & Vehicle Type Figure 18: Belt Use by Occupant, Gender, & Vehicle Type, Wyoming Figure 19: Occupant Frequencies by Year, Wyoming Figure 20: Occupant Belted by Year, Wyoming Table 1: Frequencies by Observer... 6 Table 2: Occupant Seat Belt Use, with Standard Errors and Confidence Intervals... 9 Table 3: Driver Seat Belt Use, with Standard Errors and Confidence Intervals Table 4: Passenger Seat Belt Use, with Standard Errors and Confidence Intervals Table 5: Belt Use by Occupant & County pg. 3
6 Executive Summary Seat belt use in Wyoming during 2017 is the subject of the narrative and appendices in this report. The study was developed in accordance with the Uniform Criteria for State Observational Surveys of Seat Belt Use, 23 CFR Per the required procedures, the sample first created in 2012 reached its expiration date and required a new sampling for the 2017 data collection period. Therefore, this study represents a new baseline survey, which means that no comparisons with prior surveys or the results of those surveys are directly comparable with the 2017 estimates of seat belt use in Wyoming. The details of the procedures used to develop the new 2017 sample are in another section of this report. The narrative begins with a presentation of the estimates of seat belt use for all vehicle occupants, and separate estimates for drivers and front-seat outboard passengers. 1 The seat belt use rates are then presented within the categories of several other variables that offer more details about patterns of seat belt use. For example, the reader will find estimates by urban and rural population density, estimates for each of the counties, estimates by the roadway type, and estimates by in-state and out-of-state vehicle licenses, by vehicle type, by the gender of the vehicle occupants, and by the combination of gender and vehicle types. In the report, the measures of seat belt use are characterized as estimates rather than raw numbers. These estimates were derived from data that was weighted by the probabilities associated with the sampling methodology. In this case, the weighting process used the Complex Samples module in the Statistical Package for the Social Sciences to develop the estimates. Here is a summary of the major findings: Statewide Estimate. The overall estimate of seat belt use for all vehicle occupants was 84.8 percent belted, with a standard error of 0.1 percent. This total estimate was based on observations of 23,775 vehicle occupants. Included in the vehicle occupants were drivers, whose estimated rate of belt use was 82.7 percent, and front seat outboard passengers, whose estimated rate of belt use was 90.0 percent. Among the 23,775 vehicle occupants, there were 17,342 drivers and 6,433 passengers. The standard errors for drivers and passengers were each 0.2 percent. Urban and Rural Sites. In Wyoming, observations collected in sites with populations of 5,000 or more are considered urban; if less than 5,000, the observations are classified as rural. 2 In this year s survey, vehicle occupants observed in urban areas were belted at a rate of 72.3 percent, while occupants in rural areas were belted at a rate of 86.8 percent, a difference of 14.5 percentage points. In the sample, there were almost four times more observations from rural than urban sites, which is indicative of Wyoming s rural character. Counties. Of the seventeen Wyoming counties in the sample, seven had seat belt use estimates above the statewide average (84.8%) and ten had rates below the statewide average. Seven of those ten had estimates 1 Throughout this report, the term vehicle occupants refers to the combined driver and outboard passenger totals. 2 An exception is for sites in Teton County, which we believe to be defined as rural regardless of the actual population of those sites. pg. 4
7 below 80 percent. The county seat belt use rates for all vehicle occupants range from a low of 64.4 percent belted in Sweetwater County to a high of 93.1 percent belted in Crook County. In-State and Out-of-State. Observers noted whether vehicle occupants were in vehicles registered in Wyoming or out-of-state. Occupants in Wyoming vehicles accounted for more than half of all observations (55.7%). However, the seat belt use rate for occupants of Wyoming vehicles was 78.7 percent, while the rate for occupants in out-of-state vehicles was 90.7 percent. Roadways. The seat belt use rate for vehicle occupants observed on primary roadways was 87.9 percent; the rate on secondary roads was 83.7 percent; and the rate for vehicle occupants observed within the catch-all category of local roads, rural roads and city streets was 72.4 percent. Gender. Males accounted for more than six of every 10 vehicle occupants observed for this survey. Males had an estimated rate of 81.2 percent belted. Female vehicle occupants were outnumbered, but their seat belt usage estimate was 89.9 percent belted, which was 8.7 points higher than the male rate. Vehicle Type. The highest rates of seat belt use were for vehicle occupants in vans (90.5%) and sport utility vehicles (87.5%). The seat belt use rate was 86.8 percent for occupants in automobiles, still higher than the statewide rate (84.8%). However, the rate for combined drivers and passengers in pickup trucks was 77.6 percent belted, an estimated rate 9.2 points lower than the next lowest rate of 86.8 percent for automobile vehicle occupants. Gender and Vehicle Type. The analysis of the combination of vehicle type and gender shows higher rates of seat belt usage for females than for males in every vehicle type. The highest difference between the genders was the rate of belt use for females in pickup trucks, 86.3 percent, which was 11.6 points higher than the rate for males in pickup trucks, which was 74.7 percent. One final note before the body of this report: with few exceptions, the only detailed presentation of raw frequencies for the variables in this study are in the appendix. While many readers like to see raw frequencies to provide some context for the data analysis, such a presentation tends to be confusing when frequencies are comingled with estimates based on sample weights derived from probabilities. For that reason, most of the report will focus on estimates with a mention of frequencies only as needed for background information. pg. 5
8 Introduction to the Survey From Monday June 5, 2017 to Sunday June 11 th, 2017, seventeen trained observers were dispatched to their assigned counties. There were two alternate observers, but only one was needed in the field to collect data. There were seventeen counties in the sample, each with seventeen sites: that amounts to 289 total sites. However, some sites had no vehicle traffic, which means no seat belt use data was collected. A total of 13 of the 289 sites had no data. One site and its associated alternates could not be observed because of road closures. Per the guidelines, the assigned observer documented the site as unobservable. Observers identified 239 vehicle occupants whose seat belt use could not be determined and were coded as unsure. Dividing 239 unsure by 23,775 total vehicles produces an unknown rate of , or 1.0 percent. The list of counties, observers, the one alternate observer (Cindy Pope), and the number of observations collected by each observer are in Table 1. Table 1: Frequencies by Observer COUNTY OBSERVER FREQUENCY ALBANY Monty Byers 1,497 BIG HORN Dixie Elder 882 CAMPBELL Dee Sibelius 1,388 Cindy Pope 27 CARBON Russel Loestcher 1,276 CONVERSE Kris Smith 1,170 CROOK Derald Maddison 1,801 FREMONT Jaclyn Davison 1,559 Cindy Pope 111 JOHNSON Deb Eutsler 1,163 LARAMIE Brooke Darden 501 LINCOLN Dawn Edwards 1,310 NATRONA Molly Laidlaw 581 NIOBRARA Bill Spencer 941 PARK Donna Lucas 1,311 PLATTE Doug Peterson 1,453 SHERIDAN Susan Parkinson 1,334 SWEETWATER Kayla Schear 2,125 TETON Peggy Dowers 3,345 Total 23,775 pg. 6
9 Seat Belt Observer Training ipads were used to collect the 2017 seat belt survey, which required an ipad and survey tool training segment. The observers received basic ipad training related to the functions, features, and maintenance. All ipads were preloaded with the 2017 Seat Belt Survey data collection tool. All the observers and quality control staff received training on the individual components of the application in audio, visual, and tactile format. On day one each of the training participants practiced using the program for a period during the training session. After practicing in the classroom, the observers had an opportunity to complete a mock data collection period. On day two, the observers completed four data collection sessions. Three of the four data collection sessions were used to calculate their individual inter-accuracy ratios. pg. 7
10 Quality Control For the 2017 Wyoming Seat Belt Use Survey, observer training began in the classroom. The assembled observers were presented with survey procedures and methods, using the protocols set up for surveys of seat belt use. The DLN staff placed special emphasis on directions for parking and locations for optimal observation of seat belt use. Following the classroom training, observers took part in a series of pilot tests to assess their skills and measure the accuracy of their observations. Pairs of observers viewed the same traffic but independently recorded their observations. The staff calculated each pair s inter-accuracy ratios, which needed to show a minimum of 85 percent agreement before observers could qualify. This step exists to insure the reliability of the data before any observations are collected. A third part of the training involved written tests of each observer s knowledge of observation rules and procedures. A minimum passing grade of 80 percent was required for all the observers. The same standards applied to the alternate observers and the quality control supervisors. Once in the field, quality control monitors conducted random spot checks on the reliability of the observations for different observers. These monitors were required to attend training sessions with observers, and received additional training separate from the observers in a half-day session. That quality control monitoring session included an extensive review of the directions that applied to the monitors. During that session, the random site selections were determined for reliability spot checks where monitoring would occur. During the survey, DLN staff were always available to help observers with questions and issues. This included situations where conditions might require changes to alternate sites or other adjustments that observers might need to make to insure the quality of observations. When observers completed an electronic record of observations for each site, the observers transferred the data electronically to the DLN staff person assigned the task of compiling the data. DLN staff took steps to insure the data was accurate and contained correct codes, working with observers to resolve any issues to insure reliable data going forward. Once the data was cleaned of any errors, it was moved to Excel files and examined further for any anomalies. At that point, the Excel files were loaded into the Statistical Package for the Social Sciences, where variable and value labels were created along with other preparations for analysis. The initial SPSS files were reviewed for any additional cleaning that might be needed. At that point, the Complex Samples plan in SPSS was developed to weight the data by the sampling probabilities required to generate estimates of seat belt use. At every step, from observer training to data analysis, DLN followed standard protocols to insure the reliability and accuracy of the data utilized to compile this report. pg. 8
11 The Overall Estimates of Belt Use The estimated rate of belt use for 23,775 vehicle occupants, drivers and outboard passengers combined, was 84.8 percent belted. Observers found 14.2 percent as not belted, and they were unsure about the belt use for 1.0 percent of the vehicle occupants. The table shows the standard error rate and the 95 percent confidence intervals. 3 Table 2: Occupant Seat Belt Use, with Standard Errors and Confidence Intervals Estimate Standard Error 95% Confidence Interval Lower Upper Unweighted Count BELTED 84.8% 0.1% 84.5% 85.1% 19,574 NOT BELTED 14.2% 0.1% 14.0% 14.5% 3,962 UNSURE 1.0% 0.0% 0.9% 1.0% 239 TOTAL 100.0% 0.0% 100.0% 100.0% 23,775 In past Wyoming surveys, the estimated belt use for drivers has been lower than the overall rate, while the rate for passengers tended to be higher than the overall rate. For this new baseline survey, the results were similar. The estimated belt use for drivers was 82.7 percent, or 2.1 percentage points below the rate for all vehicle occupants. For passengers, the rate was 90.0 percent belted, or 5.2 percentage points above the overall rate. Because drivers represent 72.9 percent of all vehicle occupants, their belt use has a much greater effect on the overall rate. Passengers made up 27.1 percent of all vehicle occupants, so while they tend to inflate the overall rate, their small number does not pull the overall rate up as much as the larger number of drivers pull the rate down. 3 The very low standard error rates and the very narrow confidence intervals tell us that our estimates were statistically accurate. pg. 9
12 Table 3 and Table 4 show the overall estimates for the drivers and passengers including the standard error and 95 percent confidence intervals. Table 3: Driver Seat Belt Use, with Standard Errors and Confidence Intervals Estimate Standard Error 95% Confidence Interval Lower Upper Unweighted Count BELTED 82.7% 0.2% 82.4% 83.0% 13,940 NOT BELTED 16.4% 0.2% 16.1% 16.7% 3,236 UNSURE 0.9% 0.0% 0.8% 1.0% 176 TOTAL 100.0% 0.0% 100.0% 100.0% 17,342 Table 4: Passenger Seat Belt Use, with Standard Errors and Confidence Intervals Estimate Standard Error 95% Confidence Interval Unweighted Count Lower Upper BELTED 90.0% 0.2% 89.6% 90.4% 5,634 NOT BELTED 8.9% 0.2% 8.5% 9.3% 736 UNSURE 1.1% 0.1% 0.9% 1.2% 63 TOTAL 100.0% 0.0% 100.0% 100.0% 6,433 pg. 10
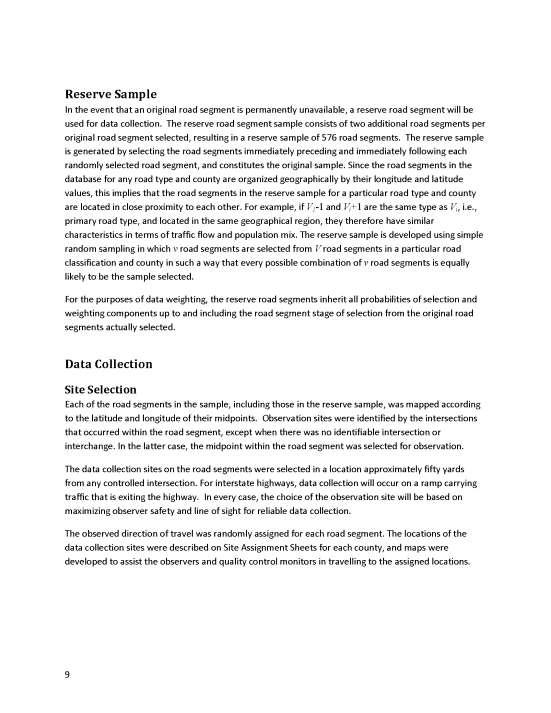
13 Occupant Belt Use for Selected Variables Seat Belt Use Rates by County Seat belt use rates were calculated for factors that were either of interest to WYDOT or were presumed to be associated with rates of seat belt use because of past surveys. Figure 1 depicts the first rates presented for each of the counties in the sample, arranged from the lowest to the highest rates. Figure 1: Occupant Belt Use by County, Wyoming 2017 S W E E T W A T E R L A R A M I E F R E M O N T P A R K P L A T T E C A M P B E L L S H E R I D A N N A T R O N A C O N V E R S E L I N C O L N T O T A L A L B A N Y B I G H O R N C A R B O N T E T O N J O H N S O N C R O O K N I O B R A R A 64.4% 71.9% 74.6% 76.0% 78.0% 78.3% 78.8% 80.2% 81.6% 84.7% 84.8% 85.6% 86.6% 86.9% 89.7% 91.9% 93.1% 94.9% There were counties in Wyoming with seat belt use rates generally more typical of states with primary laws. They include the county with the highest rate, Niobrara (94.9% belted). Other counties with such high rates included Crook (93.1%), Johnson (91.9%), and Teton County (89.7%). Some Wyoming counties had relatively low rates of belt use by vehicle occupants in this survey. They include Laramie (71.9%) and Sweetwater (64.4%). The rate for Sweetwater County, 64.4 percent, was a full 20.4 points below the overall state rate (84.8%). These rates will serve as the baseline county rates going forward to future surveys for Wyoming. However, it is important to note that smaller numbers of observations for some counties in prior surveys made the rates less stable and more subject to fluctuation across the years. In this case, the counties with the smallest number of observations include Big Horn (882), Laramie (501), Natrona (581), and Niobrara (941). In future surveys, significant changes may occur in the rates for these counties. pg. 11

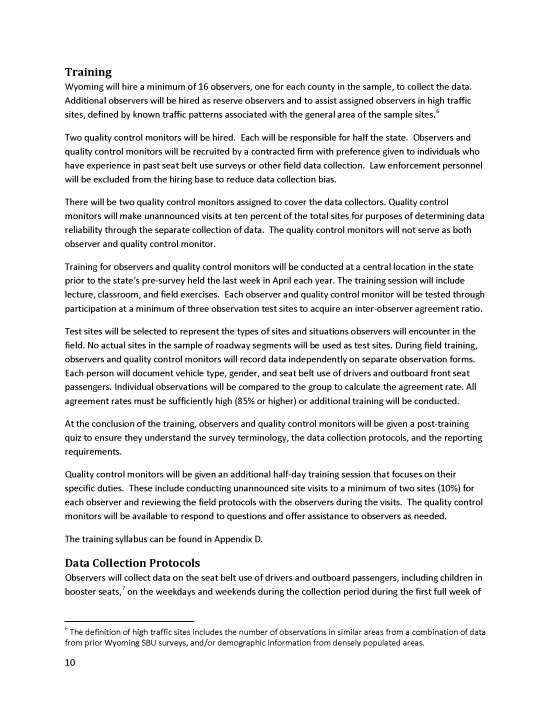
14 Occupant Belt Use by Population Density In Wyoming, sites in areas with more than 5,000 residents are defined as urban, while sites in areas with fewer than 5,000 residents are defined as rural. DLN staff consulted maps and U.S. Census data and determined the appropriate code for each site. For example, a site found within a city with a population of 5,000 or greater, was coded as urban. If the site was located outside of a city, the basis of the code became the area within the county population. Similarly, sites in cities or outside a city in a county were coded as rural when the population density was fewer than 5,000 residents. The threshold of 5,000 residents may seem less than urban to observers of densely populated states, but Wyoming is the land of wide open spaces and relatively few people. The U.S. Census Bureau estimated the 2016 Wyoming population at 585,501 people, which ranks fiftieth in population among the fifty states. The largest city in Wyoming is Cheyenne; in 2015, the U.S. Census bureau estimated Cheyenne s population as 63,335, which would be much smaller than major cities in states with larger populations. Given this context, it is not surprising that 79.0 percent of the vehicle occupants in this survey were observed in sites classified as rural, and 21.0 percent were coded as urban. In past surveys of Wyoming seat belt use, vehicle occupants in rural areas were more likely to be wearing their seat belts. That result is also true for this new baseline survey: 86.8 percent of vehicle occupants in rural sites were belted, while 72.3 percent of vehicle occupants in urban areas were observed wearing their seat belts. The urban seat belt rate was 12.5 points lower than the statewide rate for all sites, but the small percentage of observations in urban areas did not have much of an effect on the overall rate. It appears that the urban rate pulls down the state average by about 2.0 percentage points from the 86.8 percent in the rural areas to the overall rate of 84.8 percent. Figure 2 shows these results. Figure 2: Occupant Belt Use by Population Density, Wyoming % 86.8% 84.8% 80.0% 72.3% 60.0% 40.0% 20.0% 0.0% Urban Rural Total pg. 12

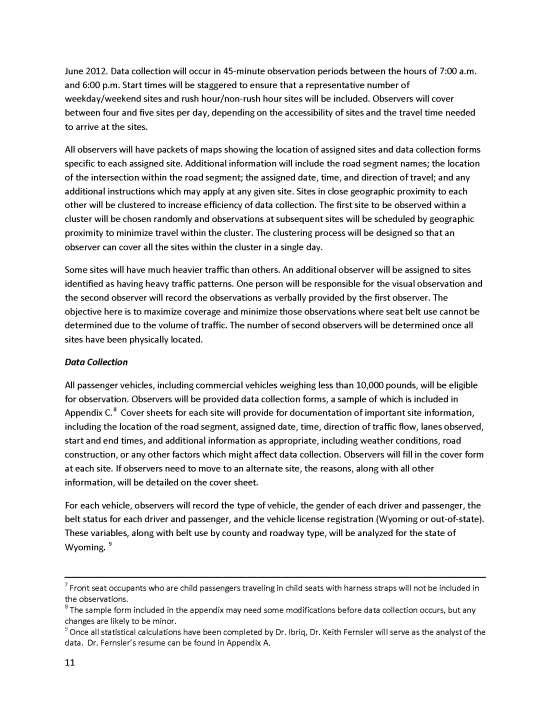
15 Occupant Belt Use by Vehicle Registration Observers noted whether the occupants were in vehicles with either Wyoming license plates or out-of-state plates. The observations were coded to show occupant belt use: belted, not belted, or unsure when the observers were not able to identify the type of license plate. The results in this survey indicated a lower rate of belt use for vehicle occupants in Wyoming-licensed vehicles. That rate was 78.7 percent belted. This compares to a rate of 90.7 percent for occupants of vehicles with out-of-state plates. The difference was 12.0 percentage points lower for occupants of Wyoming vehicles. Observers were unable to identify registration for 392 vehicle occupants, or 1.6 percent of all vehicle occupants. Figure 3 illustrates these results, showing the various rates of belt use by license registration. 4 Figure 3: Occupant Belt Use by State Registration, Wyoming % 80.0% 78.7% 90.7% 81.2% 84.8% 60.0% 40.0% 20.0% 0.0% Wyoming License Out-of-State License Unsure Total 4 Throughout the report the data presented is depicted in table or chart format. For the purposes of analysis, the data shown represents the belted percentages. The detailed tables for each of the observed categories are included in the appendices to this report. The appendix will also have all the frequencies for the variables in this survey. pg. 13


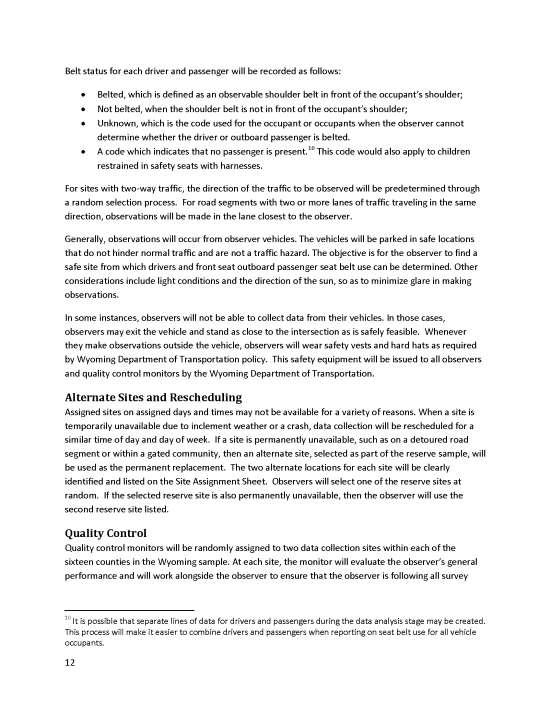
16 Occupant Belt Use by Roadway Types Site descriptions from NHTSA included a description of the roadway types. The assigned codes were S1100, S1200, and S1400. Roads coded as S1100 are generally federally or state-maintained primary roads, and include the interstate highways that run through Wyoming. These were likely to be the four-lane roadways in our sample. The data collected revealed that 97.2 percent of the S1100 observations occurred when observers were entering data for vehicles across two lanes of traffic, showing that those observations were collected on four-lane highways. Overall, the data shows that 29.2 percent of the collected observations came from these primary roads. Roads coded as S1200 were likely to be a mixture of two- and four-lane roads. The data showed that 58.6 percent of the observations in this category were from one-lane traffic, while 41.3 percent came from observations of two-lane traffic (or four-lane roadways). Overall, the data revealed that 67.0 percent of the observations in this survey came from these secondary roadways. The S1400 classification was for a mixture of local, rural, and city roadways. While all the observations in this survey were collected on paved roadways, these S1400 roads were likely to have the least amount of traffic. The data showed that only 3.8 percent of the observations in our sample came from this category. However, the sites within this roadway type were almost equally distributed among two- and four-lane roadways. We found that 53.7 percent of the 896 observations collected on these S1400 roadways involved observations of one-lane traffic, 46.3 percent were collected across two-lanes (four-lane roads). Figure 4 shows that the data in this 2017 survey of Wyoming seems to follow this pattern. Figure 4: Occupant Frequencies by Type of Roadway, Wyoming 2017 S Loc/Rural/City, 3.8% S Primary, 29.2% S Secondary, 67.0% pg. 14
17 The highest rate of seat belt use was for occupants observed in vehicles on primary roads; that rate was 87.9 percent belted. The largest number of observations was from vehicles within secondary roadways, and those vehicle occupants were belted at a rate of 83.7 percent. The lowest rate of belt use was for occupants observed in vehicles on local roads, city roads, and rural roads, at 72.4 percent belted. Figure 5: Occupant Belt Use by Type of Roadway, Wyoming % 87.9% 83.7% 84.8% 80.0% 72.4% 60.0% 40.0% 20.0% 0.0% S1100 Primary Road S1200 Secondary Road S1400 Local/Rural/City Total Prior surveys in Wyoming and elsewhere have typically found the highest rates of seat belt use on interstate-primary roads, perhaps because higher speeds and more traffic encourage a higher perception of risk and greater seat belt use to diminish the risk. Secondary roads may often share some of the characteristics of primary roads and show similar rates of seat belt use. The lowest rates often come from the least-traveled roads, or the roads with the lowest level of perceived risks from traffic. These were likely to be those local roads, rural roads, and city streets. pg. 15


18 Occupant Belt Use by Occupant Gender The results for the 2017 seat belt use survey in Wyoming show females belted at a rate of 89.9 percent and males belted at a rate of 81.2 percent, a difference of 8.7 points. The lower male rate tends to depress the overall rate because males made up 58.7 percent of all vehicle occupants. Females were 41.3 percent of the vehicle occupants, so their higher rate of seat belt use has less effect on the overall rate. Figure 6 illustrates this result. Figure 6: Occupant Frequencies by Occupant Gender, Wyoming 2017 Female, 41.3% Male, 58.7% pg. 16

19 Occupant Belt Use by Vehicle Type Drivers and passengers, the occupants in our survey, were more likely to be observed in pickup trucks than any other type of vehicle. For Wyoming 2017, 36.4 percent of vehicle occupants were observed in pickup trucks. Next highest type of vehicle was vans, which carried 32.0 percent of vehicle occupants. Pickups and vans together comprised 68.4 percent of the vehicles in which occupants were observed. The dominance of pickups and vans may be peculiar to Wyoming, perhaps reflecting residents preferences for vehicles connected to work and rugged conditions. Automobiles have declined in popularity in Wyoming; 24.6 percent of vehicle occupants were observed in automobiles in this 2017 survey. The fewest number of occupants were observed in sport utility vehicles (SUVs), with a frequency of 7.0 percent of the total occupants. The dominance of the pickup truck is important because the lowest seat belt use has typically been found for occupants observed in pickup trucks. This is also true for this survey. The seat belt use rate for occupants in pickup trucks was 77.6 percent, a rate that was 7.2 percentage points lower than the overall rate of 84.8 percent. It appears that the higher frequency of occupants and the lower rate of belt use in pickup trucks tends to pull the overall rate down. The rates for occupants in each of the other vehicle types was higher: 86.8 percent in automobiles, 90.5 percent in vans, and 87.5 percent in SUVs. Figure 7 demonstrates the results for these variables. Figure 7: Occupant Belt Use by Vehicle Type, Wyoming % 80.0% 86.8% 90.5% 87.5% 77.6% 84.8% 60.0% 40.0% 20.0% 0.0% Automobile Van Sport Utility Vehicle Pickup Truck Total pg. 17

20 Occupant Belt Use by Vehicle Type and Gender As previously noted in this report, male vehicle occupants outnumber females, 58.7 percent to 41.3 percent. It was also noted that females had higher rates of seat belt use. This section continues to explore those factors by examining gender differences in seat belt use across the different types of vehicles. There were differences between males and females in terms of the types of vehicles. Figure 8 shows these distinctions. Figure 8: Occupant Percentages by Occupant Gender and Vehicle Type 100.0% 80.0% Male Female 75.9% 60.0% 50.8% 49.2% 45.8% 54.2% 56.3% 43.7% 40.0% 24.1% 20.0% 0.0% Automobile Van SUV Pickup Truck The chart shows that females were the larger percentage of vehicle occupants only in vans (54.2% female), while males had slightly higher representation in automobiles (50.8%) and an even higher percentage in SUVs (56.3%). The greatest gender difference was found in pickup trucks: males constituted 75.9 percent of pickup truck occupants in the 2017 seat belt use survey in Wyoming. pg. 18
21 These differences by gender are important because of the ways in which belt use varies by gender and vehicle type. As identified in the previous section, females had a higher overall rate of seat belt use, 89.9 percent compared to a rate of 81.2 percent for males. The following chart shows that the rate of seat belt use was greater for females in every type of vehicle. Figure 9: Occupant Belt Use by Occupant Gender and Vehicle Type, Wyoming 2017 Male Female 100.0% 80.0% 60.0% 40.0% 20.0% 0.0% Automobile Van SUV Pickup Truck Total Male 84.4% 88.8% 84.3% 74.7% 81.2% Female 89.2% 92.0% 91.6% 86.3% 89.9% The most significant difference in the graph was for occupants in pickup trucks. Males in pickups had a seat belt use rate of 74.7 percent, and the female rate was 86.3 percent, a difference of 11.6 percentage points. The rates for males are typically similar until they enter a pickup truck, and then their rate falls dramatically. It falls from an overall 81.2 percent rate for males in all vehicle types to 74.7 percent in pickups, a drop of 6.5 percentage points. The rate was lower for females in pickups, but the decline was from an overall rate of 89.9 percent to 86.3 percent, a drop of 3.6 percentage points, nearly half of the decline for males. This pickup truck effect seems to occur for both males and females, but not as much for females. Seat belt use by females was more consistent across vehicle types. pg. 19
22 Drivers and Passengers For the seat belt survey, observations of seat belt use were collected for drivers and front seat outboard passengers, who together made up all the observed vehicle occupants. The data did not include seat belt use for middle front seat or back seat passengers. The frequencies for the 2017 Wyoming drivers and passengers are illustrated by the following chart. Figure 10: Frequencies by Type of Vehicle Occupant, Wyoming ,000 18,000 16,000 14,000 12,000 10,000 8,000 6,000 4,000 2,000 0 Drivers Passengers Frequency 17,342 6,433 Percent 72.9% 27.1% 80.0% 70.0% 60.0% 50.0% 40.0% 30.0% 20.0% 10.0% 0.0% Frequency Percent Drivers made up 72.9 percent of all the vehicle occupants; passengers were 27.1 percent. Although there may be other passengers in some vehicles -- for example, children in the back seat it was likely that 72.9 percent of vehicles had only a driver. pg. 20
23 It was noted previously in this report that drivers tend to have a lower rate of seat belt use than passengers. This is true for the Wyoming 2017 seat belt use survey, as shown by the following chart. The weighted estimates were 82.7 percent belted for drivers and 90.0 percent belted for passengers, a difference of 7.3 percentage points. 5 This relationship tends to carry over within all the other major variables examined in this report. The following discussion provides highlights for each of these other variables found when driver and passenger rates were examined for 2017 in Wyoming, with accompanying charts to illustrate the differences. Figure 11: Occupant Belt Use by Driver and Passenger, Wyoming % 80.0% 82.7% 90.0% 84.8% 60.0% 40.0% 20.0% 0.0% Drivers Passengers Total 5 Throughout this section, the calculations used to find the differences in seat belt use were done by subtracting the rate for drivers from the rate for passengers. This approach made most of the differences a positive number. While the percentage differences were not presented in the narrative, they will appear for reference in the appendix. pg. 21
24 Population Density. Passengers had a higher rate of seat belt use in both urban and rural areas. As reported previously the vehicle occupants were more likely belted in rural areas than urban areas. The data also shows passengers with higher rates of seat belt use in urban areas, 6.9 points higher for passengers, and in rural areas, where passengers were 6.6 percentage points more likely to be belted. Figure 12: Belt Use by Occupant and Population, Wyoming % 80.0% 77.8% 70.9% Drivers Passengers 91.4% 90.0% 84.8% 82.7% 60.0% 40.0% 20.0% 0.0% Urban Rural Total pg. 22
 were small. The higher rates of seat belt use for passengers were particularly significant for Albany (13.3 %), Converse (10.7 %), Laramie (12.")

25 Counties. Passengers had higher rates of seat belt use in fifteen of the seventeen counties. Only Natrona and Sweetwater had drivers with a higher rate of belt use, and those differences (-2.9 percent in Natrona and -0.4 points in Sweetwater) were small. The higher rates of seat belt use for passengers were particularly significant for Albany (13.3 %), Converse (10.7 %), Laramie (12.1 %) and Sheridan (12.8%). Figure 13: Belt Use by Occupant and County, Wyoming 2017 Drivers Passengers 120.0% 100.0% 80.0% 60.0% 40.0% 20.0% 0.0% Table 5: Belt Use by Occupant & County County Drivers Passengers Differences ALBANY 81.9% 95.2% 13.3% BIG HORN 84.5% 92.0% 7.5% CAMPBELL 76.9% 83.3% 6.4% CARBON 85.6% 89.8% 4.2% CONVERSE 80.3% 91.0% 10.7% CROOK 91.6% 96.1% 4.5% FREMONT 73.6% 77.2% 3.6% JOHNSON 91.1% 94.0% 2.9% LARAMIE 69.1% 81.2% 12.1% LINCOLN 83.3% 88.4% 5.1% NATRONA 80.7% 77.8% -2.9% NIOBRARA 94.5% 95.7% 1.2% PARK 74.3% 81.6% 7.3% PLATTE 75.9% 83.3% 7.4% SHERIDAN 76.4% 89.2% 12.8% SWEETWATER 64.5% 64.1% -0.4% TETON 87.2% 94.4% 7.2% TOTAL 82.7% 90.0% 7.3% pg. 23

26 License. Passengers had higher estimates of seat belt use than drivers for both Wyoming and out-of-state vehicles. The difference was a passenger rate 6.5 points higher for passengers in Wyoming vehicles and 4.6 points higher for passengers in out-of-state vehicles. Figure 14: Belt Use by Occupant and Vehicle Registration Drivers Passengers 100.0% 80.0% 83.8% 77.3% 89.0% 93.6% 85.6% 79.3% 90.0% 82.7% 60.0% 40.0% 20.0% 0.0% Wyoming License Out-of-State License Unsure Total pg. 24
27 Roadway. Passenger seat belt estimates were higher than driver estimates across all three types of roadways. Passengers were belted at a rate 5.6 points higher on primary roads, 8.0 points higher on secondary roads, and 6.4 points higher on the composite local-rural-and city roadways. Figure 15: Belt Use by Occupant and Type of Roadway 100.0% 80.0% 86.4% 92.0% 89.4% 81.4% Drivers Passengers 77.5% 71.1% 82.7% 90.0% 60.0% 40.0% 20.0% 0.0% S1100 Primary Road S1200 Secondary Road S1400 Local/Rural/City Total pg. 25

28 Gender. Both male and female passengers had higher rates of seat belt use than their driver counterparts. The passenger rates were 2.0 points higher for males and 5.6 points higher for females. Figure 16: Belt Use by Occupant & Gender, Wyoming 2017 Drivers Passengers 100.0% 80.0% 80.9% 82.9% 92.7% 87.1% 90.0% 82.7% 60.0% 40.0% 20.0% 0.0% Male Female Total pg. 26

29 Vehicle Type. Passengers had higher rates of seat belt use in every type of vehicle, as illustrated by the following chart. The most notable rate difference was found in pickup trucks: passengers had a belt use rate of 84.3 percent while the comparable rate for drivers was 75.3 percent, a difference of 9.0 points. This difference appears to be a product of a higher rate of belt use for female passengers in pickup trucks, as illustrated by the next chart. Figure 17: Belt Use by Occupant & Vehicle Type 100.0% 80.0% 84.8% 91.5% 93.7% 89.0% 90.6% 85.9% 75.3% 84.3% 82.7% 90.0% 60.0% 40.0% 20.0% 0.0% Automobile Van Sport Utility Vehicle Pickup Truck Total pg. 27
30 Male Female Vehicle Type and Gender. This gender-vehicle type relationship is more complex than rate comparisons for other variables. As the accompanying chart indicates, belt use for males across the different vehicle types was relatively small. In fact, male passengers were only slightly less likely to be belted than male passengers in SUVs and pickup trucks. Overall, male passengers were only 2.0 percentage points more likely to be belted, a difference that occurs primarily in automobiles. On the other hand, female passengers were more likely than female drivers to be belted in every type of vehicle, especially in pickup trucks, where the difference was 9.5 percentage points. Overall, female passengers were more likely to be belted, at 92.7 percent, than female drivers, at 87.1 percent, a difference of 5.6 points. However, it should be noted that females, both drivers and passengers, had rates of belt use higher than the statewide average for all vehicle occupants (84.8%) in every type of vehicle. Figure 18: Belt Use by Occupant, Gender, & Vehicle Type, Wyoming 2017 Total Pickup Truck Sport Utility Vehicle Van Automobile Total Pickup Truck Sport Utility Vehicle Van Automobile 92.7% 87.1% 89.6% 80.1% 93.4% 89.2% 94.8% 89.6% 92.7% 86.4% 82.9% 80.9% 74.3% 74.7% 82.9% 84.5% 90.0% 88.6% 87.7% 83.8% 0.0% 20.0% 40.0% 60.0% 80.0% 100.0% Passenger Driver This comparative examination of seat belt rates for drivers and passengers shows that passengers typically had higher rates of seat belt use than drivers in nearly every instance. The only exceptions to the pattern occurred in a couple of counties and for males in SUVs and pickup trucks. pg. 28
31 Seat Belt Use from 2012 to 2017 The year 2012 marked a new baseline survey of seat belt use for Wyoming. A new sample was drawn under new guidelines found in the Uniform Criteria for State Observational Surveys of Seat Belt Use. As is true with new baseline surveys, especially as associated with a new universe of counties and sites, the results for a baseline year cannot be compared directly with any other annual surveys. A real comparison cannot occur because any trends in belt use may be due to changes in samples rather than real changes in belt use. With that caveat in mind, trends are offered here, but only for informational purposes. Readers should be very cautious about reaching any conclusions. The main thing to notice about the trends is the similarly across the years from 2012 to For example, the following chart presents the total observations of vehicle occupants. The range of frequencies was from 18,703 in 2012 to 24,893 in 2016, with most frequencies closest to the overall six-year average of 22,776 vehicle occupants. The new baseline frequency for 2017 was not far off, at 23,775 vehicle occupants. Figure 19: Occupant Frequencies by Year, Wyoming ,000 20,000 15,000 10,000 5, Frequencies 18,703 20,877 23,723 24,682 24,893 23,775 pg. 29
32 The estimates of seat belt use across the years is another matter. The new 2017 baseline of 84.8 percent belted is the highest estimate for the last six years, and it is greater than the highest rate for the five years attached to the 2012 baseline (81.9 percent in 2013) by 2.9 percentage points. The accompanying chart below illustrates these results. Figure 20: Occupant Belted by Year, Wyoming % 90.0% 80.0% 70.0% 60.0% 50.0% 40.0% 30.0% 20.0% 10.0% 0.0% Percent Belted 77.0% 81.9% 79.2% 79.8% 80.5% 84.8% The 2012 baseline rate is the lowest rate across the five-year life of the previous set of surveys. What the rates would be in Wyoming over the next five years was unknown in However, it is known that the 2017 baseline rate is 84.8 percent and the results over the next five years should be open to comparison. The remainder of this report primarily consists of SPSS or Excel data tables that were produced for the report. The following appendices provide the data that is known about the 2017 Wyoming survey of seat belt use. The data tables are the same as those used by the author of this report and serve as a reference for readers. pg. 30
33 APPENDIX pg. 31
34 Appendix A: State Seat Belt Use Reporting Form state seat belt use reporting form pg. 32
35
36 5820 York Ave. S. Edina, MN Phone James G. Leibert, PhD. Summary Creative problem solver with knowledge of and experience in a broad array of statistical and computational tools and techniques. I understand that there is no one tool or technique that can be used for every situation. I can quickly see connections and use tools and techniques from other fields as appropriate. Employment Research Scientist III, Minnesota Department of Human Services, Disability Services Division, St. Paul, MN. Current Chair, Dept. of Political Science and Public Administration / Director of the Master of Public Administration Program / Dean of Graduate and Undergraduate Studies, Kazakhstan Institute of Management, Economics, and Strategic Research (KIMEP), Almaty, Republic of Kazakhstan, Associate Professor ( ) / International Programs Coordinator ( ) Chairman of the Department of Social Sciences ( ) \ Assistant Professor ( ), Dickinson State University Dickinson, ND, Leadership Team Player Problem Solving
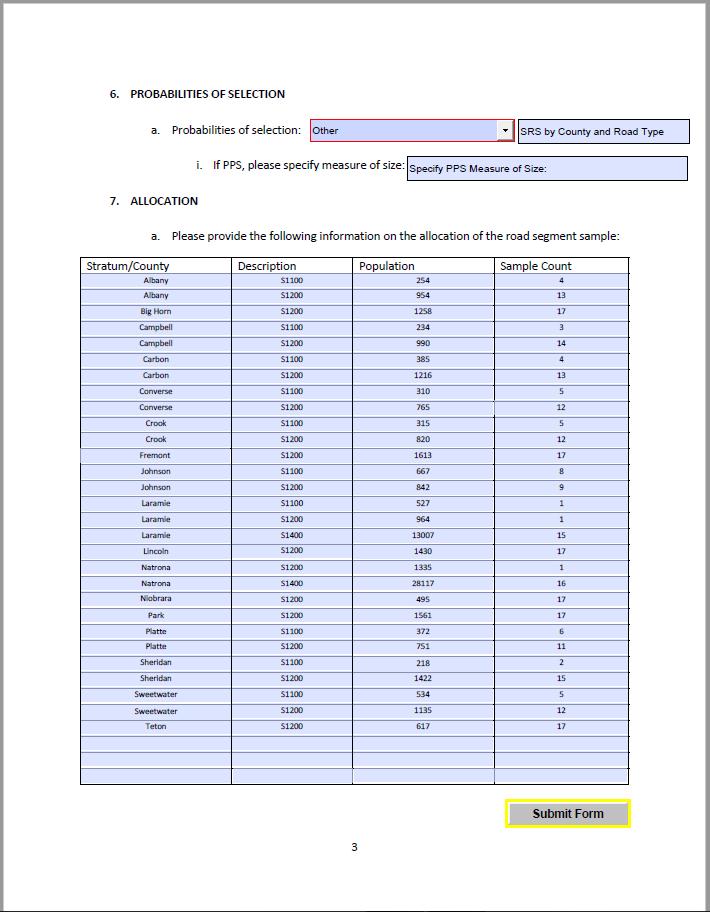
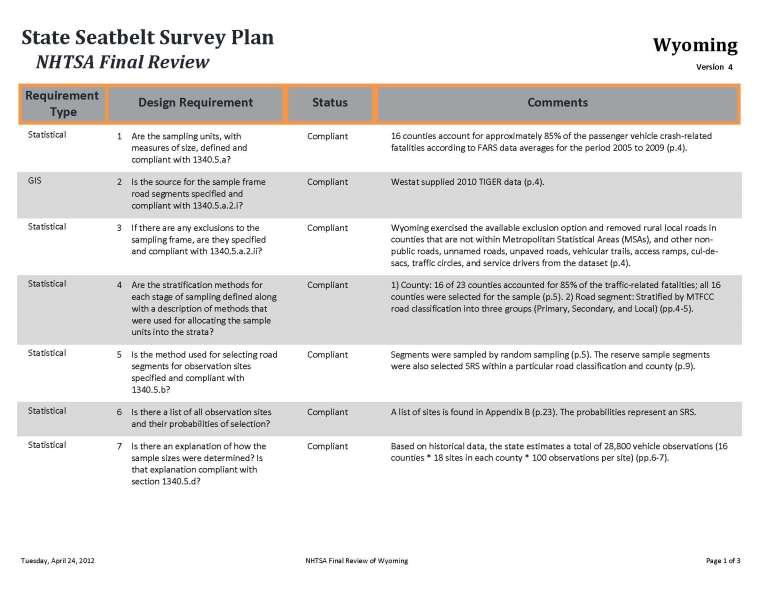
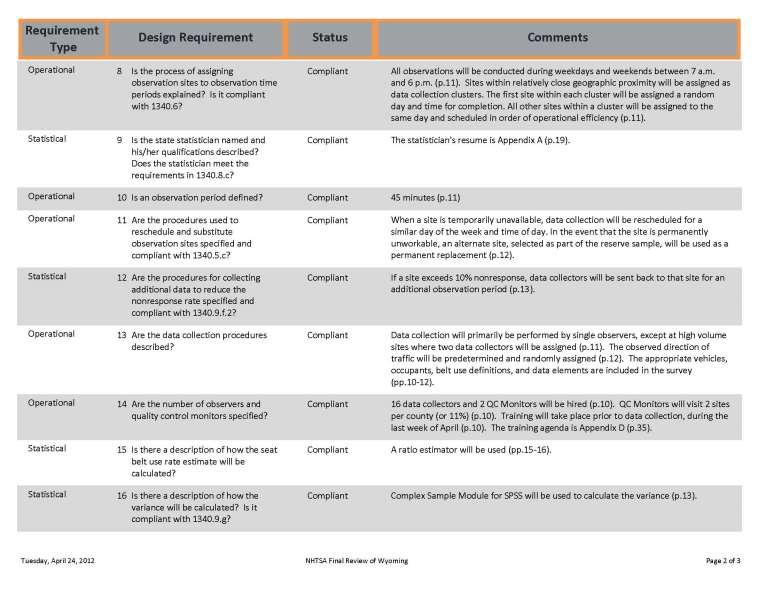
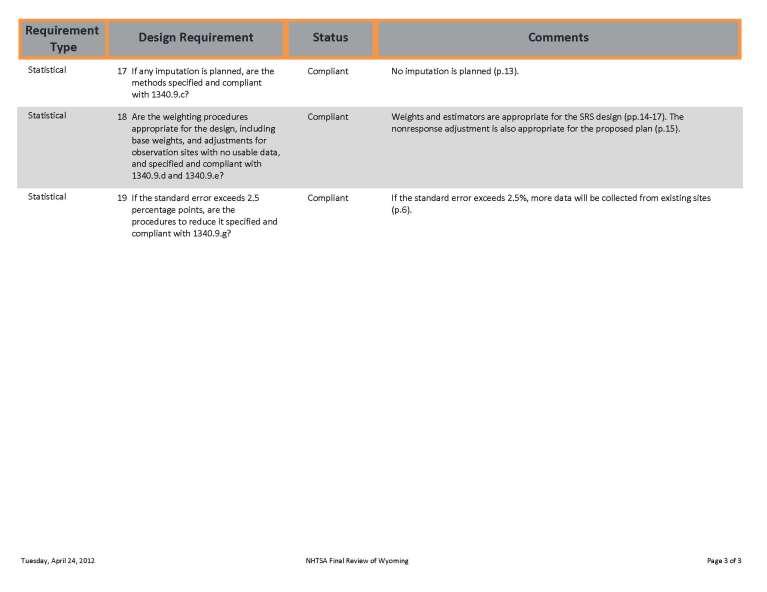
37 Appendix B: Survey Design Wyoming survey design The Wyoming Department of Transportation Highway Safety Program in collaboration with DLN Consulting, Inc. designed the following sampling, data collection, and estimation plan. The National Highway Traffic Safety Administration accepted and approved the plan on April 24, A copy of the approval notification can be found in Appendix C. pg. 33
38
39
40
41
42
43
44
45
46
47
48
49
50
51
52
53
54
55
56
57
58
59
60
61
62
63
64
65
66
67
68
69
70
71
72
73
74 2017 certification form Uniform Criteria for State Observational Surveys of Seat Belt Use Per the required procedures, the sample first created in 2012 reached its expiration date and necessitated a new sampling. What follows is the certification form submitted for NHTSA approval.
75
76
77
78 Appendix C: NHTSA Approval NHTSA approval and final review pg. 34
79
80
81
82 2017 NHTSA Approval
83 Appendix D: Data Tables Detailed table of collected data pg. 35
84 Seat Belt Use Estimates Occupant Belt Use Estimate Standard Error 95% Confidence Interval Lower Upper Belted 84.8% 0.1% 84.5% 85.1% % of Total Not Belted 14.2% 0.1% 14.0% 14.5% Unsure 1.0% 0.0% 0.9% 1.0% Total 100.0% 0.0% 100.0% 100.0% Driver Seat Belt Use Standard Error 95% Confidence Interval Unweighted Count Lower Upper 0.2% 82.4% 83.0% % 16.1% 16.7% % 0.8% 1.0% % 100.0% 100.0% Passenger Seat Belt Use Estimate Standard Error 95% Confidence Interval Unweighted Count Lower Upper % 0.2% 89.6% 90.4% 5634 % of Total 2 8.9% 0.2% 8.5% 9.3% % 0.1% 0.9% 1.2% 63 Total 100.0% 0.0% 100.0% 100.0% 6433
85 Occupant Frequencies County Frequency Percent Valid Percent Cumulative Percent Albany Big Horn Campbell Carbon Converse Crook Fremont Johnson Valid Laramie Lincoln Natrona Niobrara Park Platte Sheridan Sweetwater Teton Total Population Frequency Percent Valid Percent Cumulative Percent Urban Valid Rural Total
86 Day Frequency Percent Valid Percent Cumulative Percent Sunday Monday Tuesday Valid Wednesday Thursday Friday Saturday Total Weekday and Weekend Frequency Percent Valid Percent Cumulative Percent Weekend Valid Weekday Total Roadway Type Frequency Percent Valid Percent Cumulative Percent S1100 Primary Road Valid S1200 Secondary Road S1400 Local/Rural/City St Total
87 Occupant Gender Frequency Percent Valid Percent Cumulative Percent Male Valid Female Total Occupant Belt Use Frequency Percent Valid Percent Cumulative Percent Belted Valid Not Belted Unsure Total Vehicle Type Frequency Percent Valid Percent Cumulative Percent Automobile Van Valid Sport Utility Vehicle Pickup Truck Total State Registration Frequency Percent Valid Percent Cumulative Percent Wyoming License Valid Out-of-State License Unsure Total
88 Occupant Seat Belt Use County * Occupant Belt Use County Occupant Belt Use Albany Big Horn Campbell Carbon Converse Crook Fremont Johnson Laramie Lincoln Natrona Niobrara Park Platte Sheridan Sweetwater Teton % within County % within County % within County % within County % within County % within County % within County % within County % within County % within County % within County % within County % within County % within County % within County % within County % within County Belted Not Belted Unsure Total Estimate 85.6% 14.3% 0.1% 100.0% Unweighted Count Estimate 86.6% 13.4% 100.0% Unweighted Count Estimate 78.3% 16.8% 4.9% 100.0% Unweighted Count Estimate 86.9% 12.9% 0.2% 100.0% Unweighted Count Estimate 81.6% 14.0% 4.4% 100.0% Unweighted Count Estimate 93.1% 6.7% 0.2% 100.0% Unweighted Count Estimate 74.6% 25.3% 0.1% 100.0% Unweighted Count Estimate 91.9% 5.7% 2.3% 100.0% Unweighted Count Estimate 71.9% 26.0% 2.1% 100.0% Unweighted Count Estimate 84.7% 13.9% 1.5% 100.0% Unweighted Count Estimate 80.2% 17.9% 1.9% 100.0% Unweighted Count Estimate 94.9% 4.6% 0.5% 100.0% Unweighted Count Estimate 76.0% 23.6% 0.4% 100.0% Unweighted Count Estimate 78.0% 22.0% 100.0% Unweighted Count Estimate 78.8% 21.1% 0.1% 100.0% Unweighted Count Estimate 64.4% 35.5% 0.1% 100.0% Unweighted Count Estimate 89.7% 9.5% 0.8% 100.0% Unweighted Count
89 Total % within County Estimate 84.8% 14.2% 1.0% 100.0% Unweighted Count Population Population * Occupant Belt Use Occupant Belt Use Belted Not Belted Unsure Total Urban Rural Total % within Population % within Population % within Population Estimate 72.3% 27.2% 0.5% 100.0% Unweighted Count Estimate 86.8% 12.2% 1.0% 100.0% Unweighted Count Estimate 84.8% 14.2% 1.0% 100.0% Unweighted Count Day Day * Occupant Belt Use Occupant Belt Use Belted Not Belted Unsure Total Sunday Monday Tuesday Wednesday Thursday Friday Saturday Total % within Day % within Day % within Day % within Day % within Day % within Day % within Day % within Day Estimate 88.5% 10.6% 1.0% 100.0% Unweighted Count Estimate 83.8% 14.6% 1.6% 100.0% Unweighted Count Estimate 83.8% 15.0% 1.3% 100.0% Unweighted Count Estimate 87.1% 11.7% 1.2% 100.0% Unweighted Count Estimate 84.0% 15.6% 0.3% 100.0% Unweighted Count Estimate 83.5% 16.0% 0.4% 100.0% Unweighted Count Estimate 83.3% 16.0% 0.7% 100.0% Unweighted Count Estimate 84.8% 14.2% 1.0% 100.0% Unweighted Count Weekday and Weekend * Occupant Belt Use Weekday and Weekend Occupant Belt Use Belted Not Belted Unsure Weekend % within Weekday and Estimate 85.9% 13.3% 0.8%
90 Weekday Total Weekend Unweighted Count % within Weekday and Estimate 84.5% 14.5% 1.0% Weekend Unweighted Count % within Weekday and Estimate 84.8% 14.2% 1.0% Weekend Unweighted Count Weekday and Weekend * Occupant Belt Use Weekday and Weekend Occupant Belt Use Weekend Weekday Total % within Weekday and Weekend % within Weekday and Weekend % within Weekday and Weekend Total Estimate 100.0% Unweighted Count 4686 Estimate 100.0% Unweighted Count Estimate 100.0% Unweighted Count 23775
91 Time of Observation * Occupant Belt Use Time of Observation Occupant Belt Use Belted Not Belted Unsure 7:30-9:30 % within Time of Observation 9:30-11:30 % within Time of Observation 11:30-1:30 % within Time of Observation 1:30-3:30 % within Time of Observation 3:30-5:30 % within Time of Observation Total % within Time of Observation Estimate 83.2% 15.5% 1.3% Unweighted Count Estimate 85.6% 13.3% 1.1% Unweighted Count Estimate 86.5% 12.7% 0.8% Unweighted Count Estimate 84.7% 14.6% 0.6% Unweighted Count Estimate 83.7% 15.2% 1.1% Unweighted Count Estimate 84.8% 14.2% 1.0% Unweighted Count Time of Observation * Occupant Belt Use Time of Observation Occupant Belt Use Total 7:30-9:30 % within Time of Observation 9:30-11:30 % within Time of Observation 11:30-1:30 % within Time of Observation 1:30-3:30 % within Time of Observation 3:30-5:30 % within Time of Observation Total % within Time of Observation Estimate 100.0% Unweighted Count 3827 Estimate 100.0% Unweighted Count 4929 Estimate 100.0% Unweighted Count 5415 Estimate 100.0% Unweighted Count 3916 Estimate 100.0% Unweighted Count 5688 Estimate 100.0% Unweighted Count Roadway Type * Occupant Belt Use Roadway Type Occupant Belt Use
Monty Byers, Tammy Cussins, Brooke Darden, Tonya Dove, Peggy Dowers, Dawn Edwards,
 WYOMING 2016 The protocols implemented for this study are in accordance with the federal guidelines established in 2012, which distinguish it from all prior surveys of seat belt use in Wyoming. The standards
2014 WYOMING SURVEY OF SEAT BELT USE
 2014 WYOMING The protocols implemented for this study are in accordance with the federal guidelines established in 2012, which distinguish it from all prior surveys of seat belt use in Wyoming. The standards
Survey of Seat Belt Use
 Survey of Seat Belt Use Wyoming 2013 The protocols implemented for this study are in accordance with the federal guidelines established in 2012, which distinguish it from all prior surveys of seat belt
Missouri Seat Belt Usage Survey for 2017
 Missouri Seat Belt Usage Survey for 2017 Conducted for the Highway Safety & Traffic Division of the Missouri Department of Transportation by The Missouri Safety Center University of Central Missouri Final
ALCOHOL AND WYOMING TRAFFIC CRASHES
 AND WYOMING TRAFFIC -2007- 2002-2007 SUMMARY COMPARISON FOR WYOMING TRAFFIC YEAR OF 2002 2003 2004 2005 2006 2007 ALL FATAL 151 141 142 147 169 136 FATAL 53 43 50 51 58* 46* PERCENT [%] 35.0% 30.5% 35.2%
KANSAS Occupant Protection Observational Survey Supplementary Analyses Summer Study
 KANSAS Occupant Protection Observational Survey Supplementary Analyses 2018 Summer Study Submitted To: Kansas Department of Transportation Bureau of Transportation Safety and Technology Prepared by: DCCCA
Puerto Rico Observational Survey of Seat Belt Use, 2017
 Puerto Rico Observational Survey of Seat Belt Use, 2017 Final Report Submitted to: Traffic Safety Commission of Puerto Rico September 29, 2017 TABLE OF CONTENT Introduction... 3 Methodology... 3 FINDINGS...
Food and Transportation Drive Inflation for the Second Quarter of 2011
 State of Wyoming Department of Administration and Information Economic Analysis Division 2800 Central Avenue Cheyenne, WY 82002-0060 E-mail: ai-ead-info@wyo.gov http://eadiv.state.wy.us Ph. (307) 777-7504
Wyoming Cost of Living Index for the Second Quarter of 2012
 State of Wyoming Department of Administration and Information Economic Analysis Division 2800 Central Avenue Cheyenne, WY 82002-0060 E-mail: ai-ead-info@wyo.gov http://eadiv.state.wy.us Ph. (307) 777-7504
WYOMING COST OF LIVING FOR THE SECOND QUARTER 2010
 State of Wyoming Department of Administration and Information Economic Analysis Division 2800 Central Avenue Cheyenne, WY 82002-0060 E-mail: ead@wyo.gov http://eadiv.state.wy.us Ph. (307) 777-7504 Fax
Where are the Increases in Motorcycle Rider Fatalities?
 Where are the Increases in Motorcycle Rider Fatalities? Umesh Shankar Mathematical Analysis Division (NPO-121) Office of Traffic Records and Analysis National Center for Statistics and Analysis National
National Household Travel Survey Add-On Use in the Des Moines, Iowa, Metropolitan Area
 National Household Travel Survey Add-On Use in the Des Moines, Iowa, Metropolitan Area Presentation to the Transportation Research Board s National Household Travel Survey Conference: Data for Understanding
Wyoming School Funding Model Recalibration: Transportation Reimbursement Model Study
 Wyoming School Funding Model Recalibration: Transportation Reimbursement Model Study Robert Schoch and Dr. William Hartman, Education Finance Decisions For Augenblick, Palaich and Associates, Inc. Presentation
Passenger seat belt use in Durham Region
 Facts on Passenger seat belt use in Durham Region June 2017 Highlights In 2013/2014, 85 per cent of Durham Region residents 12 and older always wore their seat belt when riding as a passenger in a car,
National Center for Statistics and Analysis Research and Development
 U.S. Department of Transportation National Highway Traffic Safety Administration DOT HS 809 271 June 2001 Technical Report Published By: National Center for Statistics and Analysis Research and Development
WHITE PAPER. Preventing Collisions and Reducing Fleet Costs While Using the Zendrive Dashboard
 WHITE PAPER Preventing Collisions and Reducing Fleet Costs While Using the Zendrive Dashboard August 2017 Introduction The term accident, even in a collision sense, often has the connotation of being an
Food Prices Propel Inflation for the Fourth Quarter of 2011
 State of Wyoming Department of Administration and Information Economic Analysis Division 2800 Central Avenue Cheyenne, WY 82002-0060 E-mail: ai-ead-info@wyo.gov http://eadiv.state.wy.us Ph. (307) 777-7504
EXPERIENCE IN A COMPANY-WIDE LONG DISTANCE CARPOOL PROGRAM IN SOUTH KOREA
 EXPERIENCE IN A COMPANY-WIDE LONG DISTANCE CARPOOL PROGRAM IN SOUTH KOREA JB s Social Club Presented at TRB 94th Annual Meeting on Jan 12, 2015 Louis Berger Kyeongsu Kim Land & Housing Institute (LHI)
MEMORANDUM. Observational survey of car seat use, 2017
 MEMORANDUM Darelis López Rosario, Esq. Executive Director Traffic Safety Commission Carlos Torija Estudios Técnicos, Inc. October 5, 2017 Observational survey of car seat use, 2017 The Traffic Safety Commission
PARKING OCCUPANCY IN WINDSOR CENTER
 PARKING OCCUPANCY IN WINDSOR CENTER TOWN OF WINDSOR, CONNECTICUT REPORT JUNE 2017 CONTENTS Background... 3 Other Relevant Data... 3 Parking Survey Design... 6 Parking Supply Inventory... 6 Parking Demand
Fatal Motor Vehicle Crashes on Indian Reservations
 April 2004 DOT HS 809 727 Fatal Motor Vehicle Crashes on Indian Reservations 1975-2002 Technical Report Colleges & Universities 2% Other Federal Properties 9% Other 4% Indian Reservations 65% National
The 2017 Wyoming Housing Needs Forecast
 The 2017 Wyoming Housing Needs Forecast Prepared for Wyoming Community Development Authority Prepared by Western Economic Services, LLC 212 SE 18 th Avenue Portland, OR 97214 (503) 239-9091 Toll-free:
TECHNICAL ASSISTANCE REPORT SAFETY BELT AND MOTORCYCLE HELMET USE IN VIRGINIA: THE DECEMBER 2002 UPDATE. Cheryl W. Lynn Senior Research Scientist
 TECHNICAL ASSISTANCE REPORT SAFETY BELT AND MOTORCYCLE HELMET USE IN VIRGINIA: THE DECEMBER 2002 UPDATE Cheryl W. Lynn Senior Research Scientist Jami L. Fisher Research Associate Virginia Transportation
Who has trouble reporting prior day events?
 Vol. 10, Issue 1, 2017 Who has trouble reporting prior day events? Tim Triplett 1, Rob Santos 2, Brian Tefft 3 Survey Practice 10.29115/SP-2017-0003 Jan 01, 2017 Tags: missing data, recall data, measurement
ITSMR Research Note. Motorcyclists and Impaired Driving ABSTRACT INTRODUCTION KEY FINDINGS. September 2013
 September 2013 KEY FINDINGS F&PI CRASHES INVOLVING IMPAIRED MOTORCYCLISTS 27% of the fatal MC crashes over the five year period, 2008-2012, were alcohol-related. 48% of the alcohol-related F&PI MC crashes
Driver Speed Compliance in Western Australia. Tony Radalj and Brian Kidd Main Roads Western Australia
 Driver Speed Compliance in Western Australia Abstract Tony Radalj and Brian Kidd Main Roads Western Australia A state-wide speed survey was conducted over the period March to June 2 to measure driver speed
Rates of Motor Vehicle Crashes, Injuries, and Deaths in Relation to Driver Age, United States,
 RESEARCH BRIEF This Research Brief provides updated statistics on rates of crashes, injuries and death per mile driven in relation to driver age based on the most recent data available, from 2014-2015.
NON-FATAL ELECTRICAL INJURIES AT WORK
 NON-FATAL ELECTRICAL INJURIES AT WORK Richard Campbell May 2018 Copyright 2018 National Fire Protection Association (NFPA) CONTENTS Findings and Trends 1 Key Takeaways 2 Background on Data Sources and
STATE OF NORTH CAROLINA DEPARTMENT OF TRANSPORTATION
 PAT MCCRORY GOVERNOR STATE OF NORTH CAROLINA DEPARTMENT OF TRANSPORTATION DIVISION OF MOTOR VEHICLES ANTHONY J. TATA SECRETARY January 6, 2014 19A NCAC 03B.0201 Driver License Examination Agency Contact:
Michigan State Police (MSP) Post 21 - Metro North
 Post 21 - Metro North") October 2017 2016 Reporting Criteria Please pay particular attention to the wording when interpreting the three levels of data gathered for this report. Crash The Crash Level analyzes data related to crash
October 2017 2016 Reporting Criteria Please pay particular attention to the wording when interpreting the three levels of data gathered for this report. Crash The Crash Level analyzes data related to crash
Provisional Review of Fatal Collisions. January to December 31 st 2017
 Provisional Review of Fatal Collisions January to December 31 st 17 2 nd January 18 Review of 17 fatal collision statistics as of 31st December 17 Overview This report summarises the main trends in road
THE 2013 WYOMING HOUSING NEEDS FORECAST
 THE 2013 WYOMING HOUSING NEEDS FORECAST SPONSORED BY THE WYOMING COMMUNITY DEVELOPMENT AUTHORITY FINAL REPORT: MARCH 29, 2013 The 2013 Wyoming Housing Needs Forecast Prepared for Wyoming Community Development
2014 Community Report Portales
 4 Portales Produced for the New Mexico Department of Transportation, Traffic Safety Division, Traffic Records Bureau, Under Contract 58 by the University of New Mexico, Geospatial and Population Studies,
2014 Community Report Luna County
 4 Luna County Produced for the New Mexico Department of Transportation, Traffic Safety Division, Traffic Records Bureau, Under Contract 58 by the University of New Mexico, Geospatial and Population Studies,
The Value of Travel-Time: Estimates of the Hourly Value of Time for Vehicles in Oregon 2007
 The Value of Travel-Time: Estimates of the Hourly Value of Time for Vehicles in Oregon 2007 Oregon Department of Transportation Long Range Planning Unit June 2008 For questions contact: Denise Whitney
LONG RANGE PERFORMANCE REPORT. Study Objectives: 1. To determine annually an index of statewide turkey populations and production success in Georgia.
 State: Georgia Grant Number: 08-953 Study Number: 6 LONG RANGE PERFORMANCE REPORT Grant Title: State Funded Wildlife Survey Period Covered: July 1, 2010 - June 30, 2011 Study Title: Wild Turkey Production
2014 Community Report Las Vegas
 4 Las Vegas Produced for the New Mexico Department of Transportation, Traffic Safety Division, Traffic Records Bureau, Under Contract 58 by the University of New Mexico, Geospatial and Population Studies,
2014 Community Report Truth or Consequences
 4 Truth or Consequences Produced for the New Mexico Department of Transportation, Traffic Safety Division, Traffic Records Bureau, Under Contract 58 by the University of New Mexico, Geospatial and Population
TRAFFIC SAFETY FACTS Fatal Motor Vehicle Crashes: Overview. Research Note. DOT HS October 2017
 TRAFFIC SAFETY FACTS Research Note DOT HS 812 456 October 2017 2016 Fatal Motor Vehicle Crashes: Overview There were 37,461 people killed in crashes on U.S. roadways during 2016, an increase from 35,485
2014 Community Report Tularosa
 4 Tularosa Produced for the New Mexico Department of Transportation, Traffic Safety Division, Traffic Records Bureau, Under Contract 8 by the University of New Mexico, Geospatial and Population Studies,
2014 Community Report Aztec
 Aztec Produced for the New Mexico Department of Transportation, Traffic Safety Division, Traffic Records Bureau, Under Contract 58 by the University of New Mexico, Geospatial and Population Studies, Traffic
Oregon DOT Slow-Speed Weigh-in-Motion (SWIM) Project: Analysis of Initial Weight Data
 Project: Analysis of Initial Weight Data") Portland State University PDXScholar Center for Urban Studies Publications and Reports Center for Urban Studies 7-1997 Oregon DOT Slow-Speed Weigh-in-Motion (SWIM) Project: Analysis of Initial Weight Data
Portland State University PDXScholar Center for Urban Studies Publications and Reports Center for Urban Studies 7-1997 Oregon DOT Slow-Speed Weigh-in-Motion (SWIM) Project: Analysis of Initial Weight Data
The Evolution of Side Crash Compatibility Between Cars, Light Trucks and Vans
 2003-01-0899 The Evolution of Side Crash Compatibility Between Cars, Light Trucks and Vans Hampton C. Gabler Rowan University Copyright 2003 SAE International ABSTRACT Several research studies have concluded
2014 Community Report Los Lunas
 4 Los Lunas Produced for the New Mexico Department of Transportation, Traffic Safety Division, Traffic Records Bureau, Under Contract 58 by the University of New Mexico, Geospatial and Population Studies,
2015 Community Report White Rock
 5 White Rock Produced for the New Mexico Department of Transportation, Traffic Safety Division, Traffic Records Bureau, Under Contract 58 by the University of New Mexico, Geospatial and Population Studies,
Michigan. Traffic. Profile
 June 2014 Revised 5/11/15 Michigan 2013 Traffic Crash Profile Reporting Criteria Please pay particular attention to the wording when interpreting the three levels of data gathered for this report. Crash
2016 Community Report New Mexico
 216 Produced for the Department of Transportation, Traffic Safety Division, Traffic Records Bureau, Under Contract 581 by the University of, Geospatial and Population Studies, Traffic Research Unit Distributed
2016 Community Report Los Alamos County
 6 Los Alamos County Produced for the New Mexico Department of Transportation, Traffic Safety Division, Traffic Records Bureau, Under Contract 58 by the University of New Mexico, Geospatial and Population
2016 Community Report Portales
 6 Portales Produced for the New Mexico Department of Transportation, Traffic Safety Division, Traffic Records Bureau, Under Contract 58 by the University of New Mexico, Geospatial and Population Studies,
2015 Community Report Grants
 5 Grants Produced for the New Mexico Department of Transportation, Traffic Safety Division, Traffic Records Bureau, Under Contract 58 by the University of New Mexico, Geospatial and Population Studies,
2016 Community Report Torrance County
 6 Torrance County Produced for the New Mexico Department of Transportation, Traffic Safety Division, Traffic Records Bureau, Under Contract 58 by the University of New Mexico, Geospatial and Population
2015 Community Report Torrance County
 5 Torrance County Produced for the New Mexico Department of Transportation, Traffic Safety Division, Traffic Records Bureau, Under Contract 58 by the University of New Mexico, Geospatial and Population
2016 Community Report De Baca County
 6 De Baca County Produced for the New Mexico Department of Transportation, Traffic Safety Division, Traffic Records Bureau, Under Contract 58 by the University of New Mexico, Geospatial and Population
2015 Community Report Las Vegas
 5 Las Vegas Produced for the New Mexico Department of Transportation, Traffic Safety Division, Traffic Records Bureau, Under Contract 58 by the University of New Mexico, Geospatial and Population Studies,
Northwest Residential Electric Bills
 Henry Lorenzen Chair Oregon Bill Bradbury Oregon Phil Rockefeller Washington Tom Karier Washington W. Bill Booth Vice Chair Idaho James Yost Idaho Pat Smith Montana Jennifer Anders Montana July 2016 Northwest
2015 Community Report Tularosa
 5 Tularosa Produced for the New Mexico Department of Transportation, Traffic Safety Division, Traffic Records Bureau, Under Contract 58 by the University of New Mexico, Geospatial and Population Studies,
DOT HS April 2013
 TRAFFIC SAFETY FACTS 2011 Data DOT HS 811 753 April 2013 Overview Motor vehicle travel is the primary means of transportation in the United States, providing an unprecedented degree of mobility. Yet for
Michigan State Police (MSP) Post 21 - Metro North
 Post 21 - Metro North") June 2018 Revised 8/3/2018 2017 Reporting Criteria Please pay particular attention to the wording when interpreting the three levels of data gathered for this report. Crash The Crash Level analyzes data
June 2018 Revised 8/3/2018 2017 Reporting Criteria Please pay particular attention to the wording when interpreting the three levels of data gathered for this report. Crash The Crash Level analyzes data
PROCEDURES FOR ESTIMATING THE TOTAL LOAD EXPERIENCE OF A HIGHWAY AS CONTRIBUTED BY CARGO VEHICLES
 PROCEDURES FOR ESTIMATING THE TOTAL LOAD EXPERIENCE OF A HIGHWAY AS CONTRIBUTED BY CARGO VEHICLES SUMMARY REPORT of Research Report 131-2F Research Study Number 2-10-68-131 A Cooperative Research Program
KENTUCKY TRANSPORTATION CENTER
 Research Report KTC-08-10/UI56-07-1F KENTUCKY TRANSPORTATION CENTER EVALUATION OF 70 MPH SPEED LIMIT IN KENTUCKY OUR MISSION We provide services to the transportation community through research, technology
2015 Community Report Chaparral
 5 Chaparral Produced for the New Mexico Department of Transportation, Traffic Safety Division, Traffic Records Bureau, Under Contract 58 by the University of New Mexico, Geospatial and Population Studies,
2016 Community Report Aztec
 Aztec Produced for the New Mexico Department of Transportation, Traffic Safety Division, Traffic Records Bureau, Under Contract 58 by the University of New Mexico, Geospatial and Population Studies, Traffic
2015 Community Report Aztec
 25 Aztec Produced for the New Mexico Department of Transportation, Traffic Safety Division, Traffic Records Bureau, Under Contract 58 by the University of New Mexico, Geospatial and Population Studies,
2016 Community Report Santa Fe County
 26 Santa Fe County Produced for the New Mexico Department of Transportation, Traffic Safety Division, Traffic Records Bureau, Under Contract 58 by the University of New Mexico, Geospatial and Population
American Driving Survey,
 RESEARCH BRIEF American Driving Survey, 2015 2016 This Research Brief provides highlights from the AAA Foundation for Traffic Safety s 2016 American Driving Survey, which quantifies the daily driving patterns
Michigan. Traffic. Profile
 June 2014 Revised 5/11/15 Michigan 2013 Traffic Crash Profile Reporting Criteria Please pay particular attention to the wording when interpreting the three levels of data gathered for this report. Crash
2016 Community Report San Juan County
 26 San Juan County Produced for the New Mexico Department of Transportation, Traffic Safety Division, Traffic Records Bureau, Under Contract 58 by the University of New Mexico, Geospatial and Population
2015 Community Report San Juan County
 25 San Juan County Produced for the New Mexico Department of Transportation, Traffic Safety Division, Traffic Records Bureau, Under Contract 58 by the University of New Mexico, Geospatial and Population
Road Safety s Mid Life Crisis The Trends and Characteristics for Middle Aged Controllers Involved in Road Trauma
 Road Safety s Mid Life Crisis The Trends and Characteristics for Middle Aged Controllers Involved in Road Trauma Author: Andrew Graham, Roads and Traffic Authority, NSW Biography: Andrew Graham has been
2015 Community Report Los Lunas
 25 Los Lunas Produced for the New Mexico Department of Transportation, Traffic Safety Division, Traffic Records Bureau, Under Contract 58 by the University of New Mexico, Geospatial and Population Studies,
2015 Community Report Doña Ana County
 25 Doña Ana County Produced for the New Mexico Department of Transportation, Traffic Safety Division, Traffic Records Bureau, Under Contract 58 by the University of New Mexico, Geospatial and Population
ENTUCKY RANSPORTATION C ENTER
 Research Report KTC-05-39/TA19-05-1F T K ENTUCKY RANSPORTATION C ENTER College of Engineering SOCIO-ECONOMIC ANALYSIS OF FATAL CRASH TRENDS (Final Report) Our Mission We provide services to the transportation
Percentage of Children and Youth Ages 0 to 24 years old Using Seat Belts or Restraints, Selected Years,
 2 Percent Figure 1 100 80 Percentage of Children and Youth Ages 0 to 24 years old Using Seat Belts or Restraints, Selected Years, 1994-2013 82 88 82 78 89 91 81 80 89 83 60 40 20 53 50 69 16 to 24 years
I.11Tc1ER.S Eagleton nstitute PoIitcs New Bruriswck Ne s Jersey : C[Lic 4ar-ICbgCr/EAGLETON POLL
 Other newspapers may also use this information in their Sunday and back-ground memo will appear in Sunday s Star-Ledger. A story based on the survey findings presented in this release RELEASE INFORMATION
Technical Memorandum Analysis Procedures and Mobility Performance Measures 100 Most Congested Texas Road Sections What s New for 2015
 Technical Memorandum Analysis Procedures and Mobility Performance Measures 100 Most Congested Texas Road Sections Prepared by Texas A&M Transportation Institute August 2015 This memo documents the analysis
OKLAHOMA CORPORATION COMMISSION REGULATED ELECTRIC UTILITIES 2017 RELIABILITY SCORECARD
 OKLAHOMA CORPORATION COMMISSION REGULATED ELECTRIC UTILITIES 2017 RELIABILITY SCORECARD May 1, 2017 Table of Contents 1.0 Introduction...3 2.0 Summary...3 3.0 Purpose...3 4.0 Definitions...4 5.0 Analysis...5
Statistics and Facts About Distracted Driving
 Untitled Document Statistics and Facts About Distracted Driving What does it mean to be a distracted driver? Are you one? Learn more here. What Is Distracted Driving? There are three main types of distraction:
An Evaluation of the Relationship between the Seat Belt Usage Rates of Front Seat Occupants and Their Drivers
 An Evaluation of the Relationship between the Seat Belt Usage Rates of Front Seat Occupants and Their Drivers Vinod Vasudevan Transportation Research Center University of Nevada, Las Vegas 4505 S. Maryland
PREFACE 2015 CALSTART
 PREFACE This report was researched and produced by CALSTART, which is solely responsible for its content. The report was prepared by CALSTART technical staff including Ted Bloch-Rubin, Jean-Baptiste Gallo,
DRIVER SPEED COMPLIANCE WITHIN SCHOOL ZONES AND EFFECTS OF 40 PAINTED SPEED LIMIT ON DRIVER SPEED BEHAVIOURS Tony Radalj Main Roads Western Australia
 DRIVER SPEED COMPLIANCE WITHIN SCHOOL ZONES AND EFFECTS OF 4 PAINTED SPEED LIMIT ON DRIVER SPEED BEHAVIOURS Tony Radalj Main Roads Western Australia ABSTRACT Two speed surveys were conducted on nineteen
OKLAHOMA CORPORATION COMMISSION REGULATED ELECTRIC UTILITIES 2018 RELIABILITY SCORECARD
 OKLAHOMA CORPORATION COMMISSION REGULATED ELECTRIC UTILITIES 2018 RELIABILITY SCORECARD June 1, 2018 Table of Contents 1.0 Introduction...3 2.0 Summary...3 3.0 Purpose...3 4.0 Definitions...4 5.0 Analysis...5
Rio Arriba County Report, 2007
 Rio Arriba County Report, 7 Demographics In 7, there were 3,748 licensed drivers in Rio Arriba County. Of these, there were,68 females and,63 males. The population in Rio Arriba County was 4,87. The total
Traffic Safety Network Huron Valley
 June 2018 Revised 8/3/2018 2017 Reporting Criteria Please pay particular attention to the wording when interpreting the three levels of data gathered for this report. Crash The Crash Level analyzes data
Understanding Traffic Data: How To Avoid Making the Wrong Turn
 Traffic Records Forum 2011 Understanding Traffic Data: How To Avoid Making the Wrong Turn Presenter: Marc Starnes (202) 366-2186 marc.starnes@dot.gov August 3rd, 2011 1 Summary of Topics Police Crash Reports
Trip Generation and Parking Study New Californian Apartments, Berkeley
 Trip Generation and Parking Study New Californian Apartments, Berkeley Institute of Transportation Engineers University of California, Berkeley Student Chapter Spring 2012 Background The ITE Student Chapter
National Center for Statistics and Analysis Research and Development
 U.S. Department of Transportation National Highway Traffic Safety Administration DOT HS 809 360 October 2001 Technical Report Published By: National Center for Statistics and Analysis Research and Development
Rio Arriba County Report, 2002
 Rio Arriba County Report, Demographics In, there were,8 licensed drivers in Rio Arriba County. Of these, there were 8,8 females and 8,8 males. The population in Rio Arriba County was,9. The total number
UPPER GREEN RIVER OZONE INVESTIGATION (O3i) LUMAN AND PARADISE ROAD TRAFFIC COUNT STUDY 03/05/2009 AND 06/09/2009. Study Summary.
 LUMAN AND PARADISE ROAD TRAFFIC COUNT STUDY 03/05/2009 AND 06/09/2009. Study Summary.") UPPER GREEN RIVER OZONE INVESTIGATION (O3i) LUMAN AND PARADISE ROAD TRAFFIC COUNT STUDY 03/05/2009 AND 06/09/2009 Study Summary Prepared for WYOMING DEPARTMENT OF ENVIRONMENTAL QUALITY 122 West 25 th Street
UPPER GREEN RIVER OZONE INVESTIGATION (O3i) LUMAN AND PARADISE ROAD TRAFFIC COUNT STUDY 03/05/2009 AND 06/09/2009 Study Summary Prepared for WYOMING DEPARTMENT OF ENVIRONMENTAL QUALITY 122 West 25 th Street
Prepared for: SEAT BELT USE SURVEY OTS Grant Number 23-CP-4 UNLV Account Number DK. Final Report UNLV/TRC/PR/03-09.
 Prepared for: Office of Traffic Safety Division of Traffic Safety Department of Motor Vehicles and Public Safety 55 Wright Way Carson City, NV 89711-0999 SEAT BELT USE SURVEY- 2003 OTS Grant Number 23-CP-4
Speed Evaluation Saw Mill Drive
 Speed Evaluation Saw Mill Drive Prepared for: Mount Laurel Township Burlington County, New Jersey Prepared by: Dana Litwornia Litwornia & Associates, Inc. Transportation, Traffic & Environmental Engineering
TRAFFIC SAFETY FACTS. Overview Data
 TRAFFIC SAFETY FACTS 2009 Data Overview Motor vehicle travel is the primary means of transportation in the United States, providing an unprecedented degree of mobility. Yet for all its advantages, injuries
Gillette Lost the Most Residents in 2017
 FOR IMMEDIATE RELEASE Thursday, May 24, 2018 Contact: Dr. Wenlin Liu, Chief Economist Gillette Lost the Most Residents in 2017 CHEYENNE Cities that lost the most residents in Wyoming between July 1, 2016
GREENE COUNTY SCHOOLS ENROLLMENT PROJECTIONS REPORT APRIL 12, 2017
 APRIL 12, 2017 PREPARED FOR: Greene County Schools 910 West Summer Street Greeneville, TN 37743 T 423-639-4194 PREPARED BY: Cooperative Strategies 3325 Hilliard Rome Road Hilliard, OH 43026 T 614.798.8828
Act 229 Evaluation Report
 R22-1 W21-19 W21-20 Act 229 Evaluation Report Prepared for Prepared by Table of Contents 1. Documentation Page 3 2. Executive Summary 4 2.1. Purpose 4 2.2. Evaluation Results 4 3. Background 4 4. Approach
Aria Etemad Volkswagen Group Research. Key Results. Aachen 28 June 2017
 Aria Etemad Volkswagen Group Research Key Results Aachen 28 June 2017 28 partners 2 // 28 June 2017 AdaptIVe Final Event, Aachen Motivation for automated driving functions Zero emission Reduction of fuel
Table of Contents. 1.0 Introduction Demographic Characteristics Travel Behaviour Aggregate Trips 28
 Table of Contents 1.0 Introduction 1 1.1 Overview of the Household Travel Survey 1 1.2 Study Area 2 1.3 Scaling 5 1.4 Sample Accuracy 6 2.0 Demographic Characteristics 8 2.1 Population, Employment and
MIT ICAT M I T I n t e r n a t i o n a l C e n t e r f o r A i r T r a n s p o r t a t i o n
 M I T I n t e r n a t i o n a l C e n t e r f o r A i r T r a n s p o r t a t i o n Standard Flow Abstractions as Mechanisms for Reducing ATC Complexity Jonathan Histon May 11, 2004 Introduction Research
Los Lunas Community Report, 2002
 Los Lunas Community Report, Demographics In, there were, licensed drivers in Los Lunas. Of these, there were, females and, males. The population of Los Lunas was,. The total number of crashes in was, yielding
Executive Summary. Light-Duty Automotive Technology and Fuel Economy Trends: 1975 through EPA420-S and Air Quality July 2006
 Office of Transportation EPA420-S-06-003 and Air Quality July 2006 Light-Duty Automotive Technology and Fuel Economy Trends: 1975 through 2006 Executive Summary EPA420-S-06-003 July 2006 Light-Duty Automotive
MILLERSVILLE PARK TRAFFIC IMPACT ANALYSIS ANNE ARUNDEL COUNTY, MARYLAND
 MILLERSVILLE PARK TRAFFIC IMPACT ANALYSIS ANNE ARUNDEL COUNTY, MARYLAND Prepared for: Department of Public Works Anne Arundel County Prepared by: URS Corporation 4 North Park Drive, Suite 3 Hunt Valley,