2014 WYOMING SURVEY OF SEAT BELT USE
|
|
|
- Cecil Randolf Malone
- 5 years ago
- Views:
Transcription


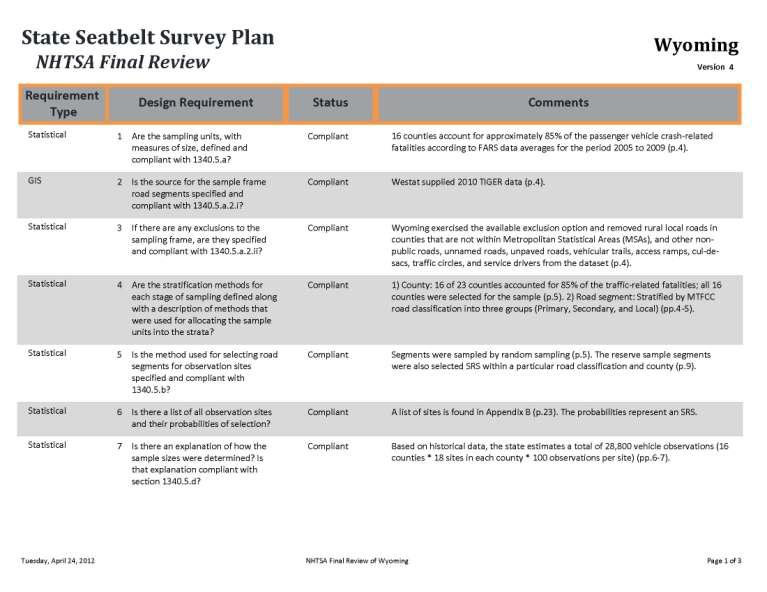
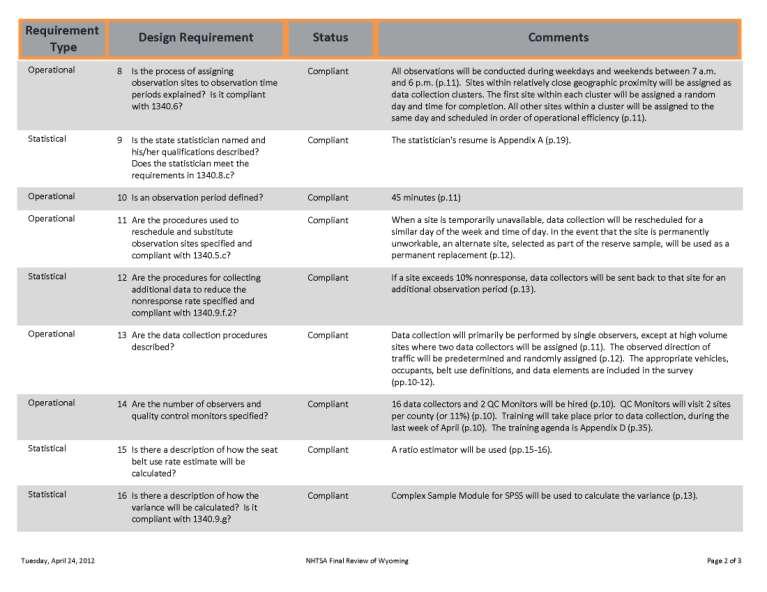
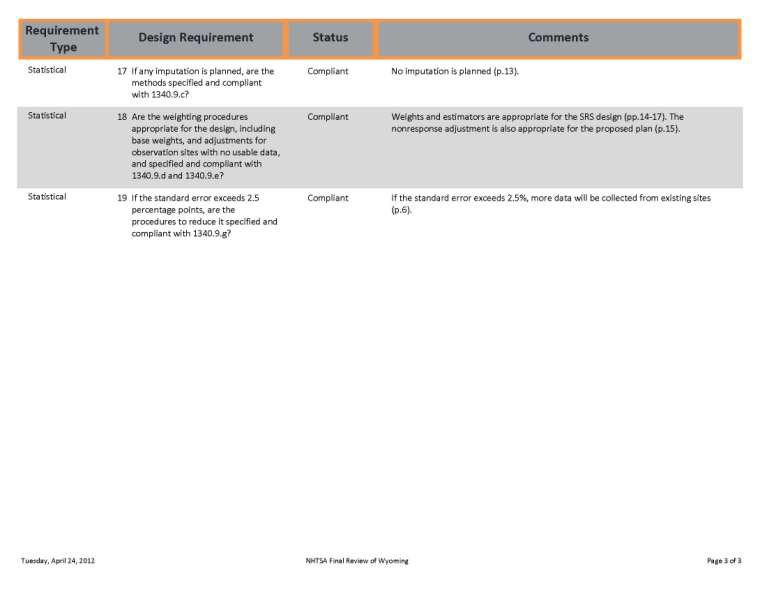
1 2014 WYOMING The protocols implemented for this study are in accordance with the federal guidelines established in 2012, which distinguish it from all prior surveys of seat belt use in Wyoming. The standards and protocols align with the Uniform Criteria for State Observational Surveys of Seat Belt Use, 23 CFR Part The 2014 survey analysis is the third survey conducted under the 2012 guidelines for seat belt use in the state of Wyoming SURVEY OF SEAT BELT USE Prepared by DLN Consulting, Inc.
2 Acknowledgments DLN Consulting, Inc. expresses appreciation to several individuals who were essential to the completion of this project. Lydia DeJesus assisted with project coordination; supervised coding, data entry, and quality assurance procedures; and developed spreadsheets, charts, and graphs. Katelin Dukart compiled the data and imported the charts and graphs into the narrative Bridget White and Richard Macht conducted field monitoring. Without the dedicated hard work of the people who conducted the field observations, we could not complete this survey: Samantha Anderson, Derek Bacon, Brianna Beck, Monty Byers, Dallas Darden, Trevice Fifield, Deanna Frey, Kristi Holifield, Chereon Hoopes, Eric Johnson, Dorothy Johnstone, Richard Macht, Sandy McCleery, Vicky Peterson, Darcy Ronne, Kayla Schear, Bill Spencer, and Bridget White. Finally, special thanks to the staff of the Wyoming Highway Safety Program, especially, Darlene Call, Highway Service Office Manager for their support during the project period. Deb Nelson, DLN President Project Administrator Keith Fernsler, PhD Project Analyst James G. Leibert, PhD Project Statistician Page i
3 Table of Contents Acknowledgments... i Executive Summary... 1 Quality Assurance... 3 Data Compilation... 3 Introduction... 4 Standard Error and Confidence Intervals... 5 Observers... 6 Frequencies... 7 Estimates of Occupant Seat Belt Use Estimates of Seat Belt Use for Drivers Estimates of Seat Belt Use by Passengers Trends: A Discussion Closing Appendix A: State seat belt use reporting form Appendix B: Survey design for Wyoming Appendix C: NHTSA Approval and Final Review Appendix D: Detailed tables of collected data Frequencies Occupant Seat Belt Use Driver Seat Belt Use Passenger Seat Belt Use Appendix E: Observer field test rating Appendix F: Unknown seat belt use Appendix G: Reporting requirements data collected at observation sites County Information Appendix H: SPSS data dictionary Figure 1: Frequencies with and without passengers... 7 Figure 2: Frequencies by Occupant Belt Use... 8 Figure 3: Frequencies by Occupant Gender... 8 Figure 4: Frequencies by County... 9 Figure 5: Frequencies by Population Density... 9 Figure 6: Frequencies by Roadway Type Page ii
4 Figure 7: Frequencies by Day of Week Figure 8: Frequencies by weekend and weekday Figure 9: Frequencies by Vehicle Type Figure 10: Frequencies by Registration Type Figure 11: Percent Belted by Occupant Type Figure 12: Percent Belted by Occupant Gender Figure 13: Percent Belted by County of Observation Figure 14: Percent Belted by Population Figure 15: Percent Belted by Roadway Type Figure 16: Percent Belted by the Day of the Week Figure 17: Percent Belted by Weekdays vs. Weekend Figure 18: Percent Belted by Vehicle Type Figure 19: Percent Belted by Vehicle and Gender Figure 20: Percent Belted by Registration Type Figure 21: Percent of Drivers Belted by Driver Gender Figure 22: Percent of Drivers Belted by County Table 1: Occupant Belts Use in Wyoming, Table 2: Observers by County of Observations, Wyoming Table 3: Frequencies of Vehicle Types by County, Wyoming Table 4: Year * Occupant Seat Belt Use Table 5: Occupant Seat Belt Usage Rates by County, Page iii
5 Executive Summary For the 2014 survey of seat belt use in Wyoming, 79.2 percent of vehicle occupants were observed wearing seat belts. This result is lower than the 2013 rate, but higher than the 2012 rate. The range across all three years is less than five percentage points. In this report, we present the following: A general discussion of the results that summarizes and highlights some of the key findings. A review of the unweighted frequencies, which provides a context for the reported results. The estimates of seat belt use for all vehicle occupants, including the overall rate and the rates for the categories of the contingent variables. The estimates of seat belt use for drivers. The estimates of seat belt use for outboard passengers. The trends in the estimates across the 2012 to 2014 surveys, which represent the surveys conducted under the new methodology and the new sample implemented in An appendix that contains detailed tables and supporting documents. Discussion From June 2 to June 8, sixteen observers collected data on seat belt use in 16 Wyoming counties, covering 288 road sites. For the first time, the Wyoming observers received ipads and training in its use for the purposes of data collection. This facilitated the direct collection of observations and eliminated the need for separate pencil-andpaper based data entry. The final overall estimate of seat belt use for all observed vehicle occupants was 79.2 percent. This is an estimate based on utilization of sample probabilities for each site within each roadway type to weight the data by using the Complex Samples module in SPSS, a software package for data analysis. The standard error for the occupants who were using seat belts was 1.3 percent, well within the outside limit (2.5%) for the test of confidence in the result. The estimate of those not wearing seat belts was 20.4 percent, and for an estimated 0.4 percent of the sample, the observers were unsure about the vehicle occupant s seat belt use. These results were based on 23,723 vehicle occupants. Of these occupants, 17,613 were drivers and 6,110 were passengers. The rate of 79.2 percent belted was 2.7 percentage points below the rate of 81.9 percent in However, this drop in the rate, while perhaps disappointing and perhaps important in terms of real-life events, is not statistically significant. Two other qualifying observations are appropriate. First, the 2014 rate (79.2%) was higher than the rate for Wyoming in Second, there are 2,846 more observations in 2014 than in 2013, an increase of 13.6 points. These increased observations, made possible the use of the ipads, increased the statistical confidence in the validity of the 2014 rate, as indicated by the standard error and the confidence intervals. The passenger rate of seat belt use was 83.6 percent, while drivers were observed as belted at a rate of 77.6 percent, a difference of 6.0 points. Female vehicle occupants were estimated to have a seat belt usage rate of 85.1 percent, 10.1 points higher than the male rate of 75.0 percent. This is important because males made up six of every ten vehicle occupants in the survey. The estimates indicate that rural vehicle occupants have a considerably higher rate of seat belt use, and that occupants observed on primary roadways are more likely to be wearing seat belts than occupants on the other types of roadways. Seat belt rates for occupants of automobiles, vans, and SUVs are higher than the overall rate, but those rates are offset by the much lower rate for pickup truck occupants, so Page 1
6 much lower, in fact, that the pickup truck rate depressed the overall rate by about 5.1 percent. 1 The overall rate of seat belt use in pickup trucks was 69.9 percent and 67.2 percent for males only in pickup trucks. As in past years, the seat belt use rate was lower for occupants in Wyoming registered vehicles and higher for occupants of out-of-state vehicles. This is another factor that depresses the overall rate because more than twothirds of vehicle occupants were observed in Wyoming registered vehicles. The rate of seat belt use declined from 81.9 percent in 2013 to 79.2 percent in However, this percentage is still 2.2 percentage points higher than the rate of 77.0 percent in Females had higher rates of seat belt use across the past three years, although the gap is smaller in The rate of seat belt use in rural sites was higher than the urban rate, but the 2013 difference is greater than the rates in the other years. Rates for occupants observed on primary roads were higher than on secondary roads and lowest on local/rural/city roadways across all three surveys. Occupants of pickup trucks had the lowest rates of all. To sum up, the results for 2014 showed a lower rate of seat belt use than in 2013, but a higher rate than in This is evident in that rates for key groups declined from 2013 to 2014 (males, pickup truck occupants, occupants in Wyoming-licensed vehicles, and some counties, for example). However, the patterns of seat belt use were usually consistent across the categories of the contingent variables (driver or passenger, population density, roadway type, vehicle type, license registration, and county). There are some exceptions, noted in the narrative. For more details and supporting information, the reader may refer to the appendix of this report. 1 By examining only the occupants of automobiles, vans and SUVs, and by, omitting occupants of pickup trucks, would be the overall rate have been 84.3 percent. Page 2
7 Quality Assurance Observers All observers participated in training. The training session took place in May 2014 prior to the survey. The training included both classroom instruction and field observations. Observers participated in testing for an inter-accuracy ratio through participation in a minimum of three observation test sites. Selected test sites represented the types of sites and situations observers could expect to encounter during the actual survey. None of the practice test sites were actual sites in the sample of roadway segments. Observers worked in teams of two, observing the same vehicles but recording the observations independently on separate observation forms. Teams rotated throughout the field training to ensure that each observer was paired at least three times with a different partner. Each observer recorded type of vehicle, seat belt use, and gender data during the tests. The average inter-accuracy ratio for all observers after testing was 91.5 percent, higher than the 85 percent required by the methodology. At the conclusion of the training, observers and quality control monitors received a post-training quiz to ensure they understood the survey terminology, the data collection protocols, and the reporting requirements. The average score for all observers after testing was 92.8 percent, significantly higher than the required 80 percent. Data Compilation ipads were used to collect the 2014 seat belt survey, which required adding an ipad and survey tool training segment. The observers received basic ipad training related to the functions, features, and maintenance. All ipads were preloaded with the 2014 Seat Belt Survey data collection tool. All the observers and quality control staff received training on the individual components of the application in audio, visual, and tactile format. On day one each of the training participants were provided a period to practice using the program during the training session. After practicing in the classroom, the observers had an opportunity to complete a mock data collection period. On day two, the observers completed four data collection sessions. Three of the four data collection sessions were used to calculate their individual inter-accuracy ratios. Page 3
8 Introduction During the week of June 2 nd to June 8 th, 2014, sixteen trained observers were dispatched to sixteen counties in Wyoming with the charge to collect observations of seat belt use on vehicle occupants, including the drivers and front seat outboard passengers. Each observer covered eighteen sites in each county from the Monday to Sunday observational period, which means that 288 intersections were included in the statewide sample. The observers received instruction to follow very specific observational directions and protocols. In addition to the sixteen assigned observers, two alternate observers trained, veteran observers joined with assigned observers to conduct quality assurance reviews at randomly determined sites throughout the week. This year, for the first time, the observers recorded their observations directly into ipads instead of creating paper and pencil records, which used to require an additional and separate data entry process. DLN staff exported the data and merged the records into Excel files for vehicle drivers, passengers, and a third file for all occupants, the combined drivers, and passengers. Next, the Excel files were imported into the SPSS software program and the files were prepared for analysis, a process that involves cleaning any errors and specifying the information needed for each variable (labels, missing value codes, etc.). The actual analysis utilized the complex samples module in SPSS to weight the data in accordance with sample selection probabilities. The most important results in this report are the weighted percentages for seat belt use. However, the first section of the report reviews the unweighted frequencies for the variables in the survey. These variables include frequencies of vehicle occupants within the contextual variables associated with each occupant, that is, whether the occupant was male or female, observed in an urban or rural site, the day of the week when occupants were observed, vehicle registration status Wyoming or out-of-state license of the vehicle containing the occupants, the county associated with each occupant, the time of day of each observation, and the type of roadway associated with each vehicle occupant. Since these frequencies were unweighted, they were primarily useful for the purposes of full disclosure. However, the reader should be careful about making any inferences from this data because it does not take into account the sampling probability of each observation. The weighted estimates of seat belt use, which do take into account those sampling probabilities, follows the unweighted frequencies. In addition to the overall report of seat belt use, the main section of the report will examine estimates of seat belt use within the categories of the relevant variables (driver or passenger, male or female, vehicle type, license status, etc.). These estimates reflected a sampling plan that weights each observation based on sample probabilities and was utilized by the complex samples module in SPSS. Page 4
9 Standard Error and Confidence Intervals The overall estimate of seat belt use for Wyoming in 2014 was 79.2 percent belted among 23,723 observed vehicle drivers and outboard front seat passengers. The standard error of the mean for this estimate of belted vehicle occupants was 1.3 percent. The 23,723 observed vehicle occupants included 17, 613 drivers and 6,110 passengers. Drivers were belted at a rate of 77.6 percent, and passengers at a rate of 83.6 percent. Observers reported they were unsure about seat belt use for occupants 0.4 percent of the time. Table 1: Occupant Belts Use in Wyoming, 2014 Percent of Total Occupant Belt Use in Wyoming, 2014 Estimate Standard Error 95% Confidence Interval Lower Upper Unweighted Count Belted 79.2% 1.3% 73.3% 84.1% 18,405 Not Belted 20.4% 1.4% 14.9% 27.3% 5,207 Unsure 0.4% 0.2% 0.1% 2.8% 111 Total 100.0% 23,723 Table 1 presents the 2014 seat belt use data, which includes the confidence intervals for the weighted estimate of the seat belt use for belted vehicle occupants. Page 5
10 Observers It is an axiom of survey research that the quality of any data ultimately depends on the accuracy of the records of those who are closest to the phenomena to be measured, seat belt use in this case. The skills of the observers, harnessed by the directions and protocols, are the most important determinants of the quality of this survey. Table 2 identifies each observer and his or her assigned county of observation. Table 2: Observers by County of Observations, Wyoming 2014 Observers by County of Observations, Wyoming 2014 Observers County Observations Total Percent Dorothy Johnstone Bighorn % Sandy McCleery Laramie % Samantha Anderson Natrona % Deanna Frey Fremont 1,137 1, % Dallas Darden Laramie 1,137 1, % Brianna Beck Lincoln 1,183 1, % Eric Johnson Campbell 1,206 1, % Kristi Holifield Sheridan 1,501 1, % Monty Byers Albany 1,552 1, % Vicky Peterson Platte 1,552 1, % Trevice Fifield Johnson 1,569 1, % Kayla Shear Uinta 1,646 1, % Darcy Ronne Park 1,736 1, % Derek Bacon Campbell 1,813 1, % Bill Spencer Sweetwater 1,929 1, % Chereon Hoops Teton 3,555 3, % Totals 23,723 23, % Average 1,483 The number of observations varied because of the differences in traffic among the different counties. The average number of observations for each observer was 1,483, for 23,723 vehicle occupants. Page 6


11 Frequencies This section is devoted to frequencies not weighted by sampling probabilities. 2 Similarly, these are not estimates but the actual numbers of observations, presented within the categories of the major variables. The weighting process adjusts the actual observations, producing the estimates of seat belt use expressed in percentages. Observers recorded information on drivers and outboard, front seat passengers for each observed vehicle. For the 2014 survey, 17,613 vehicles were observed, and there were no passengers in 11,503, or 65.3 percent, of the vehicles. There were 6,110 vehicles, or 34.6 percent, that did contain passengers. These percentages are nearly identical to those from the 2013 survey, when 64.7 percent of the vehicles had only drivers. When the drivers (17,613) and the passengers (6,110) were added together, we arrive at 23,723 vehicle occupants for There were 20,877 vehicle occupants in the 2013 sample. Therefore, there were 2,846 more observations in 2014, an increase of 13.6 points from 2013 to From a speculative standpoint, it is possible that this increase may be due to a more efficient process of direct data entry on ipads, rather than the paper and pencil entry process used in prior years, although it may be simply due to an increase in vehicle traffic between 2013 and Figure 1 demonstrates the basic frequencies for vehicles, with and without passengers. Figure 1: Frequencies with and without passengers 20,000 18,000 16,000 14,000 12,000 10,000 8,000 6,000 4,000 2, ,613 11,503 6,110 With Passengers Without Passengers Total Vehicles 2 These raw frequencies do not take into account the adjustments made for sampling probabilities to produce the more accurate estimates. Therefore, the percentages are not reported here because they would not be accurate estimates of seat belt use and would be misleading. 3 The total frequencies represent all the vehicle occupants for which seat belt usage was recorded, although this does reflect instances in which observers were unsure about seat belt use. Page 7

12 Occupant Belt Use: For the 23,723 vehicle occupants, 18,405 were observed as wearing seat belts; 5,207 were not belted, and observers were unsure about belt use for 111 of the vehicle occupants. Figure 2: Frequencies by Occupant Belt Use 25,000 23,723 20,000 18,405 15,000 10,000 5, , Belted Not Belted Unsure Total Occupant Gender: Observers identified 13,967 vehicle occupants as male and 9,648 as female, accounting for all 23,723 vehicle occupants. Figure 3: Frequencies by Occupant Gender 25,000 23,615 20,000 15,000 13,967 10,000 9,648 5,000 0 Male Female Total Page 8

13 County: Observations were collected within each of 16 counties. The average number of observations per county was 1,483 for the 2014 survey. However, there was considerable variation in traffic among the various counties. Counties with above average vehicle occupants include Albany, Campbell, Johnson, Park, Platte, Sheridan, Sweetwater, Teton, and Uinta Counties. The rest (Big Horn, Carbon, Fremont, Laramie, Lincoln, Natrona, and Sublette) were below the average number of observations. Figure 4: Frequencies by County 4,000 3,500 3,000 2,500 2,000 1,500 1, Population Density: For Wyoming, sites with fewer than 5,000 residents are defined by the state as rural, while urban sites have a population of more than 5,000. Given this definition, the great majority of vehicle occupants, 17,424, were observed in rural sites; 6,299 occupants were observed in urban areas. This affirms the essentially rural character of Wyoming. Figure 5: Frequencies by Population Density 25,000 23,723 20,000 17,424 15,000 10,000 6,299 5,000 0 Urban Rural Total Page 9


14 Roadway Type: One of the factors that influence the site sampling, and, therefore, the sample weights, is the type of roadway. There are three types of roadway in the sample: primary roads, which include four-lane highways and interstates; secondary roads, which are mostly federal and state-maintained highways; and local roadways, which are mostly local roads and city streets. Customarily, the greatest majority of observations were collected on secondary roads while the fewest observations were made on the local, rural, or city roadways. Figure 6: Frequencies by Roadway Type 25,000 23,723 20,000 16,728 15,000 10,000 5,000 5,731 1,264 0 Primary Secondary Loc-Rur-City Total Day of Week: Observers collected data for all the days of the week. In 2014, observers collected an average of 3,389 observations per day. The number of observations was above the average on Monday and Friday, fairly close to the average on Thursday, and below the average the rest of the days. Figure 7: Frequencies by Day of Week 7,000 6,000 5,000 4,000 3,000 2,000 1,367 5,126 2,941 2,842 3,634 5,778 2,035 3,389 1,000 0 Page 10


15 Weekday vs. Weekend: For 2014, weekdays accounted for 20,321 of the 23,723 vehicle occupants. The weekend accounted for 3,402 drivers and passengers. Figure 8: Frequencies by weekend and weekday 25,000 20,000 20,321 15,000 10,000 5, ,402 Weekend Weekday Vehicle Type: Observers collected data on four types of vehicles autos, vans, SUVs, and pickup trucks. For this survey, most of the vehicle occupants were observed in pickup trucks, which suggests pickups were a top choice among vehicle drivers in Wyoming. The omnipresent automobile, were second in terms of occupants in this survey. Together, pickups and autos account for 15,630 of the occupants in this survey. Vans were also popular with vehicle occupants. However, relatively few of the drivers and passengers were, at 6310 observed in SUVs. Figure 9: Frequencies by Vehicle Type 9,000 8,461 8,000 7,000 6,000 5,000 4,000 7,169 6,310 3,000 2,000 1,783 1,000 0 Auto Van SUV Pickup Page 11
16 Vehicle Registration Type: Observers collected information on the type of license plates for each vehicle, identifying their observations as either Wyoming registration or out-of-state registration. Observers also noted if they were unsure about the vehicle registration associated with each vehicle occupant. For this year, as in past surveys, the great majority of occupants were observed in Wyoming-licensed vehicles, 16,202 of the 23,723 vehicle occupants. There were 7,151 in out-of-state licensed vehicles, and observers were unsure about license status for 370 vehicle occupants. Figure 10: Frequencies by Registration Type 18,000 16,000 16,202 14,000 12,000 10,000 8,000 7,151 6,000 4,000 2, Wy License Other Unsure Page 12
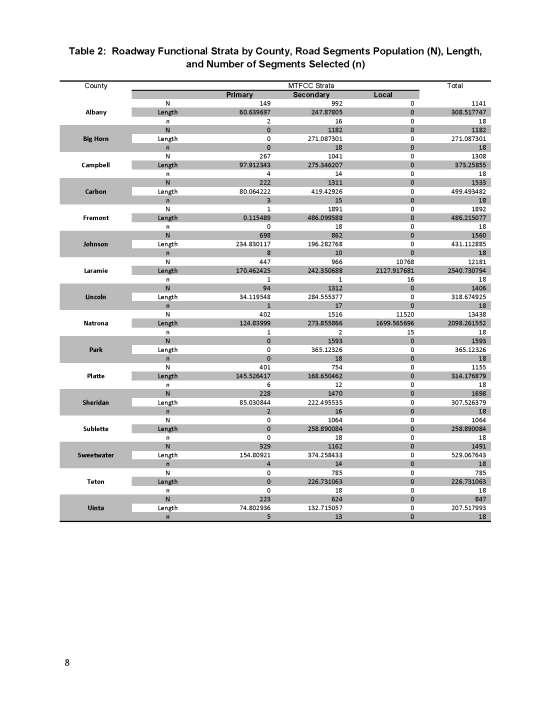
17 Vehicle Type by County: Table 3 presents the unweighted number of vehicles within each vehicle type for each county in the sample. The unweighted number can be misleading when it comes to estimates of seat belt use, but, in this case, the average number of vehicle occupants in pickups overall and the number for each county were included. These numbers were offered for those readers who may wish to make comparisons, largely because occupants of pickup trucks tend to have much lower rates of seat belt use. It follows that counties with an above average number of occupants in pickups may expect lower seat belt usage rates, although this is not necessarily true because of the effects of other variables. The counties of Big Horn, Campbell, and Sublette had the highest proportions of occupants in pickup trucks relative to occupants in other vehicles. On the other hand, Teton County has a relatively small number of occupants in pickup trucks relative to occupants of other vehicle types. Most of the rest of the counties were within a few percentage points of the average number of occupants of pickup trucks. Table 3 illustrates the occupants by vehicle type for the counties. Table 3: Frequencies of Vehicle Types by County, Wyoming 2014 Vehicle Type County Auto Van SUV Pickup Total Percent of Site Total Albany , % Big Horn % Campbell , % Carbon , % Fremont , % Johnson , % Laramie , % Lincoln , % Natrona % Park , % Platte , % Sheridan , % Sublette % Sweetwater , % Teton 1, , % Uinta , % Total 7,169 6,310 1,783 8,461 23, % Average , % Page 13


18 Estimates of Occupant Seat Belt Use In this section, the estimates of seat belt use were reported for the 2014 Wyoming seat belt survey. These estimates were calculated after weighting the data to take into account sampling probabilities. The estimates were presented for each of the major variables and the categories within those variables. Type of Occupant: The rate of seat belt use for passengers was 83.6 percent, while drivers were observed as belted at a rate of 77.6 percent. The seat belt use rate was 6.0 points higher for passengers than it was for drivers. The overall estimate of seat belt use for all vehicle occupants is 79.2 percent. Figure 11 demonstrates these results. Figure 11: Percent Belted by Occupant Type 100.0% 80.0% 77.6% 83.6% 60.0% 40.0% 20.0% 0.0% Drivers Passengers Occupant Gender: The estimated seat belt use for females was 85.1 percent, which is 10.1 percentage points higher than the male rate of 75.0 percent. Because males made up nearly 60.0 percent of the occupants, their lower rate of seat belt use suppressed the overall rate. This is a typical finding in Wyoming surveys, although the 10.1 points difference is greater than the difference for 2013, which was 6.6 points. Figure 12: Percent Belted by Occupant Gender 100.0% 80.0% 75.0% 85.1% 60.0% 40.0% 20.0% 0.0% Male Female Page 14
 include Albany, Lincoln, Park, Platte, Sublette, and Teton Counties. Platte and Teton Counties had the highest rates of seat belt use for vehicle occupants.")
19 County: Figure 13 illustrates the rate of seat belt use by county. Counties that were above the overall rate of seat belt use (79.2 percent) include Albany, Lincoln, Park, Platte, Sublette, and Teton Counties. Platte and Teton Counties had the highest rates of seat belt use for vehicle occupants. Teton County typically had the highest rate of seat belt use, although the Teton rate for vehicle occupants dropped from 98.6 percent in 2013 to 90.1 percent in this year s survey, a decline of 8.5 percentage points. Counties that were considerably below the overall rate were Big Horn, Campbell, Laramie, Natrona, Sheridan, and Uinta Counties. Vehicle occupants in Sheridan County had the lowest rate of seat belt use, while occupants in Uinta County also had a relatively low rate of seat belt use. Figure 13: Percent Belted by County of Observation 100.0% 90.0% 80.0% 70.0% 60.0% 50.0% 40.0% 30.0% 20.0% 10.0% 0.0% 57.3% 64.9% 67.6% 71.5% 72.8% 72.9% 77.0% 77.3% 78.2% 78.8% 79.2% 81.5% 84.1% 84.3% 86.7% 90.1% Population: The rate of seat belt use for vehicle occupants observed in rural sites was 81.0 percent, which is 7.8 percentage points higher than the rate of 73.2 percent for vehicle occupants in urban sites. Since occupants in rural sites represent nearly three-fourths of the vehicle occupants, their rate of seat belt use tended to determine most of the overall rate. Figure 14: Percent Belted by Population 100.0% Belted Not Belted Unsure 80.0% 60.0% 73.2% 81.0% 79.2% 40.0% 20.0% 26.7% 18.5% 20.4% 0.0% 0.2% 0.5% 0.4% Urban Rural State Page 15
20 Roadway Type: The rates of seat belt use for vehicle occupants were 82.7 percent for primary roadways, 78.2 percent for secondary roadways, and 69.9 percent for vehicle occupants observed on local roads, rural roads, and city streets. Most of the overall rate of seat belt use was determined by vehicle occupants observed on secondary roads, mainly because they represented about seven of every ten vehicle occupants. Figure 15: Percent Belted by Roadway Type 100.0% Belted Not Belted Unsure 80.0% 60.0% 82.7% 78.2% 69.9% 40.0% 20.0% 16.4% 21.5% 29.9% 0.0% 0.9% 0.3% 0.1% Primary Secondary Loc/Rur/City Weekday: Vehicle occupants were most likely observed as belted on Sunday and Tuesday in the 2014 weeklong survey. Seat belt use was lowest on Friday. The rates on other days of the week hovered around the overall average. Figure 16: Percent Belted by the Day of the Week 100.0% 80.0% 60.0% 40.0% 20.0% 0.0% Sunday Monday Tuesday Wednesday Thursday Friday Saturday Belted 87.6% 79.9% 86.2% 77.7% 78.0% 73.0% 78.6% Not Belted 12.4% 19.7% 13.5% 21.2% 21.7% 26.8% 20.7% Unsure 0.0% 0.4% 0.3% 1.0% 0.3% 0.2% 0.6% Page 16
21 The Weekend: The high rate of seat belt use on Sunday accounted for an overall higher rate of use on the weekend, although this was offset some by the high rate of use on Tuesday. As a result, the difference between weekend and weekday seat belt use is only 3.3 percentage points as illustrated in Figure 17. Figure 17: Percent Belted by Weekdays vs. Weekend 100.0% Belted Not Belted Unsure 80.0% 60.0% 82.0% 78.7% 40.0% 20.0% 0.0% 17.6% Weekend 20.9% 0.4% 0.4% Weekdays Vehicle Type: For 2014, just as for 2013, the rates of seat belt use were above the overall rate for all vehicle types (automobiles, vans, SUVs) except for occupants in pickup trucks, who had a much lower rate of seat belt use. Seat belt use was 13.3 percentage points higher for automobile occupants, 15.1 for van occupants, and 14.8 for SUV occupants than it was for vehicle occupants in pickup trucks. In fact, if pickup truck observations were omitted, the overall rate of seat belt use would rise to about 84.3 percent, or 5.1 percentage points higher than the overall rate of 79.2 percent. Figure 18: Percent Belted by Vehicle Type 100.0% Belted Not Belted Unsure 80.0% 83.2% 85.0% 84.7% 69.9% 79.2% 60.0% 40.0% 20.0% 16.3% 14.7% 14.9% 26.6% 20.4% 0.0% 0.4% 0.3% 0.4% 0.5% 0.4% Auto Van SUV Pickup Total Page 17

22 Vehicle Type and Gender: Female vehicle occupants had higher rates of seat belt use in every vehicle type, including pickup trucks. For males in pickup trucks, the rate of seat belt use was 67.2 percent, 12 points lower than the overall rate of 79.2 percent of the sample. Females were also less likely to wear seat belts when they were observed in pickup trucks, but that rate for females was 79.6 percent, still higher than the overall rate. The diminished tendency for seat belt use for pickup truck occupants suppressed the overall rate of seat belt use, especially for males. Generally, the rates for male and female vehicle occupants were similar in automobiles, vans, and SUVs, ranging from a low of 80.6 percent for males in automobiles, to a high of 88.1 percent for females in SUVs. For 2014, just as for previous surveys of seat belt use in Wyoming, the least use of seat belts involves men in pickup trucks. Figure 19: Percent Belted by Vehicle and Gender 100.0% 80.0% 80.6% 85.7% 86.7% 88.1% 82.9% 81.6% Male Female 85.1% 79.6% 75.0% 67.2% 60.0% 40.0% 20.0% 0.0% Auto Van SUV Pickup Total Vehicle Registration Type: Vehicle occupants observed in out-of-state vehicles were belted at a rate of 86.7 percent, which was 11 points higher than the rate of 75.7 percent for occupants observed in Wyoming registered vehicles. The out-of-state rate tended to increase the overall rate, but occupants in Wyoming vehicles represented more than two-thirds of the occupants in this survey. The rate was lowest for vehicle occupants when observers were unsure about the vehicle licensing, but those occupants represented less than 2.0 percent of the sample. Figure 20: Percent Belted by Registration Type 100.0% 80.0% 60.0% 75.7% Belted Not Belted Unsure 86.7% 79.2% 67.6% 40.0% 20.0% 23.9% 12.8% 31.8% 20.4% 0.0% 0.4% 0.5% 0.7% 0.4% Wyoming Out-of-State Unsure Total Page 18
23 Estimates of Seat Belt Use for Drivers In this section, the drivers were isolated for analysis. The patterns for drivers were typically the same as for all occupants, largely because drivers represented nearly three-fourths (74.2%) of the vehicle occupants: drivers represented 17,613 of the 23,723 vehicle occupants. Although passengers made up a small part of the overall sample, their higher rates of seat belt use tended to modestly increase the rates of occupants over the rates for the drivers alone. Driver Gender: Male drivers were observed as belted at a rate of 75.2 percent, while the rate for female drivers was 82.7 percent, a difference of 7.5 points. Because of the lower rate by males, the overall rate for drivers dropped to 77.6 percent. The higher rate for females raised the overall rate by 2.4 points in this survey, which is nearly identical to the gender effect measured in the 2013 survey. Figure 21: Percent of Drivers Belted by Driver Gender 100.0% Belted Not Belted Unsure 80.0% 75.2% 82.7% 77.6% 60.0% 40.0% 20.0% 24.6% 17.2% 22.3% 0.0% 0.2% 0.1% Male Female Total 0.1% Page 19


24 County: Counties where the estimated rates of seat belt use were above the overall average of 77.6 percent included Albany, Johnson, Lincoln, Park, Platte, Sublette, and Teton Counties. The highest rate was found in Teton County at 88.9 percent. It should be noted that Teton County has typically had the highest wage rate in Wyoming surveys, although the rate in 2014 was 9.7 points lower for drivers than it was in 2013, when nearly every driver in Teton County was observed as wearing a seat belt (98.6 percent). Counties where seat belt use was considerably lower than average in this year s survey included Big Horn, Campbell, and Sheridan Counties. Figure 22: Percent of Drivers Belted by County 100.0% 90.0% 80.0% 70.0% 60.0% 50.0% 40.0% 30.0% 20.0% 10.0% 0.0% Page 20
 was observed at a rural site, their higher rate of seat belt use increased the overall rate.")
25 Population: The rate of seat belt use for drivers observed in rural sites was 79.4 percent, which was 7.5 percent higher than the rate of 71.9 percent for drivers in urban areas. Because seven out of every ten drivers (72.2 percent) was observed at a rural site, their higher rate of seat belt use increased the overall rate. Figure 23: Percent of drivers belted by population density 100.0% Belted Not Belted Unsure 80.0% 60.0% 71.9% 79.4% 40.0% 20.0% 0.0% 28.0% Urban 20.4% 0.1% 0.2% Rural Roadway Type: Drivers observed on primary roads were observed as belted 81.5 percent of the time. The rate on secondary roadways was 5.0 percentage points lower at 76.5 percent, and the rate on local, rural and city roadways is 70.8 percent, 10.7 points lower than the rate associated with primary roads. The rate on secondary roads (76.5%) was closest to the overall rate (77.6%) because drivers on secondary roads represented 70.6 percent of the sample. Figure 24: Percent of Drivers Belted by Roadway Type 100.0% Belted Not Belted Unsure 80.0% 81.5% 76.5% 70.8% 60.0% 40.0% 20.0% 18.2% 23.4% 29.2% 0.0% 0.3% 0.1% 0.0% Primary Secondary Loc/Rur/City Page 21

26 Weekdays: Drivers were more likely to be wearing seat belts when observed on a Sunday or Tuesday, and least likely to be belted on Friday. In fact, the Sunday rate is 16.1 percentage points higher than the Friday rate. The rates on the other days are much closer to the average of 77.6 percent. Figure 25: Percent of Drivers Belted by Day of Week 100.0% Belted Not Belted Unsure 86.6% 85.4% 80.0% 78.1% 77.6% 76.3% 70.5% 76.6% 60.0% 40.0% 20.0% 13.4% 21.5% 14.4% 22.2% 23.6% 29.5% 23.4% 0.0% 0.0% 0.3% 0.1% 0.2% 0.1% 0.0% 0.0% Sunday Monday Tuesday Wednesday Thursday Friday Saturday Weekday vs. Weekend: Because of the high rate on Sunday and a Saturday rate that is closest to the average, the weekend rate of 80.2 percent is modestly higher than the weekday rate of 77.2 percent. Because the five weekdays produce more observations than the two weekend days, the weekday observations account for most of the overall average. Figure 26: Percent of Drivers Belted by Weekends vs. Weekdays 100.0% Belted Not Belted Unsure 80.0% 60.0% 80.2% 77.2% 77.6% 40.0% 20.0% 19.8% 22.6% 22.3% 0.0% 0.0% 0.2% 0.1% Weekend Weekdays Total Page 22
27 Vehicle Type: Drivers in pickup trucks were observed as belted at a rate of 68.3 percent, which is 14.8 percentage points higher than the combined average for drivers in automobiles, vans, and SUVs (83.6 %). Drivers in these automobiles, vans, and SUVs were belted at almost identical rates. Figure 27: Percent of Drivers Belted by Vehicle Type 100.0% Belted Not Belted Unsure 80.0% 82.2% 83.6% 83.6% 68.3% 77.6% 60.0% 40.0% 31.5% 20.0% 17.6% 16.3% 16.3% 22.3% 0.0% 0.2% 0.1% 0.1% 0.1% 0.1% Auto Van SUV Pickup Total Vehicle Registration Type: Drivers in out-of-state vehicles were observed wearing seat belts 84.9 percent of the time, a rate that is 10.2 points higher than the comparable rate for drivers in Wyoming-registered vehicles (74.7%). The out-of-state drivers tend to increase the overall rate, but, because drivers in Wyoming-registered vehicles constitute 71.6 percent of the sample, their average of 74.7 percent is much closer to the overall driver rate of 77.6 percent. Generally, observers were very sure of their classification by license status: observers said they were unsure about license status only 0.3 percent of the time. Figure 28: Percent Drivers Belted by Registration Type 100.0% Belted Not Belted Unsure 80.0% 74.7% 84.9% 77.6% 60.0% 67.9% 40.0% 20.0% 25.1% 15.0% 31.8% 22.3% 0.0% 0.1% 0.1% 0.3% 0.1% Wyoming Out-of-State Unsure Total Page 23
28 Driver Gender and Vehicle Type: Male drivers made up three-fourths of all drivers in the sample, so their behavior toward seat belt use is very important to this report. However, male and female rates of seat belt use were very much alike, with female rates only slightly higher, in automobiles, vans, and SUVs. For those vehicles, the seat belt usage rates for male and female drivers ranged from a low of 81.5 percent to a high of 85.7 percent. The story is much different for drivers in pickup trucks. First, 5,742 of the 6,583 drivers of pickup trucks were males, or 87.2 percent of the sample of pickup truck drivers. Their rate of seat belt use was 67.9 percent, nearly ten points lower than the overall rate and almost fifteen points lower than the overall rate for female drivers. It is true that women pickup truck drivers have the lowest seat belt usage rate among women at 76.3 percent, but that rate is only 1.3 percent below the overall rate for all drivers (77.6%). Nearly four out of ten drivers were observed in pickup trucks; almost nine out of ten were males. That combination of males in pickup trucks, given their relatively low rate of seat belt use, is very important when it comes to seat belt use in Wyoming. Figure 29: Percent of Drivers Belted by Gender and Vehicle Type 100.0% Male Female 80.0% 81.5% 83.1% 83.1% 84.2% 85.7% 82.5% 76.3% 75.2% 82.7% 67.2% 60.0% 40.0% 20.0% 0.0% Auto Van SUV Pickup Total Page 24
29 Estimates of Seat Belt Use by Passengers In this section, seat belt use by outboard passengers is presented for the same variables as for occupants and drivers. In each case, graphs and tables will illustrate the narrative, with more detail presented in the appendix to this report. It is appropriate at this point to remind readers that passengers had a higher rate of seat belt use at 83.6 percent than did driver at 77.6 percent. The passenger rate has the effect of raising the overall rate to 79.2 percent. However, the 6,110 passengers in this survey represent only about one of every four vehicle occupants in the sample (25.8 percent); the much larger number of drivers (17,613) were the major determiners of the overall rate. It has been typical in Wyoming surveys to find higher rates of seat belt use by passengers for every combination of variables in the survey. However, the patterns of seat belt use within the categories, while higher, will look very much like the patterns being presented for drivers, and, when passengers are added, all vehicle occupants. Gender: While drivers were more often male, passengers were more likely to be female. For the 2014 survey, females made up two-thirds (66.1%) of the passengers, and males were a third (33.9%) of the passengers. The female passengers were observed as belted 88.4 percent of the time, while males were belted at a rate of 73.5 percent, a difference of 14.9 percent. The higher number of females and the much greater tendency of females to use seat belts contributed to the higher overall rate of seat belt usage for passengers (83.5%). Figure 30: Percent of Passengers Belted by Gender 100.0% Belted Not Belted Unsure 80.0% 60.0% 73.5% 88.4% 83.5% 40.0% 25.5% 20.0% 0.0% 10.3% 15.3% 1.0% 1.3% 1.2% Male Female Total Page 25
 in the counties of Albany, Big Horn, Carbon, Lincoln, Park, Platte, Sublette, Sweetwater, and Teton Counties, with the highest rate in Teton County (92.7%).")

30 County: Individual county seat belt use for passengers exceeded. The overall average for passengers (83.6 %) in the counties of Albany, Big Horn, Carbon, Lincoln, Park, Platte, Sublette, Sweetwater, and Teton Counties, with the highest rate in Teton County (92.7%). The lowest rate for passenger seat belt use was in Sheridan (58.8%), while below average rates were also found in Campbell, Johnson, Laramie, Natrona, and Uinta Counties. All of the counties had fewer than 500 observed passengers with the exception of Teton County with 1,112 passengers, where we find nearly one-fifth of the 6,110 passengers and the second highest rate of passenger seat belt use at 92.7 percent. Figure 31: Percent of Passengers Belted by County 100.0% 90.0% 80.0% 70.0% 60.0% 50.0% 40.0% 30.0% 20.0% 10.0% 0.0% 89.8% 86.6% 77.3% 85.9% 81.1% 74.8% 71.6% 86.7% 75.1% 84.2% 92.9% 58.8% 88.1% 84.8% 92.7% 61.6% 83.6% Population: Passengers observed in rural sites were observed as belted 85.3 percent of the time, which is slightly higher (1.7%) than the overall rate for passengers (83.6%). Passengers in rural sites accounted for more than threefourths (85.3%) of the passengers in the survey. Figure 32: Percent of Passengers Belted by Population Type 100.0% Belted Not Belted Unsure 80.0% 60.0% 77.2% 85.3% 83.6% 40.0% 20.0% 22.3% 13.3% 15.2% 0.0% 0.5% 1.4% 1.2% Urban Rural Total Page 26
 on primary roadways, which are mostly federal and state-maintained highways.")
. Passengers observed within secondary roadways represent 70.2 percent of the sample, while passengers in primary roadways are 25.3 percent of the sample.")
31 Roadway: Passengers observed in primary road sites, which include four-lane interstate highways, had the highest rate of seat belt use at 86.0 percent. The seat belt usage rate was slightly lower (83.0%) on primary roadways, which are mostly federal and state-maintained highways. The lowest rate was found among passengers observed in the remaining category that include local, rural and city roadways; that rate is 66.8 percent, which is 16.8 points lower than the overall rate (83.6%). Passengers observed within secondary roadways represent 70.2 percent of the sample, while passengers in primary roadways are 25.3 percent of the sample. The passengers in local, rural and city roadways, who had the much lower rate of seat belt use, account for only 4.4 percent of the passengers in the survey, so their seat belt usage rate, while low, has relatively little effect on the overall rate. Figure 33: Percent of Passengers Belted by Roadway Type 100.0% 80.0% 60.0% 86.0% Belted Not Belted Unsure 83.0% 83.6% 66.8% 40.0% 32.6% 20.0% 0.0% 16.2% 15.2% 11.3% 2.6% 0.8% 0.7% 1.2% Primary Secondary Loc/Rur/City Total Weekdays: The pattern for passengers is similar to the overall pattern of seat belt use for weekdays. The highest rates were observed Sunday, Tuesday, and Saturday, with the lowest rate on Wednesday. However, the day of the week counted for relatively little in terms of the variation in the seat belt usage rate. The low rate on Wednesday (78.1%) was 5.5 points lower than the overall rate for passengers (83.6%), while the high rate for Sunday passengers (90.3%) was 6.7 points higher than the overall passenger rate. Saturday and Sunday passengers represented 18.3 percent of the entire sample. Figure 34: Percent of Passengers Belted by Day of Week 100.0% 80.0% 90.3% 85.1% Belted Not Belted Unsure 88.3% 78.1% 82.6% 80.5% 82.5% 83.6% 60.0% 40.0% 20.0% 0.0% 18.5% 16.4% 18.7% 14.1% 15.6% 15.2% 9.7% 10.8% 0.0% 0.8% 0.9% 3.4% 0.9% 0.8% 1.9% 1.2% Sunday Monday Tuesday Wednesday Thursday Friday Saturday Total Page 27

32 Weekday vs. Weekend: Given the results for individual days of the week, it is not surprising to find that weekend passengers had the higher rate of 85.5 percent, compared to a weekday rate of 83.2 percent, a difference of 2.3 points. Weekday passengers represented 81.7 percent of the passengers in the survey. Figure 35: Percent of Passengers Belted by Weekday vs. Weekend 100.0% 80.0% 85.5% Belted Not Belted Unsure 83.2% 83.6% 60.0% 40.0% 20.0% 13.3% 15.6% 15.2% 0.0% 1.2% 1.2% 1.2% Weekend Weekdays Total Vehicle Type: There were only modest differences among passengers in automobiles, vans and SUVs; passenger seat belt usage rates in these three vehicle types all exceeded the overall rate. However, passengers in pickup trucks had a much lower rate of 75.1 percent belted, which was 8.5 points lower than the overall rate (83.6 percent). Pickup truck passengers represented the largest proportion of the sample at 30.7 percent so this low rate of seat belt use had a considerable effect on the overall rate. However, the rate for automobile passengers at 86.1 percent and van passengers at 88.5 percent offset much of the low rate found for passengers in pickup trucks. The rate for passengers in SUVs, while the highest rate at 89.9 percent, had relatively little effect on the overall rate for passengers because van passengers represented less than ten percent of the sample (9.7%). Figure 36: Percent of Passengers Belted by Vehicle Type 100.0% Belted Not Belted Unsure 80.0% 86.1% 88.5% 89.9% 75.1% 83.6% 60.0% 40.0% 20.0% 0.0% 23.2% 12.9% 10.6% 12.1% 15.2% 1.1% 0.9% 1.0% 1.7% 1.2% Auto Van SUV Pickup Total Page 28

33 Gender and Vehicle Type: The rates of seat belt use for females were higher than the rate for males in every type of vehicle. The rate was greater for females in automobiles by 14.2 percent, in vans by 8.4 percent, in SUVs by 12.8 percent, and in pickups by a whopping 21.0 percent. These differences accounted for the overall difference between males and females as passengers, a difference of 14.9 percent. While female passengers were least likely to be belted in pickup trucks, which at a rate of 88.4 percent was still 4.8 points above the overall rate. On the other hand, the male passenger rate in pickup trucks, at 67.4 percent, was 16.2 points below the overall rate. Finally, one of the reasons why the rate for passengers is higher is because females represented nearly two-thirds of the passengers observed in this survey. Figure 37: Percent of Passengers Belted by Gender and Vehicle Type 100.0% 80.0% 75.5% 89.7% 90.5% 90.4% 82.1% 77.6% 67.4% Male Female 88.4% 82.5% 73.5% 60.0% 40.0% 20.0% 0.0% Auto Van SUV Pickup Total Vehicle Registration: Passengers observed in out-of-state vehicles were observed as belted at a rate of 90.2 percent, which is 11.0 points higher than the rate for passengers in Wyoming vehicles (79.2%). The overall rate is not higher because Wyoming vehicle passengers represented 58.9 percent of the sample, so their lower rate tended to suppress the overall rate. Observers were unsure about the license status of vehicles for 1.2 percent of the sample. Figure 38: Percent of Passengers Belted by Registration Type 100.0% Belted Not Belted Unsure 80.0% 79.2% 90.2% 83.6% 60.0% 66.5% 40.0% 20.0% 0.0% 31.7% 19.5% 15.2% 8.8% 1.3% 1.1% 1.8% 1.2% Wyoming Out-of-State Unsure Total Page 29
34 Trends: A Discussion In this section, some of the trends across the three surveys from 2012 to 2014 were reviewed. These survey results are a reflection the new methodology developed and first implemented in Since that time, the sample sites and the procedures for collecting observations have been essentially the same. All that is different are the actual observations, and one change in the data collection process: the observers directly entered the data by utilizing Apple ipads. As in the past, the observations were downloaded into Microsoft Excel files, which were then loaded into SPSS software for preparation of the final data set, followed by the data analysis. The Observations and Direct Data Entry The first trend item of note is the increased number of observations, from 20,877 in 2013 to 23,723 in 2014, as 13.6 percentage points increased in observations. Based on the monitoring of the observers, it is likely that the process of direct data entry has advantages over the paper and pencil methods of the past and may account for some of the increase in observations. 4 Whether that is true, it can be said that the process was simpler and more efficient, because the paper forms were eliminated and an extra data entry step from the forms to Excel was gone. Also, the extra data entry from the paper forms created opportunities for additional errors in the data records of the past. With the new process, one more source of errors was reduced. All told, it could be concluded that the direct data entry by observers was simpler and more efficient, contributed to the increase in observations, and reduced the number of coding errors in the data. Seat Belt Use Trends: Figure 39: Occupant Seat Belt Usage Rates in Wyoming for % 82.0% 81.9% 81.0% 80.0% 79.0% 79.2% 78.0% 77.0% 77.0% 76.0% 75.0% For all vehicle occupants, the rate of seat belt usage was 77.0 percent in 2012, 81.9 percent in 2013, and 79.2 percent in The rate increased by 4.9 points from 2012 to 2013, and then dropped 2.7 points in the current 2014 survey. 4 Of course, the increase may be due to increased traffic, in part or in whole. But, even if that is the case, the more efficient process of direct data entry likely made it easier to capture that increase. Page 30
35 When it comes to seat belt use, increased rates are a cause for celebration and decreased rates are a source of disappointment, justifiably because of the well-established link between safety and seat belt use. However, there is another way to evaluate trends: the determination of whether changes are statistically significant. To determine the statistical significance, the 2013 and 2014 data files were merged and the Complex Samples module was used to compare seat belt usage rates in terms of a Chi-Square test of significance. The results were presented in the following table. Table 4: Year * Occupant Seat Belt Use Year * Occupant Seat Belt Use Year 2013 % within Year 2014 % within Year Total % within Year Occ Belt Use Not Belted Belted Unsure Total Estimate 81.9% 17.1% 1.0% 100.0% Unweighted Count Estimate 79.2% 20.4%.4% 100.0% Unweighted Count Estimate 80.5% 18.8%.7% 100.0% Unweighted Count Year * Occ Belt Use Tests of Independence Adjusted Chi-Square F df1 df2 Sig. Pearson Likelihood Ratio The adjusted F is a variant of the second-order Rao-Scott adjusted chi-square statistic. Significance is based on the adjusted F and its degrees of freedom. The standard for evaluating a test of significance is the.01 level of significance. 5 At that level, the appropriate interpretation is that the observed difference must be statistically significant and would occur by chance only one time in a hundred samples. For our comparison of the 2013 and 2014 rates, the Chi-Square significance is.110, which leads us to conclude that the decrease between 2013 and 2014 is not statistically significant. Our samples might reveal a difference, but that difference may be due to chance. In any case, we do not want to be too confident in emphasizing the decrease in seat belt use from 2013 to It is just as likely that the 2013 rate was an anomaly, unusually high for any number of reasons, and that the 2014 rate may be closer to the actual rate that would be found in an infinite number of samples for the seat belt surveys in Wyoming. 5 Sometimes statisticians use a more relaxed standard, at the.05 or.10 level of significance. This does not matter in this case because the significance level of.110 is above any of these norms. Page 31
36 Additional Trends In addition to the above analysis of the overall trend in seat belt use in Wyoming between 2012 and 2013, the following presents the trends for the major variables in the Wyoming surveys. For each of the trend lines, there is an appropriate accompanying graph illustrating the results. Gender: For each of the three surveys, the seat belt usage rate for female vehicle occupants was greater than the male rate. The difference was greatest in the current 2014 survey (the female rate was 10.1 points higher, with a comparable difference in 2012 (9.2%), and the lowest difference in 2013 (6.6%). As in the rate for all occupants, the rates by gender for 2012 and 2014 have a similar gender gap; 2013 had a gender difference in rates that was substantively lower, making it the aberration for the three years. However, it should be noted that female seat belt usage rates were likely to be higher than male rates in every survey of seat belt use, and this pattern was true across most combinations of variables. Figure 40: Occupant Seat Belt Rates by Gender % Male Female 90.0% 82.7% 85.9% 85.1% 80.0% 70.0% 73.5% 79.3% 75.0% 60.0% Page 32
37 Population: The rural rate tends to be higher than the urban rate of seat belt use in Wyoming surveys. This was particularly true in 2013, when the rural rate is higher by 12.1 points and 2014 when the rural rate was higher by 7.8 percent. For this variable, the 2012 survey produced an anomalous result, with a difference of only 2.1 points. The higher rural rate is a persistent finding. Figure 41: Occupant Seat Belt Rates by Population Density, % Urban Rural 90.0% 84.5% 81.0% 80.0% 76.5% 78.6% 70.0% 72.4% 73.2% 60.0% Roadway: For all three years, seat belt use was highest for vehicle occupants observed on primary roads. Primary roads include four-lane and interstate highways, where higher seat belt rates are typically above average in surveys. Seat belt usage rates were usually closer to the average on secondary roadways, which include state and federally maintained highways. Local, rural and city roadways usually have the lowest rates, often well-below average. This pattern held true for all three Wyoming surveys. The difference between primary and local/rural/city roads was greatest, at 12.8 points in 2014 and 14.2 points in The unusual difference was found in the 2013 survey, when the rate on primary roads was 27.6 points higher than the rate on local/rural/city roads. For all three surveys, the rates on secondary roads were closest to the overall seat belt use rates in each respective survey. Figure 42: Occupant Seat Belt Usage Rates by Roadway Type, % Primary 90.0% 80.0% 70.0% 60.0% 80.2% 77.5% 66.0% 87.9% 80.0% 60.3% Secondary Loc/Rur/City 82.7% 78.2% 69.9% 50.0% Page 33
38 Vehicle Type: Seat belt use rates were lowest for occupants observed in pickup trucks; the highest rates were usually found for occupants of vans. That difference was typically about 14 to 15 points or more for the three surveys. The rate for pickup truck occupants was also typically below the overall rate for vehicle occupants. For these surveys, the pickup truck rate was 7.8 points below the overall rate in both the 2012 and 2013 surveys; however, it was 9.3 points below the overall rate for This low rate for pickup truck occupant and the high proportion of pickup trucks among all Wyoming vehicles (around 35%) may have a lot to do with the decreased rate of seat belt use in Figure 43: Occupant Seat Belt Rates by Vehicle Type, % Automobile SUV Van Pickup 90.0% 80.0% 84.7% 83.7% 88.8% 85.0% 86.6% 84.7% 84.8% 83.2% 70.0% 78.2% 69.2% 74.1% 69.9% 60.0% Vehicle Registration Type: Occupants observed in out-of-state registered vehicles had a higher rate of seat belt use across all three survey years. The rate is higher by 14.1 points in 2012 and 14.9 points in The difference was not as great for 2014, where out-of-state registered vehicle occupants had an 11.0 percentage points higher rate of seat belt use than occupants observed in Wyoming-licensed vehicles. Figure 44: Occupant Seat Belt Usage Rates by Registration, % 90.0% 86.3% 91.1% 86.7% Out of State Wyoming 80.0% 70.0% 72.2% 76.2% 75.7% 60.0% Page 34
39 County: For all three survey years, the consistently lowest rates of seat belt use were found in Big Horn, Campbell, Natrona, and Sheridan Counties. The consistently highest rates were found in Lincoln, Platte, Sublette, and Teton Counties. The other counties were either between these two groups, or were less consistent in seat belt rates across the three years. For example, Johnson County had an uncharacteristically high rate in 2013, as did Natrona, Park, and Sweetwater Counties in Sheridan County had the lowest rates in both 2013 and 2014, dropping to an overall low of 57.3 percent in Teton County, which has characteristically had nearly total seat belt use among vehicle occupants, dropped to a rate of 90.1 percent in It was suggested in previous surveys that Teton s rate might be a consequence of the substantial number of government employees, out-of-state visitors, and seasonal residents, all of whom are more likely than the average vehicle occupant to wear a seat belt. However, the reader should be skeptical of near percent rates for any county, and the 90.1 percent rate for 2014 seems to be more likely for Teton County. Table 5: Occupant Seat Belt Usage Rates by County, Co-overall Albany 74.2% 84.4% 84.3% -0.1% 10.1% % Big Horn 60.2% 65.1% 71.5% 6.4% 11.3% % Campbell 60.3% 62.3% 67.6% 5.3% 7.3% % Carbon 83.0% 77.0% 78.8% 1.8% -4.2% % Fremont 72.2% 75.2% 77.0% 1.8% 4.8% % Johnson 74.8% 97.4% 77.3% -20.1% 2.5% % Laramie 74.3% 73.0% 72.9% -0.1% -1.4% % Lincoln 81.4% 82.7% 81.5% -1.2% 0.1% % Natrona 63.1% 63.9% 72.8% 8.9% 9.7% % Park 73.6% 73.0% 80.2% 7.2% 6.6% % Platte 84.5% 85.7% 86.7% 1.0% 2.2% % Sheridan 65.0% 60.5% 57.3% -3.2% -7.7% % Sublette 83.0% 86.0% 84.1% -1.9% 1.1% % Sweetwater 60.3% 77.1% 78.2% 1.1% 17.9% % Teton 98.3% 99.0% 90.1% -8.9% -8.2% % Uinta 72.1% 76.8% 64.9% -11.9% -7.2% % Totals 77.0% 81.9% 79.2% -2.7% 2.2% % Page 35
40 Closing A review of the major results appears in the executive summary at the beginning of the report, so it is not repeated here. Instead, the reader may refer to the extensive resources found in the appendix. The appendix contains detailed tables summarizing the results. Specifically, in terms of detailed differences among occupants within various categories of the main descriptive variables in the study. The appendices also contain detailed differences between drivers and passengers in terms of seat belt use. In addition, the appendices contain the documents that provide full details on the methodology that guided the data collection and the analysis of the data. Page 36
41 Appendix A: State seat belt use reporting form Page 37
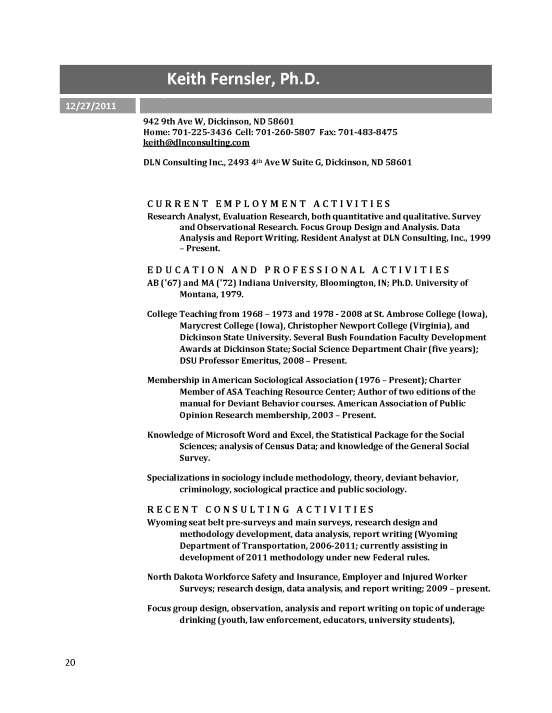
42 State Seat Belt Use Survey Reporting Form PART A State: Wyoming Calendar Year of Survey: 2014 Statewide Seat Belt use Rate: 79.2 Percent I hereby certify that: The Governor designated Matt Carlson as the State s Highway Safety Representative (GR), and has the authority to sign the certification in writing. The reported Statewide seat belt use rate is based on a survey design that received approval by NHTSA, in writing, as conforming to the Uniform Criteria for State Observational Surveys of Seat Belt Use, 23 CFR Part The survey design remained unchanged since NHTSA approved the survey. Dr. James G. Leibert 6, a qualified survey statistician, reviewed the seat belt use rate reported above and information reported in Part B and determined that they meet the Uniform Criteria for State Observational Surveys of Seat Belt Use, 23 CFR Part Signature Date Printed name of signing official 6 In accordance with the final rule published in Federal Register Vol. 76 No. 63, April 1, 2011, Rules and Regulations, pp , DLN contracted with statistician, Dr. James G. Leibert to determine that the methods used to process the collected data met the Uniform Criteria for State Observational Surveys of Seat Belt Use, 23 CFR Part Dr. Leibert reviewed the SPSS output files and related data tables to confirm the data are accurate and true. A copy of Dr. Leibert s abbreviate resume follows.
43 5820 York Ave. S. Edina, MN Phone James G. Leibert, PhD. Summary Creative problem solver with knowledge of and experience in a broad array of statistical and computational tools and techniques. I understand that there is no one tool or technique that can be used for every situation. I can quickly see connections and use tools and techniques from other fields as appropriate. Employment Research Scientist III, Minnesota Department of Human Services, Disability Services Division, St. Paul, MN. Current Chair, Dept. of Political Science and Public Administration / Director of the Master of Public Administration Program / Dean of Graduate and Undergraduate Studies, Kazakhstan Institute of Management, Economics, and Strategic Research (KIMEP), Almaty, Republic of Kazakhstan, Associate Professor ( ) / International Programs Coordinator ( ) Chairman of the Department of Social Sciences ( ) \ Assistant Professor ( ), Dickinson State University Dickinson, ND, Leadership Team Player Problem Solving
44 Appendix B: Survey design for Wyoming The Wyoming Department of Transportation Highway Safety Program in collaboration with DLN Consulting, Inc. designed the following sampling, data collection, and estimation plan. The National Highway Traffic Safety Administration accepted and approved the plan on April 24, A copy of the approval notification can be found in Appendix C. Page 38
45
46
47
48
49
50
51
52
53

54
55
56
57
58
59
60
61
62
63
64
65
66
67
68
69
70
71
72
73
74
75
76
77
78
79
80 Appendix C: NHTSA Approval and Final Review Page 39
81
82
83
84
Survey of Seat Belt Use
 Survey of Seat Belt Use Wyoming 2013 The protocols implemented for this study are in accordance with the federal guidelines established in 2012, which distinguish it from all prior surveys of seat belt
Monty Byers, Tammy Cussins, Brooke Darden, Tonya Dove, Peggy Dowers, Dawn Edwards,
 WYOMING 2016 The protocols implemented for this study are in accordance with the federal guidelines established in 2012, which distinguish it from all prior surveys of seat belt use in Wyoming. The standards
SURVEY OF SEAT BELT USE IN WYOMING
 SURVEY OF SEAT BELT USE IN WYOMING 2017 WYOMING SEAT BELT SURVEY The protocols implemented for this study were per the federal guidelines set up in 2012, which distinguish it from all prior surveys of
ALCOHOL AND WYOMING TRAFFIC CRASHES
 AND WYOMING TRAFFIC -2007- 2002-2007 SUMMARY COMPARISON FOR WYOMING TRAFFIC YEAR OF 2002 2003 2004 2005 2006 2007 ALL FATAL 151 141 142 147 169 136 FATAL 53 43 50 51 58* 46* PERCENT [%] 35.0% 30.5% 35.2%
Missouri Seat Belt Usage Survey for 2017
 Missouri Seat Belt Usage Survey for 2017 Conducted for the Highway Safety & Traffic Division of the Missouri Department of Transportation by The Missouri Safety Center University of Central Missouri Final
Puerto Rico Observational Survey of Seat Belt Use, 2017
 Puerto Rico Observational Survey of Seat Belt Use, 2017 Final Report Submitted to: Traffic Safety Commission of Puerto Rico September 29, 2017 TABLE OF CONTENT Introduction... 3 Methodology... 3 FINDINGS...
KANSAS Occupant Protection Observational Survey Supplementary Analyses Summer Study
 KANSAS Occupant Protection Observational Survey Supplementary Analyses 2018 Summer Study Submitted To: Kansas Department of Transportation Bureau of Transportation Safety and Technology Prepared by: DCCCA
Where are the Increases in Motorcycle Rider Fatalities?
 Where are the Increases in Motorcycle Rider Fatalities? Umesh Shankar Mathematical Analysis Division (NPO-121) Office of Traffic Records and Analysis National Center for Statistics and Analysis National
Food and Transportation Drive Inflation for the Second Quarter of 2011
 State of Wyoming Department of Administration and Information Economic Analysis Division 2800 Central Avenue Cheyenne, WY 82002-0060 E-mail: ai-ead-info@wyo.gov http://eadiv.state.wy.us Ph. (307) 777-7504
Road Safety s Mid Life Crisis The Trends and Characteristics for Middle Aged Controllers Involved in Road Trauma
 Road Safety s Mid Life Crisis The Trends and Characteristics for Middle Aged Controllers Involved in Road Trauma Author: Andrew Graham, Roads and Traffic Authority, NSW Biography: Andrew Graham has been
National Household Travel Survey Add-On Use in the Des Moines, Iowa, Metropolitan Area
 National Household Travel Survey Add-On Use in the Des Moines, Iowa, Metropolitan Area Presentation to the Transportation Research Board s National Household Travel Survey Conference: Data for Understanding
WYOMING COST OF LIVING FOR THE SECOND QUARTER 2010
 State of Wyoming Department of Administration and Information Economic Analysis Division 2800 Central Avenue Cheyenne, WY 82002-0060 E-mail: ead@wyo.gov http://eadiv.state.wy.us Ph. (307) 777-7504 Fax
Wyoming Cost of Living Index for the Second Quarter of 2012
 State of Wyoming Department of Administration and Information Economic Analysis Division 2800 Central Avenue Cheyenne, WY 82002-0060 E-mail: ai-ead-info@wyo.gov http://eadiv.state.wy.us Ph. (307) 777-7504
ITSMR Research Note. Motorcyclists and Impaired Driving ABSTRACT INTRODUCTION KEY FINDINGS. September 2013
 September 2013 KEY FINDINGS F&PI CRASHES INVOLVING IMPAIRED MOTORCYCLISTS 27% of the fatal MC crashes over the five year period, 2008-2012, were alcohol-related. 48% of the alcohol-related F&PI MC crashes
Wyoming School Funding Model Recalibration: Transportation Reimbursement Model Study
 Wyoming School Funding Model Recalibration: Transportation Reimbursement Model Study Robert Schoch and Dr. William Hartman, Education Finance Decisions For Augenblick, Palaich and Associates, Inc. Presentation
MEMORANDUM. Observational survey of car seat use, 2017
 MEMORANDUM Darelis López Rosario, Esq. Executive Director Traffic Safety Commission Carlos Torija Estudios Técnicos, Inc. October 5, 2017 Observational survey of car seat use, 2017 The Traffic Safety Commission
American Driving Survey,
 RESEARCH BRIEF American Driving Survey, 2015 2016 This Research Brief provides highlights from the AAA Foundation for Traffic Safety s 2016 American Driving Survey, which quantifies the daily driving patterns
Provisional Review of Fatal Collisions. January to December 31 st 2017
 Provisional Review of Fatal Collisions January to December 31 st 17 2 nd January 18 Review of 17 fatal collision statistics as of 31st December 17 Overview This report summarises the main trends in road
Fatal Motor Vehicle Crashes on Indian Reservations
 April 2004 DOT HS 809 727 Fatal Motor Vehicle Crashes on Indian Reservations 1975-2002 Technical Report Colleges & Universities 2% Other Federal Properties 9% Other 4% Indian Reservations 65% National
Passenger seat belt use in Durham Region
 Facts on Passenger seat belt use in Durham Region June 2017 Highlights In 2013/2014, 85 per cent of Durham Region residents 12 and older always wore their seat belt when riding as a passenger in a car,
Who has trouble reporting prior day events?
 Vol. 10, Issue 1, 2017 Who has trouble reporting prior day events? Tim Triplett 1, Rob Santos 2, Brian Tefft 3 Survey Practice 10.29115/SP-2017-0003 Jan 01, 2017 Tags: missing data, recall data, measurement
Young drivers. Drivers involved in fatal or injury crashes. Drivers involved in fatal/injury crashes per 100. per licence holders (lines)
") Young drivers CRASH FACTSHEET 2012 CRASH STATISTICS FOR THE YEAR ENDED 31 DECEMBER 2011 Prepared by the Ministry of Transport In 2011 young drivers aged 15 24 were involved in 80 fatal traffic crashes,
Young drivers CRASH FACTSHEET 2012 CRASH STATISTICS FOR THE YEAR ENDED 31 DECEMBER 2011 Prepared by the Ministry of Transport In 2011 young drivers aged 15 24 were involved in 80 fatal traffic crashes,
National Center for Statistics and Analysis Research and Development
 U.S. Department of Transportation National Highway Traffic Safety Administration DOT HS 809 271 June 2001 Technical Report Published By: National Center for Statistics and Analysis Research and Development
The Value of Travel-Time: Estimates of the Hourly Value of Time for Vehicles in Oregon 2007
 The Value of Travel-Time: Estimates of the Hourly Value of Time for Vehicles in Oregon 2007 Oregon Department of Transportation Long Range Planning Unit June 2008 For questions contact: Denise Whitney
Abstract. Executive Summary. Emily Rogers Jean Wang ORF 467 Final Report-Middlesex County
 Emily Rogers Jean Wang ORF 467 Final Report-Middlesex County Abstract The purpose of this investigation is to model the demand for an ataxi system in Middlesex County. Given transportation statistics for
Driver Speed Compliance in Western Australia. Tony Radalj and Brian Kidd Main Roads Western Australia
 Driver Speed Compliance in Western Australia Abstract Tony Radalj and Brian Kidd Main Roads Western Australia A state-wide speed survey was conducted over the period March to June 2 to measure driver speed
PARKING OCCUPANCY IN WINDSOR CENTER
 PARKING OCCUPANCY IN WINDSOR CENTER TOWN OF WINDSOR, CONNECTICUT REPORT JUNE 2017 CONTENTS Background... 3 Other Relevant Data... 3 Parking Survey Design... 6 Parking Supply Inventory... 6 Parking Demand
DRIVER SPEED COMPLIANCE WITHIN SCHOOL ZONES AND EFFECTS OF 40 PAINTED SPEED LIMIT ON DRIVER SPEED BEHAVIOURS Tony Radalj Main Roads Western Australia
 DRIVER SPEED COMPLIANCE WITHIN SCHOOL ZONES AND EFFECTS OF 4 PAINTED SPEED LIMIT ON DRIVER SPEED BEHAVIOURS Tony Radalj Main Roads Western Australia ABSTRACT Two speed surveys were conducted on nineteen
2014 Community Report Portales
 4 Portales Produced for the New Mexico Department of Transportation, Traffic Safety Division, Traffic Records Bureau, Under Contract 58 by the University of New Mexico, Geospatial and Population Studies,
2014 Community Report Luna County
 4 Luna County Produced for the New Mexico Department of Transportation, Traffic Safety Division, Traffic Records Bureau, Under Contract 58 by the University of New Mexico, Geospatial and Population Studies,
2015 Community Report White Rock
 5 White Rock Produced for the New Mexico Department of Transportation, Traffic Safety Division, Traffic Records Bureau, Under Contract 58 by the University of New Mexico, Geospatial and Population Studies,
2016 Community Report Los Alamos County
 6 Los Alamos County Produced for the New Mexico Department of Transportation, Traffic Safety Division, Traffic Records Bureau, Under Contract 58 by the University of New Mexico, Geospatial and Population
2016 Community Report New Mexico
 216 Produced for the Department of Transportation, Traffic Safety Division, Traffic Records Bureau, Under Contract 581 by the University of, Geospatial and Population Studies, Traffic Research Unit Distributed
2016 Community Report Portales
 6 Portales Produced for the New Mexico Department of Transportation, Traffic Safety Division, Traffic Records Bureau, Under Contract 58 by the University of New Mexico, Geospatial and Population Studies,
2014 Community Report Las Vegas
 4 Las Vegas Produced for the New Mexico Department of Transportation, Traffic Safety Division, Traffic Records Bureau, Under Contract 58 by the University of New Mexico, Geospatial and Population Studies,
2014 Community Report Truth or Consequences
 4 Truth or Consequences Produced for the New Mexico Department of Transportation, Traffic Safety Division, Traffic Records Bureau, Under Contract 58 by the University of New Mexico, Geospatial and Population
WHITE PAPER. Preventing Collisions and Reducing Fleet Costs While Using the Zendrive Dashboard
 WHITE PAPER Preventing Collisions and Reducing Fleet Costs While Using the Zendrive Dashboard August 2017 Introduction The term accident, even in a collision sense, often has the connotation of being an
2015 Community Report Grants
 5 Grants Produced for the New Mexico Department of Transportation, Traffic Safety Division, Traffic Records Bureau, Under Contract 58 by the University of New Mexico, Geospatial and Population Studies,
2014 Community Report Tularosa
 4 Tularosa Produced for the New Mexico Department of Transportation, Traffic Safety Division, Traffic Records Bureau, Under Contract 8 by the University of New Mexico, Geospatial and Population Studies,
2016 Community Report Torrance County
 6 Torrance County Produced for the New Mexico Department of Transportation, Traffic Safety Division, Traffic Records Bureau, Under Contract 58 by the University of New Mexico, Geospatial and Population
2015 Community Report Torrance County
 5 Torrance County Produced for the New Mexico Department of Transportation, Traffic Safety Division, Traffic Records Bureau, Under Contract 58 by the University of New Mexico, Geospatial and Population
2016 Community Report De Baca County
 6 De Baca County Produced for the New Mexico Department of Transportation, Traffic Safety Division, Traffic Records Bureau, Under Contract 58 by the University of New Mexico, Geospatial and Population
2014 Community Report Aztec
 Aztec Produced for the New Mexico Department of Transportation, Traffic Safety Division, Traffic Records Bureau, Under Contract 58 by the University of New Mexico, Geospatial and Population Studies, Traffic
2015 Community Report Las Vegas
 5 Las Vegas Produced for the New Mexico Department of Transportation, Traffic Safety Division, Traffic Records Bureau, Under Contract 58 by the University of New Mexico, Geospatial and Population Studies,
Food Prices Propel Inflation for the Fourth Quarter of 2011
 State of Wyoming Department of Administration and Information Economic Analysis Division 2800 Central Avenue Cheyenne, WY 82002-0060 E-mail: ai-ead-info@wyo.gov http://eadiv.state.wy.us Ph. (307) 777-7504
2015 Community Report Tularosa
 5 Tularosa Produced for the New Mexico Department of Transportation, Traffic Safety Division, Traffic Records Bureau, Under Contract 58 by the University of New Mexico, Geospatial and Population Studies,
2016 Community Report Santa Fe County
 26 Santa Fe County Produced for the New Mexico Department of Transportation, Traffic Safety Division, Traffic Records Bureau, Under Contract 58 by the University of New Mexico, Geospatial and Population
TRUTH AND LIES: CONSUMER PERCEPTION VS. DATA
 TRUTH AND LIES: CONSUMER PERCEPTION VS. DATA Rosario Murguia, Consumer and Product Research Manager, Procter & Gamble Diana Ballard, Senior Consulting Statistician, Predictum Inc. Michael E. Haslam, PhD,
2014 Community Report Los Lunas
 4 Los Lunas Produced for the New Mexico Department of Transportation, Traffic Safety Division, Traffic Records Bureau, Under Contract 58 by the University of New Mexico, Geospatial and Population Studies,
2016 Community Report San Juan County
 26 San Juan County Produced for the New Mexico Department of Transportation, Traffic Safety Division, Traffic Records Bureau, Under Contract 58 by the University of New Mexico, Geospatial and Population
2015 Community Report San Juan County
 25 San Juan County Produced for the New Mexico Department of Transportation, Traffic Safety Division, Traffic Records Bureau, Under Contract 58 by the University of New Mexico, Geospatial and Population
ESTIMATING THE LIVES SAVED BY SAFETY BELTS AND AIR BAGS
 ESTIMATING THE LIVES SAVED BY SAFETY BELTS AND AIR BAGS Donna Glassbrenner National Center for Statistics and Analysis National Highway Traffic Safety Administration Washington DC 20590 Paper No. 500 ABSTRACT
2015 Community Report Chaparral
 5 Chaparral Produced for the New Mexico Department of Transportation, Traffic Safety Division, Traffic Records Bureau, Under Contract 58 by the University of New Mexico, Geospatial and Population Studies,
2016 Community Report Aztec
 Aztec Produced for the New Mexico Department of Transportation, Traffic Safety Division, Traffic Records Bureau, Under Contract 58 by the University of New Mexico, Geospatial and Population Studies, Traffic
2015 Community Report Aztec
 25 Aztec Produced for the New Mexico Department of Transportation, Traffic Safety Division, Traffic Records Bureau, Under Contract 58 by the University of New Mexico, Geospatial and Population Studies,
Rates of Motor Vehicle Crashes, Injuries, and Deaths in Relation to Driver Age, United States,
 RESEARCH BRIEF This Research Brief provides updated statistics on rates of crashes, injuries and death per mile driven in relation to driver age based on the most recent data available, from 2014-2015.
2015 Community Report Doña Ana County
 25 Doña Ana County Produced for the New Mexico Department of Transportation, Traffic Safety Division, Traffic Records Bureau, Under Contract 58 by the University of New Mexico, Geospatial and Population
Percentage of Children and Youth Ages 0 to 24 years old Using Seat Belts or Restraints, Selected Years,
 2 Percent Figure 1 100 80 Percentage of Children and Youth Ages 0 to 24 years old Using Seat Belts or Restraints, Selected Years, 1994-2013 82 88 82 78 89 91 81 80 89 83 60 40 20 53 50 69 16 to 24 years
Michigan State Police (MSP) Post 21 - Metro North
 Post 21 - Metro North") October 2017 2016 Reporting Criteria Please pay particular attention to the wording when interpreting the three levels of data gathered for this report. Crash The Crash Level analyzes data related to crash
October 2017 2016 Reporting Criteria Please pay particular attention to the wording when interpreting the three levels of data gathered for this report. Crash The Crash Level analyzes data related to crash
2015 Community Report Los Lunas
 25 Los Lunas Produced for the New Mexico Department of Transportation, Traffic Safety Division, Traffic Records Bureau, Under Contract 58 by the University of New Mexico, Geospatial and Population Studies,
Understanding Traffic Data: How To Avoid Making the Wrong Turn
 Traffic Records Forum 2011 Understanding Traffic Data: How To Avoid Making the Wrong Turn Presenter: Marc Starnes (202) 366-2186 marc.starnes@dot.gov August 3rd, 2011 1 Summary of Topics Police Crash Reports
Statistics and Facts About Distracted Driving
 Untitled Document Statistics and Facts About Distracted Driving What does it mean to be a distracted driver? Are you one? Learn more here. What Is Distracted Driving? There are three main types of distraction:
THE 2013 WYOMING HOUSING NEEDS FORECAST
 THE 2013 WYOMING HOUSING NEEDS FORECAST SPONSORED BY THE WYOMING COMMUNITY DEVELOPMENT AUTHORITY FINAL REPORT: MARCH 29, 2013 The 2013 Wyoming Housing Needs Forecast Prepared for Wyoming Community Development
National Center for Statistics and Analysis Research and Development
 U.S. Department of Transportation National Highway Traffic Safety Administration DOT HS 809 360 October 2001 Technical Report Published By: National Center for Statistics and Analysis Research and Development
UPPER GREEN RIVER OZONE INVESTIGATION (O3i) LUMAN AND PARADISE ROAD TRAFFIC COUNT STUDY 03/05/2009 AND 06/09/2009. Study Summary.
 LUMAN AND PARADISE ROAD TRAFFIC COUNT STUDY 03/05/2009 AND 06/09/2009. Study Summary.") UPPER GREEN RIVER OZONE INVESTIGATION (O3i) LUMAN AND PARADISE ROAD TRAFFIC COUNT STUDY 03/05/2009 AND 06/09/2009 Study Summary Prepared for WYOMING DEPARTMENT OF ENVIRONMENTAL QUALITY 122 West 25 th Street
UPPER GREEN RIVER OZONE INVESTIGATION (O3i) LUMAN AND PARADISE ROAD TRAFFIC COUNT STUDY 03/05/2009 AND 06/09/2009 Study Summary Prepared for WYOMING DEPARTMENT OF ENVIRONMENTAL QUALITY 122 West 25 th Street
TECHNICAL ASSISTANCE REPORT SAFETY BELT AND MOTORCYCLE HELMET USE IN VIRGINIA: THE DECEMBER 2002 UPDATE. Cheryl W. Lynn Senior Research Scientist
 TECHNICAL ASSISTANCE REPORT SAFETY BELT AND MOTORCYCLE HELMET USE IN VIRGINIA: THE DECEMBER 2002 UPDATE Cheryl W. Lynn Senior Research Scientist Jami L. Fisher Research Associate Virginia Transportation
the Ministry of Transport is attributed as the source of the material
 Young Drivers 2016 Disclaimer All reasonable endeavours are made to ensure the accuracy of the information in this report. However, the information is provided without warranties of any kind including
WIM #41 CSAH 14, MP 14.9 CROOKSTON, MINNESOTA APRIL 2014 MONTHLY REPORT
 WIM #41 CSAH 14, MP 14.9 CROOKSTON, MINNESOTA APRIL 2014 MONTHLY REPORT In order to understand the vehicle classes and groupings, the MnDOT Vehicle Classification Scheme and the Vehicle Classification
Nebraska Teen Driving Experiences Survey Four-Year Trend Report
 Nebraska Teen Driving Experiences Survey Four-Year Trend Report 2014-2015, 2015-2016, and 2017-2018 School Years April 2018 Division of Public Health Injury Prevention Program Table of Contents Executive
An Investigation of the Distribution of Driving Speeds Using In-vehicle GPS Data. Jianhe Du Lisa Aultman-Hall University of Connecticut
 An Investigation of the Distribution of Driving Speeds Using In-vehicle GPS Data Jianhe Du Lisa Aultman-Hall University of Connecticut Problem Statement Traditional speed collection methods can not record
FHWA Motorcycle Crash Causation Study
 Office of Safety Research and Development FHWA Motorcycle Crash Causation Study Carol H. Tan, Ph.D Office of Safety Research & Development 2017 SMSA Sept 28, 2017 1 Presentation Overview Background Data
The 2017 Wyoming Housing Needs Forecast
 The 2017 Wyoming Housing Needs Forecast Prepared for Wyoming Community Development Authority Prepared by Western Economic Services, LLC 212 SE 18 th Avenue Portland, OR 97214 (503) 239-9091 Toll-free:
More persons in the cars? Status and potential for change in car occupancy rates in Norway
 Author(s): Liva Vågane Oslo 2009, 57 pages Norwegian language Summary: More persons in the cars? Status and potential for change in car occupancy rates in Norway Results from national travel surveys in
NON-FATAL ELECTRICAL INJURIES AT WORK
 NON-FATAL ELECTRICAL INJURIES AT WORK Richard Campbell May 2018 Copyright 2018 National Fire Protection Association (NFPA) CONTENTS Findings and Trends 1 Key Takeaways 2 Background on Data Sources and
IMPACT OF GASOLINE PRICES ON LAS VEGAS VISITATION FROM SOUTHERN CALIFORNIA AND LAS VEGAS LOCALS
 Monday, June 30, 2008 IMPACT OF GASOLINE PRICES ON LAS VEGAS VISITATION FROM SOUTHERN CALIFORNIA AND LAS VEGAS LOCALS Executive Summary There is a direct correlation between rising gas prices and reduced
Michigan State Police (MSP) Post 21 - Metro North
 Post 21 - Metro North") June 2018 Revised 8/3/2018 2017 Reporting Criteria Please pay particular attention to the wording when interpreting the three levels of data gathered for this report. Crash The Crash Level analyzes data
June 2018 Revised 8/3/2018 2017 Reporting Criteria Please pay particular attention to the wording when interpreting the three levels of data gathered for this report. Crash The Crash Level analyzes data
Denver Car Share Program 2017 Program Summary
 Denver Car Share Program 2017 Program Summary Prepared for: Prepared by: Project Manager: Malinda Reese, PE Apex Design Reference No. P170271, Task Order #3 January 2018 Table of Contents 1. Introduction...
SPATIAL AND TEMPORAL PATTERNS OF FATIGUE RELATED CRASHES IN HAWAII
 SPATIAL AND TEMPORAL PATTERNS OF FATIGUE RELATED CRASHES IN HAWAII By Karl E. Kim Eric Y. Yamashita Hawaii CODES Project Traffic Records Forum July 29 - August 2, 2001 New Orleans, Louisiana Overview Background
American Driving Survey: Methodology and Year One Results, May 2013 May Saving lives through research and education.
 Saving lives through research and education American Driving Survey: Methodology and Year One Results, May 2013 May 2014 April 2015 607 14th Street, NW, Suite 201 Washington, DC 20005 AAAFoundation.org
MIT ICAT M I T I n t e r n a t i o n a l C e n t e r f o r A i r T r a n s p o r t a t i o n
 M I T I n t e r n a t i o n a l C e n t e r f o r A i r T r a n s p o r t a t i o n Standard Flow Abstractions as Mechanisms for Reducing ATC Complexity Jonathan Histon May 11, 2004 Introduction Research
Meter Insights for Downtown Store
 Meter Insights for Downtown Store Commodity: Analysis Period: Prepared for: Report Date: Electricity 1 December 2013-31 December 2014 Arlington Mills 12 February 2015 Electricity use over the analysis
REMOTE SENSING DEVICE HIGH EMITTER IDENTIFICATION WITH CONFIRMATORY ROADSIDE INSPECTION
 Final Report 2001-06 August 30, 2001 REMOTE SENSING DEVICE HIGH EMITTER IDENTIFICATION WITH CONFIRMATORY ROADSIDE INSPECTION Bureau of Automotive Repair Engineering and Research Branch INTRODUCTION Several
New Zealand Transport Outlook. VKT/Vehicle Numbers Model. November 2017
 New Zealand Transport Outlook VKT/Vehicle Numbers Model November 2017 Short name VKT/Vehicle Numbers Model Purpose of the model The VKT/Vehicle Numbers Model projects New Zealand s vehicle-kilometres travelled
Spatial and Temporal Analysis of Real-World Empirical Fuel Use and Emissions
 Spatial and Temporal Analysis of Real-World Empirical Fuel Use and Emissions Extended Abstract 27-A-285-AWMA H. Christopher Frey, Kaishan Zhang Department of Civil, Construction and Environmental Engineering,
Prepared for: SEAT BELT USE SURVEY OTS Grant Number 23-CP-4 UNLV Account Number DK. Final Report UNLV/TRC/PR/03-09.
 Prepared for: Office of Traffic Safety Division of Traffic Safety Department of Motor Vehicles and Public Safety 55 Wright Way Carson City, NV 89711-0999 SEAT BELT USE SURVEY- 2003 OTS Grant Number 23-CP-4
Rio Arriba County Report, 2007
 Rio Arriba County Report, 7 Demographics In 7, there were 3,748 licensed drivers in Rio Arriba County. Of these, there were,68 females and,63 males. The population in Rio Arriba County was 4,87. The total
RTCSNV CRASH ANALYSIS REPORT
 2011-2015 RTCSNV CRASH ANALYSIS REPORT TABLE OF CONTENTS Summary... 3 Crash Types... 4 Time and Day of Crashes... 7 Crash Factors... 9 Fatalities... 10 Driver s Behavior... 11 Crash Locations... 15 Non-Motorized
DOT HS April 2013
 TRAFFIC SAFETY FACTS 2011 Data DOT HS 811 753 April 2013 Overview Motor vehicle travel is the primary means of transportation in the United States, providing an unprecedented degree of mobility. Yet for
The older driver crash picture: trends and factors
 The older driver crash picture: trends and factors Lifesavers National Conference on Highway Safety Priorities Chicago, IL March 17, 2015 Anne T. McCartt Passenger vehicle driver crash rates Per mile traveled,
FINAL REPORT AP STATISTICS CLASS DIESEL TRUCK COUNT PROJECT
 FINAL REPORT AP STATISTICS CLASS 2017-2018 DIESEL TRUCK COUNT PROJECT Authors: AP Statistics Class 2017-2018 Table of Contents SURVEY QUESTION...p. 2 AIR QUALITY...p. 3-4 TOTAL TRUCK COUNTS.p. 5 TRUCK
TRAFFIC SAFETY FACTS Fatal Motor Vehicle Crashes: Overview. Research Note. DOT HS October 2017
 TRAFFIC SAFETY FACTS Research Note DOT HS 812 456 October 2017 2016 Fatal Motor Vehicle Crashes: Overview There were 37,461 people killed in crashes on U.S. roadways during 2016, an increase from 35,485
Traffic Safety Network Huron Valley
 June 2018 Revised 8/3/2018 2017 Reporting Criteria Please pay particular attention to the wording when interpreting the three levels of data gathered for this report. Crash The Crash Level analyzes data
Los Lunas Community Report, 2002
 Los Lunas Community Report, Demographics In, there were, licensed drivers in Los Lunas. Of these, there were, females and, males. The population of Los Lunas was,. The total number of crashes in was, yielding
Rio Arriba County Report, 2002
 Rio Arriba County Report, Demographics In, there were,8 licensed drivers in Rio Arriba County. Of these, there were 8,8 females and 8,8 males. The population in Rio Arriba County was,9. The total number
Investigating the Concordance Relationship Between the HSA Cut Scores and the PARCC Cut Scores Using the 2016 PARCC Test Data
 Investigating the Concordance Relationship Between the HSA Cut Scores and the PARCC Cut Scores Using the 2016 PARCC Test Data A Research Report Submitted to the Maryland State Department of Education (MSDE)
Michigan. Traffic. Profile
 June 2014 Revised 5/11/15 Michigan 2013 Traffic Crash Profile Reporting Criteria Please pay particular attention to the wording when interpreting the three levels of data gathered for this report. Crash
PROCEDURES FOR ESTIMATING THE TOTAL LOAD EXPERIENCE OF A HIGHWAY AS CONTRIBUTED BY CARGO VEHICLES
 PROCEDURES FOR ESTIMATING THE TOTAL LOAD EXPERIENCE OF A HIGHWAY AS CONTRIBUTED BY CARGO VEHICLES SUMMARY REPORT of Research Report 131-2F Research Study Number 2-10-68-131 A Cooperative Research Program
WIM #31 US 2, MP 8.0 EAST GRAND FORKS, MN JANUARY 2015 MONTHLY REPORT
 WIM #31 US 2, MP 8.0 EAST GRAND FORKS, MN JANUARY 2015 MONTHLY REPORT WIM #31 EAST GRAND FORKS MONTHLY REPORT - JANUARY 2015 WIM Site Location WIM #31 is located on US 2 at mile post 8.0, southeast of
TABLE OF CONTENTS CRASHES.. VI TRENDS. VII
 TABLE OF CONTENTS Introduction. I Letter from the Governor II Executive Summary of this Report. III-IV 1998 Nevada Quick Collision Facts V CRASHES.. VI a. Statewide Total Crashes by Severity... 1 b. Statewide
Excessive speed as a contributory factor to personal injury road accidents
 Excessive speed as a contributory factor to personal injury road accidents Jonathan Mosedale and Andrew Purdy, Transport Statistics: Road Safety, Department for Transport Summary This report analyses contributory