FHWA Motorcycle Crash Causation Study
|
|
|
- Benedict Pitts
- 5 years ago
- Views:
Transcription
1 Office of Safety Research and Development FHWA Motorcycle Crash Causation Study Carol H. Tan, Ph.D Office of Safety Research & Development 2017 SMSA Sept 28,
2 Presentation Overview Background Data Collection Results Current FHWA Activities 2

3 Background: Why Study Motorcycles Crashes? 6,000 60,000 5,000 50,000 Motorcycle Fatalities 4,000 3,000 2,000 Motorcycle Fatalities All Traffic Fatalities 40,000 30,000 20,000 All Traffic Fatalities 1,000 10, Year 0 3

4 Background: Why Study Motorcycles Crashes? Percentage of All Fatalities: Motorcyclists 16.00% 14.00% 12.00% 10.00% 8.00% 6.00% 4.00% 2.00% 0.00% 14% 4

5 Background: Congressional Response Congress mandated the Motorcycle Crash Causation Study (MCCS) OECD Data Collection Protocol Oklahoma State University NHTSA Pilot Study FHWA and NHTSA worked to develop data collection program Final Report: June
 Sample Size 351 Crash Investigations 702 Control Rider")
6 Background: MCCS Partners Partners USDOT FHWA NHTSA Six State DOTs New Mexico New York Ohio Oklahoma Texas Wisconsin American Motorcyclist Association (AMA) Sample Size 351 Crash Investigations 702 Control Rider Interviews 6


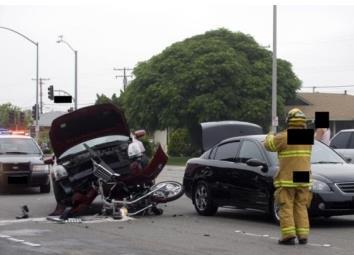
7 MCCS Data Collection Orange County, California Urban Rural Commuters Leisure Riders 3 Crash Investigators 2 re-hired from the NHTSA Pilot Experienced Crash Investigators On call 24/7 7

 On-Scene")


8 OECD Methodology Organisation for Economic Co-operative Development (OECD) On-Scene Investigation Vehicle Inspection Rider Interviews Injury Data Control Rider Interviews 2 Controls/Crash 1,600+ Data Elements 8

9 MCCS On-Scene Data Collection 9


10 Crash Investigation Process Respond On-Scene Scene / Evidence Documentation Interview participants / Witnesses Take initial measurements 10

11 Scene Diagram 11


12 Scene Diagram Detailed Measurements Lane width Curb height Point of Final Rest Record any crash-related evidence Tire marks Remaining debris Damage to roadside objects 12

13 Motorcycle Investigation 13


14 Other Information Resources Police Accident Report Description of crash event BAC measurements Rider Interviews Crash account Riding history Licensing status Rider training Emotional state 14

 Identify location and")

15 Medical Records Obtain Medical Records from Hospital Code all injuries using Abbreviated Injury Scale (AIS) Identify location and description of all injuries Obtain coroner s report Injury details Toxicology results 15


16 Helmet Reconstruction Documentation Helmet certification Manufacture date Chin strap Helmet recovery Offer $100 gift card for replacement helmet Used for reconstruction (~10%) 16


17 Helmet Reconstruction Recreate Crash Forces on Exemplar Helmet Identify Impact Zones and Direction of Force 17


18 Control Interviews Serve as Control Population Detailed data collection Rider history Motorcycle detail Protective equipment Trip purpose $40 Gas Card 18
19 Results 19
20 Caution While It is Possible to Perform the Statistical Analysis and Calculate Statistically Significant Differences, Additional Analysis/Research is Required Before Cause and Effect Can be Demonstrated. The Contribution of This Study is to Help Identify Which Cause and Effect Studies May Be Needed.
 Single vs. Multiple Vehicle Crashes Fatal vs. Non-Fatal Crashes Crash vs. Controls (Limited) Study Data vs.")

21 Data Analysis While Data Collection was the Goal of the Study, (Limited) Data Analysis Was Performed Simple Comparisons of Proportions Were Conducted and Statistical Significance Identified* (90 and 95 percentile, Over/Under Representation of Variable in Sample) Single vs. Multiple Vehicle Crashes Fatal vs. Non-Fatal Crashes Crash vs. Controls (Limited) Study Data vs. Larger Data Sets/Previous Studies * While it is possible to calculate the presence of absence of statistical significance with small samples, it is generally recommended that sample sizes of 25 or greater should be present before the statistical analysis should be used. Tables with small sample sizes are presented within this report as these may provide researchers with insight on how, or if, parameters that were not observed frequently may or may not be linked with motorcycle crash causation.
22 RESULTS Motorcycle Crash Causation Study: Final Report Volume 1 Data Collection Forms and Variable Naming (note: this volume was originally Volume 1: Study Overview, Findings, Variables, and Data Forms) Volume 2 Coding Manual (note: this volume was originally Volume 14 Coding Manual; subsequent volumes have been renumbered) Volume 3 Crash Form Data Volume 4 Environmental Form Data Volume 5 Contributing Factors Data Volume 6 Motorcycle Rider Data Control Rider Data Volume 7 Motorcycle Passenger Data Control Passenger Data Volume 8 Motorcycle Mechanical Data Control Motorcycle Data Volume 9 Motorcycle Dynamics Data Volume 10 Injury Form Data Volume 11 Other Driver Data Volume 12 Other Vehicle Data Volume 13 Helmet Data Volume 14 Comparisons to Other Studies 22
 on Sundays 30.")
23 Data Analysis (cont.) Example: Comparison/Analysis Single vs. Multiple Vehicle Crashes Single Vehicle Crashes were Overrepresented in the Sample Data (relative to Multiple Vehicle Crashes) on Sundays 30.0% DAY OF WEEK CRASH OCCURRED (SINGLE VS. MULTIPLE VEHICLE CRASHES) 20.0% 10.0% 0.0% MONDAY WEDNESDAY FRIDAY SUNDAY SINGLE VEHICLE MULTIPLE VEHICLE
24 Preliminary Results AGE OF RIDER IN CRASH AND CONTROL 25.0% 20.0% 15.0% 10.0% 5.0% 0.0% 20 AND YEARS UNDER YEARS YEARS YEARS YEARS YEARS YEARS YEARS YEARS YEARS YEARS YEARS AND ABOVE CRASH CONTROL 24
25 Preliminary Results (Crash) 95% of crashed riders were male 98.9% of crashed riders were wearing helmets 74% were wearing full-face helmets 19% of crashed riders did not have a MC license 5% had no license at all 25
26 Preliminary Results Type of Motorcycle Training Crashes Controls None * 24% 15% State Recognized, Entry-Level Motorcycle Course 50% 45% Experienced Rider Course 8% 10% High Performance/ Competitive Track Course 5% 5% Self Taught* 6% 18% Taught By Family and/or Friends 6% 7% 26
27 Preliminary Results Age When Rider Began To Ride Crashes Controls Never Rode Before, Or Rarely Ever Ride* 1% 0 % Under The Age Of 17* 27% 40% Age Between Years* 51% 42% Age Between Years 13% 9% Age Between Years 5% 5% Age Between Years 2% 3% Age More Than 55 Years 1% 1% 27
28 Preliminary Results (Crash) 11% of crashes resulted in a fatality to the rider 22% of single vehicle crashes resulted in a fatality 62% of the fatalities involved a collision with a fixed object 77% coded as multiple vehicle 48% of multi-vehicle crashes were the result of a turn by the MC or OV 41% of single vehicle crashes involved a rider leaving the roadway 10% crashes occurred between 10pm-6am 13% of fatalities 12% of single vehicle crashes 28
29 Preliminary Data (Environment) 66.7% of crashes occurred at an intersection 50% of fatal crashes occurred at intersections compared to 28% of non-fatal 17% of crashes occurred at driveways 34% of crashes occurred on curves 48% of fatal crashes occurred on curves as compared to 32% of non-fatal crashes 74% of crashes occurred on principal or minor arterials 29
30 Preliminary Data (Causation) A failure by the rider: the primary contributing factor in 44.3% of crashes and a failure by the other vehicle driver was attributed to 51% of crashes Unsafe acts by the rider were deemed to be related to 50% of crashes Traffic Scanning errors by the other vehicle driver contributed to 70% of crashes Inadequate control skills of the rider contributed to 26% of crashes 30
31 Preliminary Data (Injuries) MAXIMUM INJURY SEVERITY FOR EACH CASE (SINGLE VS. MULTIPLE VEHICLE CRASHES) 45.0% 40.0% 35.0% 30.0% 25.0% 20.0% 15.0% 10.0% 5.0% 0.0% MINOR INJURY MODERATE INJURY SERIOUS INJURY SEVERE INJURY CRITICAL INJURY MAXIMUM (UNTREATABLE) SINGLEVEHICLECRASHES MULTIPLE VEHICLE CRASHES 31


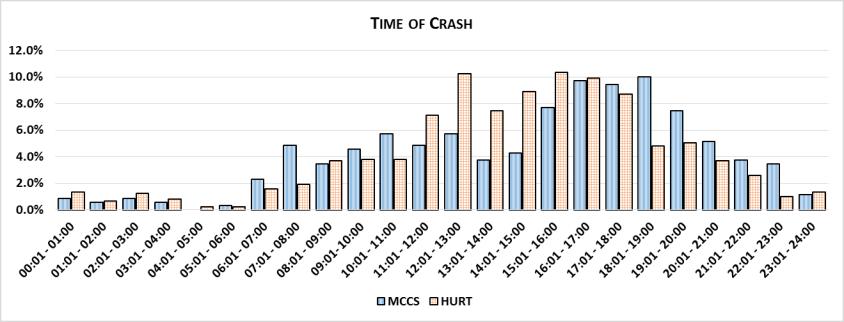
32 ALCOHOL OR DRUG CONSUMPTION OF RIDERS 70.0% 60.0% 50.0% 40.0% 30.0% 20.0% 10.0% 0.0% NO ALCOHOL USE, ONLY DRUG/MEDICATION USE, COMBINED ALCOHOL AND ONLY DRUG/MEDICATION USE MCCS HURTFederal Highway Administration
33
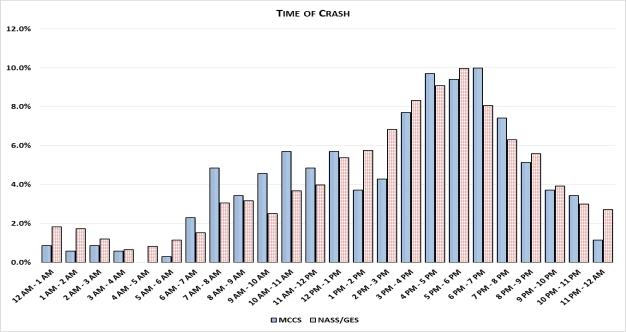
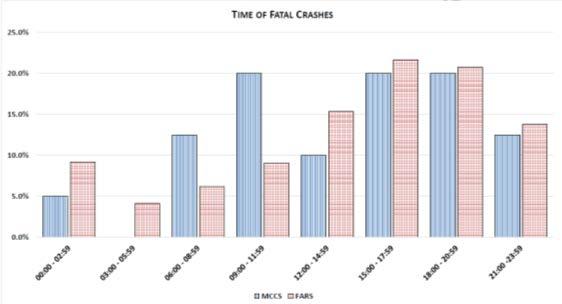
34 TYPE OF INTERSECTIONS 70.0% 60.0% 50.0% 40.0% 30.0% 20.0% 10.0% 0.0% NOT AN FOUR-WAY T-INTERSECTION Y-INTERSECTION TRAFFIC CIRCLE / FIVE-POINT, OR INTERSECTION INTERSECTION ROUNDABOUT MORE MCCS NASS/GES TYPE OF INTERSECTIONS 80.0% 70.0% 60.0% 50.0% 40.0% 30.0% 20.0% 10.0% 0.0% NOT AN INTERSECTION FOUR-WAY T-INTERSECTION Y-INTERSECTION TRAFFIC CIRCLE / FIVE-POINT, OR MORE INTERSECTION ROUNDABOUT MCCS FARS
35 Data Access Data access administered by the FHWA Highway Safety Information System (HSIS) Program: 38
36 Current FHWA Activitiies 39
37 Current FHWA Safety Activities Identifying Infrastructure-Based Motorcycle Crash Countermeasures Yusuf Mohamedshah Motorcycle Advisory Council (MAC) Guan Xu Addressing Motorcycle Crashes at Intersections Jeff Shaw 40
38 Identifying Infrastructure-Based Motorcycle Crash Countermeasures Phase I Project Objectives: Analysis of Motorcycle Crash Causation Study (MCCS) database. Identify three to five infrastructure-based countermeasures to reduce motorcycle crashes on our nation s highway. 41
39 Phase 1 Project Deliverables Summary report: literature review, data analysis methodology and results Potential infrastructure based countermeasures Research questions can be addressed using MCCS data Workshop findings and list of research questions paired with potential countermeasures Phase II plans Plan to develop and field test three to five countermeasures Evaluation plan to study effectiveness of these countermeasures on motorcycle crashes 42

40 More Information Contact Information MCCS Website /safety/motorcycles/mccs/index.cfm 43

41 Questions? Thank You 44
Safety: a major challenge for road transport
 www.maids-study.eu Safety: a major challenge for road transport The growing amount of traffic on European roads requires to address the issue of safety with a thorough and scientific understanding. Effective
MAIDS Workshop. 01 April 2009
 MAIDS Workshop 01 April 2009 Road Safety: the Industry Strategy Improve the knowledge Safety Plan for Action: Integrated approach Act on the product Act on the human factor Act on the infrastructure Cooperate
Agenda. Puerto Rico s Highway System. An Overview of Puerto Rico
 Motorcycle Crashes and its Implications to Local Roads Dr. Alberto Figueroa Dr. Benjamin Colucci University of Puerto Rico at Mayagüez Puerto Rico LTAP Southeast Local Roads Conference (SELRC) Orange Beach,
Motorcycle Safety Program Assessments
 2015 s Conference 2015 ASK 1 Andrew Krajewski Project Manager, SMSA What is a state motorcycle safety program assessment? An independent review of a state s motorcycle safety efforts NHTSA facilitates
Motorcycle Accident Causation and Identification of Countermeasures in Thailand Summary of Findings - Bangkok
 Motorcycle Accident Causation and Identification of Countermeasures in Thailand Summary of Findings - Bangkok The data obtained from all 723-on scenes, in-depth accident investigation cases reveal several
MOTORCYCLE SAFETY. FY 14 Motorcycle Safety Assessment
 MOTORCYCLE SAFETY FY 14 Motorcycle Safety Assessment Introduction Texas Motorcycle Safety Assessment The assessment program offers States a tool to use over time to review their motorcycle safety program,
ITSMR Research Note. Motorcyclists and Impaired Driving ABSTRACT INTRODUCTION KEY FINDINGS. September 2013
 September 2013 KEY FINDINGS F&PI CRASHES INVOLVING IMPAIRED MOTORCYCLISTS 27% of the fatal MC crashes over the five year period, 2008-2012, were alcohol-related. 48% of the alcohol-related F&PI MC crashes
Where are the Increases in Motorcycle Rider Fatalities?
 Where are the Increases in Motorcycle Rider Fatalities? Umesh Shankar Mathematical Analysis Division (NPO-121) Office of Traffic Records and Analysis National Center for Statistics and Analysis National
Contributory factors of powered two wheelers crashes
 Contributory factors of powered two wheelers crashes Pierre Van Elslande, IFSTTAR George Yannis, NTUA Veronique Feypell, OECD/ITF Eleonora Papadimitriou, NTUA Carol Tan, FHWA Michael Jordan, NHTSA Research
Young drivers. Drivers involved in fatal or injury crashes. Drivers involved in fatal/injury crashes per 100. per licence holders (lines)
") Young drivers CRASH FACTSHEET 2012 CRASH STATISTICS FOR THE YEAR ENDED 31 DECEMBER 2011 Prepared by the Ministry of Transport In 2011 young drivers aged 15 24 were involved in 80 fatal traffic crashes,
Young drivers CRASH FACTSHEET 2012 CRASH STATISTICS FOR THE YEAR ENDED 31 DECEMBER 2011 Prepared by the Ministry of Transport In 2011 young drivers aged 15 24 were involved in 80 fatal traffic crashes,
Motorcycle Accidents In-Depth Study. Jacques Compagne Secretary General of ACEM
 Motorcycle Accidents In-Depth Study Jacques Compagne Secretary General of ACEM Content t Presentation of the study Introduction Main features Main figures MAIDS highlights Discussion / What does MAIDS
DOT HS October 2011
 TRAFFIC SAFETY FACTS 2009 Data DOT HS 811 389 October 2011 Motorcycles Definitions often vary across publications with respect to individuals on motorcycles. For this document, the following terms will
the Ministry of Transport is attributed as the source of the material
 Young Drivers 2016 Disclaimer All reasonable endeavours are made to ensure the accuracy of the information in this report. However, the information is provided without warranties of any kind including
4 th IRTAD CONFERENCE Road safety data: collection and analysis for target setting and monitoring performances and progress
 Characteristics of Motorcycle Crashes in the U.S. Jeya Padmanaban M.S. Vitaly Eyges PhD 4 th IRTAD CONFERENCE Road safety data: collection and analysis for target setting and monitoring performances and
ODOT Transportation Safety. It All Starts With Crash Data
 ODOT Transportation Safety Programs It All Starts With Crash Data Robin Ness, Mgr. Crash Analysis & Reporting Unit Oregon Department of Transportation (ODOT) 17 th Annual Northwest Tribal Symposium Red
Traffic Safety Facts 2000
 DOT HS 809 326 U.S. Department of Transportation National Highway Traffic Safety Administration Traffic Safety Facts 2000 Motorcycles In 2000, 2,862 motorcyclists were killed and an additional 58,000 were
the Ministry of Transport is attributed as the source of the material images contained in the material are not copied
 Speed 2017 Disclaimer All reasonable endeavours are made to ensure the accuracy of the information in this report. However, the information is provided without warranties of any kind including accuracy,
DOT HS July 2012
 TRAFFIC SAFETY FACTS 2010 Data DOT HS 811 639 July 2012 Motorcycles In 2010, 4,502 motorcyclists were killed a slight increase from the 4,469 motorcyclists killed in 2009. There were 82,000 motorcyclists
Target Zero: Underutilized Strategies in Traffic Safety That Work
 Target Zero: Underutilized Strategies in Traffic Safety That Work James C. Fell National Opinion Research Center (NORC) at the University of Chicago, Bethesda, MD Office The Problem In 2015, 35,092 people
Understanding and Identifying Crashes on Curves for Safety Improvement Potential in Illinois
 Understanding and Identifying Crashes on Curves for Safety Improvement Potential in Illinois Priscilla Tobias, P.E. Mouyid Islam, Ph.D. Kim Kolody, P.E. Optional Agenda Image Title Background Workflow
I-95 Corridor-wide safety data analysis and identification of existing successful safety programs. Traffic Injury Research Foundation April 22, 2010
 I-95 Corridor-wide safety data analysis and identification of existing successful safety programs Traffic Injury Research Foundation April 22, 2010 Overview Background Methodology Purpose Crash analysis
2016 Community Report Los Alamos County
 6 Los Alamos County Produced for the New Mexico Department of Transportation, Traffic Safety Division, Traffic Records Bureau, Under Contract 58 by the University of New Mexico, Geospatial and Population
2015 Community Report White Rock
 5 White Rock Produced for the New Mexico Department of Transportation, Traffic Safety Division, Traffic Records Bureau, Under Contract 58 by the University of New Mexico, Geospatial and Population Studies,
Ontario s Large Truck Studies A s t r o n g t r a n s p o r t a t i o n f u t u r e t o g e t h e r
 Ontario s Large Truck Studies Fatigue and Carrier vs Driver Risk 11-06-18 A s t r o n g t r a n s p o r t a t i o n f u t u r e t o g e t h e r Two Studies One Goal Truck Safety Oversight Evaluation Determine
SPATIAL AND TEMPORAL PATTERNS OF FATIGUE RELATED CRASHES IN HAWAII
 SPATIAL AND TEMPORAL PATTERNS OF FATIGUE RELATED CRASHES IN HAWAII By Karl E. Kim Eric Y. Yamashita Hawaii CODES Project Traffic Records Forum July 29 - August 2, 2001 New Orleans, Louisiana Overview Background
2016 Community Report Torrance County
 6 Torrance County Produced for the New Mexico Department of Transportation, Traffic Safety Division, Traffic Records Bureau, Under Contract 58 by the University of New Mexico, Geospatial and Population
2015 Community Report Torrance County
 5 Torrance County Produced for the New Mexico Department of Transportation, Traffic Safety Division, Traffic Records Bureau, Under Contract 58 by the University of New Mexico, Geospatial and Population
National Center for Statistics and Analysis Research and Development
 U.S. Department of Transportation National Highway Traffic Safety Administration DOT HS 809 271 June 2001 Technical Report Published By: National Center for Statistics and Analysis Research and Development
2016 Community Report Portales
 6 Portales Produced for the New Mexico Department of Transportation, Traffic Safety Division, Traffic Records Bureau, Under Contract 58 by the University of New Mexico, Geospatial and Population Studies,
2016 Community Report De Baca County
 6 De Baca County Produced for the New Mexico Department of Transportation, Traffic Safety Division, Traffic Records Bureau, Under Contract 58 by the University of New Mexico, Geospatial and Population
2015 Community Report Grants
 5 Grants Produced for the New Mexico Department of Transportation, Traffic Safety Division, Traffic Records Bureau, Under Contract 58 by the University of New Mexico, Geospatial and Population Studies,
Alberta. Collision Facts. 330 people killed. 17,907 people injured. 140,705 collisions.
 Collision Facts 330 people killed 17,907 people injured 140,705 collisions May 2017 www.transportation.alberta.ca/statistics Collision Facts 330 people killed 17,907 people injured 140,705 collisions Monday
2016 Community Report Santa Fe County
 26 Santa Fe County Produced for the New Mexico Department of Transportation, Traffic Safety Division, Traffic Records Bureau, Under Contract 58 by the University of New Mexico, Geospatial and Population
A Preliminary Look At Safety Critical Events From The Motorcyclists Perspective
 A Preliminary Look At Safety Critical Events From The Motorcyclists Perspective Dr. Sherry Williams Director, Quality Assurance & Research Motorcycle Safety Foundation Dr. Jim Heideman Director, Licensing
2015 Community Report Las Vegas
 5 Las Vegas Produced for the New Mexico Department of Transportation, Traffic Safety Division, Traffic Records Bureau, Under Contract 58 by the University of New Mexico, Geospatial and Population Studies,
2015 Community Report Tularosa
 5 Tularosa Produced for the New Mexico Department of Transportation, Traffic Safety Division, Traffic Records Bureau, Under Contract 58 by the University of New Mexico, Geospatial and Population Studies,
2016 Community Report San Juan County
 26 San Juan County Produced for the New Mexico Department of Transportation, Traffic Safety Division, Traffic Records Bureau, Under Contract 58 by the University of New Mexico, Geospatial and Population
2015 Community Report San Juan County
 25 San Juan County Produced for the New Mexico Department of Transportation, Traffic Safety Division, Traffic Records Bureau, Under Contract 58 by the University of New Mexico, Geospatial and Population
2015 Community Report Doña Ana County
 25 Doña Ana County Produced for the New Mexico Department of Transportation, Traffic Safety Division, Traffic Records Bureau, Under Contract 58 by the University of New Mexico, Geospatial and Population
2015 Community Report Chaparral
 5 Chaparral Produced for the New Mexico Department of Transportation, Traffic Safety Division, Traffic Records Bureau, Under Contract 58 by the University of New Mexico, Geospatial and Population Studies,
Federal Motor Carrier Safety Administration
 Federal Motor Carrier Safety Administration Earl Hardy Senior Policy Advisor Office of the Assistant Administrator and Chief Safety Officer 2 Who We Are FMCSA Regulates 551,000 active motor carriers 13,000
2016 Community Report Aztec
 Aztec Produced for the New Mexico Department of Transportation, Traffic Safety Division, Traffic Records Bureau, Under Contract 58 by the University of New Mexico, Geospatial and Population Studies, Traffic
2015 Community Report Aztec
 25 Aztec Produced for the New Mexico Department of Transportation, Traffic Safety Division, Traffic Records Bureau, Under Contract 58 by the University of New Mexico, Geospatial and Population Studies,
HEAVY VEHICLE DRIVERS INVOLVED IN ROAD CRASHES IN SOUTH AUSTRALIA
 FACT SHEET HEAVY VEHICLE DRIVERS INVOLVED IN ROAD CRASHES IN SOUTH AUSTRALIA OVERVIEW Heavy vehicles 1 travel more than 1.3 billion kilometres per year in South Australia. represent 8% of the kilometres
2015 Community Report Los Lunas
 25 Los Lunas Produced for the New Mexico Department of Transportation, Traffic Safety Division, Traffic Records Bureau, Under Contract 58 by the University of New Mexico, Geospatial and Population Studies,
NEW JERSEY LAW ENFORCEMENT LIAISON NEWSLETTER
 NEW JERSEY LAW ENFORCEMENT LIAISON NEWSLETTER JUNE 2018/21 WWW..ORG NJ DIVISION OF HIGHWAY TRAFFIC SAFETY DRIVE SOBER OR GET PULLED OVER 2018 MOBILIZATION The mission of the Division of The Drive Sober
Statistics and Facts About Distracted Driving
 Untitled Document Statistics and Facts About Distracted Driving What does it mean to be a distracted driver? Are you one? Learn more here. What Is Distracted Driving? There are three main types of distraction:
2014 Community Report Portales
 4 Portales Produced for the New Mexico Department of Transportation, Traffic Safety Division, Traffic Records Bureau, Under Contract 58 by the University of New Mexico, Geospatial and Population Studies,
Florida Strategic Highway Safety Planning Florida Strategic Highway Safety Plan (SHSP) Update and Performance Overview
 Update and Performance Overview") Session 1 Florida Strategic Highway Safety Planning Florida Strategic Highway Safety Plan (SHSP) Update and Performance Overview Joe Santos, PE, FDOT, State Safety Office October, 23, 2013 Florida Statistics
Session 1 Florida Strategic Highway Safety Planning Florida Strategic Highway Safety Plan (SHSP) Update and Performance Overview Joe Santos, PE, FDOT, State Safety Office October, 23, 2013 Florida Statistics
2014 Community Report Luna County
 4 Luna County Produced for the New Mexico Department of Transportation, Traffic Safety Division, Traffic Records Bureau, Under Contract 58 by the University of New Mexico, Geospatial and Population Studies,
The Highway Safety Manual: Will you use your new safety powers for good or evil? April 4, 2011
 The Highway Safety Manual: Will you use your new safety powers for good or evil? April 4, 2011 Introductions Russell Brownlee, M.A. Sc., FITE, P. Eng. Specialize in road user and rail safety Transportation
Collect and analyze data on motorcycle crashes, injuries, and fatalities;
 November 2006 Highway Safety Program Guideline No. 3 Motorcycle Safety Each State, in cooperation with its political subdivisions and tribal governments and other parties as appropriate, should develop
Road Safety s Mid Life Crisis The Trends and Characteristics for Middle Aged Controllers Involved in Road Trauma
 Road Safety s Mid Life Crisis The Trends and Characteristics for Middle Aged Controllers Involved in Road Trauma Author: Andrew Graham, Roads and Traffic Authority, NSW Biography: Andrew Graham has been
2014 Community Report Las Vegas
 4 Las Vegas Produced for the New Mexico Department of Transportation, Traffic Safety Division, Traffic Records Bureau, Under Contract 58 by the University of New Mexico, Geospatial and Population Studies,
2014 Community Report Truth or Consequences
 4 Truth or Consequences Produced for the New Mexico Department of Transportation, Traffic Safety Division, Traffic Records Bureau, Under Contract 58 by the University of New Mexico, Geospatial and Population
2014 Community Report Tularosa
 4 Tularosa Produced for the New Mexico Department of Transportation, Traffic Safety Division, Traffic Records Bureau, Under Contract 8 by the University of New Mexico, Geospatial and Population Studies,
Lidia Kostyniuk, Ph.D., P.E. Truck Talk April, 28, 2010
 Linking CMV Driver History Records with Crashes Lidia Kostyniuk, Ph.D., P.E. Truck Talk April, 28, 2010 Background Project : Strategies to Reduce CMV-involved Crashes, Fatalities, and injuries in Michigan
LINKING CRASH RECORDS WITH EMS REGISTRY DATA
 LINKING CRASH RECORDS WITH EMS REGISTRY DATA Presentation by Nina Leung, PhD Injury Epidemiology & Surveillance Branch Texas Department of State Health Services PROJECT FUNDING 2 Traffic Safety Grant 2015-TDSHS-IS-G-1YG-0157
2014 Community Report Aztec
 Aztec Produced for the New Mexico Department of Transportation, Traffic Safety Division, Traffic Records Bureau, Under Contract 58 by the University of New Mexico, Geospatial and Population Studies, Traffic
Traffic Safety Facts 1996
 U.S. Department of Transportation National Highway Traffic Safety Administration Traffic Safety Facts 1996 Motorcycles In 1996, 2,160 motorcyclists were killed and an additional 56,000 were injured in
2014 Community Report Los Lunas
 4 Los Lunas Produced for the New Mexico Department of Transportation, Traffic Safety Division, Traffic Records Bureau, Under Contract 58 by the University of New Mexico, Geospatial and Population Studies,
2016 Community Report New Mexico
 216 Produced for the Department of Transportation, Traffic Safety Division, Traffic Records Bureau, Under Contract 581 by the University of, Geospatial and Population Studies, Traffic Research Unit Distributed
An Evaluation on the Compliance to Safety Helmet Usage among Motorcyclists in Batu Pahat, Johor
 An Evaluation on the Compliance to Safety Helmet Usage among Motorcyclists in Batu Pahat, Johor K. Ambak 1, *, H. Hashim 2, I. Yusoff 3 and B. David 4 1,2,3,4 Faculty of Civil and Environmental Engineering,
Alcohol in motorcycle crashes
 Alcohol in motorcycle crashes Haworth, N.L. Monash University, Australia. Wellington Road, Clayton, 3800, Australia ABSTRACT A case-control study of motorcycle crashes was undertaken in which injured riders
Percentage of crashes with driving too fast for the conditions cited as a contributing factor ( ) 0% 5% 10% 15% 20% 25% 30% 35% Percentage
 0% 5% 10% 15% 20% 25% 30% 35% Percentage") Speeding CRASH FACTSHEET November 2013 CRASH STATISTICS FOR THE YEAR ENDED 31 DECEMBER 2012 Prepared by the Ministry of Transport In this fact sheet speeding is defined as driving too fast for the conditions.
Speeding CRASH FACTSHEET November 2013 CRASH STATISTICS FOR THE YEAR ENDED 31 DECEMBER 2012 Prepared by the Ministry of Transport In this fact sheet speeding is defined as driving too fast for the conditions.
Alberta Speeding Convictions and Collisions Involving Unsafe Speed
 Alberta Speeding Convictions and Collisions Involving Unsafe Speed 2004-2008 Overview This document was prepared under the Alberta Traffic Safety Plan, Strategic Research Plan for 2008-2010, with the objective
Michigan State Police (MSP) Post 21 - Metro North
 Post 21 - Metro North") June 2018 Revised 8/3/2018 2017 Reporting Criteria Please pay particular attention to the wording when interpreting the three levels of data gathered for this report. Crash The Crash Level analyzes data
June 2018 Revised 8/3/2018 2017 Reporting Criteria Please pay particular attention to the wording when interpreting the three levels of data gathered for this report. Crash The Crash Level analyzes data
the Ministry of Transport is attributed as the source of the material
 Fatigue 2016 Disclaimer All reasonable endeavours are made to ensure the accuracy of the information in this report. However, the information is provided without warranties of any kind including accuracy,
Michigan State Police (MSP) Post 21 - Metro North
 Post 21 - Metro North") October 2017 2016 Reporting Criteria Please pay particular attention to the wording when interpreting the three levels of data gathered for this report. Crash The Crash Level analyzes data related to crash
October 2017 2016 Reporting Criteria Please pay particular attention to the wording when interpreting the three levels of data gathered for this report. Crash The Crash Level analyzes data related to crash
National Center for Statistics and Analysis Research and Development
 U.S. Department of Transportation National Highway Traffic Safety Administration DOT HS 809 360 October 2001 Technical Report Published By: National Center for Statistics and Analysis Research and Development
Austin Police Department. An Analysis of Traffic Fatalities 2015
 Austin Police Department An Analysis of Traffic Fatalities Prepared by the Austin Police Department Research and Planning Unit April Table of Contents Background... Overview... Terminology... Notes about
New York City Motorcycle Safety Study ALLEN MALLS: BEFORE, TEMPORARY MATERIALS, AFTER (CAPITAL): CHINATOWN (MANHATTAN)
: CHINATOWN (MANHATTAN)") New York City Motorcycle Safety Study 2014 Chris Brunson, Project Manager, Research Implementation and Safety Alicia Posner, Project Manager, Research Implementation and Safety New York City Department
New York City Motorcycle Safety Study 2014 Chris Brunson, Project Manager, Research Implementation and Safety Alicia Posner, Project Manager, Research Implementation and Safety New York City Department
Missouri Seat Belt Usage Survey for 2017
 Missouri Seat Belt Usage Survey for 2017 Conducted for the Highway Safety & Traffic Division of the Missouri Department of Transportation by The Missouri Safety Center University of Central Missouri Final
Traffic Safety Network Huron Valley
 June 2018 Revised 8/3/2018 2017 Reporting Criteria Please pay particular attention to the wording when interpreting the three levels of data gathered for this report. Crash The Crash Level analyzes data
A RISE IN MOTORCYCLE RIDER FATALITIES SINCE 2000
 MOTORCYCLE A motorcycle is commonly defined as any vehicle having a seat or saddle for the use of the operator designed to travel on at least two, and not more than three, wheels in contact with the ground,
MOTORCYCLE RELATED BYSTANDER ASSISTANCE TRAINING
 MOTORCYCLE RELATED BYSTANDER ASSISTANCE TRAINING Vicki Roberts-Sanfelipo, RN/EMT Director Accident Scene Mgt., Inc. (ASMI) Survey Coordinator ACCIDENT SCENE MANAGEMENT, INC. (ASMI) 400 Travis Lane #30,
ITSMR Research Note. Young Drivers on New York Roadways:
 January 2019 KEY FINDINGS In 2017: 113 persons were killed in motor vehicle crashes involving young drivers, compared to 139 in 2013. 22,485 persons were injured in young driver crashes, down 5% from 2013.
Evaluating The Relevancy Of Current Crash Test Guidelines For Roadside Safety Barriers On High Speed Roads
 Evaluating The Relevancy Of Current Crash Test Guidelines For Roadside Safety Barriers On High Speed Roads Connie Xavier Dominique Lord Chiara Dobrovolny Roger Bligh TRB 1 st International Roadside Safety
Percentage of crashes with fatigue as a factor ( ) 0% 2% 4% 6% 8% 10% 12% 14% 16% Percentage
 0% 2% 4% 6% 8% 10% 12% 14% 16% Percentage") Fatigue CRASH FACTSHEET November 2013 CRASH STATISTICS FOR THE YEAR ENDED 31 DECEMBER 2012 Prepared by the Ministry of Transport Fatigue is a physiological condition that can occur long before you fall
Fatigue CRASH FACTSHEET November 2013 CRASH STATISTICS FOR THE YEAR ENDED 31 DECEMBER 2012 Prepared by the Ministry of Transport Fatigue is a physiological condition that can occur long before you fall
Toward zero deaths: Who needs to do the heavy lifting?
 Toward zero deaths: Who needs to do the heavy lifting? (Motorcycle Crash Trend in Florida) Chanyoung Lee, Ph.D. Center for Urban Transportation Research University of South Florida Unprecedented Degree
Highway Safety Update
 Highway Safety Update January 26, 2018 Karin Mongeon, Safety Division Bryon Fuchs, Local Government NDDOT Safety Division The Traffic Records Program Collect and analyze crash data to identify traffic
The National Association of State Motorcycle Safety Administrators (SMSA) Strategic Plan
 Strategic Plan") The National Association of State Motorcycle Safety Administrators (SMSA) Strategic Plan PURPOSE This Strategic Plan will serve as a roadmap to define the future of the National Association of State Motorcycle
The National Association of State Motorcycle Safety Administrators (SMSA) Strategic Plan PURPOSE This Strategic Plan will serve as a roadmap to define the future of the National Association of State Motorcycle
ROADWAY INJURY EXPERIENCE FOR PERSONS WHO HAD BEEN DRINKING AND/OR USING DRUGS
 ROADWAY INJURY EXPERIENCE FOR PERSONS WHO HAD BEEN DRINKING AND/OR USING DRUGS Vehicle Severity Total Crashes involving drinking, not drugs Crashes involving drugs, not drinking Crashes involving drinking
The older driver crash picture: trends and factors
 The older driver crash picture: trends and factors Lifesavers National Conference on Highway Safety Priorities Chicago, IL March 17, 2015 Anne T. McCartt Passenger vehicle driver crash rates Per mile traveled,
TRAFFIC SAFETY FACTS Fatal Motor Vehicle Crashes: Overview. Research Note. DOT HS October 2017
 TRAFFIC SAFETY FACTS Research Note DOT HS 812 456 October 2017 2016 Fatal Motor Vehicle Crashes: Overview There were 37,461 people killed in crashes on U.S. roadways during 2016, an increase from 35,485
Non-standard motorcycle helmets in low and middleincome
 Non-standard motorcycle helmets in low and middleincome nations: A Multi-country Study Rationale Motorcycles are a common and increasing form of transport in many LMIC Efficacy of helmets in reducing serious
Brian Holman. Presiding Judge City of Lewisville
 Brian Holman Presiding Judge City of Lewisville Nationwide, motorcycle crash fatalities have increased every year since 2000. In Texas, motorcycle-related fatalities have increased more than 11% over the
The use of protective clothing by motorcyclists in Victoria: Evaluation of the Community Policing and Education Project
 Tuesday, August 21, 2012 The use of protective clothing by motorcyclists in Victoria: Evaluation of the Community Policing and Education Project Dr Matthew Baldock Mr Craig Kloeden Prof Mary Lydon Mr Giulio
Motorcyclist Deaths Jan Jul. 2018
 Motorcyclist Deaths Jan. 2008 Jul. 2018 This report summarizes all accidental deaths of motorcyclists in traffic-related motor vehicle incidents (MVIs) between January 1, 2008 and July 30, 2018. Inclusion
D1.3 FINAL REPORT (WORKPACKAGE SUMMARY REPORT)
") WP 1 D1.3 FINAL REPORT (WORKPACKAGE SUMMARY REPORT) Project Acronym: Smart RRS Project Full Title: Innovative Concepts for smart road restraint systems to provide greater safety for vulnerable road users.
WP 1 D1.3 FINAL REPORT (WORKPACKAGE SUMMARY REPORT) Project Acronym: Smart RRS Project Full Title: Innovative Concepts for smart road restraint systems to provide greater safety for vulnerable road users.
City State Zip. Mistake 1 Mistake 2 Mistake 3 Mistake 4 Mistake 5. Mistake 6 Mistake 7 Mistake 8 Mistake 9 Mistake 10
 SCOUT S INFORMATION MERIT BADGE COUNSELOR INFORMATION Name Name Phone Address Organization City State Zip WORKBOOK INFORMATION Scoutmaster Bucky Workbook based off of Boy Scout Requirements 2018 Edition
Motorcycle Crashes in Minnesota
 MINNESOTA DEPARTMENT OF TRANSPORTATION Motorcycle Crashes in Minnesota Trends 2012-2014 Katie R. Fleming, M.A. 12/31/2015 Table of Contents List of Figures... ii List of Tables... iii Executive Summary...
In-depth investigations of accidents involving powered two wheelers. Final Report 1.2. September 2004
 M ID In-depth investigations of accidents involving powered two wheelers Final Report 1.2 September 2004 This document is the property of ACEM. It is not to be copied or distributed without the permission
Analysis of Road Crash Statistics Western Australia 1990 to Report. December Project: Transport/21
 Analysis of Road Crash Statistics Western Australia 1990 to 1999 Report December 2000 Project: Transport/21 Analysis of Road Crash Statistics Western Australia 1990 to 1999 December 2000 Client: Transport
Apples Vs. Oranges : Comparing Safety Performance of Different Modes
 Apples Vs. Oranges : Comparing Safety Performance of Different Modes Dr. Rongfang (Rachel) Liu Watchung Transportation LLC New Jersey Institute of Technology June 2012, Dallas Tx OVERVIEW Background Comparison
Washtenaw County Traffic Crash Data & Year Trends. Reporting Criteria
 June 2018 Revised 8/3/2018 2017 Reporting Criteria Please pay particular attention to the wording when interpreting the three levels of data gathered for this report. Crash The Crash Level analyzes data
Unit 1 - Driving, Mobility and Laws. Chapter 1 - Driving and Mobility
 The outline listed below is meant to be used as a reference for the placement of The Driving Zone 2 DVD clips into Responsible Driving text book where they may provide benefit and talking points for the
The Emerging Risk of Fatal Motorcycle Crashes with Guardrails
 Gabler (Revised 1-24-2007) 1 The Emerging Risk of Fatal Motorcycle Crashes with Guardrails Hampton C. Gabler Associate Professor Department of Mechanical Engineering Virginia Tech Center for Injury Biomechanics
Traffic Safety Facts. Alcohol Data. Alcohol-Related Crashes and Fatalities
 Traffic Safety Facts 2005 Data Alcohol There were 16,885 alcohol-related fatalities in 2005 39 percent of the total traffic fatalities for the year. Alcohol-Related Crashes and Fatalities DOT HS 810 616
Washtenaw County Traffic Crash Data & Year Trends. Reporting Criteria
 June 2017 Revised 10/3/17 2016 Reporting Criteria Please pay particular attention to the wording when interpreting the three levels of data gathered for this report. Crash The Crash Level analyzes data