ENTUCKY RANSPORTATION C ENTER
|
|
|
- Buck Colin Ryan
- 5 years ago
- Views:
Transcription
1 Research Report KTC-05-39/TA F T K ENTUCKY RANSPORTATION C ENTER College of Engineering SOCIO-ECONOMIC ANALYSIS OF FATAL CRASH TRENDS (Final Report)
2 Our Mission We provide services to the transportation community through research, technology transfer and education. We create and participate in partnerships to promote safe and effective transportation systems. We Value... Teamwork -- Listening and Communicating, Along with Courtesy and Respect for Others Honesty and Ethical Behavior Delivering the Highest Quality Products and Services Continuous Improvement in All That We Do For more information or a complete publication list, contact us KENTUCKY TRANSPORTATION CENTER 176 Raymond Building University of Kentucky Lexington, Kentucky (859) (859) (FAX) ktc@engr.uky.edu The University of Kentucky is an Equal Opportunity Organization
3 Research Report KTC / TA F SOCIO-ECONOMIC ANALYSIS OF FATAL CRASH TRENDS (Final Report) by Adam J. Kirk Jerry G. Pigman and Kenneth R. Agent Kentucky Transportation Center College of Engineering University of Kentucky Lexington, Kentucky Accuracy of the information presented herein is the responsibility of the authors and the Kentucky Transportation Center. This report does not constitute a standard, specification, or regulation. The inclusion of manufacturer names and trade names is for identification purposes and is not to be considered an endorsement. December 2005
4 1. Report Number KTC / TA F 2. Government Accession No. 3. Recipient s Catalog No. 4. Title and Subtitle Socioeconomic Analysis of Fatal Crashes 5. Report Date December Performing Organization Code 7. Author(s) A. J. Kirk, J. G. Pigman, K. R. Agent 9. Performing Organization Name and Address Kentucky Transportation Center College of Engineering University of Kentucky Lexington, Kentucky Sponsoring Agency Name and Address Community Transportation Innovation Academy 8. Performing Organization Report No. 10. Work Unit No. 11. Contract or Grant No. 13. Type of Report and Period Covered: Final; 06/04 12/ Sponsoring Agency Code 15. Supplementary Notes 16. Abstract This report describes the analysis of fatal crash patterns and explores the impact of socioeconomic factors and safety regulations on statewide crash rates. This analysis separated statewide crash rates between 2002 and 2004 into two samples, 1) those with crash rates 25 percent greater than the average national rate and 2) those with crash rates lower than this threshold. Safety regulations and socioeconomic factors were identified as having a significant effect on crash rates, with socioeconomic factors showing a higher potential to explain differences in crash rates between the two samples. 17. Key Words Fatal Accident Safety Regulations Fatal Crashes Socioeconomic Factors 18. Distribution Statement Unlimited 19. Security Classification (report) 20. Security Classification (this page) i 21. No. of Pages Price
5 Table of Contents Executive Summary...iii 1. Introduction Methodology National Fatal Crash Rate Regression Analysis Statistical Analysis of Fatal Crashes (National) Kentucky Fatal Crash Analysis Fatal Crash Type Analysis Results National Fatal Crash Rate Regression Analysis Results Statistical Analysis of Fatal Crashes Results Kentucky Fatal Crash Analysis Results Fatal Crash Type Analysis Results Summary and Conclusions List of Figures Figure 1: States with High Fatal Crash Rates (>1.25(μ))... 4 Figure 2: Fatal Crash Type Analysis Figure 3: Fatal Crashes by Time of Day Figure 4 Fatal Crashes by Light Conditions Figure 5: Fatal Crash Type by Weather Conditions List of Tables Table 1: Regression Analysis Independent Variables... 2 Table 2: Standardized Coefficients... 7 Table 2: Standardized Coefficients... 8 Table 3: Fatal Crash Characteristic Statistical Analysis Results... 9 ii
6 Executive Summary This report describes the analysis of fatal crash patterns and explores the impact of socioeconomic factors and safety regulations on statewide crash rates. This analysis separated statewide crash rates between 2002 and 2004 into two samples, 1) those with crash rates 25 percent greater than the average national rate and 2) those with crash rates lower than this threshold. Safety regulations and socioeconomic factors were identified as having a significant effect on crash rates, with socioeconomic factors showing a higher potential to explain differences in crash rates between the two samples. Based upon the analysis presented above the following conclusions are made concerning contributing factors and conditions surrounding fatal crash rates in the United States. 1. Statistical analysis of national crash data indicates that socioeconomic factors including income, poverty levels and education levels have a high correlation with fatal crash rates. Kentucky specific analysis indicated that high school education attainment levels was the most significant indicator of high crash rates when examined on a county level. 2. Statistical analysis indicated that traffic safety laws can decrease the fatal crash rate with the most significant impacts associated with: a. Administrative License Revocation b. Graduated Licensing Program c. Primary Seat Belt Enforcement Law d. Mandatory Helmet Law Overall, the impact of laws and regulations was significantly less than socioeconomic factors examined in the study. 3. Crash type experience for both the southeastern high crash states and western high crash states is very similar and follow the same trends. 4. States with average crash rates were shown to have a higher percentage of single vehicle crashes than those in the high crash states. Conversely, rear end and angle crashes were shown to have higher distributions in high crash states. One possible explanation for this could be related to driver experience in which more rural states, such as the high crash states, provide drivers with more experience on rural roadways but less experience in urban settings. This experience would then lead to improved driving on rural roadways, where the potential for a single vehicle crash is higher, but could also lead to a greater potential for crashes when faced with an urban setting. 5. When examining environmental conditions, the general trend in all categories is similar for both the high crash states and other states. However, southeastern states are shown to have a percentage of fatal crashes occurring during the iii
7 morning period (7 a.m. - 9 a.m.) than other states. A slightly higher distribution is also present during the evening period, between 7 p.m. and 10 p.m., for both the southeastern and western high crash states. These patterns are also similar to the findings for light conditions, in which the high crash states were shown to have an higher percentage of fatal crashes during partially lit conditions such as dawn and dusk conditions. iv
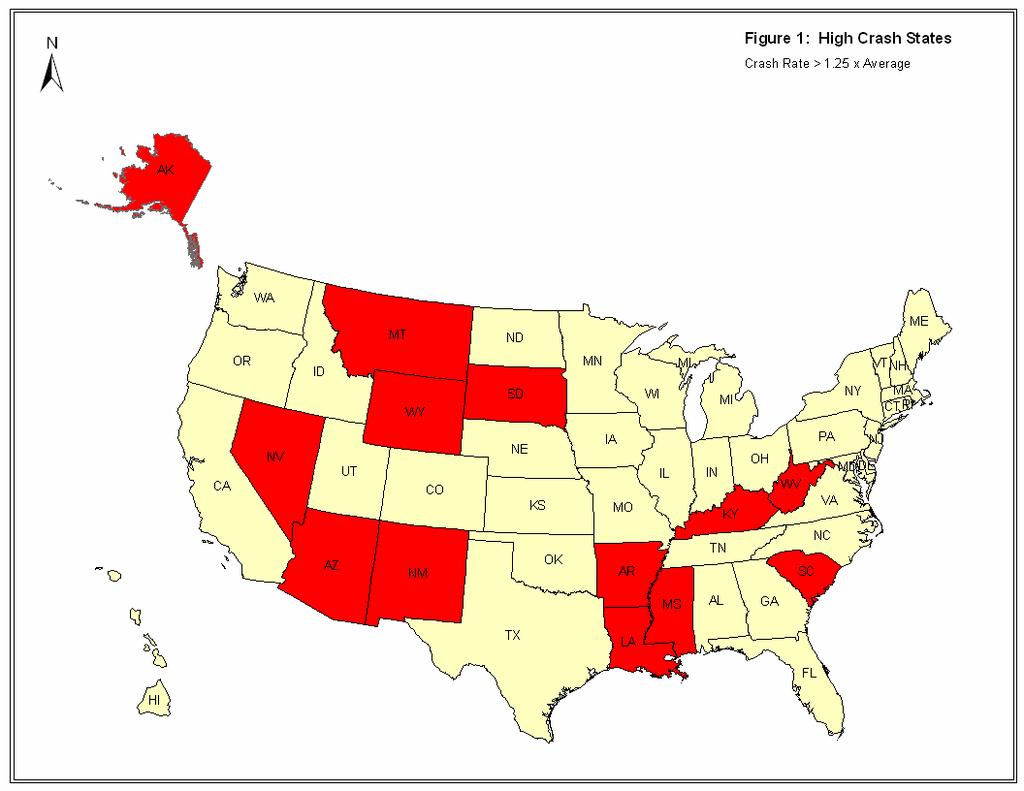
8 1. Introduction Fatal highway crashes in the United States continue to result in alarming numbers of fatalities each year. As compiled and reported by the National Highway Traffic Safety Administration (NHTSA) in their Traffic Safety Facts 2003 Overview, motor vehicle crashes are the leading cause of death for persons from 2 through 22 years of age (based on 2000 data). In addition, it was reported that 42,643 people were killed and 2,889,000 injured in However, the national crash rate in terms of fatalities per 100 million vehicle miles (F/100MVM) of travel has decreased in recent years to a historic low of This decreasing trend nationally has been in place since the mid 1980 s. Even with this overall decreasing trend, the 2002 statistics showed there were 12 states with fatal crash rates that exceeded the national crash rate by 25 percent or more. The states with highest crash rates included Arizona, Arkansas, Kentucky, Louisiana, Mississippi, Montana, Nevada, New Mexico, South Carolina, South Dakota, West Virginia, and Wyoming. In Kentucky, the fatality crash rate has increased from 1.71 F/100MVM in 1999 to 2.07 in In addition, the number of fatalities in Kentucky has reached the highest level in many years with 978 deaths in The objectives of this research study were to analyze fatal traffic crash characteristics in the 12 states with highest rates. Analyses were performed to evaluate the relationship between crash rates and contributing factors. Among those to be considered are the following variables: types of roads, geographic location, socio-economic characteristics of drivers, and characteristics of vehicles being driven. The effectiveness of various laws and regulations aimed at improving roadway safety were also examined with respect to fatal crashes. Fatal crash characteristics in Kentucky were then examined with respect to the same variables evaluated for the national data. Kentucky data were disaggregated to the county level to determine if fatal crashes in Kentucky follow the same trends as the national fatalities. Fatal crash types were examined to identify higher involvements of certain crash types for those states with higher a rate of fatal crashes. 2. Methodology Fatal crash analysis was conducted in two phases to identify contributing factors to increased fatal crash rates on the national level. First, national crash data were analyzed with respect to socio-economic and geographic factors to identify potential contributing factors. Based upon the findings of this research, Kentucky fatal crash data were analyzed to identify differences between national and state crash trends. Analysis of national fatal crash trends was conducted using data provided by the Fatality Analysis Reporting System (FARS). These data were supplemented with socio- 1
9 economic data from the US Census Bureau and the Bureau of Transportation Statistics. National analysis was conducted in two parts. First, regression analysis was performed using general state-level data form the US Census and Bureau of Transportation Statistics to identify potential factors which influence increased fatal crash rates. Statistical analysis was then performed on the individual FARS records comparing various attributes of crashes between those states having crash rates in the top quartile of the nation to the remaining states. It should be noted that this study was conducted over a two-year time period and every effort was made to use the most recently available data. Due to new releases of the FARS database this study examined data as well as data. Kentucky specific analysis aimed to reproduce the national statistical analysis on a county level. This analysis utilized the FARS database and census data used in the national analysis. Procedures for these analyses are presented below. 2.1 National Fatal Crash Rate Regression Analysis Regression analysis was performed on state level data with the fatal crash rate serving as the dependent variable. Crash rates for each state in the United States were obtained from the Fatality Analysis Reporting System (FARS) for the years 2001, 2002 and 2003, providing 150 observations. Independent variables were then obtained to characterize socio-economic, transportation infrastructure and road-user factors for each state. Table 1 summarizes the independent variables evaluated in the analysis and the source of the data. Table 1: Regression Analysis Independent Variables Independent Variable Data Source Median Income US Census Bureau (2000) Percent of Population Below Poverty Level US Census Bureau (2000) Percent of Population with High School Degree or Equivalent US Census Bureau (2000) Percent of Population with College Degree US Census Bureau (2000) Mean Age of Registered Drivers Bureau of Transportation Statistics State Population US Census Bureau (2000) Statewide Population Density (ppl/sq. mi.) Calculated Percent of Registered Vehicles that are Trucks (Light or Heavy) Bureau of Transportation Statistics Total Vehicle Miles of Travel Bureau of Transportation Statistics Percent of VMT on Rural Roads Bureau of Transportation Statistics Percent of VMT on Local Rural Roads Bureau of Transportation Statistics Average Travel Time to Work Bureau of Transportation Statistics Average Annual Precipitation National Oceanic and Atmospheric Administration (NOAA) Primary Seat Belt Law National Highway Transportation Safety Administration 2
10 Derivations of each of the variables listed above were also developed for use in the initial analysis including the square and Log 10 of each variable to determine if crash rates followed a linear, polynomial or logarithmic distribution based on each of the independent variables. Binary variables were developed based on each of the independent variables indicating whether the observed value was in the bottom, middle or top third of all observations. A linear regression model was then developed using a stepwise approach to identify those variables with the most significant impact on statewide fatal crash rates. A P-value of 0.05 was used as the threshold for determining significance of variables in the model. Additional analysis was also conducted to determine the effectiveness of laws and regulations, aimed at improving traffic safety, on reducing fatal crash rates. The laws examined are those that are connected with the FHWA Section 410 Grant Incentive Program and include: Administrative License Revocation 0.08 BAC per se law Graduated Licensing Program (as recommended by NHTSA) Primary Seat Belt Enforcement Mandatory Helmet Law State specific data was collected from the National Highway Traffic Safety Administration (NHTSA) State Traffic Safety Information System for each of the three study years (2002, 2003 and 2004). The results of this analysis are presented and discussed in Section Statistical Analysis of Fatal Crashes (National) Crash data provided by the FARS database for the years 2002, 2003 and 2004 were analyzed to identify significant differences in the characteristics of fatal crashes between those states having high fatal crash rates and those states with fatal crash rates at or below the national average. This analysis examined vehicular and passenger characteristics of fatal crashes including: Vehicle Age Vehicle Type Rollover Crashes Driver Age Driver Sex Restraint Use Airbag Availability Identified Contributing Factors Roadway 3
11 Vehicle Driver FARS data was separated into two sample groups, Sample A which had an average fatal crash rate greater than 25 percent above the national average and Sample B which included all remaining states. Figure 1 provides a map identifying those states in Sample A. The mean value and standard error of the mean for the two samples was determined, and a Z-test was conducted to determine if there are statistically significant differences between the mean values of the two samples. A 95 percent confidence interval was used to determine statistical significance, which corresponds to a Z-value of The results of the analysis are summarized and discussed in Section
12 5
13 2.3 Kentucky Fatal Crash Analysis Statistical analysis was also performed for Kentucky fatal crashes on a county level to determine if the contributing socioeconomic factors identified in the national analysis also apply to Kentucky crash experience. US Census data was collected for all 120 Kentucky counties including age, median income, poverty levels, educational attainment and population density. An average fatal crash rate for each county was determined using three years ( ) of fatal crash data from the FARS database and VMT estimated from the HPMS ADT data. The results of this analysis are presented in Section Fatal Crash Type Analysis Based upon crash information recorded in the FARS database, crash types were determined for all fatal crashes in the study period. The distribution of different crash types was compared for those states having a fatal crash rate 25 percent higher than the national average (Sample A, above) and the remaining states (Sample B). As seen in Figure 1, high fatal crash states are either located in the southeast or in the western states. Crash types were also examined by disaggregating the high fatal crash states into the southeast and western states to determine if they experience different crash patterns due to the local geography. The results of this analysis are presented in Section Results 3.1 National Fatal Crash Rate Regression Analysis Results As discussed above a linear regression model was developed to identify relationships between socio-economic and transportation infrastructure factors to the statewide fatal crash rates. Only those independent variables which had a P-value of 0.05 or less, indicating a 95 percent confidence in the relationship, were included in the final model. Based upon this analysis, four factors were identified as having a statistically significant impact on fatal crash rates. Mean Income (I) Percent of Population below the Poverty Line (P) Population Density (Pd) Percent of Population with High School Degree or Equivalent (HS) The following equation relates these variables to the statewide crash rate. EQ 1. CrashRate= Log(I) P Log(Pd) HS a a: HS factor only applied to those observations in the top third of observations. 6
14 The model identified above has an R value of and an adjusted R 2 value of 0.584, indicating that almost 60 percent of the variation in statewide fatal crash rates can be explained by these four variables. Table 2 lists the standardized coefficients and the estimated P-Value for each variable. The standardized coefficients are developed based on a normalization of the variables where each normalized variable has a standard deviation of 1. The standardized coefficients allow for direct comparison of the magnitude of impact for each variable on the crash rate. Table 2: Standardized Coefficients Standardized P- Variable Coefficient Value Log (Income) (Poverty Level) Log (Pop. Dens.) High School As can be seen from the table, all values examined had a P-value less than 0.05 indicating greater than a 95 percent confidence level of the significance of the variable in determining fatal crash rates. All coefficients are negative except for poverty level indicating that crash rate decreases with increasing income, population density and high school graduation levels. Crash rates are shown to increase with increasing percentages of populations below the poverty level. Population density is shown to have the largest impact on crash rate with a standardized coefficient of indicating a significantly higher crash rate in less dense, more rural states. The magnitude of the impact of poverty levels and high school education are similar around A separate regression model was also developed to identify the effectiveness of traffic safety laws which are applied by many states. This analysis examined laws that are connected with the FHWA Section 410 Grant Incentive Program which include: Administrative License Revocation (Revoke) 0.08 BAC per se law (BAC) Graduated Licensing Program (as recommended by NHTSA) (Grad) Primary Seat Belt Enforcement (Belt) Mandatory Helmet Law (Helmet) The following equation relates these variables to the statewide crash rate. EQ 2. CrashRate= (Revoke) (BAC) (Grad) (Belt) (Helmet) 7
15 The model identified above has an R value of and an adjusted R 2 value of 0.116, indicating that approximately 10 percent of the variation in statewide fatal crash rates can be explained by the presence (or absence) of these laws. It is noted that the socioeconomic model presented above provides a significantly higher R 2 value indicating that extraneous factors have a much higher influence on fatal crash trends than state regulations. Table 3 lists the standardized coefficients and the estimated P-Value for each variable. The standardized coefficients are developed based on a normalization of the variables where each normalized variable has a standard deviation of 1. The standardized coefficients allow for direct comparison of the magnitude of impact for each variable on the crash rate. Table 3: Standardized Coefficients Standardized P- Variable Coefficient Value Revoke BAC Grad Belt Helmet All laws examined demonstrated a negative impact on the fatal crash rate except for the 0.08 BAC threshold, which also had a P-value of indicating a low confidence level in the effect of the 0.08 threshold. This could largely be influenced by the fact that those states not enforcing a 0.08 threshold may utilize a BAC only slightly higher than 0.08 such as 0.10 and the overall difference between the two thresholds is negligible. In addition, the mandatory helmet law, while demonstrating a negative influence on the fatal crash rate, had a P-value of 0.147, indicating an 85 percent confidence level in the findings. However, this lower confidence interval is likely attributed to the relatively small percentage of motorcycles in relation to automobiles which are involved in fatal crashes. Mandatory helmet laws should therefore be assumed to have a positive impact on improving fatal crash rates. All other factors demonstrate a significant impact on reducing fatal crash rates with administrative license revocation having the largest impact. While administrative license revocation may be a deterrent from reckless driving and keep poor drivers off the roadway it may also be indicative of the commitment from the state to improving the safety of the state transportation system. 3.2 Statistical Analysis of Fatal Crashes Results The results of the statistical analysis of fatal crashes are presented in Table 4. Statistical significance was found between the mean value of the two samples for all variables examined, except for driver gender, which showed the same distribution of male and 8
16 female drivers in both samples. The difference across all characteristics examined suggests that the reason certain states have significantly higher crash rates compared to others is due to a number of factors acting in concert and cannot be attributed to a single factor. Table 4: Fatal Crash Characteristic Statistical Analysis Results Variable Mean Value Other State High Crash State Z-Value Crash Location Intersection Related Divided Highway Vehicle Characteristics Vehicle Age Vehicle Type (% Auto) Airbag Availability Occupant Characteristics Driver Age Driver Gender (1 Female; 2 Male) Restraint Use (Fatalities Only) Contributing Factors Roadway Vehicle Driver Rollover As can be seen from Table 4, the average vehicle age is shown to be higher in states with higher fatal crash rates, by approximately 0.25 years. This higher vehicular age, may be responsible for the lower availability of airbags and the higher number of vehicle related factors contributing to the crash being reporting for these states. The older vehicle age for high crash states may be the result of the reported lower median incomes for these states. A higher percentage of sport utility vehicles and trucks is also shown to be involved in fatal crashes in these states when compared to other states. This may also be a contributing factor to the higher percentage of rollover crashes present in high crash states. Drivers involved in fatal crashes in high crash states were shown to have a lower average age than the other states. This is especially significant considering that there is no appreciable difference in the average age of all registered drivers between the two samples. However, contrary to what would be expected with a lower driver age and lower driver education, reported driver related factors contributing to the crash were actually lower in states with high crash rates than in other states. 9
17 Proper restraint belt use of fatalities is shown to be significantly lower in the high fatal crash states than it is in other states. When the use of both a shoulder and a lap belt is examined, use decreases in both samples decrease with a significantly lower reported use (22 percent) in high crash states compared to the other states (28 percent). This may be indicative of both driver education as well as vehicle age, similar to the availability of air bags. As discussed, the lower income and subsequent older average vehicle age in high crash states may contribute to the lower availability of air bags and shoulder and lap belt restraints in vehicles. However, as safety equipment improves and is deployed in more vehicles, it is possible that older vehicles will soon have similar safety systems as newer vehicles, which may aid in reducing the fatal crash rate among these states. 3.3 Kentucky Fatal Crash Analysis Results As discussed above, a linear regression model was developed to identify relationships between socio-economic factors and fatal crash rates within Kentucky counties. Only those independent variables which had a P-value of 0.05 or less, indicating a 95 percent confidence in the relationship were included in the final model. Based upon this analysis, high school graduation rate was identified as having a statistically significant impact on fatal crash rates. The following equation relates these variables to the county crash rate. EQ 1. CrashRate= (HS) The model identified above has an R value of and an adjusted R 2 value of 0.301, indicating that over 30 percent of the variation in Kentucky s fatal crash rates can be explained by this single variable. High school education levels were determined to have a P-value of indicating a confidence interval greater than percent that high school education is a significant factor influencing crash rates within the model. All other factors examined within the national analysis were initially included within the Kentucky specific analysis, however, none produced statistically significant findings greater than the 0.05 threshold and did not significantly increase the R 2 value for the model. 3.4 Fatal Crash Type Analysis Results Fatal crashes were evaluated for the distribution of crash type based upon the manner of collision data provided in FARS database. Six specific crash types were examined. These are: 1. Single Vehicle Crashes 2. Rear End Crashes 3. Head On Crashes 4. Angle Crashes 10
18 5. Sideswipe Crashes (Same Direction) 6. Sideswipe Crashes (Opposite Direction) Figure 2 compares the distribution of these fatal crash types for those states with a high fatal crash rates (Sample A) and those states with average or below average fatal crash rates (Sample B). Additionally, distributions are provided for high fatal crash states in the southeast and for those states in the western states. Figure 2: Fatal Crash Type Analysis Sample B Sample A A (Southeast) A (Western ) Single Vehicle Rear End Head-On Angle Sideswipe (Same Direction) Sideswipe (Opp. Direction) Crash rates for both groups of states show the same general trend, however, upon closer examination, several distinct differences are present. When examining single vehicle crashes, states with average crash rates are shown to have a higher percentage than those in the high crash states. Conversely, when examining rear end and angle crashes, states with high crash rates are shown to have a higher representation of these crash types than other states. This analysis is surprising in the fact that high crash states are shown to have a lower population density and a higher percentage of rural roadways in which the potential for a single vehicle crash is greater, which is in direct conflict with the findings. Likewise, those states with lower fatal crash rates tend to have higher population densities and therefore increase the chance for more urban crash types such as rear end and angle crashes. One possible explanation for this occurrence could be related to driver experience. In more rural states, drivers will generally have more experience with rural roadway conditions and therefore while having less experience in urban settings. This experience 11
19 would then lead to improved driving on rural roadways, where the potential for a single vehicle crash is higher, but could also lead to a greater potential for crashes when faced with an urban setting. The converse could also be true for more urban areas in which drivers have greater experience with urban situations and therefore have a lower propensity for urban crashes and a higher propensity for rural crashes. It should also be noted that the crash type experience for both the southeastern and western high crash states is very similar and follow the same trends. Crash records were also analyzed for environmental factors that may contribute to the increased fatal crash rate in high crash states. Analysis examined crashes by time of day, lighting conditions and weather conditions. Figures 3, 4 and 5 show the results of this analysis. The general trend in all categories is similar for both the high crash states and other states. However, southeastern states are shown to have a higher percentage of fatal crashes occurring during the morning period (7 a.m. - 9 a.m.) than other states. A slightly higher distribution is also present during the evening period, between 7 p.m. and 10 p.m., for both the southeastern and western high crash states. These patterns are also similar to the findings of light conditions, in which the high crash states are shown to have a higher percentage of fatal crashes during partially lit conditions such as dawn and dusk conditions. Figure 3: Fatal Crashes by Time of Day Sample B Sample A A (Southeast) A (Western) AM Noon PM Eve Off 12
20 Figure 4 Fatal Crashes by Light Conditions Sample B Sample A A (Southeast) A (Western) Light Dark Partial Figure 5: Fatal Crash Type by Weather Conditions Sample B Sample A A (Southeast) A (Western) Dry Rain/Snow Other 13
21 4.0 Summary and Conclusions Based upon the analysis presented above the following conclusions are made concerning contributing factors and conditions surrounding fatal crash rates in the United States. 6. Statistical analysis of national crash data indicates that socioeconomic factors including income, poverty levels and education levels have a high correlation with fatal crash rates. Kentucky specific analysis indicated that high school education attainment levels was the most significant indicator of high crash rates when examined on a county level. 7. Statistical analysis indicated that traffic safety laws can decrease the fatal crash rate with the most significant impacts associated with: a. Administrative License Revocation b. Graduated Licensing Program c. Primary Seat Belt Enforcement Law d. Mandatory Helmet Law Overall, the impact of laws and regulations was significantly less than socioeconomic factors examined in the study. 8. Crash type experience for both the southeastern high crash states and western high crash states is very similar and follow the same trends. 9. States with average crash rates were shown to have a higher percentage of single vehicle crashes than those in the high crash states. Conversely, rear end and angle crashes were shown to have higher distributions in high crash states. One possible explanation for this could be related to driver experience in which more rural states, such as the high crash states, provide drivers with more experience on rural roadways but less experience in urban settings. This experience would then lead to improved driving on rural roadways, where the potential for a single vehicle crash is higher, but could also lead to a greater potential for crashes when faced with an urban setting. 10. When examining environmental conditions, the general trend in all categories is similar for both the high crash states and other states. However, southeastern states are shown to have a percentage of fatal crashes occurring during the morning period (7 a.m. - 9 a.m.) than other states. A slightly higher distribution is also present during the evening period, between 7 p.m. and 10 p.m., for both the southeastern and western high crash states. These patterns are also similar to the findings for light conditions, in which the high crash states were shown to have an higher percentage of fatal crashes during partially lit conditions such as dawn and dusk conditions. 14
KENTUCKY TRANSPORTATION CENTER
 Research Report KTC-08-10/UI56-07-1F KENTUCKY TRANSPORTATION CENTER EVALUATION OF 70 MPH SPEED LIMIT IN KENTUCKY OUR MISSION We provide services to the transportation community through research, technology
National Center for Statistics and Analysis Research and Development
 U.S. Department of Transportation National Highway Traffic Safety Administration DOT HS 809 271 June 2001 Technical Report Published By: National Center for Statistics and Analysis Research and Development
National Center for Statistics and Analysis Research and Development
 U.S. Department of Transportation National Highway Traffic Safety Administration DOT HS 809 360 October 2001 Technical Report Published By: National Center for Statistics and Analysis Research and Development
TRAFFIC SAFETY FACTS. Overview Data
 TRAFFIC SAFETY FACTS 2009 Data Overview Motor vehicle travel is the primary means of transportation in the United States, providing an unprecedented degree of mobility. Yet for all its advantages, injuries
DOT HS April 2013
 TRAFFIC SAFETY FACTS 2011 Data DOT HS 811 753 April 2013 Overview Motor vehicle travel is the primary means of transportation in the United States, providing an unprecedented degree of mobility. Yet for
Evaluation of Kentucky s Driver License Point System
 Transportation Kentucky Transportation Center Research Report University of Kentucky Year 1998 Evaluation of Kentucky s Driver License Point System Kenneth R. Agent Nick Stamatiadis Jerry G. Pigman University
Where are the Increases in Motorcycle Rider Fatalities?
 Where are the Increases in Motorcycle Rider Fatalities? Umesh Shankar Mathematical Analysis Division (NPO-121) Office of Traffic Records and Analysis National Center for Statistics and Analysis National
Traffic Safety Facts. Alcohol Data. Alcohol-Related Crashes and Fatalities
 Traffic Safety Facts 2005 Data Alcohol There were 16,885 alcohol-related fatalities in 2005 39 percent of the total traffic fatalities for the year. Alcohol-Related Crashes and Fatalities DOT HS 810 616
DOT HS October 2011
 TRAFFIC SAFETY FACTS 2009 Data DOT HS 811 389 October 2011 Motorcycles Definitions often vary across publications with respect to individuals on motorcycles. For this document, the following terms will
An Evaluation of the Relationship between the Seat Belt Usage Rates of Front Seat Occupants and Their Drivers
 An Evaluation of the Relationship between the Seat Belt Usage Rates of Front Seat Occupants and Their Drivers Vinod Vasudevan Transportation Research Center University of Nevada, Las Vegas 4505 S. Maryland
HAS MOTORIZATION IN THE U.S. PEAKED? PART 2: USE OF LIGHT-DUTY VEHICLES
 UMTRI-2013-20 JULY 2013 HAS MOTORIZATION IN THE U.S. PEAKED? PART 2: USE OF LIGHT-DUTY VEHICLES MICHAEL SIVAK HAS MOTORIZATION IN THE U.S. PEAKED? PART 2: USE OF LIGHT-DUTY VEHICLES Michael Sivak The University
IS THE U.S. ON THE PATH TO THE LOWEST MOTOR VEHICLE FATALITIES IN DECADES?
 UMTRI-2008-39 JULY 2008 IS THE U.S. ON THE PATH TO THE LOWEST MOTOR VEHICLE FATALITIES IN DECADES? MICHAEL SIVAK IS THE U.S. ON THE PATH TO THE LOWEST MOTOR VEHICLE FATALITIES IN DECADES? Michael Sivak
DOT HS July 2012
 TRAFFIC SAFETY FACTS 2010 Data DOT HS 811 639 July 2012 Motorcycles In 2010, 4,502 motorcyclists were killed a slight increase from the 4,469 motorcyclists killed in 2009. There were 82,000 motorcyclists
Fatal Motor Vehicle Crashes on Indian Reservations
 April 2004 DOT HS 809 727 Fatal Motor Vehicle Crashes on Indian Reservations 1975-2002 Technical Report Colleges & Universities 2% Other Federal Properties 9% Other 4% Indian Reservations 65% National
RELATIVE COSTS OF DRIVING ELECTRIC AND GASOLINE VEHICLES
 SWT-2018-1 JANUARY 2018 RELATIVE COSTS OF DRIVING ELECTRIC AND GASOLINE VEHICLES IN THE INDIVIDUAL U.S. STATES MICHAEL SIVAK BRANDON SCHOETTLE SUSTAINABLE WORLDWIDE TRANSPORTATION RELATIVE COSTS OF DRIVING
TRAFFIC SAFETY FACTS Fatal Motor Vehicle Crashes: Overview. Research Note. DOT HS October 2017
 TRAFFIC SAFETY FACTS Research Note DOT HS 812 456 October 2017 2016 Fatal Motor Vehicle Crashes: Overview There were 37,461 people killed in crashes on U.S. roadways during 2016, an increase from 35,485
Traffic Safety Facts 2000
 DOT HS 809 326 U.S. Department of Transportation National Highway Traffic Safety Administration Traffic Safety Facts 2000 Motorcycles In 2000, 2,862 motorcyclists were killed and an additional 58,000 were
Development of Turning Templates for Various Design Vehicles
 Transportation Kentucky Transportation Center Research Report University of Kentucky Year 1991 Development of Turning Templates for Various Design Vehicles Kenneth R. Agent Jerry G. Pigman University of
MOTORISTS' PREFERENCES FOR DIFFERENT LEVELS OF VEHICLE AUTOMATION: 2016
 SWT-2016-8 MAY 2016 MOTORISTS' PREFERENCES FOR DIFFERENT LEVELS OF VEHICLE AUTOMATION: 2016 BRANDON SCHOETTLE MICHAEL SIVAK SUSTAINABLE WORLDWIDE TRANSPORTATION MOTORISTS' PREFERENCES FOR DIFFERENT LEVELS
Analysis of Road Crash Statistics Western Australia 1990 to Report. December Project: Transport/21
 Analysis of Road Crash Statistics Western Australia 1990 to 1999 Report December 2000 Project: Transport/21 Analysis of Road Crash Statistics Western Australia 1990 to 1999 December 2000 Client: Transport
Effect of Subaru EyeSight on pedestrian-related bodily injury liability claim frequencies
 Highway Loss Data Institute Bulletin Vol. 34, No. 39 : December 2017 Effect of Subaru EyeSight on pedestrian-related bodily injury liability claim frequencies Summary This Highway Loss Data Institute (HLDI)
DOT HS September NHTSA Technical Report
 DOT HS 809 144 September 2000 NHTSA Technical Report Analysis of the Crash Experience of Vehicles Equipped with All Wheel Antilock Braking Systems (ABS)-A Second Update Including Vehicles with Optional
Traffic Safety Facts 1996
 U.S. Department of Transportation National Highway Traffic Safety Administration Traffic Safety Facts 1996 Motorcycles In 1996, 2,160 motorcyclists were killed and an additional 56,000 were injured in
DOT HS August Motor Vehicle Crashes: Overview
 TRAFFIC SAFETY FACTS Research Note DOT HS 812 318 August 2016 2015 Motor Vehicle Crashes: Overview The Nation lost 35,092 people in crashes on U.S. roadways during 2015, an increase from 32,744 in 2014.
American Driving Survey,
 RESEARCH BRIEF American Driving Survey, 2015 2016 This Research Brief provides highlights from the AAA Foundation for Traffic Safety s 2016 American Driving Survey, which quantifies the daily driving patterns
HAS MOTORIZATION IN THE U.S. PEAKED? PART 5: UPDATE THROUGH 2012
 UMTRI-2014-11 APRIL 2013 HAS MOTORIZATION IN THE U.S. PEAKED? PART 5: UPDATE THROUGH 2012 MICHAEL SIVAK HAS MOTORIZATION IN THE U.S. PEAKED? PART 5: UPDATE THROUGH 2012 Michael Sivak The University of
Understanding Traffic Data: How To Avoid Making the Wrong Turn
 Traffic Records Forum 2011 Understanding Traffic Data: How To Avoid Making the Wrong Turn Presenter: Marc Starnes (202) 366-2186 marc.starnes@dot.gov August 3rd, 2011 1 Summary of Topics Police Crash Reports
The Truth About Light Trucks
 RISK Despite critics claims, SUVs are saving lives. The Truth About Light Trucks The american love affair with the automobile has grown to include the class of vehicles known as light trucks, which includes
STUDY OF AIRBAG EFFECTIVENESS IN HIGH SEVERITY FRONTAL CRASHES
 STUDY OF AIRBAG EFFECTIVENESS IN HIGH SEVERITY FRONTAL CRASHES Jeya Padmanaban (JP Research, Inc., Mountain View, CA, USA) Vitaly Eyges (JP Research, Inc., Mountain View, CA, USA) ABSTRACT The primary
KENTUCKY TRANSPORTATION CENTER
 Research Report KTC-11-15/KSP2-11-1F KENTUCKY TRANSPORTATION CENTER ANALYSIS OF TRAFFIC CRASH DATA IN KENTUCKY (2006-2010) OUR MISSION We provide services to the transportation community through research,
Honda Accord theft losses an update
 Highway Loss Data Institute Bulletin Vol. 34, No. 20 : September 2017 Honda Accord theft losses an update Executive Summary Thefts of tires and rims have become a significant problem for some vehicles.
2015 Community Report Grants
 5 Grants Produced for the New Mexico Department of Transportation, Traffic Safety Division, Traffic Records Bureau, Under Contract 58 by the University of New Mexico, Geospatial and Population Studies,
Figure 15. Yearly Trend in Death Rates for Motor Vehicle Transport: NSW, Year
 6.0 MOTOR VEHICLE TRANSPORT 6.1 Deaths due to Motor Vehicle Transport: The motor vehicle transport (MV) death rate showed a statistically significant decrease overall between 1989 and 1999 although the
2016 Community Report Los Alamos County
 6 Los Alamos County Produced for the New Mexico Department of Transportation, Traffic Safety Division, Traffic Records Bureau, Under Contract 58 by the University of New Mexico, Geospatial and Population
KANSAS Occupant Protection Observational Survey Supplementary Analyses Summer Study
 KANSAS Occupant Protection Observational Survey Supplementary Analyses 2018 Summer Study Submitted To: Kansas Department of Transportation Bureau of Transportation Safety and Technology Prepared by: DCCCA
2015 Community Report White Rock
 5 White Rock Produced for the New Mexico Department of Transportation, Traffic Safety Division, Traffic Records Bureau, Under Contract 58 by the University of New Mexico, Geospatial and Population Studies,
2014 Community Report Portales
 4 Portales Produced for the New Mexico Department of Transportation, Traffic Safety Division, Traffic Records Bureau, Under Contract 58 by the University of New Mexico, Geospatial and Population Studies,
2014 Community Report Luna County
 4 Luna County Produced for the New Mexico Department of Transportation, Traffic Safety Division, Traffic Records Bureau, Under Contract 58 by the University of New Mexico, Geospatial and Population Studies,
2016 Community Report Torrance County
 6 Torrance County Produced for the New Mexico Department of Transportation, Traffic Safety Division, Traffic Records Bureau, Under Contract 58 by the University of New Mexico, Geospatial and Population
2015 Community Report Torrance County
 5 Torrance County Produced for the New Mexico Department of Transportation, Traffic Safety Division, Traffic Records Bureau, Under Contract 58 by the University of New Mexico, Geospatial and Population
MOTORISTS' PREFERENCES FOR DIFFERENT LEVELS OF VEHICLE AUTOMATION
 UMTRI-2015-22 JULY 2015 MOTORISTS' PREFERENCES FOR DIFFERENT LEVELS OF VEHICLE AUTOMATION BRANDON SCHOETTLE MICHAEL SIVAK MOTORISTS' PREFERENCES FOR DIFFERENT LEVELS OF VEHICLE AUTOMATION Brandon Schoettle
2016 Community Report Portales
 6 Portales Produced for the New Mexico Department of Transportation, Traffic Safety Division, Traffic Records Bureau, Under Contract 58 by the University of New Mexico, Geospatial and Population Studies,
I-95 high-risk driver analysis using multiple imputation methods
 I-95 high-risk driver analysis using multiple imputation methods Kyla Marcoux Traffic Injury Research Foundation New Orleans, Louisiana July 26, 2010 Acknowledgements Authors: Robertson, R., Wood, K.,
2016 Community Report De Baca County
 6 De Baca County Produced for the New Mexico Department of Transportation, Traffic Safety Division, Traffic Records Bureau, Under Contract 58 by the University of New Mexico, Geospatial and Population
Factors Affecting Highway Safety in Louisiana
 Factors Affecting Highway Safety in Louisiana Conducted by the Louisiana Transportation Research Center for the Louisiana Department of Transportation and Development Results Fatality rates 1999 2004 3
UMTRI An Examination of the Michigan 2010 Motor Vehicle Traffic Crash Fatality Increase
 UMTRI-2011-31 An Examination of the Michigan 2010 Motor Vehicle Traffic Crash Fatality Increase Carol A. Flannagan Andrew J. Leslie Helen K. Spradlin Charles P. Compton Caroline S. Lupini September 2011
2015 Community Report Las Vegas
 5 Las Vegas Produced for the New Mexico Department of Transportation, Traffic Safety Division, Traffic Records Bureau, Under Contract 58 by the University of New Mexico, Geospatial and Population Studies,
NEW-VEHICLE MARKET SHARES OF CARS VERSUS LIGHT TRUCKS IN THE U.S.: RECENT TRENDS AND FUTURE OUTLOOK
 SWT-2017-10 JUNE 2017 NEW-VEHICLE MARKET SHARES OF CARS VERSUS LIGHT TRUCKS IN THE U.S.: RECENT TRENDS AND FUTURE OUTLOOK MICHAEL SIVAK BRANDON SCHOETTLE SUSTAINABLE WORLDWIDE TRANSPORTATION NEW-VEHICLE
2014 Community Report Las Vegas
 4 Las Vegas Produced for the New Mexico Department of Transportation, Traffic Safety Division, Traffic Records Bureau, Under Contract 58 by the University of New Mexico, Geospatial and Population Studies,
2015 Community Report Tularosa
 5 Tularosa Produced for the New Mexico Department of Transportation, Traffic Safety Division, Traffic Records Bureau, Under Contract 58 by the University of New Mexico, Geospatial and Population Studies,
2014 Community Report Truth or Consequences
 4 Truth or Consequences Produced for the New Mexico Department of Transportation, Traffic Safety Division, Traffic Records Bureau, Under Contract 58 by the University of New Mexico, Geospatial and Population
2014 Community Report Tularosa
 4 Tularosa Produced for the New Mexico Department of Transportation, Traffic Safety Division, Traffic Records Bureau, Under Contract 8 by the University of New Mexico, Geospatial and Population Studies,
2016 Community Report Santa Fe County
 26 Santa Fe County Produced for the New Mexico Department of Transportation, Traffic Safety Division, Traffic Records Bureau, Under Contract 58 by the University of New Mexico, Geospatial and Population
Quick Facts General Statistics. Fatality Rate per 100,000 Population Source: FARS/Census
 Fatal Crashes 2016 34,439 2015 32,539 2014 30,056 Fatality Rate per 100 Million VMT 2016 1.18 2015 1.15 2014 1.08 /FHWA 2016 37,461 2015 35,485 2014 32,744 General Statistics Fatality Rate per 100,000
2015 Community Report Chaparral
 5 Chaparral Produced for the New Mexico Department of Transportation, Traffic Safety Division, Traffic Records Bureau, Under Contract 58 by the University of New Mexico, Geospatial and Population Studies,
2016 Community Report Aztec
 Aztec Produced for the New Mexico Department of Transportation, Traffic Safety Division, Traffic Records Bureau, Under Contract 58 by the University of New Mexico, Geospatial and Population Studies, Traffic
2015 Community Report Aztec
 25 Aztec Produced for the New Mexico Department of Transportation, Traffic Safety Division, Traffic Records Bureau, Under Contract 58 by the University of New Mexico, Geospatial and Population Studies,
2014 Community Report Aztec
 Aztec Produced for the New Mexico Department of Transportation, Traffic Safety Division, Traffic Records Bureau, Under Contract 58 by the University of New Mexico, Geospatial and Population Studies, Traffic
2016 Community Report San Juan County
 26 San Juan County Produced for the New Mexico Department of Transportation, Traffic Safety Division, Traffic Records Bureau, Under Contract 58 by the University of New Mexico, Geospatial and Population
2015 Community Report San Juan County
 25 San Juan County Produced for the New Mexico Department of Transportation, Traffic Safety Division, Traffic Records Bureau, Under Contract 58 by the University of New Mexico, Geospatial and Population
Statement before the New Hampshire House Transportation Committee. Research on primary-enforcement safety belt use laws
 Statement before the New Hampshire House Transportation Committee Research on primary-enforcement safety belt use laws Jessica B. Cicchino, Ph.D. Insurance Institute for Highway Safety The Insurance Institute
2015 Community Report Doña Ana County
 25 Doña Ana County Produced for the New Mexico Department of Transportation, Traffic Safety Division, Traffic Records Bureau, Under Contract 58 by the University of New Mexico, Geospatial and Population
Missouri Seat Belt Usage Survey for 2017
 Missouri Seat Belt Usage Survey for 2017 Conducted for the Highway Safety & Traffic Division of the Missouri Department of Transportation by The Missouri Safety Center University of Central Missouri Final
2015 Community Report Los Lunas
 25 Los Lunas Produced for the New Mexico Department of Transportation, Traffic Safety Division, Traffic Records Bureau, Under Contract 58 by the University of New Mexico, Geospatial and Population Studies,
2014 Community Report Los Lunas
 4 Los Lunas Produced for the New Mexico Department of Transportation, Traffic Safety Division, Traffic Records Bureau, Under Contract 58 by the University of New Mexico, Geospatial and Population Studies,
TRAFFIC SAFETY CONFERENCE. John A. Barton, P.E. Deputy Executive Director
 TRAFFIC SAFETY CONFERENCE John A. Barton, P.E. Deputy Executive Director June 9, 2015 Introduction TxDOT Mission Work with others to provide safe and reliable transportation solutions for Texas 2 Fatalities
AusRAP assessment of Peak Downs Highway 2013
 AusRAP assessment of Peak Downs Highway 2013 SUMMARY The Royal Automobile Club of Queensland (RACQ) commissioned an AusRAP assessment of Peak Downs Highway based on the irap protocol. The purpose is to
TRAFFIC VOLUME TRENDS
 Page 1 U. S. Department Transportation Federal Highway Administration Office Highway Policy Information TRAFFIC VOLUME TRENDS September Travel on all roads and streets changed by +2.5 (5.8 billion vehicle
HAS MOTORIZATION IN THE U.S. PEAKED? PART 9: VEHICLE OWNERSHIP AND DISTANCE DRIVEN, 1984 TO 2015
 SWT-2017-4 FEBRUARY 2017 HAS MOTORIZATION IN THE U.S. PEAKED? PART 9: VEHICLE OWNERSHIP AND DISTANCE DRIVEN, 1984 TO 2015 MICHAEL SIVAK SUSTAINABLE WORLDWIDE TRANSPORTATION HAS MOTORIZATION IN THE U.S.
Enhancing School Bus Safety and Pupil Transportation Safety
 For Release on August 26, 2002 (9:00 am EDST) Enhancing School Bus Safety and Pupil Transportation Safety School bus safety and pupil transportation safety involve two similar, but different, concepts.
Evaluation of motorcycle antilock braking systems
 Bulletin Vol. 31, No. 11 : September 2014 Evaluation of motorcycle antilock braking systems Summary Previous studies have shown that antilock braking systems (ABS) reduce insurance claim rates and fatal
ON-ROAD FUEL ECONOMY OF VEHICLES
 SWT-2017-5 MARCH 2017 ON-ROAD FUEL ECONOMY OF VEHICLES IN THE UNITED STATES: 1923-2015 MICHAEL SIVAK BRANDON SCHOETTLE SUSTAINABLE WORLDWIDE TRANSPORTATION ON-ROAD FUEL ECONOMY OF VEHICLES IN THE UNITED
Driver Personas. New Behavioral Clusters and Their Risk Implications. March 2018
 Driver Personas New Behavioral Clusters and Their Risk Implications March 2018 27 TABLE OF CONTENTS 1 2 5 7 8 10 16 18 19 21 Introduction Executive Summary Risky Personas vs. Average Auto Insurance Price
Abstract. 1. Introduction. 1.1 object. Road safety data: collection and analysis for target setting and monitoring performances and progress
 Road Traffic Accident Involvement Rate by Accident and Violation Records: New Methodology for Driver Education Based on Integrated Road Traffic Accident Database Yasushi Nishida National Research Institute
TRANSPORTATION EMISSIONS IN THE CONTEXT
 SWT-2016-9 JULY 2016 TRANSPORTATION EMISSIONS IN THE CONTEXT OF EMISSIONS FROM OTHER ECONOMIC SECTORS: 1990-2014 MICHAEL SIVAK BRANDON SCHOETTLE SUSTAINABLE WORLDWIDE TRANSPORTATION TRANSPORTATION EMISSIONS
Introduction. Julie C. DeFalco Policy Analyst 125.
 Introduction The federal Corporate Average Fuel Economy (CAFE) standards were originally imposed in the mid-1970s as a way to save oil. They turned out to be an incredibly expensive and ineffective way
HAS MOTORIZATION IN THE U.S. PEAKED? PART 10: VEHICLE OWNERSHIP AND DISTANCE DRIVEN, 1984 TO 2016
 SWT-2018-2 JANUARY 2018 HAS MOTORIZATION IN THE U.S. PEAKED? PART 10: VEHICLE OWNERSHIP AND DISTANCE DRIVEN, 1984 TO 2016 MICHAEL SIVAK SUSTAINABLE WORLDWIDE TRANSPORTATION HAS MOTORIZATION IN THE U.S.
Department of Highway Safety and Motor Vehicles
 Department of Highway Safety and Motor Vehicles Traffic Report 2005 A Compilation of Motor Vehicle Crash Data from the Florida Crash Records Database Fred O. Dickinson Executive Director Our Mission: Making
National Household Travel Survey Add-On Use in the Des Moines, Iowa, Metropolitan Area
 National Household Travel Survey Add-On Use in the Des Moines, Iowa, Metropolitan Area Presentation to the Transportation Research Board s National Household Travel Survey Conference: Data for Understanding
DRIVER SPEED COMPLIANCE WITHIN SCHOOL ZONES AND EFFECTS OF 40 PAINTED SPEED LIMIT ON DRIVER SPEED BEHAVIOURS Tony Radalj Main Roads Western Australia
 DRIVER SPEED COMPLIANCE WITHIN SCHOOL ZONES AND EFFECTS OF 4 PAINTED SPEED LIMIT ON DRIVER SPEED BEHAVIOURS Tony Radalj Main Roads Western Australia ABSTRACT Two speed surveys were conducted on nineteen
Rates of Motor Vehicle Crashes, Injuries, and Deaths in Relation to Driver Age, United States,
 RESEARCH BRIEF This Research Brief provides updated statistics on rates of crashes, injuries and death per mile driven in relation to driver age based on the most recent data available, from 2014-2015.
Comparison of 2013 VMT Fatality Rates in the States and in High-Income Countries
 Comparison of 2013 VMT Fatality Rates in the States and in High-Income Countries Transportation Research Board 96th Annual Meeting Session 536 Analysis of International Road Safety Data January 10, 2017
Analysis of Traffic Crash Data in Kentucky ( )
") Transportation Kentucky Transportation Center Research Report University of Kentucky Year 2014 Analysis of Traffic Crash Data in Kentucky (2009-2013) Eric R. Green Kenneth R. Agent Jerry G. Pigman Michael
Transportation Kentucky Transportation Center Research Report University of Kentucky Year 2014 Analysis of Traffic Crash Data in Kentucky (2009-2013) Eric R. Green Kenneth R. Agent Jerry G. Pigman Michael
TOWARD SAFE AND RELIABLE ROADWAYS. Jill Ryan, MPH Eagle County Commissioner
 TOWARD SAFE AND RELIABLE ROADWAYS Jill Ryan, MPH Eagle County Commissioner Where Does CDOT Money Go? FY2012 (in CDOT millions) Expenditures $1,104,588,163* $684.3 [63%] MAINTAIN What We Have 15% 14% 5%
Vehicle Scrappage and Gasoline Policy. Online Appendix. Alternative First Stage and Reduced Form Specifications
 Vehicle Scrappage and Gasoline Policy By Mark R. Jacobsen and Arthur A. van Benthem Online Appendix Appendix A Alternative First Stage and Reduced Form Specifications Reduced Form Using MPG Quartiles The
2016 Community Report New Mexico
 216 Produced for the Department of Transportation, Traffic Safety Division, Traffic Records Bureau, Under Contract 581 by the University of, Geospatial and Population Studies, Traffic Research Unit Distributed
Who has trouble reporting prior day events?
 Vol. 10, Issue 1, 2017 Who has trouble reporting prior day events? Tim Triplett 1, Rob Santos 2, Brian Tefft 3 Survey Practice 10.29115/SP-2017-0003 Jan 01, 2017 Tags: missing data, recall data, measurement
Delaware Information and Analysis Center
 Delaware Information and Analysis Center 2015 DELAWARE THERE WERE 684,731 LICENSED DRIVERS, 892,508 REGISTERED MOTOR VEHICLES, AND 9,761,000,000 VEHICLE MILES DRIVEN*. THERE WERE 24,066 TRAFFIC CRASHES
Shedding light on the nighttime driving risk
 Shedding on the nighttime driving risk An analysis of fatal crashes under dark conditions in the U.S., 1999-2008 Russell Henk, P.E., Senior Research Engineer Val Pezoldt, Research Scientist Bernie Fette,
ENTUCKY RANSPORTATION C ENTER
 Research Report KTC-97-06/SPR96-172 T K ENTUCKY RANSPORTATION C ENTER College of Engineering EVALUATION OF SPEED LIMITS IN KENTUCKY UNIVERSITY OF KENTUCKY Our Mission We provide services to the transportation
Statistics and Facts About Distracted Driving
 Untitled Document Statistics and Facts About Distracted Driving What does it mean to be a distracted driver? Are you one? Learn more here. What Is Distracted Driving? There are three main types of distraction:
Traffic Safety Facts. School-Transportation-Related Crashes Data. Overview. Person Type. Key Findings
 Traffic Safety Facts 2006 2015 Data August 2017 DOT HS 812 366 School-Transportation-Related Crashes Key Findings From 2006 to 2015 there were 1,313 people of all ages killed in schooltransportation-related
Road Safety s Mid Life Crisis The Trends and Characteristics for Middle Aged Controllers Involved in Road Trauma
 Road Safety s Mid Life Crisis The Trends and Characteristics for Middle Aged Controllers Involved in Road Trauma Author: Andrew Graham, Roads and Traffic Authority, NSW Biography: Andrew Graham has been
BENEFITS OF RECENT IMPROVEMENTS IN VEHICLE FUEL ECONOMY
 UMTRI-2014-28 OCTOBER 2014 BENEFITS OF RECENT IMPROVEMENTS IN VEHICLE FUEL ECONOMY MICHAEL SIVAK BRANDON SCHOETTLE BENEFITS OF RECENT IMPROVEMENTS IN VEHICLE FUEL ECONOMY Michael Sivak Brandon Schoettle
Collect and analyze data on motorcycle crashes, injuries, and fatalities;
 November 2006 Highway Safety Program Guideline No. 3 Motorcycle Safety Each State, in cooperation with its political subdivisions and tribal governments and other parties as appropriate, should develop
FHWA Motorcycle Crash Causation Study
 Office of Safety Research and Development FHWA Motorcycle Crash Causation Study Carol H. Tan, Ph.D Office of Safety Research & Development 2017 SMSA Sept 28, 2017 1 Presentation Overview Background Data
Purpose and Need Report
 Purpose and Need Report State Highway (SH) 29 From Southwestern Boulevard to SH 95 Williamson County, Texas (CSJ: 0337-02-045) Prepared by Blanton & Associates, Inc. Date: November, 2015 The environmental
Remote Combination Adaptive Driving Equipment Investigation Dynamic Science, Inc. (DSI), Case Number G 1990 Ford Bronco Arizona October
, Case Number G 1990 Ford Bronco Arizona October") Remote Combination Adaptive Driving Equipment Investigation Dynamic Science, Inc. (DSI), Case Number 2007-76-131G 1990 Ford Bronco Arizona October 2007 This document is disseminated under the sponsorship
Remote Combination Adaptive Driving Equipment Investigation Dynamic Science, Inc. (DSI), Case Number 2007-76-131G 1990 Ford Bronco Arizona October 2007 This document is disseminated under the sponsorship
The Evolution of Side Crash Compatibility Between Cars, Light Trucks and Vans
 2003-01-0899 The Evolution of Side Crash Compatibility Between Cars, Light Trucks and Vans Hampton C. Gabler Rowan University Copyright 2003 SAE International ABSTRACT Several research studies have concluded
CHAPTER TWO AUTO CRASH STATISTICS
 CHAPTER TWO AUTO CRASH STATISTICS Age and Its Impact: Teen Drivers Teen Driving Statistics Age and Its Impact: Elderly Drivers Elderly Driving Statistics Auto Crash Statistics AGE AND ITS IMPAC T: TEEN