Half Year 17 Presentation. 29 November 2016
|
|
|
- Chloe Byrd
- 6 years ago
- Views:
Transcription

1 Half Year 17 Presentation 29 November 2016
2 Important information The information in this presentation is of a general nature and does not constitute financial product advice, investment advice or any recommendation. Nothing in this presentation constitutes legal, financial, tax or other advice. This presentation may contain projections or forward-looking statements regarding a variety of items. Such projections or forwardlooking statements are based on current expectations, estimates and assumptions and are subject to a number of risks, uncertainties and assumptions. There is no assurance that results contemplated in any projections or forward-looking statements in this presentation will be realised. Actual results may differ materially from those projected in this presentation. No person is under any obligation to update this presentation at any time after its release to you or to provide you with further information about EROAD. While reasonable care has been taken in compiling this presentation, none of EROAD nor its subsidiaries, directors, employees, agents or advisers (to the maximum extent permitted by law) gives any warranty or representation (express or implied) as to the accuracy, completeness or reliability of the information contained in it nor takes any responsibility for it. The information in this presentation has not been and will not be independently verified or audited. 2
3 EROAD OVERVIEW

4 About EROAD World first GPS based road user charging system in New Zealand Operations in New Zealand, Australia, Oregon, Washington and Idaho Sole heavy vehicle technology supplier for California Road Charge Pilot 43,430 units across three countries EROAD s services offered include: 1. Tax 2. Compliance services 3. Commercial services EROAD s system consists of: Electronic Distance Recorder (In-cab Hardware) Electronic Logbook application (Mobile Software) Cloud based online applications portal (Software) Bank Grade Payment Gateway 4
5 EROAD in New Zealand and Australia NEW ZEALAND MARKET $1.6 billion of RUC is collected annually $1.1 billion from 155,000 Heavy Vehicles All vehicles over 3.5 tonnes must be fitted with an approved distance recorder Health and Safety regulations have increased EROAD s addressable market to over 600,000 vehicles EROAD now collects 36% of all Heavy Vehicle RUC, up from 31% last year an annualised collection rate of $445 million $500,000,000 $450,000,000 $400,000,000 $350,000,000 $300,000,000 $250,000,000 $200,000,000 $150,000,000 $100,000,000 EROAD ANNUALISED RUC COLLECTION $445,835,542 AUSTRALIAN MARKET Australia has an estimated 700,000 Heavy Vehicles and 2.6 million light commercial vehicles To date, EROAD has sold the majority of units to Australia based EROAD New Zealand customers While political interest in road user based charging exists, any implementation is a number of years away With EROAD at 38,129 units across Australia & New Zealand 36% there remains capacity for continued growth $50,000,000 $- Jan-10 Apr-10 Source: EROAD to September % Jul-10 RUC Market Share RUC Market Share Oct-10 Jan-11 Apr-11 Jul-11 Oct-11 Jan-12 Apr-12 Jul-12 Oct-12 Jan-13 Apr-13 $445 million Jul-13 Oct-13 Jan-14 Annualised RUC collection rate Apr-14 Jul-14 Oct-14 Jan-15 Apr-15 Jul-15 Oct-15 Jan-16 Apr-16 Jul-16 Sep-16 38,129 units Across Australia and NZ 5


6 EROAD in North America OREGON In April 14, after three years of pilots and regulatory audits, EROAD launched its Ehubo2, designed to support Weight Mile Tax (WMT) in Oregon and a wide range of regulatory & commercial services across the North American market. There are 306,000 vehicles registered for Oregon WMT, that are located across the US, with the majority based in the North West. With EROAD at 5,301 units, the majority in the North West, EROAD now has an established US base. NORTH AMERICA North America has a number of significant Federal regulations that affect heavy vehicles, including, IFTA and ELD. IFTA (International Fuel Tax Agreement) covers over 3 million vehicles across US States and Canadian Provinces requiring accurate reporting of mileage and fuel consumption, by state, to calculate fuel tax. ELD covers all US States, requiring 4 million Inter-state heavy vehicles to fit an Electronic Logging Device (ELD) and adopt electronic recording of driver hours (HOS) by December EROAD has reorganised its sales approach to ensure it can address the nationwide opportunity created by the ELD regulations. EROAD s platform covers a wide range of customer needs from Oregon WMT to IFTA, ELD and driver safety. 4 million Vehicles required to have electronic device installed 5,301 units 6
7 How EROAD creates shareholder value 1. Identify and foster market opportunities R&D and Business Development 2. Design, develop and validate solution with stakeholders e.g. California: Road Charge pilot e.g. USA: Electronic Logging Devices (ELD) 3. Establish commercial operations to address market opportunity Operations, Sales, Business Processes, Customer Service 4. Build long term sustainable business that continues to meet needs of all stakeholders e.g. USA: International Fuel Tax Agreement (IFTA) e.g. Oregon: Weight Mile Tax e.g. New Zealand: Road User Charges (RUC) and Health and Safety 7
8 HALF YEAR RESULTS
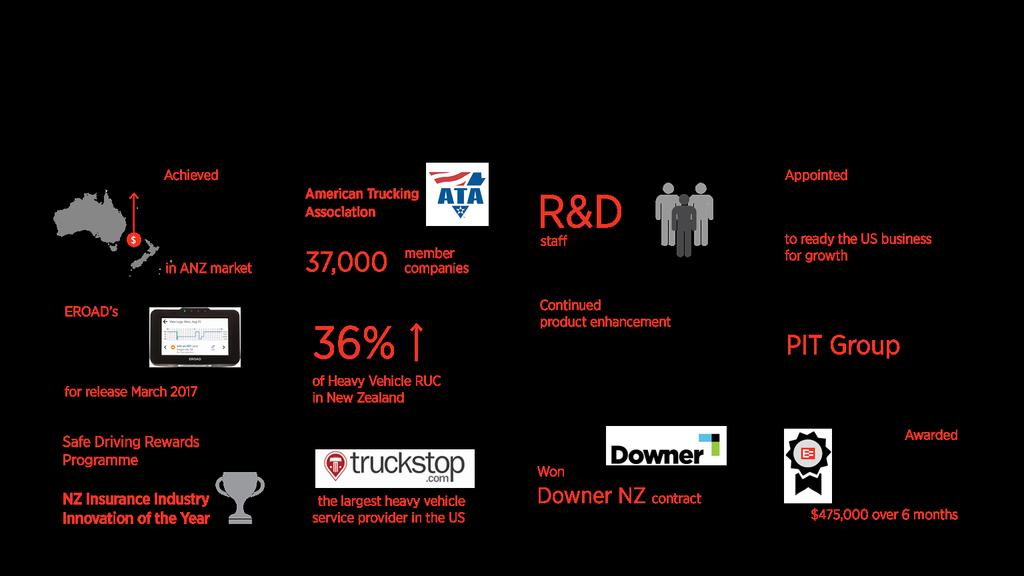
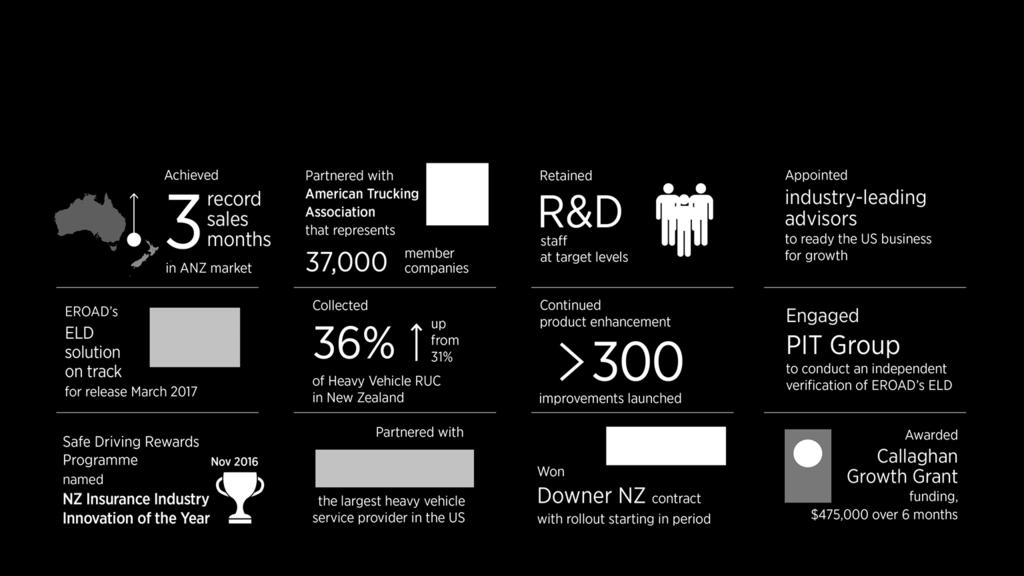
9 Achievements Half Year
10 Half Year Update for the six months to 30 September 2016 Continued strong growth over same period last year 6 months ended 6 months ended 30-Sep Sep-15 % increase Revenue ($000) 15,524 12,216 27% EBITDA * ($000) 4,725 2,745 72% EBITDA * margin 30.4% 22.5% Depreciation & Amortisation ($000) (5,008) (2,620) 91% EBIT ($000) (283) % Net Profit before tax ($000) (345) % Total Contracted Units 43,430 31,298 39% Future Contracted Income($000) 52,777 46,594 13% Retention Rate (12 months to 30 Sept) 98% 98% N/A * Earnings before interest, tax, depreciation and amortisation For full description of non GAAP measures see the final page of this presentation 10
11 Total Contracted Units Total Contracted Units grew by 39% over the prior year 50,000 45,000 40,000 TOTAL CONTRACTED UNITS 12,132 35,000 30,000 11,434 25,000 20,000 9,481 15,000 10,000 5,000 - Mar-13 Sep-13 Mar-14 Sep-14 Mar-15 Sep-15 Mar-16 Sep-16 For a full description of Total Contracted Units (TCU) measure see the final page of this presentation 11
12 Total Contracted Units by Market Total Contracted Units grew by 35% and 68% in established and commercial markets respectively over the prior year TOTAL CONTRACTED UNITS BY MARKET Established Market Commercial Market 50,000 45,000 5,301 40,000 4,501 35,000 3,158 30,000 1,821 25,000 20,000 15,000 10,000 5,000-14, ,264 24,041 28,140 32,452 38,129 - Mar 14 Sep-14 Mar-15 Sep-15 Mar-16 Sep-16 For a full description of Total Contracted Units (TCU) measure see the final page of this presentation 12
13 Revenue for the six months to 30 September 2016 Revenue grew by 27% over the same period last year $18,000 REVENUE GROWTH HY16 TO HY17 $16,000 $14,000 $2,181 $1,127 $12,000 (000) $10,000 $8,000 $15,524 $6,000 $12,216 $4,000 $2,000 $0 HY 16 Growth Established Market* Growth Commercial Market HY 17 * Includes increase in Grant revenue 13
14 Recurring revenue per unit Recurring revenue per unit dropped by $3 per unit over the same period last year Recurring revenue* per unit fell from $58 to $55 over the same period last year driven by: DOWNWARD DRIVERS Continued penetration into lighter vehicles Lower RUC transaction fees for lighter vehicles Increasing number of contracts up for renewal Large enterprise customer and partner contracts Increased competition Increase in number of units pending installation at 30 September UPWARD DRIVERS Customers upgrading service plans Early adopters of next generation Ehubo2 US is Ehubo2 only market * For a full description of recurring revenue see final slide in presentation 14
15 Revenue Dynamics Other drivers of revenue are all favorable for EROAD CUSTOMER RETENTION RATE PRODUCT MIX RENTAL VERSUS SALE 6% 8% 98% 24% 70% 92% For a full description of Retention Rate see final slide in presentation Ehubo/Tubo EhuboLITE Elocate Rented Sold Retention rate remains high at 98%, consistent with the same period last year. Product Mix continues to see growth in EhuboLITE & Elocate driven by increased penetration into light vehicles driven by Health and Safety. Ehubo/Tubo dropped by 2% from 72% last year. Note: Where customers upgrade from Ehubo1 to Ehubo2 EROAD re-deploys the Ehubo1 units into lighter vehicles, meaning some Ehubos are priced similar to EhuboLites Rented units continue to be the dominant model for our customers with just 8% of units sold outright. 15
16 Future Contracted Income FCI grew by 13% over the prior year driven by high renewal rate & strong sales growth offsetting higher contracted unit base FUTURE CONTRACTED INCOME $Million Mar-12 Mar-13 Mar-14 Sep-14 Mar-15 Sep-15 Mar-16 Sep-16 For a full description of Future Contracted Income (FCI) measure see the final page of this presentation 16
17 Divisional results for the six months to 30 September 2016 The New Zealand/Australia business has helped to fund our US business, corporate office and R&D expense New Zealand and Australia business # North American business * Corporate office and R&D expensed Total 30-Sep Sep Sep Sep-16 Revenue ($000) 13,174 1, ,524 EBITDA ($000) 9,845 (1,089) (4,032) 4,725 Depreciation 2, ,632 Amortisation 0 0 1,375 1,375 EBIT ($000) 6,858 (1,613) (5,529) (283) Net Profit before tax ($000) 6,903 (1,613) (5,635) (345) # The segmental note in the financial statements includes a segment Established Market which currently includes both the New Zealand/Australia business and the New Zealand corporate office. The table above shows the New Zealand /Australia business separately with the New Zealand corporate office and R&D expensed which are combined above. * The segmental note in the financial statements includes a segment Commercial Market which is currently EROAD s US business. There were $329,000 of intercompany charges & eliminations included in the Commercial Market segment Net Profit before tax ($1,942,000), which are excluded from the above North American business Net Profit before tax. 17
18 Cash utilisation for the six months to 30 September 2016 Cash generated from New Zealand/Australia operations has been utilised to fund R&D and operations $m CASH & DEBT FACILITY MOVEMENT Six months to 30 September EROAD has utilised $6.2m of it s cash and debt facility during the six months to 30 September $1.6m on operations and R&D, and $4.9m on funding rental units Opening net cash and debt facility* Operating cashflow - NZ/ Australia Sales office Corporate costs and R&D exepensed * Total debt facility with BNZ $16 million as at 30 September 2016 Operating cashflow - North American Sales office R&D capitalised Closing net cash and debt facility* before funding rental units Funding rental units and Capital expenditure Directors loan repayments Closing net cash & debt facility* 18
19 Research and Development for the six months to 30 September 2016 ELD has been a significant focus over the six months R&D capitalised & expensed Ongoing investment in EROAD s platform and new services. Continuous improvement 300+ upgrades to EROAD s platform and services over the 6 months. TOTAL R&D INVESTMENT $6.9 MILLION ELD and associated US R&D ELD solution on track for release March ELD mandate effective from December Partnered with PIT Group to independently test and verify our ELD solution. EROAD s ELD product being built to meet known customer needs. 34% 33% 33% ELD/US specific R&D capitalised Other R&D capitalised R&D expensed 19
20 EROAD in New Zealand & Australia - recent developments
21 EROAD in New Zealand and Australia NEW ZEALAND Market leader having collected $1.2 Billion RUC to date. Continuing to grow in both Heavy and Light vehicles. $1,400,000,000 EROAD TOTAL ELECTRONIC RUC COLLECTED $1,213,994,951 38,129 contracted units at 30 September $1,200,000,000 35% growth rate per annum. RUC still an important driver of demand. $1,000,000,000 Health and Safety is the new driver. $800,000,000 Launched Ehubo2 following NZTA approval. $600,000,000 AUSTRALIA EROAD active in Commercial services, primarily for Trans Tasman customers. Operationally managed from New Zealand. $400,000,000 $200,000,000 While there has been recent Road User Charging noise we expect that implementation of any new initiatives to be at least 5 years away. $- Mar-10 Jun-10 Sep-10 Dec-10 Source : EROAD to September 2016 Mar-11 Jun-11 Sep-11 Dec-11 Mar-12 Jun-12 Sep-12 Dec-12 Mar-13 Jun-13 Sep-13 Dec-13 Mar-14 Jun-14 Sep-14 Dec-14 Mar-15 Jun-15 Sep-15 Dec-15 Mar-16 Jun-16 Sep-16 21
22 New Zealand - Heavy Vehicle RUC Market and Market share EROAD continued to grow its market share in the Heavy Vehicle (>3,500kg) market Source : New Zealand Transport Agency to June 2016 Source : New Zealand Transport Agency to June 2016 Electronic RUC now 45% of Total Heavy Vehicle RUC Manual RUC dropped from near $900 million to $520 million Growth opportunities remain strong with $520 million of Heavy Vehicle RUC still collected manually There remain two electronic RUC providers in New Zealand 22

 (in force 4 April 2016)")


23 New Zealand - Why is Health and Safety driving demand? 1. Recognised need to improve health and safety across New Zealand 2. Accepted benefits from positive health and safety culture 3. Health and Safety at Work Act (HSWA) (in force 4 April 2016) Defines motor vehicle as a workplace Requires employer to provide a safe workplace Requires employer to manage and monitor safety in the workplace this includes driver behaviour and vehicle safety Must take all reasonable and practical steps Note : Fatigue and Speed are two practical areas of focus of corporate s health and safety managers EROAD s solution helps customers comply while helping lower costs and improve operations 23

24 New Zealand Expanding the EROAD ecosystem Large enterprise customers create multiple interactions with the EROAD Ecosystem EROAD is at the centre of a growing ecosystem with many stakeholders from insurers to trucking associations. EROAD continues to expand its reach in the transport ecosystem through growth in both heavy and light markets. EROAD s growing total RUC collection and overall unit growth within the market highlights EROAD is becoming an increasingly important part of the New Zealand transport ecosystem. Downer s decision to partner with EROAD was driven by the value offered including: improving efficiency, leveraging accuracy, its ease of use, and its health and safety capability. Partnering with large enterprise customers creates multiple interactions within EROAD s transportation ecosystem including: Partners of the customer; Contractors to the customer; Suppliers to the customer; and EROAD s customers suppliers and partners. 24


25 EROAD in North America - recent developments
26 EROAD in North America Total Contracted Units increased to 5,301 Annual growth rate in Total Contracted Units of 68% Tracking growth experienced in New Zealand from launch New Zealand v North America Growth since launch Formed partnerships with Truckstop.com and ATA NZ USA Drivers of customer demand for EROAD include: 6, Confidence in the accuracy of EROAD system 2. Reduction in administration of WMT and IFTA 5, Ease of use of both ehubo2 and Depot 4,000 Challenges to sales growth for EROAD include: 1. ELD mandate, customers waiting until EROAD has compliant ELD 2. Direct sales model requires re-alignment to address national ELD opportunity 3. Indirect model takes time to develop volume, particularly with ELD uncertainty Legal challenge to ELD regulations thrown out, helping to reduce ELD uncertainty Units 3,000 2,000 1, Months since launch 26


27 North America - continued development of EROAD s ecosystem Building EROAD s ecosystem in North America 1. Partnership with American Trucking Association Building brand awareness nationwide Positioning EROAD as a top tier provider in its industry 2. Engaged with regulatory bodies Provided sponsorship and training for the Commercial Vehicle Safety Alliance Presented at North American Transportation Services Association conference 3. Engaged PIT Group to provide independent testing and verification of EROAD s ELD product Other progress in North America 1. US strategy consultants from both Big 4 and transportation industry to support our go to market planning for FY Sales channels continue to be refined Partner channel is progressing Truckstop.com Realigning sales & customer support teams for ELD driven growth 3. California trial on track EROAD announced as ATA corporate partner Trucker News, 22 July 2016 PIT Group to offer independent testing, verification of ELD devices Commercial Carrier Journal, 19 October 2016 EROAD signs referral partnership with Truckstop.com Truckstop.com 2 November
28 North America - EROAD is well placed to tackle ELD market Customers value Accurate distance recording Ease of Use Certified ELD Compliant DVIR DVIR : Driver-Vehicle Inspection Report IFTA reporting Due March 2017 Due March 2017 EROAD s product offering Accurate within +/-0.5% of true distance, EROAD s platform was built to a high taxation standard. High quality user experience, driver-facing interface with an intuitive touch screen. Currently under development, and on track for March 2017 release to market. PIT Group external independent validation of the ELD product underway. Currently upgrading EROAD s existing post-trip inspection functionality to meet compliance requirements and customisation. EROAD technology enables industry leading IFTA management. 28

29 EROAD Outlook NEW ZEALAND and AUSTRALIA 1. Continuing to grow units and revenue, driven by: Health and Safety demand; Ehubo2 upgrade for some customers from Ehubo1; Ehubo1 s from upgrades used as lower cost option in market; and Demand for RUC services remains strong alongside even stronger demand among non RUC light vehicle fleets. 2. Downward pressure on recurring revenue per unit: Downward from growth in light vehicle market; Downward from lower-price Ehubo1s from Ehubo2 upgrades; Downward from renewals; and Upward from growth in premium Ehubo2. 3. Customer retention expected to remain strong. Focused on his safety in his workplace NORTH AMERICA 1. Continued slow sales until ELD release March Growth in partner channel and direct sales network. 3. Appointment of US President to execute growth plan. 29
30 Non GAAP measures 1. Units on Depot The number of EROAD devices installed in vehicles and subject to a service contract with a customer 2. Units Pending Installation The number of EROAD devices subject to a service contract with a customer but pending Installation 3. Total Contracted Units (TCU) TCU is made up of Units on Depot plus Units Pending Installation 4. Future Contracted income (FCI) Total revenue to be earned from existing customer contracts in future accounting periods 5. Retention Rate The number of Units on Depot at the beginning of the 12 month period and retained on Depot at the end of the 12 month period, as a percentage of Units on Depot at the beginning of the 12 month period. 6. Recurring Revenue The current monthly revenue EROAD receives from Total Contracted Units from charging of services, hardware rentals and transaction fees. 30
31 Appendix
32 Appendix Statement of Income PERIOD END FY2013 FY2014 FY2015 FY2016 HY2016 HY2017 $'000 $'000 $'000 $'000 $'000 $'000 Continuing operations Revenue 6,209 9,964 17,550 26,164 12,216 15,524 Expenses (4,427) (5,935) (12,511) (20,477) (9,471) (10,799) Earnings before interest, taxation, depreciation, amortisation and non-operating costs 1,782 4,029 5,039 5,687 2,745 4,725 Depreciation (1,684) (2,320) (3,561) (5,812) (1,821) (3,632) Amortisation (353) (648) (1,140) (1,676) (798) (1,375) EBIT before non-operating costs (255) 1, (1,801) 125 (283) Finance income Finance expense (98) (122) (86) (245) (183) (115) Net financing costs (43) (42) (62) Profit/(loss) before tax expense and non-operating costs (298) 1,020 1,096 (1,310) 851 (345) Non-operating costs 0 0 (2,023) Profit/(loss) before tax expense (298) 1,020 (927) (1,310) 851 (345) Income tax (expense)/benefit 0 1,922 (294) 211 (239) 104 Profit/(loss) from continuing operations (298) 2,942 (1,221) (1,099) 611 (241) Other comprehensive income 0 0 (61) (48) (348) (167) Total comprehensive income/(loss) for the period (298) 2,942 (1,282) (1,147) 264 (408) 32
33 Appendix Statement of Financial Position PERIOD END FY2013 FY2014 FY2015 FY2016 HY2016 HY2017 CURRENT ASSETS $'000 $'000 $ 000 $ 000 $ 000 $ 000 Cash and cash equivalents 328 2,521 24,610 7,873 14,749 6,702 Restricted Cash 3,120 6,635 9,507 5,505 4,418 7,885 Trade and other receivables 636 1,219 4,308 5,113 4,575 6,664 Finance lease receivable Loan to Directors (to acquire shares) Inventory Current tax receivable Total Current Assets 4,084 10,787 38,425 19,522 24,687 22,060 NON-CURRENT ASSETS Property, plant and equipment 5,409 8,912 15,139 21,361 20,031 22,637 Intangible assets 5,319 9,974 15,816 23,269 19,005 26,436 Finance lease receivable ,004 Deferred tax assets 0 1,922 1,650 1,953 1,400 2,009 Loans to Directors (to acquire shares) Total Non-Current Assets 10,728 20,808 32,885 47,314 41,185 52,086 TOTAL ASSETS 14,812 31,595 71,310 66,835 65,872 74,147 CURRENT LIABILITIES Bank overdraft 270 3, , ,019 Trade payables and accruals 1,049 1,263 1,866 3,261 1,996 3,730 Payable to NZTA 3,090 6,629 9,567 5,558 4,420 7,954 Loan from director/shareholder Deferred revenue 2,924 4,632 4,082 3,379 4,000 2,895 Employee entitlements ,097 Total Current Liabilities 8,140 16,175 16,234 14,121 11,105 21,695 NON-CURRENT LIABILITIES Borrowings 1, Deferred revenue 3,860 3,871 3,313 1,996 2,677 1,952 Total Non-Current Liabilities 5,080 3,871 3,313 1,996 2,677 1,952 TOTAL LIABILITIES 13,220 20,046 19,547 16,117 13,781 23,647 NET ASSETS 1,592 11,549 51,763 50,718 52,090 50,499 33
34 Appendix Statement of Cash Flows PERIOD END FY2013 FY2014 FY2015 FY2016 HY2016 HY2017 $'000 $'000 $'000 $'000 $'000 $'000 Cash flows from operating activities Cash received from customers 7,875 7,885 13,354 22,145 9,825 13,016 Payments to suppliers and employees (including $2.0 million of one-off listing costs) (2,594) (2,462) (13,697) (18,917) (9,703) (10,069) Net interest received/ (paid) (43) (42) (62) Net tax paid 0 0 (123) (288) (237) 98 Net cash inflow from operating activities 5,238 5, , ,983 Cash flows from investing activities Payments for purchase of property, plant & equipment (4,106) (5,822) (9,376) (12,035) (6,713) (4,909) Payments for purchase of intangible assets (3,364) (5,303) (6,982) (9,130) (3,987) (4,542) Proceeds from disposal of property, plant, equipment Net cash outflow from investing activities (7,470) (11,125) (16,358) (21,165) (10,701) (9,451) Cash flows from financing activities Loan from bank 521 1, , ,017 New shares issued 1,788 7,015 41, Payment of bank loan 0 0 (3,101) Loan from /(repayment) shareholders 200 (500) Net cash outflow from financing activities 2,509 8,126 37,967 1, ,297 Net increase/(decrease) in cash held 277 2,382 21,901 (16,732) (9,863) (1,171) Cash at beginning of the financial period ,710 24,611 24,611 7,873 Closing cash and cash equivalents (net of overdrafts) 328 2,710 24,611 7,879 14,749 6,702 34
Half Year Investor Presentation. November 2015
 Half Year Investor Presentation November 2015 Contents EROAD Overview 2 Half Year Results 6 EROAD North America 14 Products and Customers 21 EROAD Outlook and Strategy 26 Appendices 1. Summary Financial
EROAD HALF YEAR 2018 ANNOUNCEMENT AND UPDATE 28 November 2017 EROAD achieves record sales in New Zealand and US markets
 EROAD HALF YEAR 2018 ANNOUNCEMENT AND UPDATE 28 November 2017 EROAD achieves record sales in New Zealand and US markets Integrated technology, and services provider EROAD Limited says it has enjoyed record
BlueScope Steel Limited Consolidated Financial Headlines
 BlueScope Steel Limited Consolidated Financial Headlines 2003 2004 2005 2006 2007 2008 2009 2010 2011 2012 2013 2013 2013 2014 2014 2014 2015 2015 2015 2016 2016 2016 2017 2017 2017 2018 2018 2018 Total
Monro, Inc. Second Quarter Fiscal 2019 Earnings Call. October 25, 2018
 Monro, Inc. Second Quarter Fiscal 2019 Earnings Call October 25, 2018 Safe Harbor Statement and Non-GAAP Measures Certain statements in this presentation, other than statements of historical fact, including
Strong performance by the Bolloré Group s operating activities in 2018 Mr Cyrille Bolloré unanimously appointed Chairman and Chief Executive Officer
 PRESS RELEASE 2018 results (1) March 14, 2019 Strong performance by the Bolloré Group s operating activities in 2018 Mr Cyrille Bolloré unanimously appointed Chairman and Chief Executive Officer Revenue:
Valvoline Fourth-Quarter Fiscal 2016 Earnings Conference Call. November 9, 2016
 Valvoline Fourth-Quarter Fiscal 2016 Earnings Conference Call November 9, 2016 Forward-Looking Statements This presentation contains forward-looking statements within the meaning of Section 27A of the
Conférence d Automne - Cheuvreux. Paris, September 26 th, 2011
 Conférence d Automne - Cheuvreux Paris, September 26 th, 2011 This presentation may contain forward-looking statements. Such forward-looking statements do not constitute forecasts regarding the Company
Solid Progress across the Group despite a tough environment Rodney Baker Bates, Non-Executive Chairman
 Solid Progress across the Group despite a tough environment Rodney Baker Bates, Non-Executive Chairman Our strategy to deliver value through our new focussed divisional structure is underway. We have seen
National Treasury Presentation to the Standing Committee on Finance: South African Airways SOC Ltd ( SAA )
") National Treasury Presentation to the Standing Committee on Finance: South African Airways SOC Ltd ( SAA ) Presenter: National Treasury 18 November 2015 90 day Action Plan In November 2014, the Ministers
National Treasury Presentation to the Standing Committee on Finance: South African Airways SOC Ltd ( SAA ) Presenter: National Treasury 18 November 2015 90 day Action Plan In November 2014, the Ministers
Monthly Operating Report. December 2017
 Monthly Operating Report December 20 December overview» For the month of December 20 Contact recorded: Electricity and gas sales of 571 GWh (December 2016: 582 GWh) Netback of $79.23/MWh (December 2016:
Bernstein Strategic Decisions Conference 2018
 Bernstein Strategic Decisions Conference 2018 Forward-Looking Statements Certain statements in this presentation, other than statements of historical fact, including estimates, projections, statements
Financial Statements Matti Lievonen, President & CEO 7 February 2017
 Financial Statements 2016 Matti Lievonen, President & CEO Agenda 1 2 3 4 Year 2016 Financials 2016 Segment reviews Current topics 5 Appendix 2 Disclaimer The following information contains, or may be deemed
FISCAL YEAR MARCH 2018 FIRST HALF FINANCIAL RESULTS
 FISCAL YEAR MARCH 2018 FIRST HALF FINANCIAL RESULTS PRESENTATION OUTLINE Highlights Fiscal Year March 2018 First Half Results Fiscal Year March 2018 Full Year Forecast Progress of Key Initiatives/ Business
JAGUAR LAND ROVER RESULTS FOR THE THREE MONTHS ENDED 31 DECEMBER th FEBRUARY 2017
 JAGUAR LAND ROVER RESULTS FOR THE THREE MONTHS ENDED 31 DECEMBER 2016 14 th FEBRUARY 2017 DISCLAIMER Statements in this presentation describing the objectives, projections, estimates and expectations of
Respect for customers, partners and staff. Service: another name for the respect that a company owes its customers, partners and staff.
 Respect for customers, partners and staff Service: another name for the respect that a company owes its customers, partners and staff. Vehicle glass KEY FIGURES (in EUR million) 2004 2003 % change Total
EXANE BNP PARIBAS 13th European Seminar June 8, 2011
 EXANE BNP PARIBAS 13th European Seminar June 8, 2011 This presentation may contain forward-looking statements. Such forward-looking statements do not constitute forecasts regarding the Company s results
FISCAL YEAR MARCH 2014 FINANCIAL RESULTS
 FISCAL YEAR MARCH 214 FINANCIAL RESULTS Mazda CX-5 Mazda Atenza Mazda Motor Corporation April 25, 214 New Mazda Axela 1 PRESENTATION OUTLINE Highlights Fiscal Year March 214 Results Fiscal Year March 215
The Group is expected to continue benefiting from stable coal prices, but in the car market, competitive pressures are likely to intensify.
 PRESS RELEASE 24th April 2018 PT ASTRA INTERNATIONAL TBK 2018 FIRST QUARTER FINANCIAL STATEMENTS Highlights Net earnings per share down 2 at 123 Lower market share for cars and motorcycles Higher coal
Yixin Group Limited (2858.HK)
") Yixin Group Limited (2858.HK) Yixin Group (2858.HK) Auto dealers Rating NA Industry View NA Issue date 6 Nov 2017 Close app 9 Nov 2017 Listing date 16 Nov 2017 Offer price HKD6.60-7.70 Source: Company
Yixin Group Limited (2858.HK) Yixin Group (2858.HK) Auto dealers Rating NA Industry View NA Issue date 6 Nov 2017 Close app 9 Nov 2017 Listing date 16 Nov 2017 Offer price HKD6.60-7.70 Source: Company
Q3 Results November 16, 2006 Analyst Presentation
 Q3 Results 2006 November 16, 2006 Analyst Presentation Group Sales (in million Euro) Total Sales 2,395 +3.3% (+2.4%)* 2,474 Split per Business Group (YTD) Specialty Products 7% Q3 797 +1.0% (+2.5%)* 805
Contents. Automotive Holdings Group Limited
 Automotive Holdings Group Limited Institutional Briefings Year End Results June Contents FY Highlights Corporate Statistics Group Performance Floorplan Financing Automotive Logistics Outlook Appendices
FISCAL YEAR MARCH 2018 FIRST QUARTER FINANCIAL RESULTS
 FISCAL YEAR MARCH 2018 FIRST QUARTER FINANCIAL RESULTS PRESENTATION OUTLINE Highlights Fiscal Year March 2018 First Quarter Results Fiscal Year March 2018 Full Year Forecast Structural Reform Stage 2 Progress
Third quarter results Matti Lievonen, President & CEO 26 October 2017
 Third quarter results 2017 Matti Lievonen, President & CEO 26 October 2017 Agenda 1. Q3/17 Group financials 2. January-September 2017 review 3. Q3/17 Segment reviews 4. Current topics 5. Appendix 2 Disclaimer
NYSE: CGI
 NYSE: CGI www.celadongroup.com Forward-Looking Statement Disclaimer This presentation, including documents incorporated herein by reference, will contain forward-looking statements within the meaning of
2017 Rp bn. Net revenue 150, , Net income* 14,184 11, Net earnings per share As at 30th September 2017 Rp bn
 31st October 2017 PT ASTRA INTERNATIONAL TBK 2017 THIRD QUARTER FINANCIAL STATEMENTS PRESS RELEASE Highlights Net earnings per share up 26 at 350 Increased market share for both cars and motorcycles Positive
2010 1Q Investor Meeting. May 2010
 2010 1Q Investor Meeting May 2010 This presentation contains preliminary figures which may be materially different from the final figures. While the statements in this presentation represent our current
Lazydays Holdings, Inc. Reports Second Quarter 2018 Financial Results
 News Contact: +1 (813) 204-4099 investors@lazydays.com Lazydays Holdings, Inc. Reports Second Quarter 2018 Financial Results Tampa, FL (August 9, 2018) Lazydays Holdings, Inc. ( Lazydays )(NasdaqCM: LAZY)
9M 2003 Financial Results (US GAAP)
") 9M Financial Results (US GAAP) January 2004 LUKOIL Group Crude Oil Production* mln tonnes 82 80 78 76 74 72 70 68 66 64 Crude oil production 3.2 5.5 3.9 76.8 70.3 71.3 2001 Production by subsidiaries Share
9M Financial Results (US GAAP) January 2004 LUKOIL Group Crude Oil Production* mln tonnes 82 80 78 76 74 72 70 68 66 64 Crude oil production 3.2 5.5 3.9 76.8 70.3 71.3 2001 Production by subsidiaries Share
2015 Interim Results Announcement
 China Petroleum & Chemical Corporation 2015 Interim Results Announcement August 27, 2015 Hong Kong Cautionary Statement This presentation and the presentation materials distributed herein include forward-looking
GUD Holdings Limited Wilsons Rapid Insights Conference 31st May 2018
 GUD Holdings Limited Wilsons Rapid Insights Conference 31st May 2018 Jonathan Ling Managing Director The GUD group Automotive GUD HOLDINGS Davey Automotive oil, air and fuel filters Heavy duty filters
Martin Laubscher Barloworld Automotive
 Barloworld Limited Investor Day Martin Laubscher Barloworld Automotive 2 February 2009 Business Overview Automotive Division Car Rental Fleet Services Motor Retail Joint Ventures Southern Africa Southern
Preliminary Results 12 May 2009
 Preliminary Results 12 May 2009 Working together for Greener logistics solutions For period ended 28 February 2009 www.stobartgroup.com Highlights Year of growth, laying foundations for the multimodal
KCB GROUP PLC INVESTOR PRESENTATION. Q FINANCIAL RESULTS
 KCB GROUP PLC INVESTOR PRESENTATION. Q3 2018 FINANCIAL RESULTS MACRO-ECONOMIC HIGHLIGHTS Macro-Economic Highlights: Kenya KENYA 4.9% 5.3% GDP Growth Rate (%) 5.6% 5.8% 4.9% 6.3% 6.2% KENYA 2013 2014 2015
2002/03 Interim Announcement 11 November
 2002/03 Interim Announcement 11 November 2002 www.renold.com Financial Summary First Half First Half 2002/03 2001/02 m m Turnover 91.3 97.6 Trading profit before exceptional items 4.7 3.8 Profit before
Q Matti Lievonen President and CEO
 Q1 2018 Matti Lievonen President and CEO CONTENTS 1. Q1 2018 review 2. Group financials 3. Segment reviews 4. Current topics 5. Appendix 2 Disclaimer The following information contains, or may be deemed
Third Quarter 2018 Performance and Business Update. October 24, 2018
 Third Quarter 2018 Performance and Business Update October 24, 2018 1 Important Notice Please read this management presentation together with the Company s press release issued earlier today announcing
Kongsberg Automotive ASA. Fourth quarter February 28, 2019
 Kongsberg Automotive ASA Fourth quarter - February 28, 2019 Highlights Q4 Sales Revenues grew by 21 (7.3%) YoY to 288 including negative FX effects of 1. We booked new business with 77 in expected annual
TOFAŞ RESULTS WEBCAST PRESENTATION
 TOFAŞ 31.12.2017 RESULTS WEBCAST PRESENTATION 02.02.2018 AGENDA Highlights Turkish Automotive Industry Production Domestic Market Developments Tofaş Domestic Market Performance Export Markets & Tofaş Performance
Q3 & 9M 2018 Results Presentation. October 24 th, 2018
 Q3 & 9M 2018 Results Presentation October 24 th, 2018 Q3 & 9M HIGHLIGHTS & CATEGORY SPOTLIGHTS Gonzalve BICH 3Q and 9M 2018 Results Presentation 2 9 Months 2018 Key Messages Continued challenging trading
2010 Annual Results Announcement
 2010 Annual Results Announcement March 2011 1 Disclaimer These materials have been prepared by China ZhengTong Auto Services Holdings Limited ( ZhengTong Auto or The Company, together with its subsidiaries,
Months Investor Presentation
 2018 9 Months Investor Presentation 25.10.2018 Disclaimer Ereğli Demir Çelik Fabrikaları T.A.Ş. (Erdemir) may, when necessary, make written or verbal announcements about forward-looking information, expectations,
Q Analyst Teleconference. 9 August 2018
 9 August 218 Disclaimer This presentation contains forward-looking statements that reflect the Company management s current views with respect to certain future events. Although it is believed that the
TOFAŞ Q ANALYST PRESENTATION
 TOFAŞ Q1 2016 ANALYST PRESENTATION 03.05.2016 1 2016 Q1 AGENDA Highlights Turkish Automotive Industry Production & Capacity Utilization Domestic Market Developments Tofaş Domestic Market Performance Export
 General Announcement::Astra's 2017 3rd Quarter Financial Statements http://infopub.sgx.com/apps?a=cow_corpannouncement_content&b=announce... Page 1 of 1 31/10/2017 General Announcement::Astra's 2017 3rd
FISCAL YEAR MARCH 2015 FIRST HALF FINANCIAL RESULTS. New Mazda Demio
 FISCAL YEAR MARCH 2015 FIRST HALF FINANCIAL RESULTS New Mazda Demio Mazda Motor Corporation October 31, 2014 1 PRESENTATION OUTLINE Highlights Fiscal Year March 2015 First Half Results Fiscal Year March
MONRO MUFFLER BRAKE, INC. PROVIDES FOURTH QUARTER AND FISCAL 2017 FINANCIAL RESULTS
 CONTACT: John Van Heel Chief Executive Officer (585) 647-6400 Robert Gross Executive Chairman (585) 647-6400 FOR IMMEDIATE RELEASE Brian D Ambrosia Senior Vice President Finance Chief Financial Officer
On track. Investor and Analyst Presentation On the Occasion of the Release of the Preliminary Figures for 9M 2011 Hanover, 18 October 2011
 On track. Investor and Analyst Presentation On the Occasion of the Release of the Preliminary Figures for 9M 2011 Agenda Delticom at a Glance Business Model Profit & Loss Balance Sheet Outlook 2 Agenda
Q3 Interim Report 2016
 Q3 Interim Report 216 Lennart Evrell President & CEO Håkan Gabrielsson CFO Strong earnings and high mine production Revenues 9,733 (9,764) MSEK EBIT ex PIR* 1,318 (1,55) MSEK EBIT 1,529 (88) MSEK Free
Jaguar Land Rover Results For the quarter ended 30 June August 2015
 Jaguar Land Rover Results For the quarter ended 30 June 2015 7 August 2015 1 Disclaimer Statements in this presentation describing the objectives, projections, estimates and expectations of Jaguar Land
ANALYST BRIEFING FOR THE THIRD QUARTER ENDED NOV 2016
 ANALYST BRIEFING FOR THE THIRD QUARTER ENDED 2016 21 NOV 2016 MSM Malaysia Holdings Berhad Analyst Briefing Q3 2016 21/11/2016 1 CONTENTS 01 02 03 04 05 Group Financial Highlights Performance Review Sugar
3 rd Quarter 2017 Results
 Inside your life! 3 rd Quarter 2017 Results October 25, 2017 Mobile Automotive Display Semiconductor IoT LED Contents Ⅰ. Q3 2017 Earnings Summary Ⅱ. Earnings Highlight & Outlook Ⅲ. Results & Outlook by
1 st Half 2018 Results. August 1 st, 2018
 1 st Half 2018 Results August 1 st, 2018 H1 HIGHLIGHTS & CATEGORY SPOTLIGHTS Gonzalve BICH 2 First Half 2018 Key Messages Challenging market and business environment Continued investment in targeted Brand
FISCAL YEAR MARCH 2015 THIRD QUARTER FINANCIAL RESULTS. Updated Mazda CX-5 (Japanese specification model)
") FISCAL YEAR MARCH 2015 THIRD QUARTER FINANCIAL RESULTS Updated Mazda CX-5 (Japanese specification model) Mazda Motor Corporation February 4, 2015 1 PRESENTATION OUTLINE Highlights Fiscal Year March 2015
FISCAL YEAR MARCH 2015 THIRD QUARTER FINANCIAL RESULTS Updated Mazda CX-5 (Japanese specification model) Mazda Motor Corporation February 4, 2015 1 PRESENTATION OUTLINE Highlights Fiscal Year March 2015
Lazydays Holdings, Inc. Reports Third Quarter 2018 Financial Results
 News Contact: +1 (813) 204-4099 investors@lazydays.com Lazydays Holdings, Inc. Reports Third Quarter 2018 Financial Results Tampa, FL (November 8, 2018) Lazydays Holdings, Inc. ( Lazydays ) (NasdaqCM:
TOFAŞ RESULTS WEBCAST PRESENTATION
 TOFAŞ 31.12.2016 RESULTS WEBCAST PRESENTATION 02.02.2017 1 WEBCAST AGENDA Highlights Turkish Automotive Industry Production Domestic Market Developments Tofaş Domestic Market Performance Export Markets
FY2/17 3Q(March 2016~November2016)
") FY2/17 (March 2016~November2016) Fact Book 1. Trends in the current fiscal year and previous fiscal year 3. Business overview (1) Performance overview P. 1 (1) No. of students at the end of month P. 7
FY2/17 (March 2016~November2016) Fact Book 1. Trends in the current fiscal year and previous fiscal year 3. Business overview (1) Performance overview P. 1 (1) No. of students at the end of month P. 7
FISCAL YEAR MARCH 2014 FIRST HALF FINANCIAL RESULTS. New Mazda Axela (Overseas name: New Mazda3)
") FISCAL YEAR MARCH 2014 FIRST HALF FINANCIAL RESULTS New Mazda Axela (Overseas name: New Mazda3) Mazda Motor Corporation October 31, 2013 1 PRESENTATION OUTLINE Highlights Fiscal Year March 2014 First Half
FISCAL YEAR MARCH 2014 FIRST HALF FINANCIAL RESULTS New Mazda Axela (Overseas name: New Mazda3) Mazda Motor Corporation October 31, 2013 1 PRESENTATION OUTLINE Highlights Fiscal Year March 2014 First Half
Automotive Holdings Group Limited. Presentation May 2009
 Automotive Holdings Group Limited Presentation May 2009 Contents About AHG Third Quarter 2009 Performance AHG s strategic response to current economic climate Net Debt Position Automotive Logistics Outlook
Automotive Holdings Group Limited. Euroz Securities Rottnest Island Conference Bronte Howson Managing Director March 2008
 Automotive Holdings Group Limited Euroz Securities Rottnest Island Conference 008 Bronte Howson Managing Director March 008 Group Snapshot Largest Automotive Retailing & Logistics Group in Australia 0
3QFY2018 Financial Results. Quarter Ended 31 December 2017
 3QFY2018 Financial Results Quarter Ended 31 December 2017 Disclaimer This presentation is not and does not constitute an offer, invitation, solicitation or recommendation to subscribe for, or purchase,
2 ND QUARTER 2016 INVESTOR PRESENTATION 26 AUGUST Geir Håøy, President and CEO Hans-Jørgen Wibstad, CFO
 2 ND QUARTER 2016 INVESTOR PRESENTATION 26 AUGUST 2016 Geir Håøy, President and CEO Hans-Jørgen Wibstad, CFO WORLD CLASS - through people, technology and dedication Page 2 HIGHLIGHTS Stable activity level
Increase of the sales by 33% mainly due to the Safelite acquisition
 36 - Vehicle Glass Repair and Replacement Increase of the sales by 33% mainly due to the Safelite acquisition 37 Key events in Vehicle Glass Repair and Replacement January 2007 The launch in the UK of
April Título da apresentação DD.MM.AAAA
 Aquisition of Shell Argentina downstream assets April 2018 Título da apresentação DD.MM.AAAA DISCLAIMER This presentation contains estimates and forward-looking statements regarding our strategy and opportunities
On track. Investor and Analyst Presentation On the Occasion of the Release of the Preliminary Figures for FY 2011 Hanover, 19 January 2012
 On track. Investor and Analyst Presentation On the Occasion of the Release of the Preliminary Figures for FY 2011 Agenda Delticom at a Glance Business Model Profit & Loss Balance Sheet Outlook 2 Agenda
FISCAL YEAR MARCH 2018 THIRD QUARTER FINANCIAL RESULTS
 FISCAL YEAR MARCH 2018 THIRD QUARTER FINANCIAL RESULTS PRESENTATION OUTLINE Highlights Fiscal Year March 2018 Nine Month Results Fiscal Year March 2018 Full Year Forecast Progress of Key Initiatives 1
3Q 2016 Analyst Presentation
 3Q 2016 Analyst Presentation November 18, 2016 This presentation includes forward-looking statements. Actual future conditions (including economic conditions, energy demand, and energy supply) could differ
Research Coverage Report by Shared Research Inc.
 esearch eport by Shared esearch Inc. https://sharedresearch.jp This PDF document is an updated note on the company. A comprehensive version of the report on the company, including this latest update, is
Unaudited Financial Statements for the Third Quarter ( 3Q ) and Nine Months ( 9M ) Ended 30 September 2017
 and Nine Months ( 9M ) Ended 30 September 2017") BUMITAMA AGRI LTD. Unaudited Financial Statements for the Third Quarter ( 3Q ) and Nine Months ( 9M ) Ended 30 September 2017 1(a)(i) Income statement (for the group) together with a comparative statement
BUMITAMA AGRI LTD. Unaudited Financial Statements for the Third Quarter ( 3Q ) and Nine Months ( 9M ) Ended 30 September 2017 1(a)(i) Income statement (for the group) together with a comparative statement
282m 75% +575m. Net sales Operating income before non-recurring items. Operating margin before non-recurring items. Net Loss.
 First-Half 2009 Financial Highlights Net sales Operating income before non-recurring items Operating margin before non-recurring items Net Loss Net debt-to-equity ratio Free cash flow** 7,134m 282m 4.0%
Group Results 6 months ended 30th June. Net revenue 88,208 92,505 (5) Net income* 7,116 8,052 (12) Net earnings per share (12)
 Net income* 7,116 8,052 (12) Net earnings per share (12)") Page1 28th July 2016 PT ASTRA INTERNATIONAL TBK 2016 FIRST HALF FINANCIAL STATEMENTS PRESS RELEASE Highlights Net earnings per share down 12% at 176 Car unit sales up 4% and motorcycle unit sales up 1%
Page1 28th July 2016 PT ASTRA INTERNATIONAL TBK 2016 FIRST HALF FINANCIAL STATEMENTS PRESS RELEASE Highlights Net earnings per share down 12% at 176 Car unit sales up 4% and motorcycle unit sales up 1%
2010 Interim Results Presentation. August 23, 2010 Hong Kong
 Sinopec Corp. 21 Interim Results Presentation August 23, 21 Hong Kong Disclaimer i This presentation and the presentation materials distributed herein include forwardlooking statements. All statements,
1. Trends in the current fiscal year and previous fiscal year 3. Business overview 2. Secular trends in first quarter financial results
 FY2/19 (March 2018~May 2018) Fact Book 1. Trends in the current fiscal year and previous fiscal year 3. Business overview (1) Performance overview P. 1 (1) No. of students at the end of month P. 6 (2)
THE EROAD ELD SOLUTION
 THE EROAD ELD SOLUTION Built from the ground up with you in mind September 2016 Electronic Logs Accurate fleet tracking IFTA Weight Mileage Tax Analytics ABOUT EROAD EROADs is a leading transport technology
PT Astra International Tbk 2014 Third Quarter Financial Statements
 To: Business Editor 30th October 2014 For immediate release PT Astra International Tbk 2014 Third Quarter Financial Statements The following announcement was issued today by the Company s 74%-owned subsidiary,
Selected Unaudited 2017 Third Quarter Financial Data. 9 November, 2017
 Selected Unaudited 2017 Third Quarter Financial Data 9 November, 2017 Executive Summary Q3 2017 Highlights Continuing Effort to Support the Macau Community Following Typhoon Hato on 23 August 2017 Q3 Group
 General Announcement::Astra's 2018 First Half Financial Statements http://infopub.sgx.com/apps?a=cow_corpannouncement_content&b=announcem... Page 1 of 1 26/7/2018 General Announcement::Astra's 2018 First
third QUARTER 2012 October 26, 2012
 third QUARTER 212 October 26, 212 Helena norrman Senior Vice President Communications third QUARTER 212 October 26, 212 This presentation contains forward-looking statements. Such statements are based
Kongsberg Automotive ASA. Third quarter November 7, 2018
 Kongsberg Automotive ASA Third quarter - November 7, Q3 Highlights Continued improvements in turbulent times Revenues increased YoY by MEUR 18.3 (~8%) to MEUR 259 including negative FX effects of MEUR
Delivering for our stakeholders. Annual Results May 2018
 1 Delivering for our stakeholders Annual Results 2018 10 May 2018 2 Non Annual Results 2018 Contents 1. Introduction (IF) 2. (WB) 3. Aviation (GJ) 4. Carlisle Lake District Airport (AT) 5. Energy (BW)
RESILIENCE MBM RESOURCES BERHAD ( V) Analyst Briefing 24 August 2017
 Analyst Briefing 24 August 2017") RESILIENCE MBM RESOURCES BERHAD (284496-V) Analyst Briefing 24 August 217 1 1 DISCLAIMER The information and opinions contained in this presentation are provided as at the date of the document. Certain
RESILIENCE MBM RESOURCES BERHAD (284496-V) Analyst Briefing 24 August 217 1 1 DISCLAIMER The information and opinions contained in this presentation are provided as at the date of the document. Certain
JAGUAR LAND ROVER INVESTOR CALL
 JAGUAR LAND ROVER INVESTOR CALL RESULTS FOR THE THREE AND SIX MONTHS ENDED 30 SEPTEMBER 2017 Kenneth Gregor, CFO 9 th NOVEMBER 2017 DISCLAIMER Statements in this presentation describing the objectives,
1QFY2018 Financial Results. Quarter Ended 30 June 2017
 1QFY2018 Financial Results Quarter Ended 30 June 2017 Disclaimer This presentation is not and does not constitute an offer, invitation, solicitation or recommendation to subscribe for, or purchase, any
PT Astra International Tbk 2012 Half Year Financial Statements
 To: Business Editor For immediate release PT Astra International Tbk 2012 Half Year Financial Statements The following announcement was issued today by the Company s 72%-owned subsidiary, Jardine Cycle
Record CY 2016 EPS-diluted-adjusted of $6.12, an increase of $1.10 Y-O-Y. Q EPS-diluted-adjusted of $1.28, a decrease of $0.11 Y-O-Y.
 1 2 3 Q4 2016 global deliveries up 0.1 million units year-over-year (Y-O-Y), a 3.3% increase. Volume gains primarily in North America and China, offset by reductions in International Operations (excluding
Cosmo Oil Co., Ltd. Presentation on Results for First Quarter of Fiscal 2012 August 2, 2012 Director: Satoshi Miyamoto
 Cosmo Oil Co., Ltd. Presentation on Results for First Quarter of Fiscal 2012 August 2, 2012 Director: Satoshi Miyamoto Copyright 2012 COSMO OIL CO.,LTD. All Rights Reserved. Key Points of Financial Results
Analysis of Operating Results and Financial Status
 Analysis of Operating Results and Financial Status 1. Analysis of Operating Results of EGAT and its Subsidiaries Operating results of EGAT and its subsidiaries including associated company and jointly
JIFFY LUBE - HESPERIA, CALIFORNIA
 JIFFY LUBE - HESPERIA, CALIFORNIA 16701 MAIN ST. HESPERIA, CA 92345 Vinny Jacobellis BRE # 02073038 Associate 818.227.8000 vinny.jacobellis@svn.com CalDRE #02073038 Jeff Albee, CCIM, BRE#00969071 Executive
INVESTOR CALL 26 th April, Mahindra Towers
 INVESTOR CALL 26 th April, 2012 Mahindra Towers The opportunity Indian Hotel Industry Rs. 191 Bn Leisure usage Rs. 101 Bn Source : IBEF - India Brand Equity Foundation Business Model Revenue recognition
FOURTH QUARTER 2013 RESULTS
 FOURTH QUARTER 213 RESULTS 12 MARCH 214 LUCA BETTONTE, CEO DISCLAIMER This document contains certain forward-looking information that is subject to a number of factors that may influence the accuracy of
PT Astra International Tbk 2011 Full Year Financial Statements
 To: Business Editor For immediate release PT Astra International Tbk 2011 Full Year Financial Statements The following announcement was issued today by the Company s 71%-owned subsidiary, Jardine Cycle
Orders received grew in all business areas
 26 October 2018 Orders received grew in all business areas Cargotec s January September 2018 interim report Mika Vehviläinen, CEO Mikko Puolakka, CFO Cargotec s January September 2018 interim report 26/10/2018
Analysis of Operating Results and Financial Status
 29 Analysis of Operating Results and Financial Status 1. Analysis of Operating Results of EGAT and Its Subsidiaries Operating results of EGAT and its subsidiaries including associated company and joint
American Railcar Industries, Inc.
 American Railcar Industries, Inc. Exhibit 99.2 Q3 2017 Supplemental Information Investor Contact: 636.940.6000 Website: americanrailcar.com Forward Looking Disclaimer Safe Harbor Statement This presentation
Conference Call. Preliminary Key Figures Financial Year Bochum, February 7, GEA Group
 Conference Call Preliminary Key Figures Financial Year 2010 Bochum, February 7, 2011 GEA Group Disclaimer All figures for 2010 are preliminary and have therefore not yet been audited. The yearend financial
Healthier Net Profit under Stronger IDR
 Investor Bulletin, First Half 2002 Healthier Net Profit under Stronger IDR As of June 2002, the consolidated revenue in USD increased by 32% y.o.y. Due to IDR strengthening against USD, in IDR revenue
FY2/18 (March 2017~February 2018)
") FY2/18 (March 2017~February 2018) Fact Book 1. Trends in the current fiscal year and previous fiscal year 3. Business overview (1) Performance overview P. 1 (1) No. of students at the end of month P. 6
FY2/18 (March 2017~February 2018) Fact Book 1. Trends in the current fiscal year and previous fiscal year 3. Business overview (1) Performance overview P. 1 (1) No. of students at the end of month P. 6
Automotive Holdings Group Limited Macquarie Connections Conference
 Automotive Holdings Group Limited Macquarie Connections Conference Presented by: Bronte Howson Managing Director May 8 Group Snapshot Largest automotive retailing & logistics group in Australia Automotive
PT Astra International Tbk 2018 Third Quarter Financial Statements
 To: Business Editor 29th October 2018 For immediate release PT Astra International Tbk 2018 Third Quarter Financial Statements The following announcement was issued today by the Company s 75%-owned subsidiary,
Saft Groupe SA reports Quarterly Financial Information for the third quarter of 2007
 N 61-07 Saft Groupe SA reports Quarterly Financial Information for the third quarter of 2007 Paris, 9 th November 2007 - Saft, leader in the design, development and manufacture of high-end batteries for
 Page 1 sur 5 17.03.2010 BMW Group plans sharp increase in group earnings Visible progress in 2010 towards profitability targets for 2012 Volume growth in solid single-digit percentage range targeted Munich.