2011 TOWN OF CASTLE ROCK MOTOR VEHICLE ACCIDENT FACTS PREPARED BY THE PUBLIC WORKS DEPARTMENT
|
|
|
- Anabel Stewart
- 5 years ago
- Views:
Transcription

1 2011 TOWN OF CASTLE ROCK MOTOR VEHICLE ACCIDENT FACTS PREPARED BY THE PUBLIC WORKS DEPARTMENT
2 ACKNOWLEDGEMENTS This report was assembled from data provided by the Castle Rock Police Department accident report data from the year Each accident record, whether completed by a local police officer or a member of the Colorado State Patrol, was sent to Castle Rock and entered into a centralized database maintained by the Public Works Department. The report itself was created by personnel in the Public Works Department. For more information, please contact: Transportation Engineering Division Town of Castle Rock 4175 N. Castleton Ct. Castle Rock, CO
3 Table of Contents Public Works Director s Letter i Executive Summary. 1 SECTION #1: Public Works Statistical Analysis 2 Road & Intersection Safety. 2 SECTION #2: 2011 Raw Data Summaries 5 Quick Facts 5 Accident Pin Map.. 6 Accident Rates by Location. 7 Time Trends. 10 Types of Crashes 11 Involvement by Age and Gender.. 12 Accident Location. 13 Accident Environment. 14 The Driver.. 15 Alcohol and Drug Involvement 16 Annual Trends 17 Definitions 20

4 Public Works Department Our mission is to provide outstanding service, safety and support for transportation infrastructure and maintenance. July 24, 2012 It is our pleasure to provide you with the 7th Annual Castle Rock Motor Vehicle Accident Facts Report. The accident data contained in this report will help to provide valuable information in making roadways safer within the Town of Castle Rock, by helping us determine what measures may be implemented to reduce accidents in a high-hazard area or intersection. It is our intent that the statistics provided will enable emergency services and design engineers alike, to gain a greater perspective in the goals of reducing traffic crashes and their severity. We will continue to dedicate our time and efforts toward the improvement of safety on our street system. Sincerely, Robert Goebel, P.E. Public Works Director Bob T. Watts, P.E. Transportation Planning and Traffic Engineering Manager i
5 EXECUTIVE SUMMARY The mission of the Public Works Department is To provide outstanding service, safety and support for transportation infrastructure and maintenance. One aspect of furthering this mission is analyzing accident data on a regular basis in order to identify where the roadway environment may be a contributing factor to accidents, developing options for improvements, and programming projects for correction. Since 2004, when Public Works first reported accident statistics, the numbers of fatalities, and persons injured have been declining. Additionally, the crash rate per town population has also been decreasing since These trends are encouraging indications of the overall safety of travel on Town roadways. are the result of many factors. These factors can generally be classified into three main categories: 1) human factors, 2) vehicle factors, and 3) roadway environment. By far, the largest percentage of accidents can be attributed to human factors. Sadly, these are the factors all of us who drive can control and are usually the simplest to correct. Basic driver awareness and respect for all users of the Town s roadways will go the farthest towards reducing the number of accidents. The tools to attack human factors and change driver behavior however aren t always effective. Getting the facts out to drivers, police enforcement, and the use of public awareness campaigns can assist with increasing awareness. However it will take conscious decisions by all drivers to change behavior when behind the wheel. Addressing vehicle factors is also the responsibility of everyone who owns and operates a motor vehicle. Ensuring that vehicles are in good shape to operate efficiently on the roads will also greatly assist with reducing the number of accidents. Regular vehicle inspections along with preventative maintenance procedures will help reduce the chances of an accident occurring as a result of a vehicle malfunction. The roadway environment is something that is out of the driver s control. The goal in this regard is to identify locations where roadways could be a contributing factor and implement treatments to correct these. Public Works uses statistical modeling to identify the locations where corrections to the roadway environment may improve safety. This helps direct limited resources to the locations where the most benefit can be obtained and avoids directing these resources toward locations where problems may not exist. The following intersection has been identified from several years of historical records as locations where roadway improvements may benefit transportation safety: Intersection Ownership Agency 1. Hwy 86 & Crowfoot Valley Rd CDOT The Colorado Department of Transportation (CDOT) will be provided with these findings and support provided where possible to assist them with further review of these locations for improvements. Road safety begins with all of us. Please remember to be courteous and cautious every time you get behind the wheel. 1
6 SECTION 1: Public Works Statistical Analysis The first section of this report summarizes the statistical review of the 2011 raw data. The purpose of this is to provide an initial screen to identify the signalized intersections that are producing accident numbers that exceed the number that may be expected to occur when compared to a model intersection sharing similar characteristics. Since accidents are expected to occur, it s important to determine which locations are experiencing accidents at a higher rate than should be expected. ROAD & INTERSECTION SAFETY One important goal from this accident data is to identify locations where the road environment may be a contributing factor to accidents. This is possible through statistical analysis. The roadway environment is something that is out of the driver s control. Part of the mission of the Town s Traffic Engineering and Operations Division is to assist with minimizing the number of roadway hazards that exist on Town roads that could contribute to accidents. The goal in this regard is to identify locations where roadways could be a contributing factor and implement treatments to correct these. The definition of the safety of a road section or intersection that the Traffic Engineering and Operations Division uses is the number of accidents expected to occur at these locations during a specified period. Because there are factors that are not related to the physical roadway environment that contribute to accidents, road sections and intersections are expected to have accidents occur. Since what is expected cannot be known, safety can only be estimated, and estimation is in degrees of precision. The precision of an estimate is usually expressed by its standard deviation. For practical reasons Traffic Engineering is interested in the safety of a road section or intersection that either requires attention because it seems to have too many accidents. If the estimation of safety is based only on accident counts or accident rates, the estimate would be biased. The existence of this regression-to-mean bias has been long recognized. It is known to produce inflated estimates of countermeasure effectiveness. To estimate roadway safety, Traffic Engineering utilizes the Empirical Bayes (EB) method. This method increases the precision of the estimates and corrects for the regression-to-mean bias. The EB method recognizes that accident counts or rates are not the only clue to safety. Another clue is in what is known about the safety of similar entities. To identify the safety of similar entities, safety performance functions (SPFs), which are models, need to be developed from existing data (accidents, vehicle volumes, etc.). SPF models from other jurisdictions can also be adopted if these SPFs are found to fit the Town s local trends. The refinement of SPFs increases as more data becomes available. This is important not only to identify locations with potential safety issues, but also to ensure that limited resources are not exhausted on problems that may not exist. As the Town s Traffic Engineering Division collects more accident records and continues to develop these SPFs, locations that seem to stand out as having a high accident rate will be looked into closer to determine if any accident trends are occurring that may indicate an issue that should be further examined. 2
7 Currently, only a model for signalized intersections has been developed. This is natural as signalized intersections exist on higher volume roads where accident probability is higher due to normal exposure. The Traffic Engineering and Operations Division will continue to collect data in hopes of developing SPFs for non-signalized intersections, and roadway segments when possible. A SPF has been developed for signalized intersections within the Town. This SPF provides an indication of the average number of accidents that are expected at similar signalized intersections. This combined with the actual accident records of each signalized site allows for a more precise safety estimate of each signalized intersection utilizing the EB method. The estimates improve with increased annual records. The tables on pages 8 and 9 are summaries of the signalized intersections with the highest accident rates for The results of the analysis provides an indication that the majority of signalized intersections are experiencing an accident rate that is consistent, or better, than signalized intersections that are similar in nature. The one exception was the intersection SH 86 / Crowfoot Valley Rd. which is under the control of CDOT. This information will be passed onto the Colorado Department of Transportation for their use along with intersection accident diagrams to allow for further assessment to determine if any improvements may be beneficial. For the remaining intersections, there is no indication that the roadway environment is causing a problem at these locations. This does not mean however that changes in the roadway environment could not increase intersection safety. However, since these accidents are more likely to be related to vehicle or human factors, spending a lot of resources on the roadway environment to try and increase the safety of these intersections would not likely be cost effective. In summary, everyone that utilizes the public roadway system has a responsibility when it comes to reducing the number of accidents. There are agencies that specialize in certain areas such as police enforcement, communications, education, and engineering that through their combined efforts will go a long way toward increasing the safety of the Town s roads The following tables summarize the 2011 highest accident rate locations (signalized). The actual accident total is shown for informational purposes only. The EB model uses this total within the formulas itself along with a weight to adjust for the fluctuation around the mean. As more years get added, the actual weighting decreases and the total number of accidents gets closer to the total expected. Locations with 1-year of data Intersection Actual # 3 Range of at Similar Location Peer Comparison Wilcox / Third St Similar Perry / Fifth St Similar 5th / Woodlands Blvd Similar Wolfensberger / Prairie Hawk Similar SH 86 / Woodlands Similar Meadows Pkwy. / Limelight Similar
8 Locations with 2-years of data Intersection Actual # 4 Range of at Similar Location Peer Comparison Front St. / Blackfeather Similar Factory Shops / New Memphis Similar Locations with 3-years of data Intersection Actual # Range of at Similar Location Peer Comparison Wilcox / Wolfensberger Similar Plum Crk Pkwy. / Wilcox Similar 1-25 / SH Better Locations with 4-years of data Intersection Actual # Range of at Similar Location Peer Comparison Wolfensberger / Park St Similar I-25 / US Better Locations with 5-years of data Intersection Actual # Range of at Similar Location Peer Comparison Meadows Blvd./Prairie Hawk Similar SH 86 / Fifth St Similar Locations with 6-years of data Intersection Actual # Range of at Similar Location Peer Comparison Wilcox St. / Fifth St Similar Plum Creek Pkwy. / Perry St Similar SH 86/Trailboss Better SH 86/Crowfoot Valley Rd Worse Locations with 7-years of data Intersection Actual # Range of at Similar Location Peer Comparison US 85 / Factory Shops Blvd Similar SH 86 / Allen Way Similar SH 86 / Front Similar US 85 / Meadows Pkwy Similar
9 SECTION 2: 2011 Raw Data Summaries This section summarizes the raw accident data for 2011 by various categories. The purpose of this is for general public interest as well as for use by other staff departments that may use this information to assist with improving their operations QUICK FACTS Persons Killed Persons Injured Reported On average, one traffic accident was reported every 14.8 hours. One out of every eleven accidents involved an injury. Of all drivers involved in accidents, 16% were age 19 years old, or less; 28% were under 25 years of age; and 10% were over the age of 60. Of all accidents 28% occurred at night. There were no pedestrian deaths in There were 0 fatalities among motorcycle or moped riders. 5
10 Accident Pin Map This map shows the distribution throughout the town of the 2011 accident locations. The arterial and collector streets have the highest incident of accidents, which is expected considering that they also have the highest traffic volumes. When reviewing new developments, we limit the number of new access points on these classifications of streets. By doing this, the potential for accidents decreases. 6
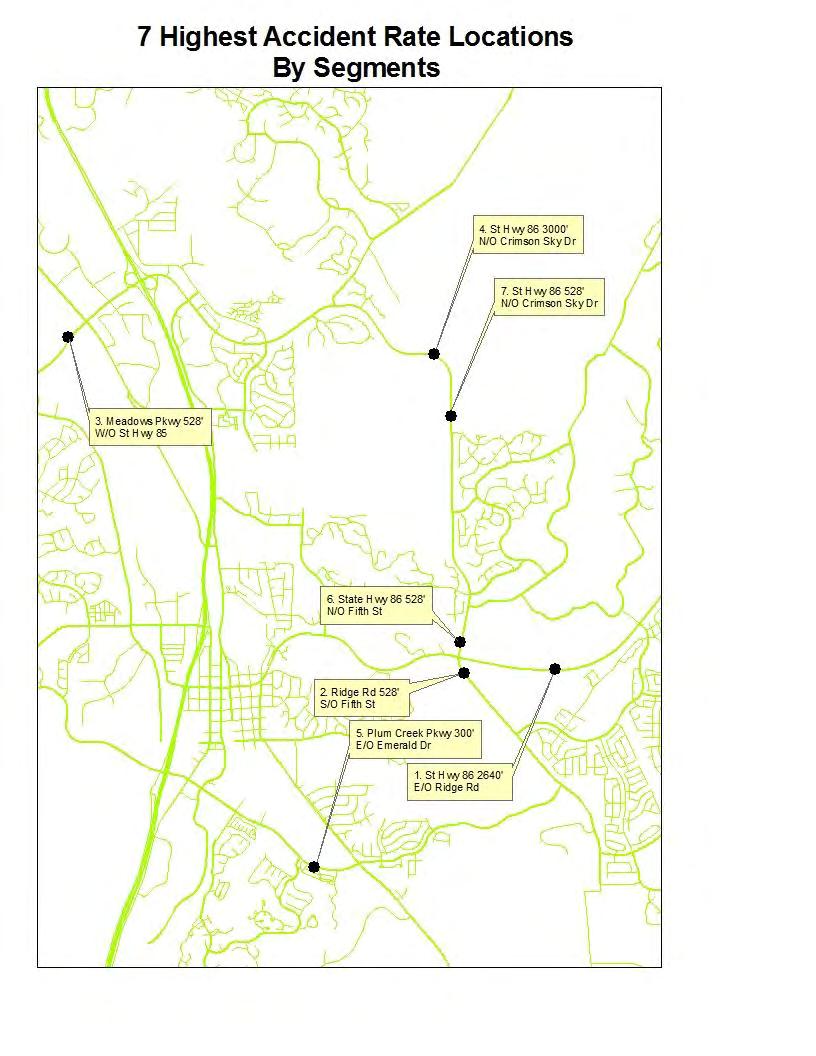
11 ACCIDENT RATES BY LOCATION Intersections # Avg. Volume Rate Rank based on Rate through intersection Factory Shops Blvd New Memphis Ct Fifth Woodlands Blvd SH Front St US Factory Shops Blvd US Meadows Pkwy Plum Creek Perry St Meadows Meadows Blvd SH Allen Wy SH Ridge Rd SH 86 and Trail Boss Dr US Plum Creek Wilcox St. Meadows Limelight Av SH Crowfoot Valley Rd SH Street Segments Number of Map location Average Daily Traffic Rate Rank Based on Rate SH ' E/O Ridge Rd Ridge Rd 528 S/O Fifth St Meadows Pkwy 528 W/O US SH N/O Crimson Sky Plum Creek Pkwy 300 E/O Emerald SH N/O Fifth St SH N/O Crimson Sky Note: Segment study was based on segments with at least 2 accidents in any location. 7

12 8
13 9
14 TIME TRENDS MONTH OF YEAR % Deaths % January February March April May June July August September October November December Total DAY OF WEEK TIME OF DAY % Deaths % Midnight :00am :00am :00am :00am :00am :00am :00am :00am :00am :00am :00am :00pm :00pm :00pm :00pm :00pm :00pm :00pm :00pm :00pm :00pm :00pm :00pm Total % Deaths % Sunday Monday Tuesday Wednesday Thursday Friday Saturday Total
15 Number of Fatalities TYPES OF CRASHES FIRST HARMFUL EVENT Number of Injuries Number of % of Hit Other Vehicle Hit Fixed or Other Object Rollover Hit Animal Hit Pedestrian Hit Bicyclist Hit Railway Train Hit Parked Vehicle All Others TOTAL VEHICLE TYPE Vehicles Involved in % of Vehicles Auto SUV Pick-up Truck(over 10,000 lbs) 25 2 Motorcycle/Moped 12 1 Bicycle 11 1 Other 36 4 TOTAL
16 INVOLVEMENT BY AGE AND GENDER Note: 9% of accidents reported were unknown age/gender. Percent of Drivers Involved in Traffic by Age and Gender P e r c e n t Male Female Age 12
17 ACCIDENT LOCATION Intersections: Intersections By Classification Number Of Number Of People Killed Number Of People Injured Arterial/Arterial Arterial/Collector Collector/Collector Collector/Local Local/Local Total Non-Intersections: Segments Number of Number of People Killed Number of People Injured Multi-lane Arterial or Collector Two-lane Arterial Or Collector Local Total
18 ACCIDENT ENVIRONMENT Traffic control % Railroad Device 0 0 Yield Sign 0 0 Stop Sign Traffic Signal None Total Weather % Clear Rain 19 3 Snow/Sleet 42 8 Other 8 1 Total Road Conditions % Dry Wet 51 9 Icy/Slushy Other 19 3 Total Lighting Condition % Day Night Total
19 THE DRIVER Primary Cause of % Failed to Yield Right of Way Careless/Reckless Driving Violation of Red Signal 23 4 Unsafe Backing 16 3 Speeding too fast for 29 5 conditions Following too closely Turned Left in Front of 8 1 Approaching Traffic All Other/Unknown Total Condition of Drivers Drivers % No Defect or Unknown Other* ( includes: aggressive driving, fatigue, inexperienced drivers, distractions, illness) Cell Phone 6 1 *Alcohol related accidents are found in a separate table on the next page 15
20 ALCOHOL AND DRUG INVOLVEMENT Number of Involving Drivers Influenced by Alcohol or Drugs Age All Drivers Male Female < > Total

21 ANNUAL TRENDS Between 2004 and 2011, the Town s population increased by 43%. Considering the fact that an increase in accidents usually follows an increase in miles traveled which is closely correlated to population increases, our residents are not doing all that badly. As can be seen in the graph below, the number of accidents has remained within a fairly constant range for the past eight years. 17

22 The number of injury accidents and the corresponding injury accident rate have dramatically decreased since This could be due to more enforcement of the seat belt law, or to other factors such as a better observance of the speed limit. There are no patterns to the fatal accidents that have occurred. The one fatality recorded this year occurred when a car driven by a 20 year old left the roadway and struck a fixed object. The accident occurred during daylight hours; excessive speed was a contributing factor. 18

23 19
24 DEFINITIONS The following special terms are used throughout this report, and are provided to clarify the meaning of the data. 1. Accident (or traffic accident): An unintended event involving a motor vehicle that causes death, injury, or property damage. 2. Alcohol Involvement Accident: Any motor vehicle accident in which a driver, pedestrian, or bicyclist had consumed alcohol. 3. Fatal Accident: A motor vehicle traffic accident which causes the death of one or more persons. 4. Hit-Other-Vehicle: A type of collision in which the first harmful event involves a collision between two or more vehicles. 5. Injury: A person sustaining injuries as the result of a motor vehicle traffic accident. This includes victims with the extent of injury of severe wound, other visible injury, or complaint of pain. Victims killed are not included in the injury category. 6. Motor Vehicle: Any motorized (mechanically or electrically powered) vehicle not operated on rails. 7. Other Non-collision: An event during an accident sequence which does not involve a collision with another vehicle or object. 8. Rollover: An accident in which the overturning of a vehicle was the first harmful event. 9. Type of Crash: The category which best describes the general type of collision which was the first event. 20
2008 TOWN OF CASTLE ROCK MOTOR VEHICLE ACCIDENT FACTS
 2008 TOWN OF CASTLE ROCK MOTOR VEHICLE ACCIDENT FACTS 2008 TOWN OF CASTLE ROCK MOTOR VEHICLE ACCIDENT FACTS ACKNOWLEDGEMENTS This report was assembled from data provided by the Castle Rock Police Department
2007 TOWN OF CASTLE ROCK MOTOR VEHICLE ACCIDENT FACTS
 2007 TOWN OF CASTLE ROCK MOTOR VEHICLE ACCIDENT FACTS 2007 TOWN OF CASTLE ROCK MOTOR VEHICLE ACCIDENT FACTS ACKNOWLEDGEMENTS This report was assembled from data provided by the Castle Rock Police Department
2015 Community Report White Rock
 5 White Rock Produced for the New Mexico Department of Transportation, Traffic Safety Division, Traffic Records Bureau, Under Contract 58 by the University of New Mexico, Geospatial and Population Studies,
2016 Community Report Los Alamos County
 6 Los Alamos County Produced for the New Mexico Department of Transportation, Traffic Safety Division, Traffic Records Bureau, Under Contract 58 by the University of New Mexico, Geospatial and Population
2015 Community Report Grants
 5 Grants Produced for the New Mexico Department of Transportation, Traffic Safety Division, Traffic Records Bureau, Under Contract 58 by the University of New Mexico, Geospatial and Population Studies,
2016 Community Report Portales
 6 Portales Produced for the New Mexico Department of Transportation, Traffic Safety Division, Traffic Records Bureau, Under Contract 58 by the University of New Mexico, Geospatial and Population Studies,
2016 Community Report Torrance County
 6 Torrance County Produced for the New Mexico Department of Transportation, Traffic Safety Division, Traffic Records Bureau, Under Contract 58 by the University of New Mexico, Geospatial and Population
2015 Community Report Torrance County
 5 Torrance County Produced for the New Mexico Department of Transportation, Traffic Safety Division, Traffic Records Bureau, Under Contract 58 by the University of New Mexico, Geospatial and Population
2016 Community Report De Baca County
 6 De Baca County Produced for the New Mexico Department of Transportation, Traffic Safety Division, Traffic Records Bureau, Under Contract 58 by the University of New Mexico, Geospatial and Population
2015 Community Report Las Vegas
 5 Las Vegas Produced for the New Mexico Department of Transportation, Traffic Safety Division, Traffic Records Bureau, Under Contract 58 by the University of New Mexico, Geospatial and Population Studies,
2015 Community Report Tularosa
 5 Tularosa Produced for the New Mexico Department of Transportation, Traffic Safety Division, Traffic Records Bureau, Under Contract 58 by the University of New Mexico, Geospatial and Population Studies,
2016 Community Report Santa Fe County
 26 Santa Fe County Produced for the New Mexico Department of Transportation, Traffic Safety Division, Traffic Records Bureau, Under Contract 58 by the University of New Mexico, Geospatial and Population
2015 Community Report Chaparral
 5 Chaparral Produced for the New Mexico Department of Transportation, Traffic Safety Division, Traffic Records Bureau, Under Contract 58 by the University of New Mexico, Geospatial and Population Studies,
2014 Community Report Portales
 4 Portales Produced for the New Mexico Department of Transportation, Traffic Safety Division, Traffic Records Bureau, Under Contract 58 by the University of New Mexico, Geospatial and Population Studies,
2016 Community Report Aztec
 Aztec Produced for the New Mexico Department of Transportation, Traffic Safety Division, Traffic Records Bureau, Under Contract 58 by the University of New Mexico, Geospatial and Population Studies, Traffic
2015 Community Report Aztec
 25 Aztec Produced for the New Mexico Department of Transportation, Traffic Safety Division, Traffic Records Bureau, Under Contract 58 by the University of New Mexico, Geospatial and Population Studies,
2016 Community Report San Juan County
 26 San Juan County Produced for the New Mexico Department of Transportation, Traffic Safety Division, Traffic Records Bureau, Under Contract 58 by the University of New Mexico, Geospatial and Population
2015 Community Report San Juan County
 25 San Juan County Produced for the New Mexico Department of Transportation, Traffic Safety Division, Traffic Records Bureau, Under Contract 58 by the University of New Mexico, Geospatial and Population
2015 Community Report Doña Ana County
 25 Doña Ana County Produced for the New Mexico Department of Transportation, Traffic Safety Division, Traffic Records Bureau, Under Contract 58 by the University of New Mexico, Geospatial and Population
2016 Community Report New Mexico
 216 Produced for the Department of Transportation, Traffic Safety Division, Traffic Records Bureau, Under Contract 581 by the University of, Geospatial and Population Studies, Traffic Research Unit Distributed
2014 Community Report Luna County
 4 Luna County Produced for the New Mexico Department of Transportation, Traffic Safety Division, Traffic Records Bureau, Under Contract 58 by the University of New Mexico, Geospatial and Population Studies,
2015 Community Report Los Lunas
 25 Los Lunas Produced for the New Mexico Department of Transportation, Traffic Safety Division, Traffic Records Bureau, Under Contract 58 by the University of New Mexico, Geospatial and Population Studies,
2014 Community Report Las Vegas
 4 Las Vegas Produced for the New Mexico Department of Transportation, Traffic Safety Division, Traffic Records Bureau, Under Contract 58 by the University of New Mexico, Geospatial and Population Studies,
2014 Community Report Truth or Consequences
 4 Truth or Consequences Produced for the New Mexico Department of Transportation, Traffic Safety Division, Traffic Records Bureau, Under Contract 58 by the University of New Mexico, Geospatial and Population
2014 Community Report Tularosa
 4 Tularosa Produced for the New Mexico Department of Transportation, Traffic Safety Division, Traffic Records Bureau, Under Contract 8 by the University of New Mexico, Geospatial and Population Studies,
2014 Community Report Aztec
 Aztec Produced for the New Mexico Department of Transportation, Traffic Safety Division, Traffic Records Bureau, Under Contract 58 by the University of New Mexico, Geospatial and Population Studies, Traffic
2014 Community Report Los Lunas
 4 Los Lunas Produced for the New Mexico Department of Transportation, Traffic Safety Division, Traffic Records Bureau, Under Contract 58 by the University of New Mexico, Geospatial and Population Studies,
RTCSNV CRASH ANALYSIS REPORT
 2011-2015 RTCSNV CRASH ANALYSIS REPORT TABLE OF CONTENTS Summary... 3 Crash Types... 4 Time and Day of Crashes... 7 Crash Factors... 9 Fatalities... 10 Driver s Behavior... 11 Crash Locations... 15 Non-Motorized
Delaware Information and Analysis Center
 Delaware Information and Analysis Center 2015 DELAWARE THERE WERE 684,731 LICENSED DRIVERS, 892,508 REGISTERED MOTOR VEHICLES, AND 9,761,000,000 VEHICLE MILES DRIVEN*. THERE WERE 24,066 TRAFFIC CRASHES
Pedestrians Road Safety
 Pedestrians Road Safety Overview Over the period 1996-2009, 5,323 people have been killed on Irish road. Out of this 22% (1162) were pedestrians. Additional 3863 pedestrians were seriously injured in the
Alberta Speeding Convictions and Collisions Involving Unsafe Speed
 Alberta Speeding Convictions and Collisions Involving Unsafe Speed 2004-2008 Overview This document was prepared under the Alberta Traffic Safety Plan, Strategic Research Plan for 2008-2010, with the objective
Traffic Accident Statistics
 2000 Missouri State Highway System Traffic Accident Statistics Missouri State Highway System Traffic Accident Statistics Table of Contents Subject Chapter 1: Statewide Traffic Accident Statistics, Introduction
Traffic Safety Network Huron Valley
 June 2018 Revised 8/3/2018 2017 Reporting Criteria Please pay particular attention to the wording when interpreting the three levels of data gathered for this report. Crash The Crash Level analyzes data
Michigan State Police (MSP) Post 21 - Metro North
 Post 21 - Metro North") October 2017 2016 Reporting Criteria Please pay particular attention to the wording when interpreting the three levels of data gathered for this report. Crash The Crash Level analyzes data related to crash
October 2017 2016 Reporting Criteria Please pay particular attention to the wording when interpreting the three levels of data gathered for this report. Crash The Crash Level analyzes data related to crash
Michigan State Police (MSP) Post 21 - Metro North
 Post 21 - Metro North") June 2018 Revised 8/3/2018 2017 Reporting Criteria Please pay particular attention to the wording when interpreting the three levels of data gathered for this report. Crash The Crash Level analyzes data
June 2018 Revised 8/3/2018 2017 Reporting Criteria Please pay particular attention to the wording when interpreting the three levels of data gathered for this report. Crash The Crash Level analyzes data
Collision Analysis Safety Tables
 Crash Severity Geography of Geography of Time and Date of Crash Conditions Features Features.. Queries Selected: Town(Hartford), Date(Year:All or //05 to 9/7/06), Severity(All), Route Class(Interstate),
ITSMR Research Note. Motorcyclists and Impaired Driving ABSTRACT INTRODUCTION KEY FINDINGS. September 2013
 September 2013 KEY FINDINGS F&PI CRASHES INVOLVING IMPAIRED MOTORCYCLISTS 27% of the fatal MC crashes over the five year period, 2008-2012, were alcohol-related. 48% of the alcohol-related F&PI MC crashes
Pedestrians Road Safety
 Pedestrians Road Safety Overview According to the World Health Organization, the World Bank, the FIA Foundation for the Automobile and Society and the Global Road Safety Partnership collaborative report
Understanding and Identifying Crashes on Curves for Safety Improvement Potential in Illinois
 Understanding and Identifying Crashes on Curves for Safety Improvement Potential in Illinois Priscilla Tobias, P.E. Mouyid Islam, Ph.D. Kim Kolody, P.E. Optional Agenda Image Title Background Workflow
Gallup Community Report, 2007
 Gallup Community Report, 7 Demographics In 7, there were,8 licensed drivers in Gallup. Of these, there were 7,9 females and 7,9 males. The population of Gallup was 8,8. The total number of crashes in 7
TABLE OF CONTENTS CRASHES.. VI TRENDS. VII
 TABLE OF CONTENTS Introduction. I Letter from the Governor II Executive Summary of this Report. III-IV 1998 Nevada Quick Collision Facts V CRASHES.. VI a. Statewide Total Crashes by Severity... 1 b. Statewide
1999 Missouri State Highway System. Missouri Department of Transportation - Transportation Management Systems
 1999 Missouri State Highway System Traffic Accident Statistics - Transportation Management Systems Missouri State Highway System Traffic Accident Statistics Table of Contents Subject Chapter 1: Statewide
Department of Highway Safety and Motor Vehicles
 Department of Highway Safety and Motor Vehicles Traffic Report 2005 A Compilation of Motor Vehicle Crash Data from the Florida Crash Records Database Fred O. Dickinson Executive Director Our Mission: Making
Michigan. Traffic. Profile
 June 2014 Revised 5/11/15 Michigan 2013 Traffic Crash Profile Reporting Criteria Please pay particular attention to the wording when interpreting the three levels of data gathered for this report. Crash
1 of 7 9/22/2015 1:20 PM
 1 of 7 9/22/2015 1:20 PM Demographics In 2009, there were 27,245 licensed drivers in Alamogordo. Of these, there were 13,674 females and 13,571 males. The population of Alamogordo was 35,984. The total
Regional Safety Study
 BOONSLICK REGIONAL PLANNING COMMISSION Regional Safety Study PART I: General Crash Data and Trends SPRING 2012 BRPC REGIONAL SAFETY STUDY: PART 1 ~ GENERAL CRASH DATA & TRENDS 1 TABLE OF CONTENTS REPORT
Washtenaw County Traffic Crash Data & Year Trends. Reporting Criteria
 June 2018 Revised 8/3/2018 2017 Reporting Criteria Please pay particular attention to the wording when interpreting the three levels of data gathered for this report. Crash The Crash Level analyzes data
Michigan. Traffic. Profile
 June 2014 Revised 5/11/15 Michigan 2013 Traffic Crash Profile Reporting Criteria Please pay particular attention to the wording when interpreting the three levels of data gathered for this report. Crash
Washtenaw County Traffic Crash Data & Year Trends. Reporting Criteria
 June 2017 Revised 10/3/17 2016 Reporting Criteria Please pay particular attention to the wording when interpreting the three levels of data gathered for this report. Crash The Crash Level analyzes data
ROADWAY INJURY EXPERIENCE FOR PERSONS WHO HAD BEEN DRINKING AND/OR USING DRUGS
 ROADWAY INJURY EXPERIENCE FOR PERSONS WHO HAD BEEN DRINKING AND/OR USING DRUGS Vehicle Severity Total Crashes involving drinking, not drugs Crashes involving drugs, not drinking Crashes involving drinking
Florida Strategic Highway Safety Planning Florida Strategic Highway Safety Plan (SHSP) Update and Performance Overview
 Update and Performance Overview") Session 1 Florida Strategic Highway Safety Planning Florida Strategic Highway Safety Plan (SHSP) Update and Performance Overview Joe Santos, PE, FDOT, State Safety Office October, 23, 2013 Florida Statistics
Session 1 Florida Strategic Highway Safety Planning Florida Strategic Highway Safety Plan (SHSP) Update and Performance Overview Joe Santos, PE, FDOT, State Safety Office October, 23, 2013 Florida Statistics
Alberta. Collision Facts. 330 people killed. 17,907 people injured. 140,705 collisions.
 Collision Facts 330 people killed 17,907 people injured 140,705 collisions May 2017 www.transportation.alberta.ca/statistics Collision Facts 330 people killed 17,907 people injured 140,705 collisions Monday
LOADING AND UNLOADING SURVEY NATIONAL SCHOOL BUS. Kansas leads the world in the success of each student.
 NATIONAL SCHOOL BUS LOADING AND UNLOADING SURVEY Kansas leads the world in the success of each student. January 2018 The Kansas State Department of Education School Bus Safety Unit wishes to thank the
Provisional Review of Fatal Collisions. January to December 31 st 2017
 Provisional Review of Fatal Collisions January to December 31 st 17 2 nd January 18 Review of 17 fatal collision statistics as of 31st December 17 Overview This report summarises the main trends in road
Michigan State Police (MSP) Traffic Safety Network Traverse Bay Area
 Traffic Safety Network Traverse Bay Area") June 2016 Revised 2/15/2017 2015 Reporting Criteria Please pay particular attention to the wording when interpreting the three levels of data gathered for this report. Crash The Crash Level analyzes data
June 2016 Revised 2/15/2017 2015 Reporting Criteria Please pay particular attention to the wording when interpreting the three levels of data gathered for this report. Crash The Crash Level analyzes data
1 of 6 9/23/2015 4:35 PM
 1 of 6 9/23/2015 4:35 PM Demographics In 2008, there were 60,539 licensed drivers in Rio Rancho. Of these, there were 30,884 females and 29,655 males. The population of Rio Rancho was 79,651. The total
Missouri Seat Belt Usage Survey for 2017
 Missouri Seat Belt Usage Survey for 2017 Conducted for the Highway Safety & Traffic Division of the Missouri Department of Transportation by The Missouri Safety Center University of Central Missouri Final
 1 of 7 9/23/2015 5:23 PM Demographics In 2008, there were 12,286 licensed drivers in Socorro County. Of these, there were 5,872 females and 6,414 males. The population of Socorro County was 18,180. The
Doña Ana County Report, 2001
 Doña Ana County Report, 1 Demographics In 1, there were 7,7 licensed drivers in Doña Ana County. Of these, there were 17,15 females and,115 males. The population in Doña Ana County was 87,1. The total
Analysis of Road Crash Statistics Western Australia 1990 to Report. December Project: Transport/21
 Analysis of Road Crash Statistics Western Australia 1990 to 1999 Report December 2000 Project: Transport/21 Analysis of Road Crash Statistics Western Australia 1990 to 1999 December 2000 Client: Transport
ALCOHOL AND WYOMING TRAFFIC CRASHES
 AND WYOMING TRAFFIC -2007- 2002-2007 SUMMARY COMPARISON FOR WYOMING TRAFFIC YEAR OF 2002 2003 2004 2005 2006 2007 ALL FATAL 151 141 142 147 169 136 FATAL 53 43 50 51 58* 46* PERCENT [%] 35.0% 30.5% 35.2%
Where are the Increases in Motorcycle Rider Fatalities?
 Where are the Increases in Motorcycle Rider Fatalities? Umesh Shankar Mathematical Analysis Division (NPO-121) Office of Traffic Records and Analysis National Center for Statistics and Analysis National
file:///n:/students/maurreen/for Website/reports/Community/comm_10/...
 1 of 7 4/27/2015 11:28 AM Demographics In 2010, there were 12,013 licensed drivers in Aztec. Of these, there were 6,040 females and 5,973 males. The population of Aztec was 6,763. The total number of crashes
Fatal Motor Vehicle Crashes on Indian Reservations
 April 2004 DOT HS 809 727 Fatal Motor Vehicle Crashes on Indian Reservations 1975-2002 Technical Report Colleges & Universities 2% Other Federal Properties 9% Other 4% Indian Reservations 65% National
 1 of 7 9/23/2015 5:20 PM Demographics In 2008, there were 91,559 licensed drivers in Sandoval County. Of these, there were 46,678 females and 44,881 males. The population of Sandoval County was 122,298.
SEGMENT 2 DRIVER EDUCATION Risk Awareness
 Fact Sheet 1 Why Should Young Drivers Be Concerned? Risk is the chance of death, injury, damage, or loss. Approximately 1 out of 11 (9%) of 16-year-old drivers will have a serious crash before his/her
Demographics An updated licensed driver count is not available for Navajo Nation for The total number of crashes in 2008 was 95.
 1 of 6 9/23/2015 4:57 PM Demographics An updated licensed driver count is not available for Navajo Nation for 2008. The total number of crashes in 2008 was 95. General Crash Information From 1999 to 2008
Preliminary 2014 Ontario Road Safety Annual Report Selected Statistics
 Selected Statistics The following tables were created using the preliminary fatality and injury data from the 2014 Ontario Collision Database. Final numbers will vary. Produced by: Road Safety Research
Rio Arriba County Report, 2007
 Rio Arriba County Report, 7 Demographics In 7, there were 3,748 licensed drivers in Rio Arriba County. Of these, there were,68 females and,63 males. The population in Rio Arriba County was 4,87. The total
Rio Arriba County Report, 2002
 Rio Arriba County Report, Demographics In, there were,8 licensed drivers in Rio Arriba County. Of these, there were 8,8 females and 8,8 males. The population in Rio Arriba County was,9. The total number
Van Buren County Traffic Crash Data & Year Trends. Reporting Criteria
 May 2015 Revised 3/16/2016 2014 Reporting Criteria Please pay particular attention to the wording when interpreting the three levels of data gathered for this report. Crash The Crash Level analyzes data
Kent County Traffic Crash Data & Year Trends. Reporting Criteria
 May 2015 Revised 3/16/2016 2014 Reporting Criteria Please pay particular attention to the wording when interpreting the three levels of data gathered for this report. Crash The Crash Level analyzes data
TABLE OF CONTENTS CRASHES.. VI TRENDS. VII
 NEVADA TRAFFIC CRASHES 2002 G R E AT S E A L O F T H E S TAT E T H E O F ALL FOR OUR COUNTRY N E V A D A PREPARED BY THE NEVADA DEPARTMENT OF TRANSPORTATION SAFETY/TRAFFIC ENGINEERING DIVISION IN COOPERATION
NEW JERSEY LAW ENFORCEMENT LIAISON NEWSLETTER
 NEW JERSEY LAW ENFORCEMENT LIAISON NEWSLETTER JUNE 2018/21 WWW..ORG NJ DIVISION OF HIGHWAY TRAFFIC SAFETY DRIVE SOBER OR GET PULLED OVER 2018 MOBILIZATION The mission of the Division of The Drive Sober
Young drivers. Drivers involved in fatal or injury crashes. Drivers involved in fatal/injury crashes per 100. per licence holders (lines)
") Young drivers CRASH FACTSHEET 2012 CRASH STATISTICS FOR THE YEAR ENDED 31 DECEMBER 2011 Prepared by the Ministry of Transport In 2011 young drivers aged 15 24 were involved in 80 fatal traffic crashes,
Young drivers CRASH FACTSHEET 2012 CRASH STATISTICS FOR THE YEAR ENDED 31 DECEMBER 2011 Prepared by the Ministry of Transport In 2011 young drivers aged 15 24 were involved in 80 fatal traffic crashes,
National Household Travel Survey Add-On Use in the Des Moines, Iowa, Metropolitan Area
 National Household Travel Survey Add-On Use in the Des Moines, Iowa, Metropolitan Area Presentation to the Transportation Research Board s National Household Travel Survey Conference: Data for Understanding
Los Lunas Community Report, 2002
 Los Lunas Community Report, Demographics In, there were, licensed drivers in Los Lunas. Of these, there were, females and, males. The population of Los Lunas was,. The total number of crashes in was, yielding
TABLE OF CONTENTS CRASHES.. VI TRENDS. VII
 NEVADA TRAFFIC CRASHES 2001 AL OF TH OF TH E AT E GRE ST AT E SE AL L FOR NT OUR COU NE RY VA D A PREPARED BY THE NEVADA DEPARTMENT OF TRANSPORTATION SAFETY/TRAFFIC ENGINEERING DIVISION IN COOPERATION
Road fatalities in 2012
 Lithuania 1 Inhabitants Vehicles/1 000 inhabitants Road fatalities in 2012 Fatalities /100 000 inhabitants in 2012 2.98 million 751 301 10.1 1. Road safety data collection Definitions Road fatality: person
the Ministry of Transport is attributed as the source of the material
 Young Drivers 2016 Disclaimer All reasonable endeavours are made to ensure the accuracy of the information in this report. However, the information is provided without warranties of any kind including
Enhancing School Bus Safety and Pupil Transportation Safety
 For Release on August 26, 2002 (9:00 am EDST) Enhancing School Bus Safety and Pupil Transportation Safety School bus safety and pupil transportation safety involve two similar, but different, concepts.
Driving Safely in Maryland
 Maryland Department of Transportation State Highway Administration Office of Traffic and Safety Driving Safely in Maryland In 2008, there were 141 fatal speeding crashes, accounting for 28% of all fatal
CDMS - Crash Data Management System. Crash Data Report. Report Memo: RESERVE FOR MAP SCREENSHOT
 Report Memo: 213-217 RESERVE FOR MAP SCREENSHOT Intersection Summary Top 4 Report 15_2924 15_286 15_7359 15_595 15_22194 15_22158 15_12873 15_17926 15_2279 15_19276 15_1615 15_3128 15_17273 15_26238 15_19328
Austin Police Department. An Analysis of Traffic Fatalities 2015
 Austin Police Department An Analysis of Traffic Fatalities Prepared by the Austin Police Department Research and Planning Unit April Table of Contents Background... Overview... Terminology... Notes about
Large Trucks. Trends. About 1 in 10 highway deaths occurs in a crash involving a large truck.
 Large Trucks About 1 in 10 highway deaths occurs in a crash involving a large truck. Most deaths in large truck crashes are passenger vehicle occupants. The main problem is the vulnerability of people
DOT HS April 2013
 TRAFFIC SAFETY FACTS 2011 Data DOT HS 811 753 April 2013 Overview Motor vehicle travel is the primary means of transportation in the United States, providing an unprecedented degree of mobility. Yet for
Figure 15. Yearly Trend in Death Rates for Motor Vehicle Transport: NSW, Year
 6.0 MOTOR VEHICLE TRANSPORT 6.1 Deaths due to Motor Vehicle Transport: The motor vehicle transport (MV) death rate showed a statistically significant decrease overall between 1989 and 1999 although the
the Ministry of Transport is attributed as the source of the material images contained in the material are not copied
 Speed 2017 Disclaimer All reasonable endeavours are made to ensure the accuracy of the information in this report. However, the information is provided without warranties of any kind including accuracy,
TRAFFIC SAFETY FACTS. Overview Data
 TRAFFIC SAFETY FACTS 2009 Data Overview Motor vehicle travel is the primary means of transportation in the United States, providing an unprecedented degree of mobility. Yet for all its advantages, injuries
LARGE TRUCKS May 2010
 May 2010 A collision produces three levels of data: collision, unit (vehicles), and individual. For this reason, readers should pay particular attention to the wording of statements about the data to avoid
WHITE PAPER. Preventing Collisions and Reducing Fleet Costs While Using the Zendrive Dashboard
 WHITE PAPER Preventing Collisions and Reducing Fleet Costs While Using the Zendrive Dashboard August 2017 Introduction The term accident, even in a collision sense, often has the connotation of being an
Occupational Driving Safety Programs: The Driver
 Occupational Driving Safety Programs: The Driver Karen Puckett Director, Workplace Safety Texas Department of Insurance, Division of Workers Compensation (DWC) 1 Driving in Texas No deathless days in 2014
ANNUAL CRASH REPORT for the Cheyenne Urban Area
 2016 ANNUAL CRASH REPORT for the Cheyenne Urban Area 2016 ANNUAL CRASH REPORT FOR THE CHEYENNE URBAN AREA July 2017 The purpose of this report is to disseminate yearly crash information for the Cheyenne
A R T I C L E S E R I E S
 Comprehensive Safety Analysis Initiative A R T I C L E S E R I E S BASIC 1: UNSAFE DRIVING Staying on top of safety and compliance under the CSA 2010 initiative will mean getting back to the BASICs. This
National Center for Statistics and Analysis Research and Development
 U.S. Department of Transportation National Highway Traffic Safety Administration DOT HS 809 360 October 2001 Technical Report Published By: National Center for Statistics and Analysis Research and Development
National Center for Statistics and Analysis Research and Development
 U.S. Department of Transportation National Highway Traffic Safety Administration DOT HS 809 271 June 2001 Technical Report Published By: National Center for Statistics and Analysis Research and Development
Percentage of crashes with driving too fast for the conditions cited as a contributing factor ( ) 0% 5% 10% 15% 20% 25% 30% 35% Percentage
 0% 5% 10% 15% 20% 25% 30% 35% Percentage") Speeding CRASH FACTSHEET November 2013 CRASH STATISTICS FOR THE YEAR ENDED 31 DECEMBER 2012 Prepared by the Ministry of Transport In this fact sheet speeding is defined as driving too fast for the conditions.
Speeding CRASH FACTSHEET November 2013 CRASH STATISTICS FOR THE YEAR ENDED 31 DECEMBER 2012 Prepared by the Ministry of Transport In this fact sheet speeding is defined as driving too fast for the conditions.
Speed Limit and Safety Nexus Studies for Automated Enforcement Locations in the District of Columbia 400 Block 14th Street SW
 Speed Limit and Safety Nexus Studies for Automated Enforcement Locations in the District of Columbia 4 Block 4th Street SW Study Area and Location District PSA Ward ANC Phase Description 27 6 6D Existing
Citizens Committee for Facilities
 Citizens Committee for Facilities AGENDA Thursday, December 11, 2014 City Council Chambers 305 3 rd Avenue East -Twin Falls, Idaho 11:30 A.M. AGENDA ITEMS Purpose By 1. Discussion and possible action on
2016 Kansas Traffic Crash Facts. Definitions
 Definitions SPECIAL NOTE: Prior to 2005, the minimum criteria for reporting motor vehicle crashes for statistical purposes in Kansas were a non-injury crash occurring on or from a public roadway with over