2008 TOWN OF CASTLE ROCK MOTOR VEHICLE ACCIDENT FACTS
|
|
|
- Rosamond Neal
- 6 years ago
- Views:
Transcription


1 2008 TOWN OF CASTLE ROCK MOTOR VEHICLE ACCIDENT FACTS
2 2008 TOWN OF CASTLE ROCK MOTOR VEHICLE ACCIDENT FACTS ACKNOWLEDGEMENTS This report was assembled from data provided by the Castle Rock Police Department Accident report data from the year Each accident record, whether completed by a local police officer or a member of the Colorado State Patrol, was sent to Castle Rock and entered into a centralized database maintained by the Public Works Department The report itself was created by personnel in the Public Works Department. For more information on the capability or additional crash information contact: Libby E. Mueller Transportation Engineering Division Town of Castle Rock 4175 N. Castleton Ct Castle Rock, CO
3 Table of Contents Public Works Director s Letter i Executive Summary. 1 Quick Facts.. 2 Accident Rates by Location. 3-6 Time Trends. 7 Types of Crashes 8 Involvement by Age and Gender. 9 Accident Location. 10 Accident Environment 11 The Driver 12 Alcohol and Drug Involvement. 13 Annual Trends Road & Intersection Safety Definitions 20


4
5 EXECUTIVE SUMMARY 2008 CASTLE ROCK MOTOR VEHICLE ACCIDENT FACTS The mission of the Public Works Department is to provide Public Service and Safety through Quality Public Infrastructure. One aspect of furthering this mission is to analyze accident data on a regular basis in order to identify where the roadway environment may be a contributing factor to accidents, developing options for improvements, and programming projects for correction. Since 2004, when Public Works first reported accident statistics, the numbers of fatalities, and persons injured have been declining. Additionally, the crash rate per town population has also been decreasing since These trends are encouraging indications of the overall safety of travel on Town roadways. are the result of many factors. These factors can generally be classified into three main categories: 1) human factors, 2) vehicle factors, and 3) roadway environment. By far, the largest percentage of accidents can be attributed to human factors. Sadly, these are the factors all of us who drive can control and are usually the simplest to correct. Basic driver awareness and respect for all users of the Town s roadways will go the farthest towards reducing the number of accidents. The tools to attack human factors and change driver behavior however aren t always effective. Getting the facts out to drivers, police enforcement, and the use of public awareness campaigns can assist with increasing awareness. However it will take conscious decisions by all drivers to change behavior when behind the wheel. Addressing vehicle factors is also the responsibility of everyone who owns and operates a motor vehicle. Ensuring that vehicles are in good shape to operate efficiently on the roads will also greatly assist with reducing the number of accidents. Regular vehicle inspections along with preventative maintenance procedures will help reduce the chances of an accident occurring as a result of a vehicle malfunction. The roadway environment is something that is out of the driver s control. The goal in this regard is to identify locations where roadways could be a contributing factor and implement treatments to correct these. Public Works uses statistical modeling to identify the locations where corrections to the roadway environment may improve safety. This helps direct limited resources to the locations where the most benefit can be obtained and avoids directing these resources toward locations where problems may not exist. The following locations have been identified from several years of historical records as locations where roadway improvements may benefit transportation safety: Intersection Ownership Agency 1. SH 86 & Crowfoot Valley Dr CDOT 2. SH 86 & Fifth St CDOT The Colorado Department of Transportation (CDOT) will be provided with these findings and support provided where possible to assist them with further review of these locations for improvements. Road safety begins with all of us. Please remember to be courteous and cautious every time you get behind the wheel. 1
6 2008 QUICK FACTS The 2008 Toll The 2007 Toll The 2006 Toll Persons Killed Persons Injured Reported One traffic accident was reported every 16.4 Hours on average. One out of every eight accidents involved an injury. Of all drivers involved in accidents, 16% were age 19 or under, and 24 % were under 25 Years of age. 9.5% were over the age of 60. Of all accidents 21 % occurred at night. The 2008 pedestrian death toll was 0. There were 0 fatalities among motorcycle or moped riders. 2
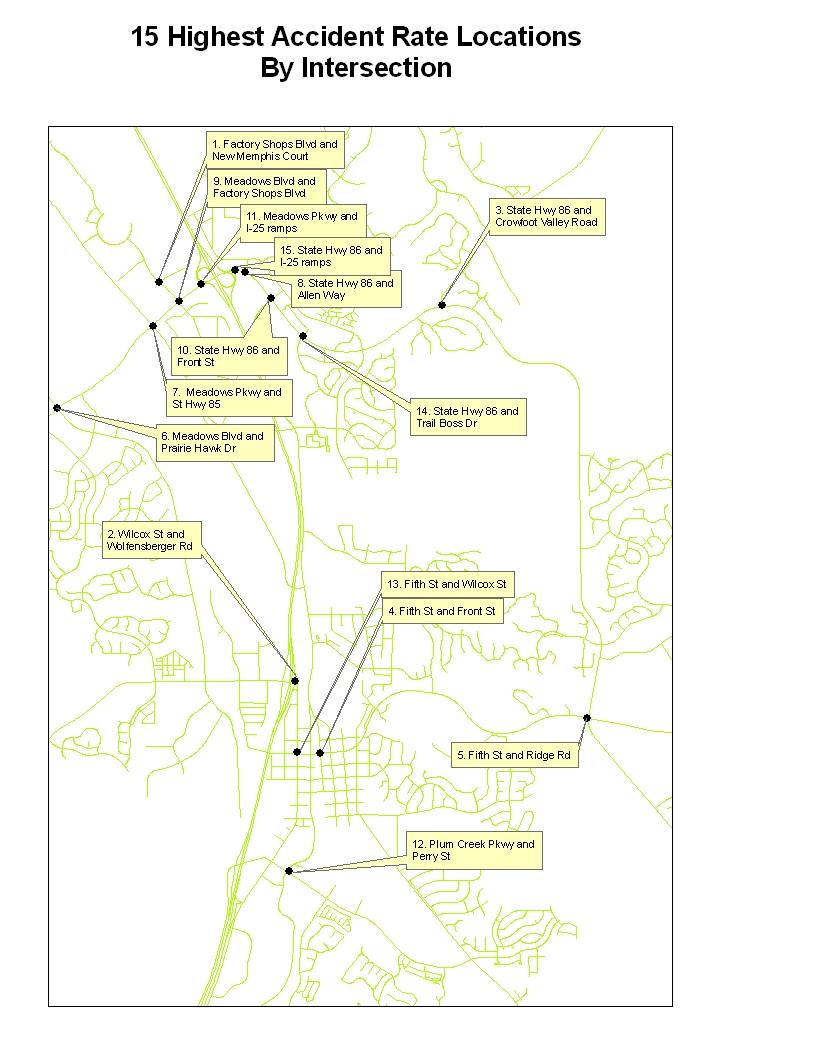
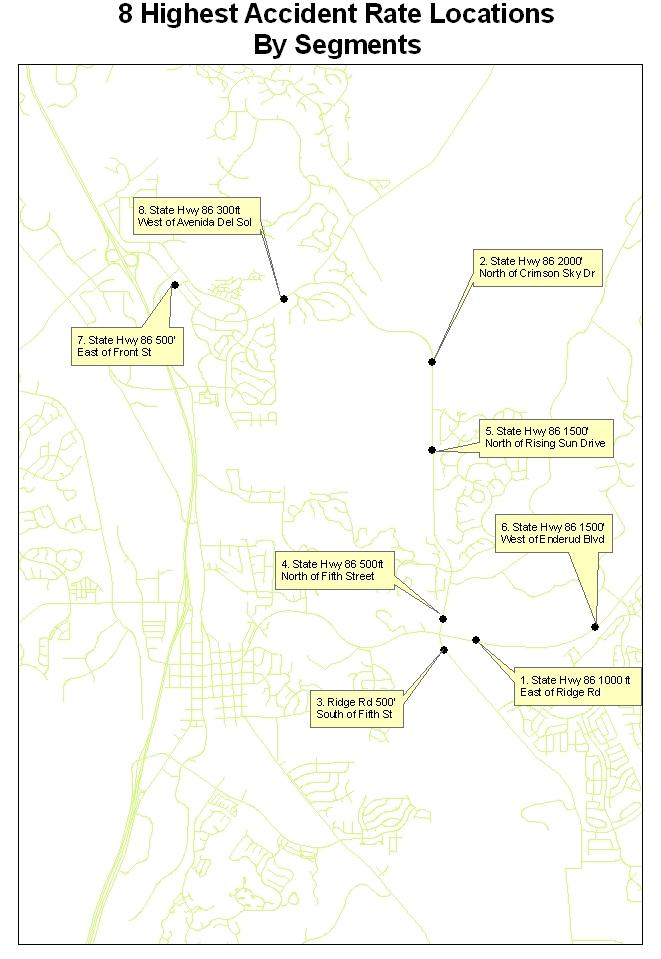
7 ACCIDENT RATES BY LOCATION Intersections # Avg. Volume through intersection Rate Rank based on Rate Factory Shops Blvd and New Memphis Ct Wilcox Street and Wolfensberger Rd St Hwy 86 and Crowfoot Valley Rd Fifth St and Front St Fifth St and Ridge Rd Meadows Pkwy and Prairie Hawk Dr St Hwy 85 and Meadows Pkwy St Hwy 86 and Allen Wy Meadows Pkwy and Factory Shops Blvd St Hwy 86 and Front St I-25 and Meadows Pkwy Plum Creek Pkwy and Perry St Wilcox St and Fifth St St Hwy 86 and Trail Boss Dr I-25 and St Hwy Street Segments St Hwy E/O Ridge Rd St Hwy N/O Crimson Sky Dr Ridge Rd 500 S/O Fifth St St Hwy N/O Fifth St Number of Map location Average Daily Traffic Rate Rank Based on Rate
8 Street Segments St Hwy N/O Rising Sun Dr St Hwy W/O Enderud St Hwy E/O Front St St Hwy W/O Avenida Del Sol Number of Map location Average Daily Traffic Rate Rank Based on Rate ****Segment study was based on segments with more than 1 accident in any location. 4
9 5
10 6
11 TIME TRENDS MONTH OF YEAR % Deaths % January February March April May June July August September October November December Total DAY OF WEEK % Deaths % Sunday Monday Tuesday Wednesday Thursday Friday Saturday Total TIME OF DAY % Deaths % Midnight :00am :00am :00am :00am :00am :00am :00am :00am :00am :00am :00am :00pm :00pm :00pm :00pm :00pm :00pm :00pm :00pm :00pm :00pm :00pm :00pm Total
12 Number of Fatalies TYPES OF CRASHES FIRST HARMFUL EVENT Number of Injuries Number of % of Hit Other Vehicle Hit Fixed or Other Object Rollover Hit Animal Hit Pedestrian Hit Bicyclist Hit Railway Train Hit Parked Vehicle All Others TOTAL VEHICLE TYPE Vehicles Involved in % of Vehicles Auto SUV Pick-up Truck(over 10,000 lbs) 46 4 Motorcycle/Moped 12 2 Bicycle 5.5 Other 8.5 TOTAL
13 INVOLVEMENT BY AGE AND GENDER Note: 9% of accidents reported were unknown age/gender. Percent of Drivers Involved in Traffic by Age and Gender 10 Percent Involvement < >70 Male Female Age 9
14 ACCIDENT LOCATION Intersections: Intersections By Classification Number Of Number Of People Killed Number Of People Injured Arterial/Arterial Arterial/Collector Collector/Collector Collector/Local Local/Local Total Non-Intersections: Segments Number of Number of People Killed Number of People Injured Multi-lane Arterial or Collector Two-lane Arterial Or Collector Local Total
15 ACCIDENT ENVIRONMENT Traffic control % Railroad Device 0 0 Yield Sign 2 1 Stop Sign Traffic Signal None Total Weather % Clear Rain 15 3 Snow/Sleet Other 6 1 Total Road Conditions % Dry Wet 39 7 Icy/Slushy Other 13 3 Total Lighting Condition % Day Night Total
16 THE DRIVER Primary Cause of % Failed to Yield Right of Way Careless/Reckless Driving Violation of Red Signal 13 2 Unsafe Backing 14 2 Speeding too fast for conditions 25 5 Following too closely 18 4 Turned Left in Front of Approaching Traffic 14 2 All Other/Unknown Total Condition of Drivers Drivers % No Defect or Unknown DUI or Other Cell Phone 12 1 (Alcohol related accidents are found in a separate table on the next page.) 12
17 ALCOHOL AND DRUG INVOLVEMENT Number of Involving Drivers Influenced by Alcohol or Drugs Age All Drivers Male Female < > Total
18 ANNUAL TRENDS The following tables present data about police-reported motor vehicle crashes over time (in yearly increments). This is the fifth year that annual reporting of accident data has occurred. As such, trends are just beginning to establish themselves. Below are some facts that can be interpolated from these charts. - The total number of crashes increased by an average of 1% over the five years. The biggest increase was from 2004 to 2005 (15%) with a 6% increase from 2006 to 2007, and a 16% decrease from 2007 to Compared against the increase in the Town s population the total crash rate per 1,000 people decreased by 22.8% (from 15.2 crashes per 1,000 population to 11.7 crashes per 1,000 population) over the same five-year period. What s not known is the total crash rate per vehicle miles traveled. This helps to better understand the accident risk associated with exposure. Nationally, the total distance the average person travels in motor vehicles has been increasing. With the increase in the Town s population and this national increase in average trip distance, the total crash rate per vehicle miles traveled is estimated to be decreasing. - The total number of fatalities dropped by 100% over the five-year period. - The total number of injuries dropped by 56% over the same five-year period. The total injury rate per 1,000 people dropped by 67%. Total Reported Crashes, Reported Year 14
19 ANNUAL TRENDS (Continued) Total Fatalities, # Fatalities Year Total Persons Injured, Injured Persons Year 15
20 ANNUAL TRENDS (Continued) Total Crash, Fatality, and Injury Rates per Population Rate (#/1,000 pop.) Crash Rate Fatality Rate Injury Rate
21 ROAD & INTERSECTION SAFETY One important goal from this accident data is to identify locations where the road environment may be a contributing factor to accidents. This is possible through statistical analysis. Through a statistical analysis of signalized intersections, the following intersections have been identified as the candidates where improvements to the intersection may be beneficial to reducing accidents: Intersection Ownership Agency 1. SH 86 & Crowfoot Valley Dr CDOT 2. SH 86 & Fifth St CDOT The roadway environment is something that is out of the driver s control. Part of the mission of the Town s Traffic Engineering and Operations Division is to assist with minimizing the number of roadway hazards that exist on Town roads that could contribute to accidents. The goal in this regard is to identify locations where roadways could be a contributing factor and implement treatments to correct these. The definition of the safety of a road section or intersection that the Traffic Engineering and Operations Division uses is the number of accidents expected to occur at these locations during a specified period. Because there are factors that are not related to the physical roadway that contribute to accidents, road sections and intersections are expected to have accidents occur. Since what is expected cannot be known, safety can only be estimated, and estimation is in degrees of precision. The precision of an estimate is usually expressed by it s standard deviation. For practical reasons Traffic Engineering is interested in the safety of a road section or intersection that either requires attention because it seems to have too many accidents, or merits attention because it has fewer accidents than expected. In both cases, were the estimation of safety to be based only on accident counts or accident rates, the estimate would be biased. The existence of this regression-to-mean bias has been long recognized. It is known to produce inflated estimates of countermeasure effectiveness. To estimate roadway safety, Traffic Engineering utilizes the Empirical Bayes (EB) method. This method increases the precision of the estimates and corrects for the regression-to-mean bias. The EB method recognizes that accident counts or rates are not the only clue to safety. Another clue is in what is known about the safety of similar entities. To identify the safety of similar entities, safety performance functions (SPFs), which are models, need to be developed from existing data (accidents, vehicle volumes, etc.). SPF models from other jurisdictions can also be adopted if these SPFs are found to fit the Town s local trends. The refinement of SPFs increases as more data becomes available. Traffic Engineering is striving to develop effective SPFs for signalized intersections, roadway segments, and nonsignalized intersections in order to provide for a full toolbox for identifying safety issues. This is important not only to identify locations with potential safety issues, but also to ensure that limited resources are not exhausted on problems that may not exist. 17
22 The Traffic Engineering accident database is still in it s infancy and does not yet have an adequate number of historical records to develop SPFs for street segments and non-signalized intersections. This is normal as jurisdictions try to develop these SPFs due to the fact that the majority of accidents tend to occur at intersections with higher vehicle volumes associated with traffic signals. As the Town s Traffic Engineering Division collects more accident records and continues to develop these SPFs, locations that seem to stand out as having a high accident rate will be looked into closer to determine if any accident trends are occurring that may indicate an issue that should be further examined. A SPF has been developed for signalized intersections within the Town. This SPF provides an indication of the average number of accidents that are expected at similar signalized intersections. This combined with the actual accident records of each signalized site allows for a more precise safety estimate of each signalized intersection utilizing the EB method. The estimates improve with increased annual records. The following tables are safety summaries of 10 signalized intersections with high accident rates for 2008: Table 1: Intersections with 4-year accident histories Intersection 4-Yr Reported Avg. Expected at Similar Locations 4-Yr Expected At Site Standard Deviation Indication of Possible Intersection Issue? Meadows/Factory Shops No SH 86/Allen Wy No US 85/Meadows Pkwy No SH 86/Front St No Meadows/Prairie Hawk No Table 2: Intersections with 3-year accident histories Intersection 3-Yr Reported Avg. Expected at Similar Locations 3-Yr Expected At Site Standard Deviation Indication of Possible Intersection Issue? SH 86/Crowfoot Valley Yes Wilcox/Wolfensberger No Plum Creek Pkwy/Perry No 18
23 Table 3: Intersections with 2-year accident history Intersection 2-Yr Reported Avg. Expected at Similar Locations 2-Yr Exp. At Site Standard Deviation Indication of Possible Intersection Issue? SH 86/Fifth St Yes Table 4: Intersections with 1-year accident history Intersection 1-Yr Reported Avg. Expected at Similar Locations 1-Yr Exp. At Site Standard Deviation Indication of Possible Intersection Issue? I-25/Meadows Pkwy No The results of the tables above provides an indication that eight out of the ten signalized intersections are experiencing an accident rate that is consistent with signalized intersections that are similar in nature. The two exceptions are: Intersection SH 86 & Crowfoot Valley Dr SH 86 & Fifth St Ownership Agency CDOT CDOT This information will be passed onto the Colorado Department of Transportation for their use along with intersection accident diagrams to allow for further assessment to determine if any improvements may be beneficial. For the remaining intersections, there is no indication that the roadway environment is causing a problem at these locations. This does not mean however that changes in the roadway environment could not increase intersection safety. However, since these accidents are more likely to be related to vehicle or human factors, spending a lot of resources on the roadway environment to try and increase the safety of these intersections would not likely be cost effective. In summary, everyone that utilizes the public roadway system has a responsibility when it comes to reducing the number of accidents. There are agencies that specialize in certain areas such as police enforcement, communications, education, and engineering that through their combined efforts will go a long way toward increasing the safety of the Town s roads. 19
24 DEFINITIONS The following special terms are used throughout this report, and are provided to clarify the meaning of the data. 1. Accident (or traffic accident): An unintended event involving a motor vehicle that causes death, injury, or property damage. 2. Alcohol Involvement Accident: Any motor vehicle accident in which a driver, pedestrian, or bicyclist had consumed alcohol. 3. Fatal Accident: A motor vehicle traffic accident which causes the death of one or more persons. 4. Hit-Other-Vehicle: A type of collision in which the first harmful event involves a collision between two or more vehicles. 5. Injury: A person sustaining injuries as the result of a motor vehicle traffic accident. This includes victims with the extent of injury of severe wound, other visible injury, or compliant of pain. Victims killed are not included in the injury category. 6. Motor Vehicle: Any motorized (mechanically or electrically powered) vehicle not operated on rails. 7. Other Non-collision: An event during an accident sequence which does not involve a collision with another vehicle or object. Examples include but are not limited to collapse of a bridge, passenger inhalation of gas, or fire and/or explosion within a vehicle. 8. Rollover: An accident in which the overturning of a vehicle was the first harmful event. 9. Type of Crash: The category which best describes the general type of collision which was the first event. 20
2007 TOWN OF CASTLE ROCK MOTOR VEHICLE ACCIDENT FACTS
 2007 TOWN OF CASTLE ROCK MOTOR VEHICLE ACCIDENT FACTS 2007 TOWN OF CASTLE ROCK MOTOR VEHICLE ACCIDENT FACTS ACKNOWLEDGEMENTS This report was assembled from data provided by the Castle Rock Police Department
2011 TOWN OF CASTLE ROCK MOTOR VEHICLE ACCIDENT FACTS PREPARED BY THE PUBLIC WORKS DEPARTMENT
 2011 TOWN OF CASTLE ROCK MOTOR VEHICLE ACCIDENT FACTS PREPARED BY THE PUBLIC WORKS DEPARTMENT ACKNOWLEDGEMENTS This report was assembled from data provided by the Castle Rock Police Department accident
2015 Community Report White Rock
 5 White Rock Produced for the New Mexico Department of Transportation, Traffic Safety Division, Traffic Records Bureau, Under Contract 58 by the University of New Mexico, Geospatial and Population Studies,
2016 Community Report Los Alamos County
 6 Los Alamos County Produced for the New Mexico Department of Transportation, Traffic Safety Division, Traffic Records Bureau, Under Contract 58 by the University of New Mexico, Geospatial and Population
2015 Community Report Grants
 5 Grants Produced for the New Mexico Department of Transportation, Traffic Safety Division, Traffic Records Bureau, Under Contract 58 by the University of New Mexico, Geospatial and Population Studies,
2016 Community Report Portales
 6 Portales Produced for the New Mexico Department of Transportation, Traffic Safety Division, Traffic Records Bureau, Under Contract 58 by the University of New Mexico, Geospatial and Population Studies,
2016 Community Report Torrance County
 6 Torrance County Produced for the New Mexico Department of Transportation, Traffic Safety Division, Traffic Records Bureau, Under Contract 58 by the University of New Mexico, Geospatial and Population
2015 Community Report Torrance County
 5 Torrance County Produced for the New Mexico Department of Transportation, Traffic Safety Division, Traffic Records Bureau, Under Contract 58 by the University of New Mexico, Geospatial and Population
2016 Community Report De Baca County
 6 De Baca County Produced for the New Mexico Department of Transportation, Traffic Safety Division, Traffic Records Bureau, Under Contract 58 by the University of New Mexico, Geospatial and Population
2015 Community Report Las Vegas
 5 Las Vegas Produced for the New Mexico Department of Transportation, Traffic Safety Division, Traffic Records Bureau, Under Contract 58 by the University of New Mexico, Geospatial and Population Studies,
2015 Community Report Tularosa
 5 Tularosa Produced for the New Mexico Department of Transportation, Traffic Safety Division, Traffic Records Bureau, Under Contract 58 by the University of New Mexico, Geospatial and Population Studies,
2016 Community Report Santa Fe County
 26 Santa Fe County Produced for the New Mexico Department of Transportation, Traffic Safety Division, Traffic Records Bureau, Under Contract 58 by the University of New Mexico, Geospatial and Population
2014 Community Report Portales
 4 Portales Produced for the New Mexico Department of Transportation, Traffic Safety Division, Traffic Records Bureau, Under Contract 58 by the University of New Mexico, Geospatial and Population Studies,
2016 Community Report San Juan County
 26 San Juan County Produced for the New Mexico Department of Transportation, Traffic Safety Division, Traffic Records Bureau, Under Contract 58 by the University of New Mexico, Geospatial and Population
2015 Community Report San Juan County
 25 San Juan County Produced for the New Mexico Department of Transportation, Traffic Safety Division, Traffic Records Bureau, Under Contract 58 by the University of New Mexico, Geospatial and Population
2015 Community Report Chaparral
 5 Chaparral Produced for the New Mexico Department of Transportation, Traffic Safety Division, Traffic Records Bureau, Under Contract 58 by the University of New Mexico, Geospatial and Population Studies,
2016 Community Report Aztec
 Aztec Produced for the New Mexico Department of Transportation, Traffic Safety Division, Traffic Records Bureau, Under Contract 58 by the University of New Mexico, Geospatial and Population Studies, Traffic
2015 Community Report Aztec
 25 Aztec Produced for the New Mexico Department of Transportation, Traffic Safety Division, Traffic Records Bureau, Under Contract 58 by the University of New Mexico, Geospatial and Population Studies,
2015 Community Report Doña Ana County
 25 Doña Ana County Produced for the New Mexico Department of Transportation, Traffic Safety Division, Traffic Records Bureau, Under Contract 58 by the University of New Mexico, Geospatial and Population
2014 Community Report Luna County
 4 Luna County Produced for the New Mexico Department of Transportation, Traffic Safety Division, Traffic Records Bureau, Under Contract 58 by the University of New Mexico, Geospatial and Population Studies,
2015 Community Report Los Lunas
 25 Los Lunas Produced for the New Mexico Department of Transportation, Traffic Safety Division, Traffic Records Bureau, Under Contract 58 by the University of New Mexico, Geospatial and Population Studies,
2016 Community Report New Mexico
 216 Produced for the Department of Transportation, Traffic Safety Division, Traffic Records Bureau, Under Contract 581 by the University of, Geospatial and Population Studies, Traffic Research Unit Distributed
2014 Community Report Las Vegas
 4 Las Vegas Produced for the New Mexico Department of Transportation, Traffic Safety Division, Traffic Records Bureau, Under Contract 58 by the University of New Mexico, Geospatial and Population Studies,
2014 Community Report Truth or Consequences
 4 Truth or Consequences Produced for the New Mexico Department of Transportation, Traffic Safety Division, Traffic Records Bureau, Under Contract 58 by the University of New Mexico, Geospatial and Population
2014 Community Report Tularosa
 4 Tularosa Produced for the New Mexico Department of Transportation, Traffic Safety Division, Traffic Records Bureau, Under Contract 8 by the University of New Mexico, Geospatial and Population Studies,
2014 Community Report Aztec
 Aztec Produced for the New Mexico Department of Transportation, Traffic Safety Division, Traffic Records Bureau, Under Contract 58 by the University of New Mexico, Geospatial and Population Studies, Traffic
2014 Community Report Los Lunas
 4 Los Lunas Produced for the New Mexico Department of Transportation, Traffic Safety Division, Traffic Records Bureau, Under Contract 58 by the University of New Mexico, Geospatial and Population Studies,
RTCSNV CRASH ANALYSIS REPORT
 2011-2015 RTCSNV CRASH ANALYSIS REPORT TABLE OF CONTENTS Summary... 3 Crash Types... 4 Time and Day of Crashes... 7 Crash Factors... 9 Fatalities... 10 Driver s Behavior... 11 Crash Locations... 15 Non-Motorized
Pedestrians Road Safety
 Pedestrians Road Safety Overview Over the period 1996-2009, 5,323 people have been killed on Irish road. Out of this 22% (1162) were pedestrians. Additional 3863 pedestrians were seriously injured in the
Traffic Safety Network Huron Valley
 June 2018 Revised 8/3/2018 2017 Reporting Criteria Please pay particular attention to the wording when interpreting the three levels of data gathered for this report. Crash The Crash Level analyzes data
Michigan State Police (MSP) Post 21 - Metro North
 Post 21 - Metro North") October 2017 2016 Reporting Criteria Please pay particular attention to the wording when interpreting the three levels of data gathered for this report. Crash The Crash Level analyzes data related to crash
October 2017 2016 Reporting Criteria Please pay particular attention to the wording when interpreting the three levels of data gathered for this report. Crash The Crash Level analyzes data related to crash
Alberta Speeding Convictions and Collisions Involving Unsafe Speed
 Alberta Speeding Convictions and Collisions Involving Unsafe Speed 2004-2008 Overview This document was prepared under the Alberta Traffic Safety Plan, Strategic Research Plan for 2008-2010, with the objective
Michigan State Police (MSP) Post 21 - Metro North
 Post 21 - Metro North") June 2018 Revised 8/3/2018 2017 Reporting Criteria Please pay particular attention to the wording when interpreting the three levels of data gathered for this report. Crash The Crash Level analyzes data
June 2018 Revised 8/3/2018 2017 Reporting Criteria Please pay particular attention to the wording when interpreting the three levels of data gathered for this report. Crash The Crash Level analyzes data
Delaware Information and Analysis Center
 Delaware Information and Analysis Center 2015 DELAWARE THERE WERE 684,731 LICENSED DRIVERS, 892,508 REGISTERED MOTOR VEHICLES, AND 9,761,000,000 VEHICLE MILES DRIVEN*. THERE WERE 24,066 TRAFFIC CRASHES
Traffic Accident Statistics
 2000 Missouri State Highway System Traffic Accident Statistics Missouri State Highway System Traffic Accident Statistics Table of Contents Subject Chapter 1: Statewide Traffic Accident Statistics, Introduction
Pedestrians Road Safety
 Pedestrians Road Safety Overview According to the World Health Organization, the World Bank, the FIA Foundation for the Automobile and Society and the Global Road Safety Partnership collaborative report
Michigan. Traffic. Profile
 June 2014 Revised 5/11/15 Michigan 2013 Traffic Crash Profile Reporting Criteria Please pay particular attention to the wording when interpreting the three levels of data gathered for this report. Crash
Understanding and Identifying Crashes on Curves for Safety Improvement Potential in Illinois
 Understanding and Identifying Crashes on Curves for Safety Improvement Potential in Illinois Priscilla Tobias, P.E. Mouyid Islam, Ph.D. Kim Kolody, P.E. Optional Agenda Image Title Background Workflow
ROADWAY INJURY EXPERIENCE FOR PERSONS WHO HAD BEEN DRINKING AND/OR USING DRUGS
 ROADWAY INJURY EXPERIENCE FOR PERSONS WHO HAD BEEN DRINKING AND/OR USING DRUGS Vehicle Severity Total Crashes involving drinking, not drugs Crashes involving drugs, not drinking Crashes involving drinking
Michigan. Traffic. Profile
 June 2014 Revised 5/11/15 Michigan 2013 Traffic Crash Profile Reporting Criteria Please pay particular attention to the wording when interpreting the three levels of data gathered for this report. Crash
Washtenaw County Traffic Crash Data & Year Trends. Reporting Criteria
 June 2018 Revised 8/3/2018 2017 Reporting Criteria Please pay particular attention to the wording when interpreting the three levels of data gathered for this report. Crash The Crash Level analyzes data
Washtenaw County Traffic Crash Data & Year Trends. Reporting Criteria
 June 2017 Revised 10/3/17 2016 Reporting Criteria Please pay particular attention to the wording when interpreting the three levels of data gathered for this report. Crash The Crash Level analyzes data
Alberta. Collision Facts. 330 people killed. 17,907 people injured. 140,705 collisions.
 Collision Facts 330 people killed 17,907 people injured 140,705 collisions May 2017 www.transportation.alberta.ca/statistics Collision Facts 330 people killed 17,907 people injured 140,705 collisions Monday
TABLE OF CONTENTS CRASHES.. VI TRENDS. VII
 TABLE OF CONTENTS Introduction. I Letter from the Governor II Executive Summary of this Report. III-IV 1998 Nevada Quick Collision Facts V CRASHES.. VI a. Statewide Total Crashes by Severity... 1 b. Statewide
Michigan State Police (MSP) Traffic Safety Network Traverse Bay Area
 Traffic Safety Network Traverse Bay Area") June 2016 Revised 2/15/2017 2015 Reporting Criteria Please pay particular attention to the wording when interpreting the three levels of data gathered for this report. Crash The Crash Level analyzes data
June 2016 Revised 2/15/2017 2015 Reporting Criteria Please pay particular attention to the wording when interpreting the three levels of data gathered for this report. Crash The Crash Level analyzes data
Collision Analysis Safety Tables
 Crash Severity Geography of Geography of Time and Date of Crash Conditions Features Features.. Queries Selected: Town(Hartford), Date(Year:All or //05 to 9/7/06), Severity(All), Route Class(Interstate),
1999 Missouri State Highway System. Missouri Department of Transportation - Transportation Management Systems
 1999 Missouri State Highway System Traffic Accident Statistics - Transportation Management Systems Missouri State Highway System Traffic Accident Statistics Table of Contents Subject Chapter 1: Statewide
Gallup Community Report, 2007
 Gallup Community Report, 7 Demographics In 7, there were,8 licensed drivers in Gallup. Of these, there were 7,9 females and 7,9 males. The population of Gallup was 8,8. The total number of crashes in 7
Department of Highway Safety and Motor Vehicles
 Department of Highway Safety and Motor Vehicles Traffic Report 2005 A Compilation of Motor Vehicle Crash Data from the Florida Crash Records Database Fred O. Dickinson Executive Director Our Mission: Making
ITSMR Research Note. Motorcyclists and Impaired Driving ABSTRACT INTRODUCTION KEY FINDINGS. September 2013
 September 2013 KEY FINDINGS F&PI CRASHES INVOLVING IMPAIRED MOTORCYCLISTS 27% of the fatal MC crashes over the five year period, 2008-2012, were alcohol-related. 48% of the alcohol-related F&PI MC crashes
Florida Strategic Highway Safety Planning Florida Strategic Highway Safety Plan (SHSP) Update and Performance Overview
 Update and Performance Overview") Session 1 Florida Strategic Highway Safety Planning Florida Strategic Highway Safety Plan (SHSP) Update and Performance Overview Joe Santos, PE, FDOT, State Safety Office October, 23, 2013 Florida Statistics
Session 1 Florida Strategic Highway Safety Planning Florida Strategic Highway Safety Plan (SHSP) Update and Performance Overview Joe Santos, PE, FDOT, State Safety Office October, 23, 2013 Florida Statistics
1 of 7 9/22/2015 1:20 PM
 1 of 7 9/22/2015 1:20 PM Demographics In 2009, there were 27,245 licensed drivers in Alamogordo. Of these, there were 13,674 females and 13,571 males. The population of Alamogordo was 35,984. The total
 1 of 7 9/23/2015 5:23 PM Demographics In 2008, there were 12,286 licensed drivers in Socorro County. Of these, there were 5,872 females and 6,414 males. The population of Socorro County was 18,180. The
Preliminary 2014 Ontario Road Safety Annual Report Selected Statistics
 Selected Statistics The following tables were created using the preliminary fatality and injury data from the 2014 Ontario Collision Database. Final numbers will vary. Produced by: Road Safety Research
1 of 6 9/23/2015 4:35 PM
 1 of 6 9/23/2015 4:35 PM Demographics In 2008, there were 60,539 licensed drivers in Rio Rancho. Of these, there were 30,884 females and 29,655 males. The population of Rio Rancho was 79,651. The total
Regional Safety Study
 BOONSLICK REGIONAL PLANNING COMMISSION Regional Safety Study PART I: General Crash Data and Trends SPRING 2012 BRPC REGIONAL SAFETY STUDY: PART 1 ~ GENERAL CRASH DATA & TRENDS 1 TABLE OF CONTENTS REPORT
Van Buren County Traffic Crash Data & Year Trends. Reporting Criteria
 May 2015 Revised 3/16/2016 2014 Reporting Criteria Please pay particular attention to the wording when interpreting the three levels of data gathered for this report. Crash The Crash Level analyzes data
Provisional Review of Fatal Collisions. January to December 31 st 2017
 Provisional Review of Fatal Collisions January to December 31 st 17 2 nd January 18 Review of 17 fatal collision statistics as of 31st December 17 Overview This report summarises the main trends in road
Missouri Seat Belt Usage Survey for 2017
 Missouri Seat Belt Usage Survey for 2017 Conducted for the Highway Safety & Traffic Division of the Missouri Department of Transportation by The Missouri Safety Center University of Central Missouri Final
Where are the Increases in Motorcycle Rider Fatalities?
 Where are the Increases in Motorcycle Rider Fatalities? Umesh Shankar Mathematical Analysis Division (NPO-121) Office of Traffic Records and Analysis National Center for Statistics and Analysis National
LOADING AND UNLOADING SURVEY NATIONAL SCHOOL BUS. Kansas leads the world in the success of each student.
 NATIONAL SCHOOL BUS LOADING AND UNLOADING SURVEY Kansas leads the world in the success of each student. January 2018 The Kansas State Department of Education School Bus Safety Unit wishes to thank the
Austin Police Department. An Analysis of Traffic Fatalities 2015
 Austin Police Department An Analysis of Traffic Fatalities Prepared by the Austin Police Department Research and Planning Unit April Table of Contents Background... Overview... Terminology... Notes about
 1 of 7 9/23/2015 5:20 PM Demographics In 2008, there were 91,559 licensed drivers in Sandoval County. Of these, there were 46,678 females and 44,881 males. The population of Sandoval County was 122,298.
Doña Ana County Report, 2001
 Doña Ana County Report, 1 Demographics In 1, there were 7,7 licensed drivers in Doña Ana County. Of these, there were 17,15 females and,115 males. The population in Doña Ana County was 87,1. The total
Demographics An updated licensed driver count is not available for Navajo Nation for The total number of crashes in 2008 was 95.
 1 of 6 9/23/2015 4:57 PM Demographics An updated licensed driver count is not available for Navajo Nation for 2008. The total number of crashes in 2008 was 95. General Crash Information From 1999 to 2008
Enhancing School Bus Safety and Pupil Transportation Safety
 For Release on August 26, 2002 (9:00 am EDST) Enhancing School Bus Safety and Pupil Transportation Safety School bus safety and pupil transportation safety involve two similar, but different, concepts.
Kent County Traffic Crash Data & Year Trends. Reporting Criteria
 May 2015 Revised 3/16/2016 2014 Reporting Criteria Please pay particular attention to the wording when interpreting the three levels of data gathered for this report. Crash The Crash Level analyzes data
ALCOHOL AND WYOMING TRAFFIC CRASHES
 AND WYOMING TRAFFIC -2007- 2002-2007 SUMMARY COMPARISON FOR WYOMING TRAFFIC YEAR OF 2002 2003 2004 2005 2006 2007 ALL FATAL 151 141 142 147 169 136 FATAL 53 43 50 51 58* 46* PERCENT [%] 35.0% 30.5% 35.2%
Analysis of Road Crash Statistics Western Australia 1990 to Report. December Project: Transport/21
 Analysis of Road Crash Statistics Western Australia 1990 to 1999 Report December 2000 Project: Transport/21 Analysis of Road Crash Statistics Western Australia 1990 to 1999 December 2000 Client: Transport
National Center for Statistics and Analysis Research and Development
 U.S. Department of Transportation National Highway Traffic Safety Administration DOT HS 809 360 October 2001 Technical Report Published By: National Center for Statistics and Analysis Research and Development
Rio Arriba County Report, 2007
 Rio Arriba County Report, 7 Demographics In 7, there were 3,748 licensed drivers in Rio Arriba County. Of these, there were,68 females and,63 males. The population in Rio Arriba County was 4,87. The total
Rio Arriba County Report, 2002
 Rio Arriba County Report, Demographics In, there were,8 licensed drivers in Rio Arriba County. Of these, there were 8,8 females and 8,8 males. The population in Rio Arriba County was,9. The total number
NEW JERSEY LAW ENFORCEMENT LIAISON NEWSLETTER
 NEW JERSEY LAW ENFORCEMENT LIAISON NEWSLETTER JUNE 2018/21 WWW..ORG NJ DIVISION OF HIGHWAY TRAFFIC SAFETY DRIVE SOBER OR GET PULLED OVER 2018 MOBILIZATION The mission of the Division of The Drive Sober
Fatal Motor Vehicle Crashes on Indian Reservations
 April 2004 DOT HS 809 727 Fatal Motor Vehicle Crashes on Indian Reservations 1975-2002 Technical Report Colleges & Universities 2% Other Federal Properties 9% Other 4% Indian Reservations 65% National
file:///n:/students/maurreen/for Website/reports/Community/comm_10/...
 1 of 7 4/27/2015 11:28 AM Demographics In 2010, there were 12,013 licensed drivers in Aztec. Of these, there were 6,040 females and 5,973 males. The population of Aztec was 6,763. The total number of crashes
Driving Safely in Maryland
 Maryland Department of Transportation State Highway Administration Office of Traffic and Safety Driving Safely in Maryland In 2008, there were 141 fatal speeding crashes, accounting for 28% of all fatal
Young drivers. Drivers involved in fatal or injury crashes. Drivers involved in fatal/injury crashes per 100. per licence holders (lines)
") Young drivers CRASH FACTSHEET 2012 CRASH STATISTICS FOR THE YEAR ENDED 31 DECEMBER 2011 Prepared by the Ministry of Transport In 2011 young drivers aged 15 24 were involved in 80 fatal traffic crashes,
Young drivers CRASH FACTSHEET 2012 CRASH STATISTICS FOR THE YEAR ENDED 31 DECEMBER 2011 Prepared by the Ministry of Transport In 2011 young drivers aged 15 24 were involved in 80 fatal traffic crashes,
USE RESTRICTED 23 USC 409
 Study Map & Totals Legend Fatality Injury Property Damage Remarks: NONE Date Range: 01-01-2010 thru 12-31-2014 2010 2011 2012 Fat Incap Inj Non-Incap Inj Poss Inj PD Tot Fat Incap Inj Non-Incap Inj Poss
Los Lunas Community Report, 2002
 Los Lunas Community Report, Demographics In, there were, licensed drivers in Los Lunas. Of these, there were, females and, males. The population of Los Lunas was,. The total number of crashes in was, yielding
the Ministry of Transport is attributed as the source of the material
 Young Drivers 2016 Disclaimer All reasonable endeavours are made to ensure the accuracy of the information in this report. However, the information is provided without warranties of any kind including
TABLE OF CONTENTS CRASHES.. VI TRENDS. VII
 NEVADA TRAFFIC CRASHES 2002 G R E AT S E A L O F T H E S TAT E T H E O F ALL FOR OUR COUNTRY N E V A D A PREPARED BY THE NEVADA DEPARTMENT OF TRANSPORTATION SAFETY/TRAFFIC ENGINEERING DIVISION IN COOPERATION
National Household Travel Survey Add-On Use in the Des Moines, Iowa, Metropolitan Area
 National Household Travel Survey Add-On Use in the Des Moines, Iowa, Metropolitan Area Presentation to the Transportation Research Board s National Household Travel Survey Conference: Data for Understanding
WIM #37 was operational for the entire month of September Volume was computed using all monthly data.
 SEPTEMBER 2016 WIM Site Location WIM #37 is located on I-94 near Otsego in Wright county. The WIM is located only on the westbound (WB) side of I-94, meaning that all data mentioned in this report pertains
ANNUAL CRASH REPORT for the Cheyenne Urban Area
 2016 ANNUAL CRASH REPORT for the Cheyenne Urban Area 2016 ANNUAL CRASH REPORT FOR THE CHEYENNE URBAN AREA July 2017 The purpose of this report is to disseminate yearly crash information for the Cheyenne
SEGMENT 2 DRIVER EDUCATION Risk Awareness
 Fact Sheet 1 Why Should Young Drivers Be Concerned? Risk is the chance of death, injury, damage, or loss. Approximately 1 out of 11 (9%) of 16-year-old drivers will have a serious crash before his/her
2016 Kansas Traffic Crash Facts. Definitions
 Definitions SPECIAL NOTE: Prior to 2005, the minimum criteria for reporting motor vehicle crashes for statistical purposes in Kansas were a non-injury crash occurring on or from a public roadway with over
Speed Limit and Safety Nexus Studies for Automated Enforcement Locations in the District of Columbia 400 Block 14th Street SW
 Speed Limit and Safety Nexus Studies for Automated Enforcement Locations in the District of Columbia 4 Block 4th Street SW Study Area and Location District PSA Ward ANC Phase Description 27 6 6D Existing
Alcohol Related Accidents in Mahoning County:
 Alcohol Related Accidents in Mahoning County: 2013-2015 Alcohol Related Accidents in Mahoning County: 2013-2015 Each year the Eastgate Regional Council of Governments collects crash data from the Ohio
Study Area and Location District PSA Ward ANC Phase Description A Proposed Monroe Street Northeast Eastbound at Rhode Island Avenue
 Speed Limit and Safety Nexus Studies for Automated Enforcement Locations in the District of Columbia Monroe Street NE and Rhode Island Avenue NE Study Area and Location District PSA Ward ANC Phase Description
USE RESTRICTED 23 USC 409
 Created: 06/29/2018 by Lora Koetsier Study Map & Totals Legend Fatality Injury Property Damage Remarks: REQUEST FROM SHELBY TEMPLIN IN SAPM ON 29 JUNE 2018 Date Range: 10-03-2012 thru 10-02-2017 2012 2013
SPATIAL AND TEMPORAL PATTERNS OF FATIGUE RELATED CRASHES IN HAWAII
 SPATIAL AND TEMPORAL PATTERNS OF FATIGUE RELATED CRASHES IN HAWAII By Karl E. Kim Eric Y. Yamashita Hawaii CODES Project Traffic Records Forum July 29 - August 2, 2001 New Orleans, Louisiana Overview Background
Objectives. Understand defensive driving techniques. Increase awareness of safe driving behaviors
 Defensive Driving Objectives Understand defensive driving techniques Increase awareness of safe driving behaviors Provide insight into identifying and anticipating hazards encountered while driving Why
USE RESTRICTED 23 USC 409
 Created: 04/29/2016 by Randy Woods Study Map & Totals Legend Fatality Injury Property Damage Remarks: NONE Date Range: 01-01-2006 thru 12-31-2015 2006 2007 2008 Fat Incap Inj Non-Incap Inj Poss Inj PD
Figure 15. Yearly Trend in Death Rates for Motor Vehicle Transport: NSW, Year
 6.0 MOTOR VEHICLE TRANSPORT 6.1 Deaths due to Motor Vehicle Transport: The motor vehicle transport (MV) death rate showed a statistically significant decrease overall between 1989 and 1999 although the
the Ministry of Transport is attributed as the source of the material images contained in the material are not copied
 Speed 2017 Disclaimer All reasonable endeavours are made to ensure the accuracy of the information in this report. However, the information is provided without warranties of any kind including accuracy,
Motorcycle Safety A Single Point of Truth
 Motorcycle Safety A Single Point of Truth Bringing together motorcycle safety information from the different data sources into one document Data sources include ACC, Ministry of Transport, NZ Transport
Speed Limit and Safety Nexus Studies for Automated Enforcement Locations in the District of Columbia 3rd Street Tunnel at Massachusetts Avenue Exit
 Speed Limit and Safety Nexus Studies for Automated Enforcement Locations in the District of Columbia 3rd Street Tunnel at Massachusetts Avenue Exit Study Area and Location District PSA Ward ANC Phase Description
TRAFFIC SAFETY FACTS. Overview Data
 TRAFFIC SAFETY FACTS 2009 Data Overview Motor vehicle travel is the primary means of transportation in the United States, providing an unprecedented degree of mobility. Yet for all its advantages, injuries
Utah Fatal Crash Summary 2014
 Utah Fatal Crash Summary 1 State of Utah Department of Public Safety Highway Safety Office W Amelia Earhart Dr # Salt Lake City, UT 8116 81-366-6 www.highwaysafety.utah.gov Preliminary Totals as of 1/29/
University of Central Florida Police Department. Traffic Statistical Report
 University of Central Florida Police Department Traffic Statistical Report 214-216 Richard Beary, Chief of Police Report completed January 11, 216 The University of Central Florida, home to the UCF Knights,