Assessment of current status of water resources in the Niemen River Basin
|
|
|
- Edwin Foster
- 6 years ago
- Views:
Transcription


1 United Nations conomic Commission for urope LITHUANIA NVIRONMNTAL PROTCTION AGNCY Project # «Management of the Neman basin with account of adaptation to climate change» Assessment of current status of water resources in the Niemen Basin Report on milestone 1 April 2012
2 Table of Contents xecutive Summary Meteorological and hydrological data collection Temperature and precipitation Runoff Statistical analysis and evaluation of changes of meteorological and hydrological characteristics Temperature and precipitation Runoff xamples of the Niemen Basin water resources current status mapping Conclusion
3 xecutive Summary This report was prepared by the group of experts including Vladimir Korneev (Central Research Institute for Complex Use of Water Resources (CRICUWR), Minsk, Belarus), gidijus Rimkus (Vilnius University, Lithuania); dvinas Stonevicius (Vilnius University, Lithuania); Aliaksandr Volchak (Brest State Technical University, Brest, Belarus); Lubov Hertman, Ivan Bulak and Aliaksandr Pakhomau (CRICUWR, Minsk, Belarus). The next activities were made in the frame of the ToR (Milestone 1): Activities on preparation of current status report about water resources in the Niemen Basin includes * : Meteorological and hydrological data collection and quality analysis (data from 1961 to 2010); Statistical analysis and evaluation of changes of meteorological and hydrological characteristics; Preparation a draft version of basin-wide maps series regarding evaluation of changes in meteorological and hydrological regime in the river basin from 1961 to Participation in the Third Workshop on Water and Adaptation to Climate Change (25-26 April 2012, Geneva, Switzerland) and in the Fifth Meeting of the Task Force on Water and Climate of the Convention of the Protection and Use of Transboundary Watercourses and International Lakes (27 April 2012, Geneva, Switzerland) including: Presentation of main results of research on the current status of the Niemen Basin; Participation in the Lunch time Session Information on the UNC Water Convention with short intervention of 5-7 minutes on why Belarus has ratified the Water Convention, what have been the consequences, what are the advantages of being a Party to the Convention (at the national level, in the bilateral and multilateral cooperation, etc) as well as what are the main challenges; Participation in the Niemen Pilot Project Team Workshop together with representatives from UNC and nvsec; Interview about progress of the Niemen Pilot Project and about other projects and activities in the frame of UNDP and nvsec in Belarus to the valuation Team: Dr. Stephen Webber and Ms Pamela White (Finnish Consulting Group, commissioned by MFA Finland to conduct a Mid-Term valuation of all components of the Wider urope Initiative implemented by MFA Finland, including coverage of the NVSC and FinWaterWI activities); 3
: Additional information necessary")
4 1. Meteorological and hydrological data collection The next detailed data were collected (monthly) and pre-proceeded with calculation of seasonal, annual values (data from 1961 to 2010); 1.1. Temperature and precipitation Data from 23 stations due to statistical validity of data: 8 stations in Belarus, 15 stations in Lithuania (see picture 1, tables 1,2): Additional information necessary for hydrological modeling was also collected including wind speed, humidity, sunshine duration Picture 1 Meteorological observation network in the Niemen Basin used for the analysis of current status 4
5 Table 1 xample of the meteorological data and theirs pre-proceeding: Temperature (Baranovichy meteorological station) Year t1 t2 t3 t4 t5 t6 t7 t8 t9 t10 t11 t12 tgod Winter Spring Summer Autumn
6 Year t1 t2 t3 t4 t5 t6 t7 t8 t9 t10 t11 t12 tgod Winter Spring Summer Autumn Table 2 xample of the meteorological data and theirs pre-proceeding: Precipitation (Baranovichy meteorological station) Psum/ Year P1 P2 P3 P4 P5 P6 P7 P8 P9 P10 P11 P12 Winter Spring Summer year Autumn

7 Year P1 P2 P3 P4 P5 P6 P7 P8 P9 P10 P11 P12 Psum/ year Winter Spring Summer Autumn Runoff Data from 25 stations due to statistical validity of data: 12 stations in Belarus, 13 stations in Lithuania (see picture 2, table 3): Picture 2 Hydrological observation network in the Niemen Basin and sub basins of the rivers used for the analysis of current status 7
8 Table 3 xample of the hydrological data and theirs pre-proceeding: water discharges (Grodno hydrological station) Year Average annual water discharge Water discharge Q(m 3 /s) Minimum water discharge summerautumn (VI-XI Minimum water discharge winter (XII,I,II Maximum water discharges spring-flood Average annual water discharge Discharge Per Unit Catchment Area, l/s/km 2 Minimum Minimum water discharge water discharge summerautumn (VI-XI winter (XII,I,II Maximum water discharges springflood
9 Year Average annual water discharge Water discharge Q(m 3 /s) Minimum water discharge summerautumn (VI-XI Minimum water discharge winter (XII,I,II Maximum water discharges spring-flood Average annual water discharge Discharge Per Unit Catchment Area, l/s/km 2 Minimum Minimum water discharge water discharge summerautumn (VI-XI winter (XII,I,II Maximum water discharges springflood Average ( ) Difference, % Probability of Student distribution
10 2. Statistical analysis and evaluation of changes of meteorological and hydrological characteristics Statistical analysis and evaluation of changes of meteorological and hydrological characteristics was made with the purposes of changes of meteorological and hydrological characteristics definition. Aggregated results of statistical analysis are presented in tables 4-6 and in pictures Temperature and precipitation Table 4 - Aggregated results of statistical analysis of changes of meteorological characteristics in the Niemen Basin Name of station Temperature Position # in the Average temperature ( ) national Latitude Longitude Register Winter Spring Summetumn Au- Annual 10 Temperature change ( C)( minus ) Winter Spring Summer Autumn Annual Baranovichi 53 07' 54'' 25 58' 16'' Grodno 53 36' 13'' 24 02' 39'' Volkovyssk 53 08' 05'' 24 27' 34'' Lida 53 54' 25'' 25 19' 24'' Novogrudok 53 35' 48'' 25 51' 04'' Vileika 54 30' 25'' 26 59' 23'' Volozhin 54 05' 42'' 26 30' 56'' Naroch 54 53' 52'' 26 40' 56'' Kaunas 54 53' 23 50' Kybartai 54 38' 22 47' Laukuva 55 37' 22 14' Lazdijai 54 14' 23 31' Panevėžys 55 45' 24 23' Raseiniai 55 23' 23 07' Šilutė 55 21' 21 28' Ukmergė 55 15' 24 46' Utena 55 32' 25 36' Varėna 54 15' 24 33' Vilnius 54 38' 25 06' ADDITIONAL STATIONS Biržai 56 12' 24 46' Klaipėda 55 44' 21 04' Šiauliai 55 56' 23 19' Telšiai 55 58' 22 15' PRCIPITATION Name of station Latitude Longitude # in the national Register Average precipitation sum ( ) Winter Spring Summer Autumn Annual Precipitation change (%)( / ) Winter Spring Summer Autumn Baranovichi 53 07' 54'' 25 58' 16'' Grodno 53 36' 13'' 24 02' 39'' Volkovyssk 53 08' 05'' 24 27' 34'' Lida 53 54' 25'' 25 19' 24'' Novogrudok 53 35' 48'' 25 51' 04'' Vileika 54 30' 25'' 26 59' 23'' Annual
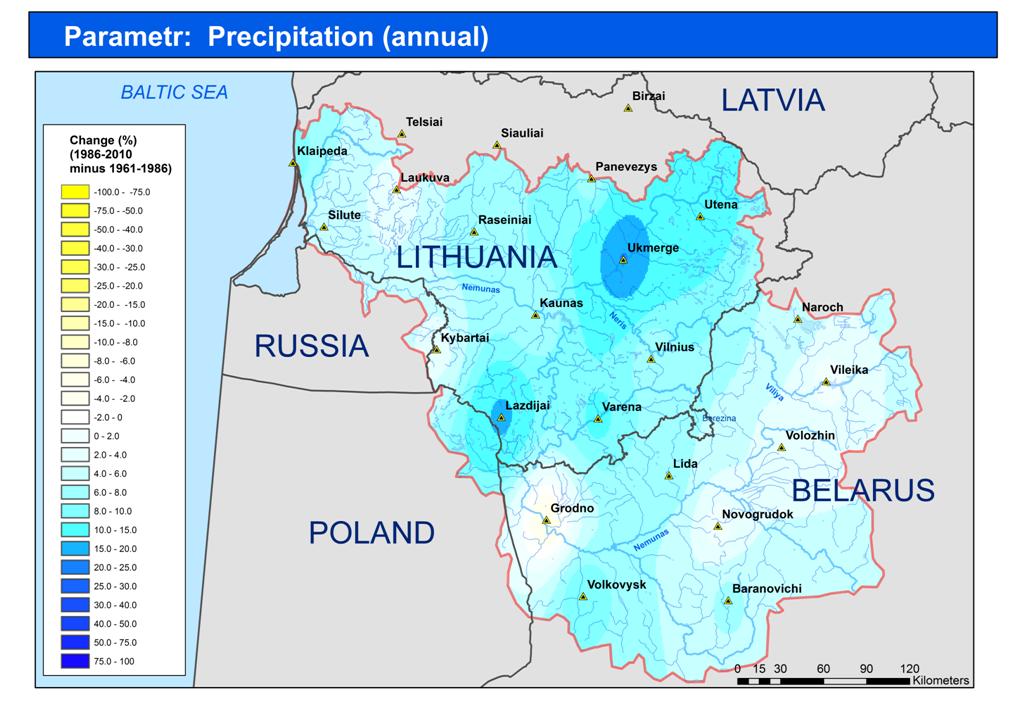
11 Volozhin 54 05' 42'' 26 30' 56'' Naroch 54 53' 52'' 26 40' 56'' Kaunas 54 53' 23 50' Kybartai 54 38' 22 47' Laukuva 55 37' 22 14' Lazdijai 54 14' 23 31' Panevėžys 55 45' 24 23' Raseiniai 55 23' 23 07' Šilutė 55 21' 21 28' Ukmergė 55 15' 24 46' Utena 55 32' 25 36' Varėna 54 15' 24 33' Vilnius 54 38' 25 06' ADDITIONAL STATIONS Biržai 56 12' 24 46' Klaipėda 55 44' 21 04' Šiauliai 55 56' 23 19' Telšiai 55 58' 22 15' Assessment of the change of temperature ( 0 C) in the Niemen Basin ( ) - ( ): on average C 2.4 Months (difference, 0 C) Months (difference, %) January February 2.0 March 1.3 April 1.2 May June July Picture August 0.9 September 0.2 October 0.1 November Assessment of the change of precipitation (%) in the Niemen Basin ( ) - ( ): on average +6.98% December January February March April -6.5 May June July Picture 4 August September October November -7.0 December 11
12 2.2. Runoff Table 5 - Aggregated results of statistical analysis of changes of hydrological characteristics in the Niemen Basin Discharge per Unit averages ( ) ( ) ( ) Differences (%) Name of the water body Name of station Latitude Longitude Catchment area, km 2 Average annual water discharge Minimum water discharge summer-autumn (VI-XI Minimum water discharge winter (XII,I,II Maximum water discharges spring-flood Average annual water discharge Minimum water discharge summer-autumn (VI-XI Minimum water discharge winter (XII,I,II Maximum water discharges spring-flood Neman Stolbtsy 26 42' 56" 53 28' 43" Neman Mosty 24 32' 10" 53 24' 11" Neman Grodno 23 48' 23" 53 40' 43" Isloch Borovikovshina 26 44' 16" 53 57' 26" Gavya Lubiniata 25 38' 40" 53 59' 26" Schara Slonim 25 19' 37" 53 04' 56" Svisloch Sukhaya 24 01' 33" 53 28' 04" Dolina Vilija Steshytsy 27 23' 39" 54 33' 50" Vilija Mikhalishki 26 09' 59" 54 48' 50" Naroch Naroch 26 43' 33" 54 33' 24" Oshmyanka Bolshiye Yatsiny 26 12' 57" 54 44' 27" Dubysa Lyduvenai 23 5' 14.1" 55 30' 23.1" Jūra Taurage 22 16' 45" 55 15' 4.0" Merkys Puvociai 24 18' 12" 54 7' 4.3" Šešupė K. Naujamestis 22 51' 49.2" 54 46' 37.5" Minija Kartena 21 28' 48.2" 55 54' 59.2" Šventoji Anykščiai 25 5' 52.7" 55 31' 29.9" Šventoji Ukmerge 24 46' 8.0" 55 14' 48.0" Žeimena Pabrade 25 46' 21.0" 54 59' 1.7" Nemunas Druskininkai 23 58' 48.7" 54 1' 9.4" Nemunas Nemajūnai 24 4' 26.3" 54 33' 14.8" Nemunas Smalininkai 22 35' 15.6" 55 4' 22.3" Neris Vilnius 25 16' 36.5" 54 41' 31.1" Neris Jonava 24 16' 54.9" 55 4' 10.2" Average
13 Table 6- Aggregated results of statistical analysis of changes of hydrological characteristics in the Niemen Basin (monthly change) Name of the water body Name of station Latitude Longitude Catchment area, km 2 January February March April ( ) - ( ) Months (difference (%)) Neman Stolbtsy 26 42' 56" 53 28' 43" Neman Neman Isloch Gavya Schara Svisloch Vilija Vilija Vilija Naroch Oshmya nka Dubysa Jūra Merkys Šešupė Minija Mosty Grodno Slonim Vileika Naroch Bolshiye Yatsiny Borovikovshina Lubiniata Sukhaya Dolina Steshytsy Mikhalishki Lyduvenai Taurage Puvociai Kartena Žeimena Pabrade Neris Neris K. Naujamestis Šventoji Anykščiai Šventoji Ukmerge Nemunas Nemunas Nemunas Druskininkai Nemajūnai Smalininkai Vilnius Jonava 24 32' 10" 23 48' 23" 26 44' 16" 25 38' 40" 25 19' 37" 24 01' 33" 27 23' 39" 26 55' 26" 26 09' 59" 26 43' 33" 26 12' 57" 23 5' 14.1" 22 16' 45.0" 24 18' 12.0" 22 51' 49.2" 21 28' 48.2" 25 5' 52.7" 24 46' 8.0" 25 46' 21.0" 23 58' 48.7" 24 4' 26.3" 22 35' 15.6" 25 16' 36.5" 24 16' 54.9" May June July August September October November ' 11" ' 43" ' 26" ' 26" ' 56" ' 04" ' 50" ' 45" ' 50" ' 24" ' 27" ' 23.1" 55 15' 4.0" December ' 4.3" ' 37.5" 55 54' 59.2" 55 31' 29.9" 55 14' 48.0" 54 59' 1.7" ' 9.4" ' 14.8" 55 4' 22.3" 54 41' 31.1" 55 4' 10.2" Average
 30")
14 Assessment of the change of runoff (%) in the Niemen Basin ( ) - ( ): average annual +2.7%; minimum (summer-autumn) +7.2%; minimum (winter) +17.5%; maximum (spring) -27.4% 44.2 Months (difference, %) January February March April May June July August September October November December Picture xamples of the Niemen Basin water resources current status mapping A series of the basin-wide maps (draft version) regarding evaluation of changes in meteorological and hydrological regime in the river basin from 1961 to 2010 was prepared. Total amount of maps is 28 including 11 meteorological maps and 17 hydrological (see examples of maps on the pictures 6-8). Picture 6 14

15 Picture 7 Picture 8 15
16 Conclusion Main results of research on the current status of the Niemen Basin was presented and approved in the Third Workshop on Water and Adaptation to Climate Change (25-26 April 2012, Geneva, Switzerland) and in the Fifth Meeting of the Task Force on Water and Climate of the Convention of the Protection and Use of Transboundary Watercourses and International Lakes (27 April 2012, Geneva, Switzerland); Detected changes of meteorological and hydrological characteristics (the main tendencies and trends): Statistically significant increase in annual, winter and summer temperature (largest changes were observed in January); Statistically significant increase in winter precipitation; Maximum spring flood discharge decreased and the minimum winter flow increased statistically significant in large part of territory Peak of spring flood and the dates of minimum winter flow tends occur earlier in the whole basin area. Most surprising finding in assessment of current status and in vulnerability assessment of the Niemen Basin - considerable variation of an meteorological and hydrological characteristics change in year-scale from 1961 on at temperature increase on the average on 1 0 С from 1961 on 2010 meteorological and hydrological characteristics are both increasing or decreasing in some months year. Most important lesson from the assessment of current status - common approach (Belarus- Lithuania) on meteorological and hydrological data pre-proceeding, statistical analysis and elaboration of meteorological and hydrological characteristics changes trends. 16
3. Atmospheric Supply of Nitrogen to the Baltic Sea in 2009
 3. Atmospheric Supply of Nitrogen to the Baltic Sea in 2009 Nitrogen emission data, as well as the model results presented here have been approved by the 35 th Session of the Steering Body of EMEP in Geneva
Action Requested From AMWG
 Action Requested From AMWG NONE, These Two Presentations Are For Information Transfer Only The information is derived from a multi-year synthesis research effort related to existing data on flow, sediment-transport
2019 Western North Carolina Weather Calendar. Department of Atmospheric Sciences The University of North Carolina at Asheville
 209 Western North Carolina Weather Calendar Department of Atmospheric Sciences The University of North Carolina at Asheville www.atms.unca.edu 209 Western North Carolina Weather Calendar Climatological
TRANSMISSION GRID - TO EMPOWER BUSINESS GROWTH AND WELFARE OF THE SOCIETY
 TRANSMISSION GRID - TO EMPOWER BUSINESS GROWTH AND WELFARE OF THE SOCIETY October 18, 2016 Karolis Sankovski Director of Strategic Infrastructure Department PRESENT: LESSONS LEARNED AND NEW ACHIEVEMENTS
Determination of Monthly Means of Daily Solar Radiation and its Variability: A Summary (continued)
") Introduction Section 5.3 MONTHLY MEANS OF DAILY SOLAR RADIATION AND ITS VARIABILITY R.E. Schulze, M. Maharaj and R.D. Chapman The maps and statistics of solar radiation in this Section supersede the ones
Introduction Section 5.3 MONTHLY MEANS OF DAILY SOLAR RADIATION AND ITS VARIABILITY R.E. Schulze, M. Maharaj and R.D. Chapman The maps and statistics of solar radiation in this Section supersede the ones
BEFORE THE CANTERBURY REGIONAL COUNCIL. Act 1991 AND. of Plan Change 3 to the Waitaki Catchment Water Allocation Regional Plan
 BEFORE THE CANTERBURY REGIONAL COUNCIL IN THE MATTER of the Resource Management Act 1991 AND IN THE MATTER of Change 3 to the Waitaki Catchment Water Allocation Regional STATEMENT OF EVIDENCE OF DAVID
Inventory Levels - All Prices. Inventory Levels - By Price Range
 Inventory Levels - All Prices Idaho Falls Bonneville Total 3-Mar-17 152 108 260 2-Mar-18 109 78 187-28% Inventory Levels - By Price Range 3-Mar-17 2-Mar-18 0-100,000 41 6 100,001-125,000 19 8 125,001-150,000
Inventory Levels - All Prices. Inventory Levels - By Price Range
 Inventory Levels - All Prices Idaho Falls Bonneville Total 7-Apr-17 154 111 265 6-Apr-18 113 91 204-23% Inventory Levels - By Price Range 7-Apr-17 6-Apr-18 0-100,000 36 10 100,001-125,000 13 9 125,001-150,000
Inventory Levels - All Prices. Inventory Levels - By Price Range
 Inventory Levels - All Prices Idaho Falls Bonneville Total 3-Nov-17 198 128 326 2-Nov-18 155 134 289-11% Inventory Levels - By Price Range 3-Nov-17 2-Nov-18 0-100,000 17 11 100,001-125,000 15 9 125,001-150,000
Thirty Years of Climatological Data: 1969 to 1998
 Thirty Years of Climatological Data: 1969 to 1998 NMSU's Agricultural Science Center at Farmington, New Mexico Agricultural Experiment Station Research Report 744 College of Agriculture and Home Economics
PET(S) FIRST & LAST NAME: January 2019
 FIRST & LAST NAME: January 2019") January 2019 1 2 3 4 5 New Year's Day 6 7 8 9 10 11 12 13 14 15 16 17 18 19 20 21 22 23 24 25 26 27 28 29 30 31 SPECIAL TE We will not have Doggie available during these dates: *3/29-4/7, 4/19-4/21, 5/24-5/27,
January 2019 1 2 3 4 5 New Year's Day 6 7 8 9 10 11 12 13 14 15 16 17 18 19 20 21 22 23 24 25 26 27 28 29 30 31 SPECIAL TE We will not have Doggie available during these dates: *3/29-4/7, 4/19-4/21, 5/24-5/27,
Appendix E Water Supply Modeling
 Supply Modeling Modesto Irrigation District Treatment Plant Expansion Project Modeling I. Introduction The Modesto Irrigation District (MID) is situated adjacent to and north of the Tuolumne River. Over
Greenbush School Maintenance Calendar
 Greenbush School Maintenance Calendar JULY Check clock systems Fertilize athletic fields Drag and roll baseball/softball fields Clean carpet in all buildings Annual cleaning at Board office Drag and roll
Solar Power. Demonstration Site. Annual Performance Report 2017
 Solar Power Demonstration Site Annual Performance Report 217 Version :1. July 12, 218 Solar Power Demonstration Site 217 Performance Report Introduction INTRODUCTION The Solar Power Demonstration Site
Appendix E Hydrology, Erosion and Sediment Transport Studies
 Appendix E Hydrology, Erosion and Sediment Transport Studies Hatch 2012/10 Appendix E1 EA Hydrology Memorandum February 2011 (Hatch. 2011a) Hatch 2012/10 Project Memo February 23, 2011 TO: Larry King FROM:
2020 GLOBAL SULPHUR LIMIT HISTORY, CURRENT STATUS, AND THE INTERNATIONAL MARITIME ORGANIZATION S (IMO S) WORK PLAN FOR EFFECTIVE IMPLEMENTATION
 WORK PLAN FOR EFFECTIVE IMPLEMENTATION") 2020 GLOBAL SULPHUR LIMIT HISTORY, CURRENT STATUS, AND THE INTERNATIONAL MARITIME ORGANIZATION S (IMO S) WORK PLAN FOR EFFECTIVE IMPLEMENTATION Marshall Islands Registry and Korean Industry Stakeholders
2020 GLOBAL SULPHUR LIMIT HISTORY, CURRENT STATUS, AND THE INTERNATIONAL MARITIME ORGANIZATION S (IMO S) WORK PLAN FOR EFFECTIVE IMPLEMENTATION Marshall Islands Registry and Korean Industry Stakeholders
NCAA Division I Championship Subdivision Football Recruiting Calendar August 1, 2017, through July 31, 2018
 NCAA Division I Championship Subdivision Football August 1, 2017, through July 31, 2018 (See NCAA Division I Bylaw 13.17.4.2 for Football Calendar Formula) (a) August 1-31, 2017: Dead Period (b) September
2016 Load & Capacity Data Report
 Caution and Disclaimer The contents of these materials are for information purposes and are provided as is without representation or warranty of any kind, including without limitation, accuracy, completeness
Crane Inspection Log. Mailing Address: P.O. Box Tulsa, OK Phone: (918) Fax: (918)
 Fax: (918)") 999978000 Crane Inspection Log Mailing Address: P.O. Box 581510 Tulsa, OK 74158-1510 Physical Address: 4707 North Mingo Road Tulsa, OK 74117-5904 Phone: (918) 836-0463 Fax: (918) 834-5979 www.autocrane.com
999978000 Crane Inspection Log Mailing Address: P.O. Box 581510 Tulsa, OK 74158-1510 Physical Address: 4707 North Mingo Road Tulsa, OK 74117-5904 Phone: (918) 836-0463 Fax: (918) 834-5979 www.autocrane.com
Portland General Electric Company Eleventh Revision of Sheet No. 7-1 P.U.C. Oregon No. E-18 Canceling Tenth Revision of Sheet No.
 Portland General Electric Company Eleventh Revision of Sheet No. 7-1 P.U.C. Oregon No. E-18 Canceling Tenth Revision of Sheet No. 7-1 AVAILABLE In all territory served by the Company. APPLICABLE To Residential
NORTHEAST NEBRASKA PUBLIC POWER DISTRICT RATE SCHEDULE LP-2 Large Power Service. Effective: For bills rendered on and after January 1, 2014.
 NORTHEAST NEBRASKA PUBLIC POWER DISTRICT RATE SCHEDULE LP-2 Large Power Service Effective: For bills rendered on and after January 1, 2014. SECTION 1. AVAILABILITY AND APPLICABILITY 1.1 This Rate Schedule
76th UNECE GRPE session
 Submitted by the IWG on PMP Informal document GRPE-74-33 76 th GRPE, 11-12 January 2018 Agenda item 7 76th UNECE GRPE session PMP IWG Progress Report Geneva, 10 th -11 th January 2018 UNITED NATIONS PMP
REASONABLE FURTHER PROGRESS REPORT FOR THE MONO BASIN PM-10 STATE IMPLEMENTATION PLAN
 REASONABLE FURTHER PROGRESS REPORT FOR THE MONO BASIN PM-10 STATE IMPLEMENTATION PLAN September 2001 This document provides a progress report on air quality trends in the Mono Basin federal PM-10 1 nonattainment
SALT RIVER PROJECT AGRICULTURAL IMPROVEMENT AND POWER DISTRICT E-27 CUSTOMER GENERATION PRICE PLAN FOR RESIDENTIAL SERVICE
 SALT RIVER PROJECT AGRICULTURAL IMPROVEMENT AND POWER DISTRICT E-27 CUSTOMER GENERATION PRICE PLAN FOR RESIDENTIAL SERVICE Effective: April 2015 Billing Cycle AVAILABILITY: The E-27 Price Plan is subject
No. CONSUMER PRICE INDICES. Information bulletin. Moscow 2019
 No. January 209 CONSUMER PRICE INDICES Information bulletin Moscow 209 No. (87) January 209 Consumer prices by group of goods and services (per cent change month-on-month) Table Inflation Core inflation
2018 Load & Capacity Data Report
 Caution and Disclaimer The contents of these materials are for information purposes and are provided as is without representation or warranty of any kind, including without limitation, accuracy, completeness
U.S. Census Bureau News Joint Release U.S. Department of Housing and Urban Development
 Raemeka Mayo or Stephen Cooper Economic Indicators Division (301) 763-5160 FOR IMMEDIATE RELEASE TUESDAY, MAY 17, 2016 AT 8:30 A.M. EDT NEW RESIDENTIAL CONSTRUCTION IN APRIL 2016 The U.S. Census Bureau
Monthly Market Detail - June 2018 Single Family Homes Miami-Dade County
 ly Market Detail - June 218 Summary Statistics June 218 June 217 Paid in Cash 1,335 1,346 -.8% 286 33-5.6% $355, $335, 6.% Average Sale Price Dollar Volume $598,494 $57,82 18.% $799. Million $682.5 Million
Monthly Market Detail - June 2018 Townhouses and Condos Miami-Dade County
 ly Market Detail - June 218 Summary Statistics June 218 June 217 Paid in Cash 1,257 1,323-5.% 657 682-3.7% $24, $235, 2.1% Average Sale Price Dollar Volume $439,546 $384,319 14.4% $552.5 Million $58.5
Summary Statistics. Closed Sales. Paid in Cash. Median Sale Price. Average Sale Price. Dollar Volume. Median Percent of Original List Price Received
 ly Market Detail - May 218 Summary Statistics May 218 May 217 Paid in Cash 1,667 1,647 1.2% 888 943-5.8% $168, $159, 5.7% Average Sale Price Dollar Volume $231,288 $21,944 9.6% $385.6 Million $347.4 Million
Design Criteria Data
 OKLAHOMA CITY OK Latitude = 35.4 N WMO No. 72353 Longitude = 97.6 W Elevation = 133 feet Period of Record = 1973 to 1996 Average Pressure = 28.62 inches Hg Design Criteria Data Mean Coincident (Average)
Unemployment Rates - November 2011
 December 2, 2011 DATA BRIEF: Black Employment and Unemployment in November 2011 The unemployment rate for Blacks was 15.5% last month. This is according to the latest report on the nation s employment
Design Criteria Data
 MEDFORD/JACKSON CO. OR Latitude = 42.37 N WMO No. 72597 Longitude =122.8 W Elevation = 1329 feet Period of Record = 1973 to 1996 Average Pressure = 28.61 inches Hg Design Criteria Data Mean Coincident
Fairbanks, Alaska. A Climate Almanac
 A Climate Almanac History of Climate Observations at Fairbanks Cooperative climate observations were initiated in Fairbanks by the Rev. Hudson Stuck on September!, "#$!. Observations were made with Weather
SODANKYLÄ GEOPHYSICAL OBSERVATORY PUBLICATIONS. N o. 97 MAGNETIC RESULTS SO D A N K Y L Ä JOHANN ES KULTIMA TERO RAITA
 SODANKYLÄ GEOPHYSICAL OBSERVATORY PUBLICATIONS N o. 9 MAGNETIC RESULTS SO D A N K Y L Ä 0 JOHANN ES KULTIMA TERO RAITA OULU 05 Editor: Johannes Kultima Sodankylä Geophysical Observatory FIN-9900 SODANKYLÄ,
Black Employm ent an d Unemploymen t Decembe r 2013 Page 1
 January 10, 2014 DATA BRIEF: Black Employment and Unemployment in December 2013 The unemployment rate for Blacks was 11.9% last month. This is according to the latest report on the nation s employment
Design Criteria Data
 DES MOINES IA Latitude = 41.53 N WMO No. 72546 Longitude = 93.65 W Elevation = 965 feet Period of Record = 1973 to 1996 Average Pressure = 28.96 inches Hg Design Criteria Data Mean Coincident (Average)
Section 10. Renewable Energy
 Section 1. enewable Energy Sources. The Nation consumed 6.2 quadrillion Btu of renewable energy in 23, accounting for 6 percent 1 of total energy consumption during the year. At 2.8 quadrillion Btu, conventional
THE PEP PARTNERSHIP ON ECODRIVING Goals, achievements and new projects November 2016
 THE PEP PARTNERSHIP ON ECODRIVING Goals, achievements and new projects November 2016 BENEFITS OF ECODRIVING Results all from EcoDriving projects all over Europe prove that educated and trained drivers
THE PEP PARTNERSHIP ON ECODRIVING Goals, achievements and next steps November 2017
 THE PEP PARTNERSHIP ON ECODRIVING Goals, achievements and next steps November 2017 BENEFITS OF ECODRIVING Results all from EcoDriving projects all over Europe prove that educated and trained drivers can
Black Employm ent an d Unemploymen t Au gust Page 1
 September 7, 2012 DATA BRIEF: Black Employment and Unemployment in August 2012 The unemployment rate for Blacks was 14.1% last month. This is according to the latest report on the nation s employment situation
Design Criteria Data
 LAS VEGAS/MCCARRAN NV Latitude = 36.8 N WMO No. 72386 Longitude =115.1 W Elevation = 2179 feet Period of Record = 1973 to 1996 Average Pressure = 27.67 inches Hg Design Criteria Data Mean Coincident (Average)
Design Criteria Data
 PHOENIX/SKY HARBOR AZ Latitude = 33.43 N WMO No. 72278 Longitude =112. W Elevation = 116 feet Period of Record = 1973 to 1996 Average Pressure = 28.72 inches Hg Design Criteria Data Mean Coincident (Average)
2016 Meteorological and Oceanographic Summary for the Bocas del Toro Research Station. Prepared by: Steven Paton
 0 2016 Meteorological and Oceanographic Summary for the Bocas del Toro Research Station Prepared by: Steven Paton 1 Introduction This is the forth of a series of yearly reports summarising the past year
Unemployment Rates January 2011
 February 4, 2011 DATA BRIEF: Black Employment and Unemployment in January 2011 by Sylvia Allegretto, Ary Amerikaner, and Steven Pitts The unemployment rate for Blacks was 15.7% last month. This is according
Calendar. UW Health Critical Care Transport
 2014 Calendar UW Health Critical Care Transport 2014 January 1 2 3 4 New Year s Day 5 6 7 8 9 10 11 12 13 14 15 16 17 18 19 20 21 22 23 24 25 Martin Luther King Day 26 27 28 29 30 31 Access Center... (800)
NORTHEAST NEBRASKA PUBLIC POWER DISTRICT RATE SCHEDULE LP-2 Large Power Service. Effective: For bills rendered on and after February 1, 2019.
 NORTHEAST NEBRASKA PUBLIC POWER DISTRICT RATE SCHEDULE LP-2 Large Power Service Effective: For bills rendered on and after February 1, 2019. SEDC:60/7/8/9 SECTION 1. AVAILABILITY AND APPLICABILITY 1.1
Appendix 1B: Ferry statistics
 The Danish Road Directorate Page 1 The following pages contain an overview of the development in the number of transferred ordinary vehicles and s in 2009 and 2010 on the following routes: Elsinore - Helsingborg
 1 of 17 1/31/2017 10:19 AM Student: Date: Instructor: Megan Rourke Course: MATH 1500 - Online Assignment: Statistics 1. Use this graph to answer the questions below. a. The largest increase in sales occurred
ELECTRIC POWER BOARD OF THE METROPOLITAN GOVERNMENT OF NASHVILLE AND DAVIDSON COUNTY. TIME-OF-USE GENERAL POWER RATE--SCHEDULE TGSA (November 2018)
") ELECTRIC POWER BOARD OF THE METROPOLITAN GOVERNMENT OF NASHVILLE AND DAVIDSON COUNTY TIME-OF-USE GENERAL POWER RATE--SCHEDULE TGSA () Availability This rate shall be available for the firm power requirements
ELECTRIC POWER BOARD OF THE METROPOLITAN GOVERNMENT OF NASHVILLE AND DAVIDSON COUNTY TIME-OF-USE GENERAL POWER RATE--SCHEDULE TGSA () Availability This rate shall be available for the firm power requirements
Meter Insights for Downtown Store
 Meter Insights for Downtown Store Commodity: Analysis Period: Prepared for: Report Date: Electricity 1 December 2013-31 December 2014 Arlington Mills 12 February 2015 Electricity use over the analysis
Greater Albuquerque Area Monthly Housing Trends vs. 2016
 Month Greater Albuquerque Area Monthly Housing Trends - 2015 vs. 2016 Class R1 (Existing Single-Family Detached) and Class R2 (Existing Condo/Townhome Attached) homes Data on this page was obtained from
1. H. Julius Hackett General Manager Phone: (850) Extension 201 Cell: (850)
 Extension 201 Cell: (850)") Interconnection and Net Metering of Customer-Owned Renewable Generation Report to the Florida Public Service Commission Pursuant to Rule 25-6.065, F.A.C. Calendar Year 2010 1. Introduction: a) b) Mailing
Interconnection and Net Metering of Customer-Owned Renewable Generation Report to the Florida Public Service Commission Pursuant to Rule 25-6.065, F.A.C. Calendar Year 2010 1. Introduction: a) b) Mailing
Greater Albuquerque Area Monthly Housing Trends vs. 2017
 Month Greater Albuquerque Association of REALTORS Greater Albuquerque Area Monthly Housing Trends - 2016 vs. 2017 Class R1 (Existing Single-Family Detached) and Class R2 (Existing Condo/Townhome Attached)
PRESENTATION ON STRATEGIC APPROACH TOWARDS WIND SOLAR HYBRID SYSTEMS (SWES) FOR REMOTE TELECOM SITES IN INDIA & CASE STUDY OF RAJASTHAN
 FOR REMOTE TELECOM SITES IN INDIA & CASE STUDY OF RAJASTHAN") PRESENTATION ON STRATEGIC APPROACH TOWARDS WIND SOLAR HYBRID SYSTEMS (SWES) FOR REMOTE TELECOM SITES IN INDIA & CASE STUDY OF RAJASTHAN WORKSHOP ON SMALL WIND ENERGY AND HYBRID SYSTEMS & ITS RELEVANCE
PRESENTATION ON STRATEGIC APPROACH TOWARDS WIND SOLAR HYBRID SYSTEMS (SWES) FOR REMOTE TELECOM SITES IN INDIA & CASE STUDY OF RAJASTHAN WORKSHOP ON SMALL WIND ENERGY AND HYBRID SYSTEMS & ITS RELEVANCE
Caution and Disclaimer The contents of these materials are for information purposes and are provided as is without representation or warranty of any
 Draft Version 1 Caution and Disclaimer The contents of these materials are for information purposes and are provided as is without representation or warranty of any kind, including without limitation,
December 4, Docket: ER Energy Imbalance Market Special Report Transition Period July 2018 for Idaho Power Company
 California Independent System Operator Corporation December 4, 2018 The Honorable Kimberly D. Bose Secretary Federal Energy Regulatory Commission 888 First Street, NE Washington, DC 20426 Re: California
Presented by Eric Englert Puget Sound Energy September 11, 2002
 Results from PSE s First Year of Time of Use Program Presented by Eric Englert Puget Sound Energy September 11, 2002 Puget Sound Energy Overview 973,489 Total Electric Customers 908,949 are AMR Capable
August 15, Please contact the undersigned directly with any questions or concerns regarding the foregoing.
 California Independent System Operator Corporation The Honorable Kimberly D. Bose Secretary Federal Energy Regulatory Commission 888 First Street, NE Washington, DC 20426 August 15, 2017 Re: California
U.S. Census Bureau News Joint Release U.S. Department of Housing and Urban Development
 Raemeka Mayo or Stephen Cooper Economic Indicators Division (01) 76-5160 FOR IMMEDIATE RELEASE TUESDAY, MARCH 17, 015 AT 8:0 A.M. EDT NEW RESIDENTIAL CONSTRUCTION IN FEBRUARY 015 The U.S. Census Bureau
Unemployment Rates August 2010
 September 3, 2010 DATA BRIEF: Black Employment and Unemployment in August 2010 by Sylvia Allegretto, Ary Amerikaner, and Steven Pitts The unemployment rate for Blacks was 16.3% last month. This is according
2014 Meteorological and Oceanographic Summary for the Bocas del Toro Research Station. Prepared by: Steven Paton
 0 2014 Meteorological and Oceanographic Summary for the Bocas del Toro Research Station Prepared by: Steven Paton 1 Introduction This is the second of a series of yearly reports summarising the past year
Arctic Freshwater Flux and Change
 Arctic Freshwater Flux and Change Daqing Yang, Doug Kane, Sveta Berezovskaya Water and Environment Research Center, Univ. of Alaska Fairbanks Main Topics Large Arctic River Streamflow Regime and Change
Charging Delivery Body. 29 th January 2018
 Charging Delivery Body 29 th January 2018 Agenda Item Lead Documents 1. Introductions Andy Burgess Ofgem 2. Approval of Draft Minutes Andy Burgess Ofgem Via email 3. Review of Actions log Andy Burgess
Teaching English to Foreigners: 2008
 15 June 2009 1100 hrs 106/2009 In 2008, 83,288 foreign students followed courses at local English-language specialised schools. This shows a decrease of 0.8 per cent over 2007. Teaching English to Foreigners:
2012 Water Consumption Statistics Report. Water Services Department
 212 Water Consumption Statistics Report Water Services Department Issued: December 213 TABLE OF CONTENTS 212 Water Consumption Statistics Report December 213 212 GVWD Statistics Book - Notes...3 Annual
LOCAL CLIMATOLOGICAL DATA
 ILLINOIS STATE WATER SURVEY DIVISION URBANA, ILLINOIS ISWS MP-21 Archive SWS0964 Illinois State Water Survey LOCAL CLIMATOLOGICAL DATA FDR HILLSBORO, IL. 1901-1962 LOCAL CLIMATOLOGICAL DATA 1901-1962 HILLSBORO
Greater Albuquerque Area Monthly Housing Trends vs. 2011
 Greater Albuquerque Area Monthly Housing Trends - 2010 vs. 2011 Class R1 (Existing Single-Family Detached) and Class R2 (Existing Condo/Townhome Attached) homes Data on this page was obtained from the
Conclusions of the thirteenth plenary of the European Regulators Group
 Conclusions of the thirteenth plenary of the European Regulators Group Date: May 25-26, 2005 Location: Bled (Slovenia) Adoption of the Agenda and welcome The agenda ERG (05) 18 was adopted. The Chairman
National Household Travel Survey Add-On Use in the Des Moines, Iowa, Metropolitan Area
 National Household Travel Survey Add-On Use in the Des Moines, Iowa, Metropolitan Area Presentation to the Transportation Research Board s National Household Travel Survey Conference: Data for Understanding
January 2014 SUNDAY MONDAY TUESDAY WEDNESDAY THURSDAY FRIDAY SATURDAY
 January 2014 1 2 3 4 5 6 7 8 9 10 11 12 13 14 15 16 17 18 19 20 21 22 23 24 25 26 27 28 29 30 31 February 2014 1 2 3 4 5 6 7 8 9 10 11 12 13 14 15 Creating Reports with SQL Reporting Services in GP Bismarck
Large General Service Time-of-Use Storage Program
 Large General Service Time-of-Use Storage Program AVAILABILITY Available throughout the Company s entire electric service area where the facilities of the Company are of adequate capacity and are adjacent
Black Employm ent an d Unemploymen t July Page 1
 August 3, 2012 DATA BRIEF: Black Employment and Unemployment in July 2012 The unemployment rate for Blacks was 14.1% last month. This is according to the latest report on the nation s employment situation
Consumers Energy Net Metering
 Consumers Energy Net Metering ELODY SAMUELSON September 20, 2016 Consumers Energy About Us Territory Overview 2 FOURTH-LARGEST COMBINATION UTILITY IN THE UNITED STATES Electric Utility 1.8 million electric
Methodology of Cost Allocation
 Methodology of Cost Allocation Robin Kliethermes May 17, 2013 1 Purpose of Cost Allocation Determine whether each class of customers is providing the utility with a reasonable level of revenue necessary
U.S. Census Bureau News Joint Release U.S. Department of Housing and Urban Development
 Raemeka Mayo or Stephen Cooper Economic Indicators Division (01) 76-5160 FOR IMMEDIATE RELEASE WEDNESDAY, MARCH 16, 016 AT 8:0 A.M. EDT NEW RESIDENTIAL CONSTRUCTION IN FEBRUARY 016 The U.S. Census Bureau
U.S. Census Bureau News Joint Release U.S. Department of Housing and Urban Development
 Raemeka Mayo or Stephen Cooper Economic Indicators Division (01) 76-5160 FOR IMMEDIATE RELEASE FRIDAY, JUNE 17, 016 AT 8:0 A.M. EDT NEW RESIDENTIAL CONSTRUCTION IN MAY 016 The U.S. Census Bureau and the
2016 Meteorological Summary for the Galeta Marine Island Laboratory. Prepared by: Steven Paton
 0 2016 Meteorological Summary for the Galeta Marine Island Laboratory Prepared by: Steven Paton 1 Introduction This is the fourth in a series of yearly reports summarising the past year s Smithsonian Tropical
2017 Meteorological and Oceanographic Summary for the Bocas del Toro Research Station. Prepared by: Steven Paton
 0 2017 Meteorological and Oceanographic Summary for the Bocas del Toro Research Station Prepared by: Steven Paton 1 Introduction This is the 5 th of a series of yearly reports summarising the past year
Progress Report of the VIAQ (Vehicle Interior Air Quality) Informal Working Group
 Informal Working Group") Transmitted by the Chair and Secretary of VIAQ Informal document VIAQ-13-03 Progress Report of the VIAQ () GENEVA, June 6th 2018 Chair: Andrey KOZLOV, Russian Federation Co-Chair: Jongsoon LIM, The Republic
Transmitted by the Chair and Secretary of VIAQ Informal document VIAQ-13-03 Progress Report of the VIAQ () GENEVA, June 6th 2018 Chair: Andrey KOZLOV, Russian Federation Co-Chair: Jongsoon LIM, The Republic
2017 Meteorological Summary for the Galeta Marine Island Laboratory. Prepared by: Steven Paton
 0 2017 Meteorological Summary for the Galeta Marine Island Laboratory Prepared by: Steven Paton 1 Introduction This is the 5 th in a series of yearly reports summarising the past year s Smithsonian Tropical
New York s Mandatory Hourly Pricing Program
 New York s Mandatory Hourly Pricing Program Case 03-E-0641 Chris Graves NYS Department of Public Service October 2009 Mandatory Hourly Pricing (MHP) Background September 1998 Niagara Mohawk institutes
BrightRidge Large Commercial and Industrial Rates October 2017 Billing Cycle All Rates Subject to TVA s Fuel Cost Adjustment (separate schedule)
") KEY RATE DEFINITIONS Seasonal Rate Periods (applicable to all rates) Billing Months are defined as June, July, August, and September. Billing Months are defined as December, January, February, and March.
KEY RATE DEFINITIONS Seasonal Rate Periods (applicable to all rates) Billing Months are defined as June, July, August, and September. Billing Months are defined as December, January, February, and March.
Smarter Network Storage: Introduction to grid-scale storage and applications, the DNO perspective
 Smarter Network Storage: Introduction to grid-scale storage and applications, the DNO perspective 2 Storage: the DNO perspective Context to the storage boom Smarter Network Storage: What have we achieved?
NPCC Natural Gas Disruption Risk Assessment Background. Summer 2017
 Background Reliance on natural gas to produce electricity in Northeast Power Coordinating Council (NPCC) Region has been increasing since 2000. The disruption of natural gas pipeline transportation capability
BUREAU OF Statistics Yukon Energy Facts
 BUREAU OF Statistics Yukon Energy Facts Electricity Generation YUKON ELECTRICAL COMPANY YUKON ENERGY CORPORATION YUKON TOTAL HYDRO THERMAL HYDRO THERMAL WIND HYDRO THERMAL WIND (MW.h) (MW.h) (MW.h) 26
Black Employm ent an d Unemploymen t Ap ril Page 1
 May 6, 2012 DATA BRIEF: Black Employment and Unemployment in April 2012 The unemployment rate for Blacks was 13.0% last month. This is according to the latest report on the nation s employment situation
Greater Albuquerque Area Monthly Housing Trends vs. 2014
 Month Greater Albuquerque Association of REALTORS Greater Albuquerque Area Monthly Housing Trends - 2013 vs. 2014 Class R1 (Existing Single-Family Detached) and Class R2 (Existing Condo/Townhome Attached)
Per Meter, Per Month. Effective July 1, 2018 Customer Charge Flat Charge $8.86
 SCHEDULE D TOU TIERED DOMESTIC TIME OF USE SERVICE TIERED (This rate schedule is closed to new customers as of July 1, 2018. On July 1, 2019, existing customers will be transitioned to their otherwise
Dawn Storage Pricing Summary last updated April 1, 2018
 Dawn Storage Pricing Summary last updated April 1, 2018 The table below illustrates how Union Gas enters into market priced storage services (park, loans, off peak, short & long term peak) and provides
11. Electrical energy tariff rating
 799 11. Electrical energy tariff rating 800 11. ELECTRICAL ENERGY TARIFF RATING There is no universal system for billing electrical energy. Each country generally adopts its own method, taking into account
SUBSIDIARY BODY FOR SCIENTIFIC AND TECHNOLOGICAL ADVICE Fourteenth session Bonn, July 2001 Item 3 (b) of the provisional agenda
 of the provisional agenda") UNITED NATIONS Distr. GENERAL 11 July 2001 ENGLISH ONLY SUBSIDIARY BODY FOR SCIENTIFIC AND TECHNOLOGICAL ADVICE Fourteenth session Bonn, 16-27 July 2001 Item 3 (b) of the provisional agenda REPORTS ON
UNITED NATIONS Distr. GENERAL 11 July 2001 ENGLISH ONLY SUBSIDIARY BODY FOR SCIENTIFIC AND TECHNOLOGICAL ADVICE Fourteenth session Bonn, 16-27 July 2001 Item 3 (b) of the provisional agenda REPORTS ON
MAINTENANCE COSTS OF INTENSIVELY USED SELF-PROPELLED MACHINES IN AGRICULTURAL COMPANIES
 MAINTENANCE COSTS OF INTENSIVELY USED SELF-PROPELLED MACHINES IN AGRICULTURAL COMPANIES Juri Olt, Ulo Traat, Arne Kuut Estonian University of Life Sciences jyri.olt@emu.ee, ylo.traat@emu.ee, arne.kyyt@emu.ee
VC ACADEMIC CALENDAR. Sun Mon Tue Wed Thu Fri Sat. Sum 10 Wk. & Sum II Final Exams. Cancel Fall 16 wk. & Fall I Non-Pays
 August 2017 1 SLC Registration Fall 2017 2 3 4 5 Sum 10 Wk. & Sum II Final Exams Commencement (No Ceremony) 6 7 Grades Due Sum 10wk & Sum II 9:00 am 8 Final Fall CC 5:00 pm Pay Day 6:00 pm 9 10 11 Cancel
Meteorology of Monteverde, Costa Rica 2005
 Meteorology of Monteverde, Costa Rica 2005 Technical Report submitted to the Monteverde Institute Andrew J. Guswa, Asst Professor, Picker Engineering Program Amy L. Rhodes, Asst Professor, Department of
Economic and Social Council
 UNITED NATIONS E Economic and Social Council Distr. GENERAL ECE/TRANS/WP.29/AC.3/26 18 December 2009 Original: ENGLISH ECONOMIC COMMISSION FOR EUROPE INLAND TRANSPORT COMMITTEE World Forum for Harmonization
CITARUM WATER RESOURCES OPERATION
 CITARUM WATER RESOURCES OPERATION Implemented by Jasa Tirta II Public Corporation Presentation For : NARBO 3 rd Training Workshop Daejeon Korea November, 13-18, 2005 J A S A T I R T A II P U B L I C C
December Individual Quality Review Calendar FY 18 FY 19. Mon Tues Wed Thu Fri Sat. Sun METRO1 SAMPLE TO REGION
 December 2017 Sun Mon Tues Wed Thu Fri Sat 1 2 3 4 5 6 7 8 9 METRO1 SAMPLE TO REGION 10 11 12 13 14 15 16 17 18 19 20 21 22 23 24 25 26 27 28 29 30 31 Christmas METRO1 Schedules issued to IQR Updated 1/5/18
HDV CO2 emission certification 1 st meeting of the Editing board
 HDV CO2 emission certification 1 st meeting of the Editing board DG Growth Maciej Szymański 2.03.2015 Internal market, Industry, Entrepreneurship and SMEs Meeting agenda Work of the Editing board: Objectives
Section 5. Crude Oil and Natural Gas Resource Development
 Section 5. Crude Oil and Natural Gas Resource Development The September 4 rotary rig count was 1,4, slightly higher than the count in August 4 and 13 percent higher than the count in September 3. Of the