TEXAS HOTEL PERFORMANCE REPORT: FOURTH QUARTER AND YEAR OF
|
|
|
- Oscar Gardner
- 5 years ago
- Views:
Transcription
 in the year of 2009, to $6.174 billion. This compares to gains of 8.5 percent in 2008, 8.9 percent in 2007 and 13 percent in 2006. Worse, the rate of loss increased to 18.")
1 Market Texas Tourism, Office of the Governor, Economic Development & Tourism TEXAS HOTEL PERFORMANCE REPORT: FOURTH QUARTER AND YEAR OF 2009 Texas lodging room revenues dropped 15% ($1.085 billion) in the year of 2009, to $6.174 billion. This compares to gains of 8.5 percent in 2008, 8.9 percent in 2007 and 13 percent in Worse, the rate of loss increased to 18.8 percent in the latest period, the Fourth quarter. This decline in the Fourth quarter represents a 26 percentage point turnaround - in the negative direction - from 2008; growth in the Fourth quarter last year was +7.6 percent compared to the 18.8 percent decline this year. This is the largest percentage revenue decline in 23 years (compares to -22 percent in the Third quarter of 1986). Fourth quarter room revenues dropped sharply to $1.376 billion from $1.695 billion a year ago. Prices declined by 9.9 percent, one of the largest drops on record. Revenue Per Available Room per day plummeted by 23.9 percent. Annual 2009 room-nights sold decreased by 8.6 percent. This decline compares to gains of 3.2 percent in 2008 and 2.9 percent in The 2009 decline includes a 9.9 percent decrease in the Fourth quarter. Room-nights sold are the fundamental measure of real demand and the most important driver of industry health. Annual 2009 occupancy dropped by 13 percent (by 8 points ), from a healthy 61.5 percent in 2008 to 53.5 percent. In the Fourth quarter, occupancy dropped by 15.5 percent (9 points ), from 58.1 percent to 49.1 percent, a level well below the 60 percent long-term Texas industry average. In the quarter, room supply grew 6.8 percent, caused by the strength of the industry before 2009 (but now unneeded given demand February 28, 2010
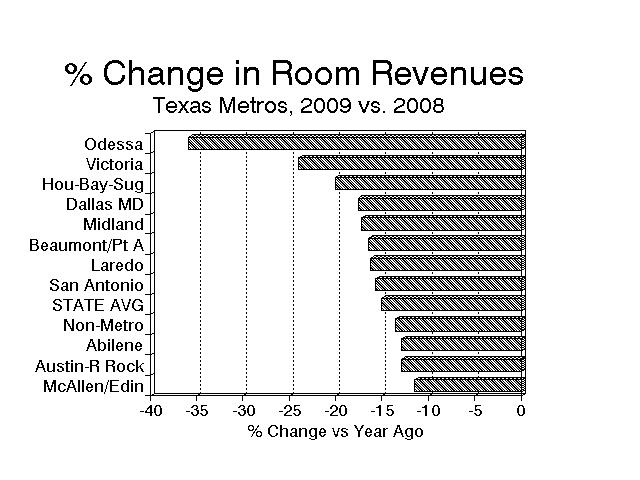
2 declines). Consequently, we expect net new supply will decline nearly to zero quite soon because of the current recession and its abysmal effect on operating results. Texas lodging performance measures continue trending negatively and more severely. Of critical note, the trend towards higher and higher declines has slowed, but has not stopped: Texas: Percentage Change Vs. Year Ago Room Room Rooms % $ $ Qtr/Yr Supply Rev $ Sold Occ Price RPAR 4th st ' nd rd th st ' nd rd th Twenty-one of the 28 measured areas suffered revenue declines. The worst declines were in oil-dependent areas and in areas benefitting from the 2008 hurricanes: Beaumont-Port Arthur dropped over 50 percent, Odessa over 40 percent, Houston over 30 percent, and Midland, Victoria and Abilene over 20 percent. Six others dropped over 10 percent. Five areas enjoyed small gains, the highest of which was 5 percent in Wichita Falls. Fourth Quarter % Total Revenue* % Chains Only: Metropolitan Areas Market Change %Occ ADR REVPAR Dallas-Ft Worth-Arlington 28.1% $441.1 $ % 51.6% $82.86 $42.76 Houston-Baytown-Sugarland 22.0% $458.1 $ % 51.0% $88.46 $45.11 San Antonio 12.6% $200.7 $ % 49.1% $97.33 $47.79 Austin-Round Rock 10.1% $156.0 $ % 56.3% $96.60 $54.39 Corpus Christi 2.0% $30.7 $ % 36.6% $77.53 $28.38 El Paso 2.5% $34.6 $ % 67.1% $71.30 $47.84 Brownsville-Harlingen 1.1% $16.1 $ % 39.1% $70.05 $27.39 Balance of Texas 21.7% $357.3 $ % 50.7% $70.31 $35.65 Total State of Texas 100.0% $1,694.6 $1, % 51.2% $83.41 $42.71 * $ millions Analyst s Prediction: If historical patterns from the recessions of the 1980 s repeat themselves, the severe rate of decline in room-nights sold may moderate, but no recovery is foreseen. In other words, demand in 2010 is unlikely to increase. This opinion is based on the ineffectiveness of federal stimuli, crippling deficits, near 20 percent unemployment (includes parttime workers and those giving up ), lack of meaningful energy development, and the negative effects on the free enterprise economy of proposed federal programs, including nationalized health care, card check,, cap & trade, immigration reform, and huge, looming tax increases. **********************
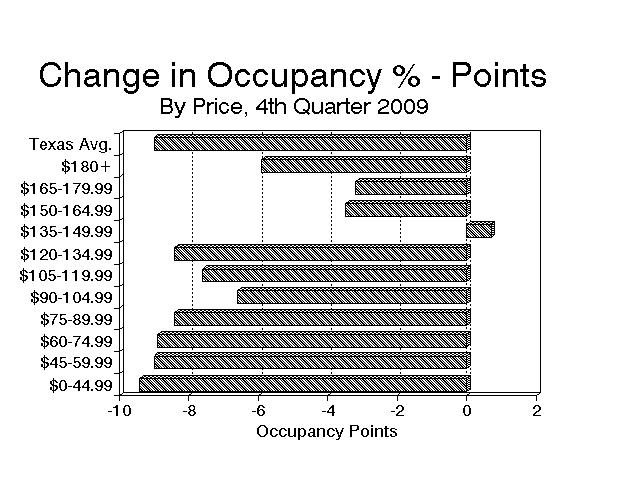
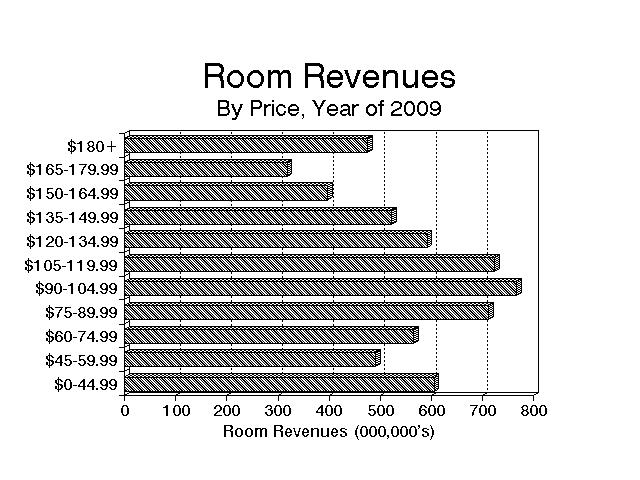
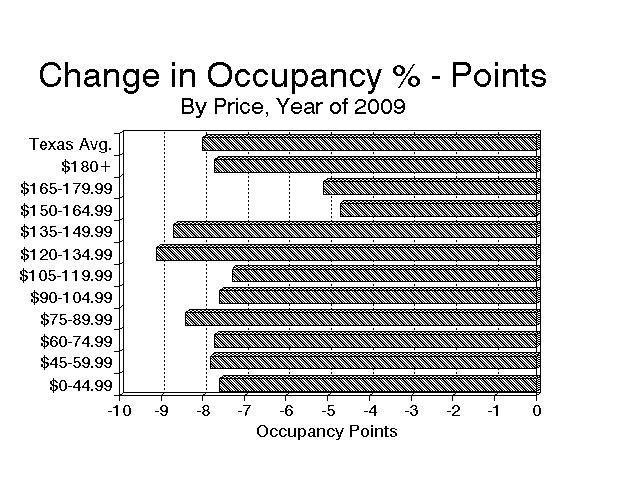
3 By Price Fourth Quarter Revenues: The majority of the revenue losses have been among travelers purchasing at the higher prices. In 2008, lodging priced above $135 gained 23.5 percent over In the Fourth quarter of 2009, this category lost over 40 percent versus last year in large part due to a 34 percent decline in supply (as hotels dropped down to the Mid-priced category). Mid-priced hotel revenues ($90-$135) were down 12.9 percent in the Fourth quarter after being up 11.8 percent for all of 2008; net supply was unchanged. Under $90 lodging eroded slightly in the Fourth quarter (by 3.2 percent) in spite of a 20 percent supply gain.. Change In Room Revenues, by Price (vs. year ago) Average Rate: Under $90 $90 to $135 $135+ Total Year of % 15.0% 21.9% 8.9% Year of % 11.8% 23.5% 8.5% 1st Quarter '09-2.9% -0.7% -22.5% -8.9% 2nd Quarter '09-3.5% -10.0% -30.0% -15.5% 3rd Quarter '09-3.2% -14.4% -31.1% -16.3% 4th Quarter '09-3.2% -12.9% -42.5% -18.8% By Product/Price Segment Annual Basis: Revenues show double digit declines in all segments, 1 signaling a drop in both Business- and Leisure-related demand in the market. However, the largest declines were at the high- and low-end of the market, with Luxury down almost 19 percent, Budgets down 20 percent and Independents 17 percent. Suites and Limited Service chains were the best performers, but still lost 10+ percent versus year ago in this down market. Segment Performance Year of 2009 Results ( 000's) # # # $ Room % % % Point Rate REVPAR Segments Hotels Rooms Chg Revenues Chg Mkt Occup Chg Chg Chg Luxury , % 4.8% % -18.9% Upscale ,053, % 17.1% % -20.1% Suites , % 9.3% % -18.5% Mid/Upscales , % 14.3% % -20.2% Mini-Suites , % 4.7% % -23.0% L.S./Midscales ,272, % 20.6% % -21.1% Extended Stay , % 3.5% % -19.1% Budget , % 9.2% % -22.5% Total Chains 2, ,160, % 83.6% % -20.3% Tot. Independ. 1, ,013, % 16.4% % -15.9% Total Market 4, ,174, % 100.0% % -18.1% 1 Limited Service chain hotels offer high-quality rooms without restaurants at average prices (e.g. Holiday Express, Hampton Inn, Fairfield Inn, La Quinta). Mini-suite hotels feature room sizes of about 400 square feet and limited service. Luxury hotels are the highest priced chains (Westin, Four Seasons, Gaylord, Ritz Carlton). Upscales are the large full-service, higher-priced hotels (e.g. Marriott, Hilton, Hyatt, Omni, Wyndham). Mid- Upscale hotels are lower-priced, partially-full-service hotels (e.g. Marriott Courtyard, Hilton Garden, Hyatt Place, Holiday Inn, Sheraton). Low Priced Extended Stay includes brands such as Budget Suites of America, Extended Stay America, etc. Budget chains include Motel 6, Super 8, Days Inn, Ramada and similar low-priced hotels.
4 Room Supply Increases Will Quickly Cease: Room supply increased by 6.8 percent in the Fourth quarter, due to the high occupancy rates of the past few years. In the next few years, development and opening of new hotels will be offset by the closure of older, obsolete lodging properties that are unable to survive in this weak market environment. After completion and opening of new hotels now under construction, or soon to break ground, net supply growth in Texas should consequently drop to zero. There will still be new openings, selectively, where old hotels are closed, and in local market pockets of economic growth. In the Fourth quarter of 2009, room inventory expanded by 24,500 net rooms 2 over last year, after expanding by 19,300 in the Third, by 16,800 in the Second and by 14,300 units in the First quarter. In the Fourth quarter, rooms priced below $90 increased dramatically (by 20 percent or 43,400 net rooms), due mostly to hotels that reduced rates below $90 and shifted to the lower-priced category. Rooms offered at rates from $90 up to $135 declined 0.1 percent (-100 net rooms), while room supply offered at rates of $135 and above declined 35 percent (-18,800 net rooms). The Largest Metro Areas in the Fourth Quarter San Antonio Metro room-nights-sold declined only by 0.3 percent from the Fourth quarter a year ago, while rates dropped 13.5 percent causing revenues to decline 13.8 percent to $173 million. As net room supply increased dramatically by 7.5 percent (2,900 net rooms), average occupancy eroded by 3.7 points, to 47.4 percent. In the year of 2008, San Antonio room revenues gained 9.2 percent because of a 4.9 percent increase in room rates and a 4.1 percent rise in roomnights sold; occupancy slipped 1 point to a 60.4 percent average. Ft. Worth-Arlington Metropolitan Division room-nights-sold slipped 2.5 percent in the quarter, with revenues down 7.3 percent, to $129 million. Net room supply grew massively, by 10.1 percent (2,900 rooms) contributing to an occupancy decline of 6.9 points, to 52.9 percent. In the year of 2008, Ft. Worth room revenues gained a strong 9.5 percent, room-nights increased 3.4 percent and occupancy eroded 1 point to a still-strong 65.9 percent average. Austin-Round Rock room-nights-sold dropped 3.9 percent in the Fourth quarter. Influenced by a 7.5 percent price decrease, revenues dropped 11 percent to $139 million. Net room supply rose 4.9 percent (1,300 net rooms). Occupancy consequently slid 5.1 points to 55.3 percent. For all of 2008, Austin metro occupancy dropped 2.4 points to a still-healthy 66.1 percent as room revenues gained 3 percent. Dallas Metropolitan Division room-nights-sold dropped 6.3 percent in the Fourth quarter, causing revenues to decline 14.7 percent to $257 million. As net room supply increased by 4.1 percent (2,800 net rooms), average occupancy slipped 5.5 points, to 50.2 percent. In the year of 2008, Dallas room revenues gained just 2.8 percent because of a 1.8 percent increase in room rates and a 1 percent rise in room-nights sold from 2007; occupancy slipped 0.5 points to a 59.6 percent. Houston-Baytown-Sugar Land room-nights-sold dropped precipitously by 24.4 percent in the Fourth quarter while room revenues dropped 34 percent, to $303 million (with a 12.5 percent price erosion). Occupancy dropped 21 points to 49.7 percent in the quarter. Metro room supply rose by 7.6 percent (5,500 rooms). In the year of 2008, Houston gained by Hurricane-related housing demand as room revenues gained 13.3 percent and room-nights sold rose 4.8 percent; then, occupancy increased 1.3 points to a 65.9 percent average 2 net being the combination of new supply openings less closures, and rooms moving to or from another price grouping
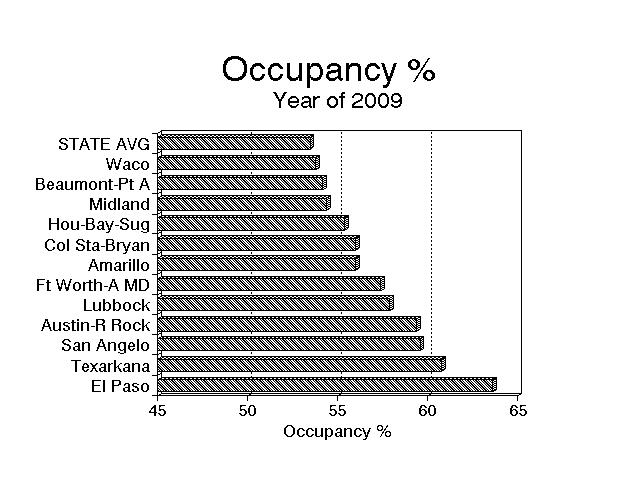
5 Annual Occupancy In 2009, occupancy averaged 53.5 percent, almost 11 percent below long term averages. This compares to 61.5 percent in 2008 and to 61.4 percent In the Fourth quarter of 2008, occupancy was 49.1 percent, down from 58.1 percent in the prior year. Chain occupancy was 55.6 percent in 2009, down by 8.8 points from a year ago. Chains accounted for 83.7 percent of market revenues, slightly above a year ago. Independents generated 46.7 percent occupancy, down by 6.1 points. In 2009, twenty-six of the 27 Texas areas showed decreased occupancy versus Twelve areas exceeded the state occupancy average, as the areas are ranked by 2009 occupancy below: Metro Area Performance Year of 2008 _Year of 2009 Occ Pt. Rev Occ Pt. Rev Metro Area % Chg % Chg % Chg % Chg El Paso % % Texarkana (Tx) % % San Angelo % % Austin-Round Rock % % Lubbock % % Amarillo % % College Station-Bryan % % Ft Worth-Arlington MD % % Midland % % Beaumont-Pt Arthur % % Houston-Baytown-Sugarland % % Waco % % State Average % % Longview % % Tyler % % Wichita Falls % % San Antonio % % Dallas MD % % Killeen-Temple-Ft Hood % % McAllen-Edinburg-Pharr % % Odessa % % Non Metro % % Laredo % % Corpus Christi % % Abilene % % Brownsville-Harlingen % % Sherman-Denison % % Victoria % %
6
7
8
9
10
11 Tables Page 11 HOTEL/MOTEL PERFORMANCE BY METRO; FOURTH QUARTER Metropolitan Statistical Areas Abilene , , Amarillo , , Austin-Rd Rock , , , , Beaumt-Pt A , , Browns/Harlin , , ColSt-Bryan , , Corpus Chris , , Dallas MD , , , , Ft W-Arl MD , , , , DFW Metro , , , , El Paso , , Hou-Bay-Sugat , , , , Kil-Tem-Ft H , , Laredo , , Longview , , Lubbock , , McAl-Ed-Ph , , Midland , , Odessa , , San Angelo , , San Antonio , , , , Shermn/Denis , , Texarka(TX) , , Tyler , , Victoria , , Waco , , Wichita Falls , , Non-Metro , , , , Tot Texas 4, ,297 1,694, , ,395 1,375,
12 Tables Page 12 HOTEL/MOTEL PERFORMANCE BY METRO; FOURTH QUARTER Abilene CHAIN $ $ $ $ , $ , , $ , , TOTAL , , $ $ $ TOTAL , , Abilene $ , , $ , $ $ , $ , , $ , , Abilene , , Amarillo CHAIN $ , , $ , , $ , , $ , , $ , $ , , $ , TOTAL , ,
13 Tables Page 13 HOTEL/MOTEL PERFORMANCE BY METRO; FOURTH QUARTER $ , , $ $ , , $ $ TOTAL , , Amarillo $ , , $ , , $ , , $ , , $ , $ , , $ , Amarillo , , Austin-Round Rock CHAIN $ , , $ , , $ , , $ , , $ , , $ , , $ , , $ , , $ , , $ , $ , , TOTAL , , , ,
14 Tables Page 14 HOTEL/MOTEL PERFORMANCE BY METRO; FOURTH QUARTER $ , , $ $ $ $ $ $ , $ , , $ $ $ , , TOTAL , , Austin-R R $ , , $ , , $ , , $ , , $ , , $ , , $ , , $ , , $ , , $ , $ , , Austin-R R , , , ,
15 Tables Page 15 HOTEL/MOTEL PERFORMANCE BY METRO; FOURTH QUARTER Beaumont-Port Arthur CHAIN $ , $ , , $ , , $ , $ , , $ , , $ , $ $ , TOTAL , , $ $ , $ $ $ , $ , $ TOTAL , , Beaumt-PT $ , , $ , , $ , , $ , , $ , , $ , , $ , $ $ , Beaumt-PT , ,
16 Tables Page 16 HOTEL/MOTEL PERFORMANCE BY METRO; FOURTH QUARTER Brownsville/Harlingen CHAIN $ , $ , , $ , , $ , , $ , , $ , , $ $ TOTAL , , $ , $ $ $ $ $ , $ $ $ $ $ TOTAL , ,
17 Tables Page 17 HOTEL/MOTEL PERFORMANCE BY METRO; FOURTH QUARTER Browns/Har $ , , $ , , $ , , $ , , $ , , $ , , $ , $ $ , $ $ Browns/Har , , College Station-Bryan CHAIN $ $ , , $ , , $ , $ , , $ , $ , , $ , TOTAL , , $ $ $ , $ $ $ $ $ TOTAL , ,
18 Tables Page 18 HOTEL/MOTEL PERFORMANCE BY METRO; FOURTH QUARTER ColSt-Brya $ , , $ , , $ , , $ , $ , , $ , $ , , $ , $ $ ColSt-Brya , , Corpus Christi CHAIN $ , , $ , , $ , , $ , , $ , , $ , , $ , TOTAL , , $ $ $ $ , $ $ , , $ , , $ $ $ TOTAL , ,
19 Tables Page 19 HOTEL/MOTEL PERFORMANCE BY METRO; FOURTH QUARTER Corpus Chr $ , , $ , , $ , , $ , , $ , , $ , , $ , , $ $ $ Corpus Chr , , Dallas Metropolitan Division CHAIN $ , , $ , , $ , , $ , , $ , , $ , , $ , , $ , , $ , , $ , , $ , , TOTAL , , , ,
20 Tables Page 20 HOTEL/MOTEL PERFORMANCE BY METRO; FOURTH QUARTER $ , , $ , , $ , $ , , $ , , $ $ , , $ , , $ , , $ $ , , TOTAL , , Dallas MD $ , , $ , , $ , , $ , , $ , , $ , , $ , , $ , , $ , , $ , , $ , , Dallas MD , , , ,
21 Tables Page 21 HOTEL/MOTEL PERFORMANCE BY METRO; FOURTH QUARTER Ft Worth-Arlington Metropolitan Division CHAIN $ , , $ , , $ , , $ , , $ , , $ , , $ , , $ , , $ , $ , , $ , , TOTAL , , , , $ , , $ , , $ , $ , $ $ $ , , $ $ $ $ TOTAL , ,
22 Tables Page 22 HOTEL/MOTEL PERFORMANCE BY METRO; FOURTH QUARTER Ft W-Arl M $ , , $ , , $ , , $ , , $ , , $ , , $ , , $ , , $ , $ , , $ , , Ft W-Arl M , , , , DALLAS/FT WORTH METROPOLITAN STATISTICAL AREA CHAIN $ , ,016 33, $ , , $ , , $ , , $ , , $ , , $ , , $ , , $ , , $ , , $ , , TOTAL , , , ,
23 Tables Page 23 HOTEL/MOTEL PERFORMANCE BY METRO; FOURTH QUARTER $ , , $ , , $ , , $ , , $ , , $ $ , , $ , , $ , , $ $ , , TOTAL , , TOTAL DFW $ ,390 44, ,417 43, $ , , $ , , $ , , $ , , $ , , $ , , $ , , $ , , $ , , $ , , TOTAL DFW , , , ,
24 Tables Page 24 HOTEL/MOTEL PERFORMANCE BY METRO; FOURTH QUARTER El Paso CHAIN $ , , $ , , $ , , $ , , $ , , $ , , $ , , $ , TOTAL , , $ , , $ $ , TOTAL , , El Paso $ , , $ , , $ , , $ , , $ , , $ , , $ , , $ , El Paso , ,
25 Tables Page 25 HOTEL/MOTEL PERFORMANCE BY METRO; FOURTH QUARTER Houston-Baytown-Sugar Land CHAIN $ , , $ , , $ , , $ , , $ , , $ , , $ , , $ , , $ , , $ , $ , , TOTAL , , , , $ , , $ , , $ , , $ , , $ , , $ , , $ , , $ , , $ , $ , , $ , , TOTAL , ,
26 Tables Page 26 HOTEL/MOTEL PERFORMANCE BY METRO; FOURTH QUARTER Hou-Bay-Su $ , , $ , , $ , , $ , , $ , , $ , , $ , , $ , , $ , , $ , , $ , , Hou-Bay-Su , , , , Killeen-Temple-Ft Hood CHAIN $ , , $ , , $ , , $ , , $ , , $ , TOTAL , , $ , , $ $ $ $ $ $ $ $ $ TOTAL , ,
27 Tables Page 27 HOTEL/MOTEL PERFORMANCE BY METRO; FOURTH QUARTER Kil-Tem-Ft $ , , $ , , $ , , $ , , $ , , $ , $ $ $ $ Kil-Tem-Ft , , Laredo CHAIN $ $ $ , , $ , , $ , $ $ , , TOTAL , , $ , $ , , $ $ TOTAL , ,
28 Tables Page 28 HOTEL/MOTEL PERFORMANCE BY METRO; FOURTH QUARTER Laredo $ , , $ , , $ , , $ , , $ , , $ $ , , Laredo , , Longview CHAIN $ $ $ , $ , $ , , $ , TOTAL , , $ , $ $ TOTAL , Longview $ , , $ $ , $ , $ , , $ , Longview , ,
29 Tables Page 29 HOTEL/MOTEL PERFORMANCE BY METRO; FOURTH QUARTER Lubbock CHAIN $ , , $ , $ , , $ , , $ , , $ , , $ , $ , TOTAL , , $ $ $ $ $ , TOTAL , , Lubbock $ , , $ , $ , , $ , , $ , , $ , , $ , $ , Lubbock , ,
30 Tables Page 30 HOTEL/MOTEL PERFORMANCE BY METRO; FOURTH QUARTER McAllen-Edinburg-Pharr CHAIN $ $ , , $ , , $ , , $ , , $ , , $ , , $ , , TOTAL , , $ , , $ , $ , $ $ $ TOTAL , , McAl-Ed-Ph $ , , $ , , $ , , $ , , $ , , $ , , $ , , $ , , $ $ McAl-Ed-Ph , ,
31 Tables Page 31 HOTEL/MOTEL PERFORMANCE BY METRO; FOURTH QUARTER Midland CHAIN $ $ $ $ , , $ , $ , $ $ , $ TOTAL , , $ $ $ $ TOTAL , , Midland $ , $ , , $ , $ , , $ , $ , $ $ , $ Midland , ,
32 Tables Page 32 HOTEL/MOTEL PERFORMANCE BY METRO; FOURTH QUARTER Odessa CHAIN $ $ $ $ , $ , $ $ , $ TOTAL , , $ $ $ $ , $ , TOTAL , , Odessa $ $ $ $ , $ , $ , $ , $ Odessa , ,
33 Tables Page 33 HOTEL/MOTEL PERFORMANCE BY METRO; FOURTH QUARTER San Angelo CHAIN $ $ $ $ $ , , $ TOTAL , , $ $ $ TOTAL San Angelo $ $ , $ , $ $ , , $ San Angelo , , San Antonio CHAIN $ , , $ , , $ , , $ , , $ , , $ , , $ , , $ , , $ , , $ , , $ , , TOTAL , , , ,
34 Tables Page 34 HOTEL/MOTEL PERFORMANCE BY METRO; FOURTH QUARTER $ , , $ $ , $ , $ , $ , , $ , $ , $ $ $ , , TOTAL , , San Antoni $ , , $ , , $ , , $ , , $ , , $ , , $ , , $ , , $ , , $ , , $ , , San Antoni , , , , Sherman/Denison CHAIN $ $ $ $ , $ TOTAL , ,
35 Tables Page 35 HOTEL/MOTEL PERFORMANCE BY METRO; FOURTH QUARTER $ $ $ $ $ $ TOTAL , , Shermn/Den $ $ $ $ , $ $ $ Shermn/Den , , Texarkana(TX) CHAIN $ $ $ $ $ , $ , $ TOTAL , , $ $ TOTAL
36 Tables Page 36 HOTEL/MOTEL PERFORMANCE BY METRO; FOURTH QUARTER Texarka(TX $ $ $ $ $ , $ , $ Texarka(TX , , Tyler CHAIN $ , $ , $ , $ , $ , , $ , TOTAL , , $ $ $ $ $ $ $ TOTAL
37 Tables Page 37 HOTEL/MOTEL PERFORMANCE BY METRO; FOURTH QUARTER Tyler $ , , $ , $ , , $ , $ , , $ , $ Tyler , , Victoria CHAIN $ $ $ $ , $ $ , TOTAL , , $ $ $ $ $ $ TOTAL , , Victoria $ , , $ , $ $ , $ $ , Victoria , ,
38 Tables Page 38 HOTEL/MOTEL PERFORMANCE BY METRO; FOURTH QUARTER Waco CHAIN $ , , $ , , $ , , $ , , $ , , $ , TOTAL , , $ $ TOTAL , , Waco $ , , $ , , $ , , $ , , $ , , $ , Waco , , Wichita Falls CHAIN $ , $ , $ , $ , , $ $ $ TOTAL , , $ TOTAL
39 Tables Page 39 HOTEL/MOTEL PERFORMANCE BY METRO; FOURTH QUARTER Wichita Fa $ , , $ , $ , $ , , $ $ $ Wichita Fa , , Non-Metro CHAIN $ , , $ , , $ , , $ , , $ , , $ , , $ , , $ , , $ TOTAL ,185 88, ,103 74, $ , , $ , , $ , , $ , , $ , , $ , , $ , , $ , , $ , $ $ , , TOTAL , ,
40 Tables Page 40 HOTEL/MOTEL PERFORMANCE BY METRO; FOURTH QUARTER Non-Metro $ , , $ , , $ , , $ , , $ , , $ , , $ , , $ , , $ , $ $ , , Non-Metro , , , ,
41 Tables Page 41 HOTEL/MOTEL PERFORMANCE BY METRO; FOURTH QUARTER TOTAL TEXAS CHAIN $ ,240 80, ,800 96, $ , , ,848 97, $ , , , , $ , , , , $ , , , , $ , , , , $ , , , $ , , $ , , $ , , $ , , TOTAL CHAIN 2, ,308 1,430, , ,034 1,170, ENDENTS $ ,892 59, , ,916 56, $ , , $ , , $ , , $ , , $ , , $ , , $ , , $ , , $ , , $ , , TOTAL 1, , , , , ,
42 Tables Page 42 HOTEL/MOTEL PERFORMANCE BY METRO; FOURTH QUARTER TOTAL TEXAS $ , , , , , , $ , , , , $ , , , , $ , , , , $ , , , , $ , , , , $ , , , , $ , , , $ , , $ , , $ , , TOT TEXAS 4, ,297 1,694, , ,395 1,375,
43
44
45
46

47
TEXAS HOTEL PERFORMANCE REPORT: FOURTH QUARTER AND YEAR OF
 February 28, 2009 Market Texas Tourism, Office of the Governor, Economic Development & Tourism TEXAS HOTEL PERFORMANCE REPORT: FOURTH QUARTER AND YEAR OF 2008 Texas lodging room revenues gained 8.5 percent
Research performed in cooperation with DOT, FHWA. Research Study Title: An Analysis of Commuting Patterns in Large Texas Urban Areas.
 TECHNICAL REPORT STANDARD TITLE PAGE t--~~----~--------~--------~-~c~.-.-----------=------------,-----,-...,..,....--r-.,,._,,,...,,...,...-,-=--=--=-----~------------------1 1. Report No. 2. Government
Change in the Early Childhood and School Age Population in Texas, 2000 to 2010, and Projected to 2015
 Change in the Early Childhood and School Age Population in Texas, 2000 to 2010, and Projected to 2015 Steve H. Murdock Michael Cline Debbie Perez George Hough September 2012 PO Box 1892, MS 202 Houston,
US LODGING INDUSTRY OVERVIEW. Jan D. Freitag Vice President SMITH TRAVEL RESEARCH
 US LODGING INDUSTRY OVERVIEW Jan D. Freitag Vice President SMITH TRAVEL RESEARCH Agenda Total US Overview Scales and Major Markets Pipeline Projections U.S. Lodging Industry - Key Statistics June 2008
DEALERS - STATE OF TEXAS
 DEALERS - STATE OF TEXAS 04/01/09 Updated 1. **American Tire Distributors # 551 9. **American Tire Distributors # 670 17. **Beasley Tire Service, Inc. 8308 Upland Avenue 2621 Lipan Street 12330 Eastex
DEALERS - STATE OF TEXAS
 DEALERS - STATE OF TEXAS 7/1/2011 Updated 1. **American Tire Distributors # 551 9. **American Tire Distributors # 670 17. **Beasley Tire Service, Inc. 8308 Upland Avenue 2621 Lipan Street 12330 Eastex
US LODGING INDUSTRY OVERVIEW. Vail R. Brown Vice President of Global Sales & Marketing
 US LODGING INDUSTRY OVERVIEW Vail R. Brown Vice President of Global Sales & Marketing Global RevPAR % Change UK H1 8 YE 8 L3M 9 YTD 2.5%.4% 1.2% 11.3% United States $ H1 8 YE 8 L3M 9 YTD 1.6% 1.9% 14.3%
SPEED ZONING ON TEXAS HIGHWAYS
 SPEED ZONING ON TEXAS HIGHWAYS Where do speed zones come from? How do they come up with speed limits? Questions like this are common in the minds of most citizens when it comes to highway speed limits,
Used Vehicle Supply: Future Outlook and the Impact on Used Vehicle Prices
 Used Vehicle Supply: Future Outlook and the Impact on Used Vehicle Prices AT A GLANCE When to expect an increase in used supply Recent trends in new vehicle sales Changes in used supply by vehicle segment
2013 Attorney Population Density by Metropolitan Statistical Area ATTORNEY POPULATION DENSITY BY METROPOLITAN STATISTICAL AREA
 STATE BAR OF TEXAS DEPARTMENT OF RESEARCH & ANALYSIS ATTORNEY POPULATION DENSITY BY METROPOLITAN STATISTICAL AREA 2013-14 For more information, contact: State Bar of Department of Research and Analysis
U.S. Rail Crude Oil Traffic
 U.S. Rail Crude Oil Traffic Association of American Railroads May 217 Summary U.S. crude oil production has risen sharply in recent years, with much of the increased output moving by rail. In 28, U.S.
Individual and Family Health Insurance Rates
 Individual and Family Health Insurance Rates New Business Rates Effective January 1, 2018 * *rates subject to change A Division of Health Care Service Corporation, a Mutual Legal Reserve Company, an Independent
TxDOT Project : Pilot Implementation of a Web-based GIS System to Provide Information for Pavement Maintenance Decision- Making
 5-9035-01-P5 A FOUR-YEAR PAVEMENT MANAGEMENT PLAN (FY 2011 FY 2014) Authors: Wenxing Liu Sunny Jaipuria Mike Murphy Zhanmin Zhang TxDOT Project 5-9035-01: Pilot Implementation of a Web-based GIS System
US Lodging Industry Overview. Amanda W. Hite President STR
 US Lodging Industry Overview Amanda W. Hite President STR Agenda Total US Review Scales Segmentation Pipeline 2012 / 2013 Forecast Total US Review Supply / Demand Drive Results. Pricing Power Is Back (?)
San Diego Auto Outlook
 Covering First Quarter 2014 Volume 14, Number 2 Comprehensive information on the San Diego County new vehicle market FORECAST County New Vehicle Market Up 6.7% in First Quarter of 2014 Registrations predicted
The U.S. Economic Recovery: Chain Scale Segments, Top 25 Markets, Demand Segments and Profits
 NEW YORK UNIVERSITY School of Continuing and Professional Studies Preston Robert Tisch Center for Hospitality, Tourism, and Sports Management The U.S. Economic Recovery: Chain Scale Segments, Top 25 Markets,
U.S. Rail Crude Oil Traffic
 U.S. Rail Crude Oil Traffic Association of American Railroads November 215 Summary U.S. crude oil production has risen sharply in recent years, with much of the increased output moving by rail. In 28,
Transaction Trend. United States. Report Q LE s Real Estate Intelligence is Your Strategic Advantage
 Sa m pl e Q4 2016 United States Transaction Trend Report LE s Real Estate Intelligence is Your Strategic Advantage Lodging Econometrics 500 Market Street, Suite 13 Portsmouth, NH 03801-3481 USA +1 603.427.9542
Sanitation Services Proposed FY11 Budget. Council Briefing
 Sanitation Services Proposed FY11 Budget Council Briefing August 23, 2010 What does Sanitation do? Serve Dallas single-family residences by collecting residential waste and recyclables Cost of service
ALG July/August 2011 Edition Report
 ALG July/August 2011 Edition Report ALG July/August 2011 Edition Report Introduction: For the July/August 2011 edition, ALG has updated both gas price and used supply outlook to reflect the latest available
U.S. Classes 3-8 Used Trucks
 Americas Commercial Transportation Research Co., LLC www.actresearch.net COMMERCIAL VEHICLES State of the Industry U.S. Classes 3-8 Used Trucks May 215 Data Published June 24, 215 Contributor to Blue Chip
Figure 1 Unleaded Gasoline Prices
 Policy Issues Just How Costly Is Gas? Summer 26 Introduction. Across the nation, the price at the pump has reached record highs. From unleaded to premium grade, prices have broken three dollars per gallon
Sanitation Services Proposed FY11 Budget. Council Briefing
 Sanitation Services Proposed FY11 Budget Council Briefing August 18, 2010 What does Sanitation do? Serve Dallas single-family residences by collecting residential waste and recyclables Cost of service
Travel and Tourism in Malaysia to 2017
 Published on Market Research Reports Inc. (https://www.marketresearchreports.com) Home > Travel and Tourism in Malaysia to 2017 Travel and Tourism in Malaysia to 2017 Publication ID: TMC0513014 Publication
GROWTH IN TENTH DISTRICT MANUFACTURING ACTIVITY EDGED HIGHER Federal Reserve Bank of Kansas City Releases September Manufacturing Survey
 FOR RELEASE Thursday, September 25, 2014 EMBARGOED FOR 10 A.M. CENTRAL TIME CONTACT: Pam Campbell 405-270-8617 Pam.Campbell@kc.frb.org GROWTH IN TENTH DISTRICT MANUFACTURING ACTIVITY EDGED HIGHER Federal
State of the Industry: U.S. Classes 3-8 Used Trucks
 Americas Commercial Transportation Research Co., LLC www.actresearch.net State of the Industry: U.S. Classes 3-8 Used Trucks November 212 Data Published December 24, 212 State of the Industry: U.S. Classes
GROWTH IN TENTH DISTRICT MANUFACTURING ACTIVITY EXPANDED SOLIDLY Federal Reserve Bank of Kansas City Releases May Manufacturing Survey
 FOR RELEASE Thursday, May 22, 2014 EMBARGOED FOR 10 A.M. CENTRAL TIME CONTACT: Pam Campbell 405-270-8617 Pam.Campbell@kc.frb.org GROWTH IN TENTH DISTRICT MANUFACTURING ACTIVITY EXPANDED SOLIDLY Federal
Valero History 1980s Started out in the natural gas industry Grew to become the largest intrastate pipeline in Texas
 Valero History 1980s Started out in the natural gas industry Grew to become the largest intrastate pipeline in Texas 6th-largest supplier of natural gas liquids in the U.S. Built Valero Corpus Christi
BLACK KNIGHT HPI REPORT
 CONTENTS 1 OVERVIEW 2 NATIONAL OVERVIEW 3 LARGEST STATES AND METROS 4 MARCH S BIGGEST MOVERS 5 20 LARGEST STATES 6 40 LARGEST METROS 7 ADDITIONAL INFORMATION OVERVIEW Each month, the Data & Analytics division
Swapalease.com Auto Lease Trends Report 3rd Quarter A snapshot of the auto lease industry
 Swapalease.com Auto Lease Trends Report 3rd Quarter 2017 A snapshot of the auto lease industry 1 About The Report Swapalease.com studies lease market trends and consumer insights each quarter. In order
N ational Economic Trends
 N ational Economic Trends The Delayed Recovery of Employment Real gross domestic product has been increasing since the first quarter of 1991 and passed its prerecession level in the third quarter of 1992.
FISCAL YEAR MARCH 2015 FIRST HALF FINANCIAL RESULTS. New Mazda Demio
 FISCAL YEAR MARCH 2015 FIRST HALF FINANCIAL RESULTS New Mazda Demio Mazda Motor Corporation October 31, 2014 1 PRESENTATION OUTLINE Highlights Fiscal Year March 2015 First Half Results Fiscal Year March
North American Machine Vision Market Update
 North American Machine Vision Market Update Alex Shikany AIA Director of Market Analysis February 20-22, 2013 Orlando World Marriott Center Orlando, Florida USA Table of Contents I. U.S. Economy II. Manufacturing
GoToBermuda.com. Q3 Arrivals and Statistics at September 30 th 2015
 Q3 Arrivals and Statistics at September 30 th 2015 1 Q3 Total Vacation Visitor Arrivals Q3 Arrivals 2014 2015 YTD 2014 YTD 2015 Air - Vacation 54,305 54,473 0.31% 168 117,639 116,700-0.80% (939) Cruise
QUARTERLY REVIEW OF BUSINESS CONDITIONS: NEW MOTOR VEHICLE MANUFACTURING INDUSTRY / AUTOMOTIVE SECTOR: 2 nd QUARTER 2018
 NATIONAL ASSOCIATION OF AUTOMOBILE MANUFACTURERS OF SOUTH AFRICA GROUND FLOOR, BUILDING F ALENTI OFFICE PARK 457 WITHERITE STREET, THE WILLOWS, X82 PO BOX 74166, LYNNWOOD RIDGE. 0040 TELEPHONE: (012) 807-0152
BMW Group posts record earnings for 2010
 10.03.2011 BMW Group posts record earnings for 2010 Profit before tax rises to euro 4,836 million Profit before financial result climbs to euro 5,094 million Automobiles segment reports EBIT of euro 4,355
TENTH DISTRICT MANUFACTURING SURVEY REBOUNDED MODERATELY Federal Reserve Bank of Kansas City Releases January Manufacturing Survey
 FOR RELEASE Thursday, January 23, 2014 EMBARGOED FOR 10 A.M. CENTRAL TIME CONTACT: Bill Medley 816-881-2556 Bill.Medley@kc.frb.org TENTH DISTRICT MANUFACTURING SURVEY REBOUNDED MODERATELY Federal Reserve
Record P6.1 billion profit for Bloomberry Highest gaming volumes, revenues, EBITDA since opening
 Record P6.1 billion profit for Bloomberry Highest gaming volumes, revenues, EBITDA since opening Highlights: New all-time highs with Solaire s VIP volumes growing 11% while mass table drop and electronic
Aging of the light vehicle fleet May 2011
 Aging of the light vehicle fleet May 211 1 The Scope At an average age of 12.7 years in 21, New Zealand has one of the oldest light vehicle fleets in the developed world. This report looks at some of the
MARKET REPORT. Brenna Buehler. Senior Manager, Public Relations
 Blue Book MARKET REPORT Andrew Nicolai Director, Public Relations 949.293.5241 andrew.nicolai@coxautoinc.com Brenna Buehler Senior Manager, Public Relations 909.225.4643 brenna.buehler@coxautoinc.com IN
National Health Expenditure Projections
 National Health Expenditure Projections 2009-2019 Forecast Summary In 2009, NHE is projected to have reached $2.5 trillion and grown 5.7 percent, up from 4.4 percent in 2008, while the overall economy,
Wholesale Market Insights Through March J o n a t h a n S m o k e & Zo R a h i m - C o x A u t o m o t i v e
 Wholesale Market Insights Through March 2018 J o n a t h a n S m o k e & Zo R a h i m - C o x A u t o m o t i v e T R A N S F O R M I N G T H E W A Y T H E W O R L D B U Y S, S E L L S & O W N S C A R
Metropolitan Council Budget Overview SFY
 Metropolitan Council Budget Overview SFY 2016-2017 H T t ti C itt House Transportation Committee February 4, 2015 Transit connects us to the places that matter Transportation Needs Grow as the Region Grows
Maryland Auto Outlook
 Covering First Quarter 2015 Volume 20, Number 2 Sponsored by: Maryland Automobile Dealers Association TM FORECAST Market Posts Increase in First Quarter of 2015 3.1% improvement predicted for entire year
TEXAS DEPARTMENT OF TRANSPORTATION
 TEXAS DEPARTMENT OF TRANSPORTATION SPECIFICATION NO. * FUEL, GASOLINE AND DIESEL PUBLICATION This specification is a product of the Texas Department of Transportation (TxDOT). This specification may not
Corporate Communications. Media Information 15 March 2011
 15 March 2011 BMW Group aims to further increase earnings in 2011 EBIT margin of over 8% expected in Automobiles segment Sales volume of well in excess of 1.5 million vehicles targeted Margin of 8% to
Caltex Australia comments on Carbon Pollution Reduction Scheme White Paper February 2009
 Caltex Australia comments on Carbon Pollution Reduction Scheme White Paper February 2009 Upstream Point of Liability - Fuel Tax Package Outline of scheme The Carbon Pollution Reduction Scheme (CPRS) White
Third Quarter 2018 Performance and Business Update. October 24, 2018
 Third Quarter 2018 Performance and Business Update October 24, 2018 1 Important Notice Please read this management presentation together with the Company s press release issued earlier today announcing
Swapalease.com Auto Lease Trends Report 2nd Quarter A snapshot of the auto lease industry
 Swapalease.com Auto Lease Trends Report 2nd Quarter 2017 A snapshot of the auto lease industry 1 About The Report Swapalease.com studies lease market trends and consumer insights each quarter. In order
HOUSING REPORT NORTHWEST MICHIGAN YEAR END 2018
 NORTHWEST MICHIGAN Northwest Michigan 218 Highlights Waterfront Non-Waterfront : dropped 2% from last year to the lowest level in the past 4 years : had a slight decline of 3% from the prior year. Average
FOR IMMEDIATE RELEASE
 Article No. 7433 Available on www.roymorgan.com Roy Morgan Unemployment Profile Friday, 12 January 2018 2.6m Australians unemployed or under-employed in December The latest data for the Roy Morgan employment
JULY 2009 REPORT: THE HOTEL INDUSTRY IS NOT OUT OF THE WOODS YET
 JULY 2009 REPORT: THE HOTEL INDUSTRY IS NOT OUT OF THE WOODS YET LAUNCH OF THE PEGASUS VIEW Pegasus Solutions, the world s largest single processor of electronic hotel transactions, will begin releasing
RVI RISK OUTLOOK RVI G R O U P. Forecast at a Glance. Our Experience is Your Assurance
 RVI G R O U P Our Experience is Your Assurance RVI RISK OUTLOOK Quarterly Analysis of Key Issues and Trends in Consumer Leasing December 2017 Forecast at a Glance Key economic indicators signal that the
Factory activity accelerated further in our region this month, posting its highest composite reading since 2011, said Wilkerson.
 FOR RELEASE Thursday, October 26, 17 EMBARGOED FOR A.M. CENTRAL TIME CONTACT: Pam Campbell 45-27-8617 Pam.Campbell@kc.frb.org TENTH DISTRICT MANUFACTURING ACTIVITY POSTS STRONG GROWTH Federal Reserve Bank
Research performed in cooperation with DOT, UMTA. Research Study Title: The Cost and Benefits of Urban Public Transit in Texas.
 1. Report No. 2. Government Accession No. 3. Reeipient's Catalog No. UMTA/TX-90/2003-lF TECHNICAL REPORT STANDARD TITLE PAGE 4. Title and Subtitle The Cost and Benefits of Urban Public Transit in Texas
Hotel Performance Outlook North Dakota Travel Industry Conference
 Hotel Performance Outlook North Dakota Travel Industry Conference Kelsey Waite Business Development Executive, Destinations kwaite@str.com @Kelsey_STR 2017 STR, Inc. All Rights Reserved. Any reprint, use
 Page 1 sur 5 17.03.2010 BMW Group plans sharp increase in group earnings Visible progress in 2010 towards profitability targets for 2012 Volume growth in solid single-digit percentage range targeted Munich.
Manitoba Economic Highlights
 Economic Overview Real Gross Domestic Product The Manitoba Bureau of Statistics estimates that Manitoba s real GDP grew 1.9% in 2016, above the national average of 1.4%. Manitoba s real GDP is expected
'08 '09 '10 '11 '12 '13 '14 '15 '16 '17 '18* Years Historical data source: IHS
 Comprehensive information on the California vehicle market Volume 14, Number 4 Released November 2018 Covering Third Quarter 2018 TM Publication Sponsored By: New Vehicle Registrations in State To Approach
Steel Industry Outlook Federal Reserve Bank of Chicago December Robert J. DiCianni Mittal Steel USA. Mittal Steel Company
 Steel Industry Outlook Federal Reserve Bank of Chicago December 2005 Robert J. DiCianni Mittal Steel USA 1 Outline Overall Outlook End Market Outlook 2006 Forecast Steel Demand Prices Inputs and other
Automotive Industry. Slovakia. EHSK Analysts team Peter Kellich and Andrej Krokoš. April 2017
 Automotive Industry Slovakia EHSK Analysts team Peter Kellich and Andrej Krokoš April 2017 Overview: Automotive industry in Slovakia key facts Demand context and actual situation Trade-restrictions-related
Maryland Auto Outlook
 Covering First Quarter 2017 Volume 22, Number 2 Sponsored by: Maryland Automobile Dealers Association TM FORECAST Market Has Small Increase in 1Q 17 vs. Strong 1Q 16 New vehicle registrations predicted
Wholesale Market Insights Through June J o n a t h a n S m o k e & Zo R a h i m - C o x A u t o m o t i v e
 Wholesale Market Insights Through June 2018 J o n a t h a n S m o k e & Zo R a h i m - C o x A u t o m o t i v e T R A N S F O R M I N G T H E W A Y T H E W O R L D B U Y S, S E L L S & O W N S C A R S
Texas ranks No. 6 na*onally for automo*ve manufacturing employment. - U.S. Bureau of Labor Sta0s0cs (2010)
") Texas ranks No. 6 na*onally for automo*ve manufacturing employment - U.S. Bureau of Labor Sta0s0cs (2010) Texas Automo,ve Manufacturing Employment Top Automo0ve Manufacturing Employers In Texas (2011)
Texas ranks No. 6 na*onally for automo*ve manufacturing employment - U.S. Bureau of Labor Sta0s0cs (2010) Texas Automo,ve Manufacturing Employment Top Automo0ve Manufacturing Employers In Texas (2011)
SAA Financial Results 2008/09. Building on Restructuring
 SAA Financial Results 2008/09 Building on Restructuring 1 Content 1. Industry, Strategic and Operational Overview 2. Financial Overview 3. Conclusion and Way Forward 2 Industry Overview The airline industry
Jarrell Independent School District
 Jarrell Independent School District Demographic Study January 22 nd, 2014 Learn from Yesterday Understand Today Plan for Tomorrow Economic Conditions From 2000 to 2013, Texas outperformed the U.S. job
FOURTH QUARTER OF Copyrights Statistics Botswana 2019
 STATISTICS BOTSWANA GROSS DOMESTIC PRODUCT FOURTH QUARTER OF 2018 Copyrights 2019 Private Bag 0024, Gaborone. TOLL FREE NUMBER: 0800600200 Tel: ( +267) 367 1300Fax: ( +267) 395 2201 E-mail: info@statsbots.org.bw
Bloomberry sustains turnaround story P5.7 billion swing leads to P2.2 billion net profit
 Bloomberry sustains turnaround story P5.7 billion swing leads to P2.2 billion net profit Highlights: Solaire achieved record gaming volumes and revenues Solaire s VIP volumes grew 29 percent, while mass
FISCAL YEAR MARCH 2014 FINANCIAL RESULTS
 FISCAL YEAR MARCH 214 FINANCIAL RESULTS Mazda CX-5 Mazda Atenza Mazda Motor Corporation April 25, 214 New Mazda Axela 1 PRESENTATION OUTLINE Highlights Fiscal Year March 214 Results Fiscal Year March 215
Kiwanis International
 Page 1 of 14 Texas-Oklahoma 01 Division 1 K12247 Burleson TX 12 12 12 12 11 12 12 12 12 13 8.33 +1 K02602 Cleburne TX 13 13 13 14 14 14 14 14 14 15 15.38 +2 K00044 Fort Worth TX 20 21 21 21 21 21 21 21
STATISTICS BOTSWANA. GROSS DOMESTIC PRODUCT First Quarter 2018
 STATISTICS BOTSWANA GROSS DOMESTIC PRODUCT First Quarter 2018 Copyrights 2018 Private Bag 0024, Gaborone. TOLL FREE NUMBER: 0800600200 Tel: ( +267) 367 1300Fax: ( +267) 395 2201 E-mail: info@statsbots.org.bw
Bob Costello Chief Economist & Vice President American Trucking Associations. Intermodal Freight Transportation Institute October 30, 2012
 Bob Costello Chief Economist & Vice President American Trucking Associations Intermodal Freight Transportation Institute October 30, 2012 U.S. Economic Summary Fiscal Cliff Eurozone Problems U.S. Elections
Swapalease.com Auto Lease Trends Report 4th Quarter A snapshot of the auto lease industry
 Swapalease.com Auto Lease Trends Report 4th Quarter 2017 A snapshot of the auto lease industry 1 About The Report Swapalease.com studies lease market trends and consumer insights each quarter. In order
REPORT CARD FOR CALIFORNIA S INFRASTRUCTURE WHAT YOU SHOULD KNOW ABOUT CALIFORNIA S TRANSIT FACILITIES
 TRANSIT GRADE: C- WHAT YOU SHOULD KNOW ABOUT TRANSIT FACILITIES California needs robust, flexible and reliable transit systems to reduce peak congestion on our highways, provide options for citizens who
QUARTERLY REVIEW OF BUSINESS CONDITIONS: MOTOR VEHICLE MANUFACTURING INDUSTRY / AUTOMOTIVE SECTOR: 4 TH QUARTER 2016
 NATIONAL ASSOCIATION OF AUTOMOBILE MANUFACTURERS OF SOUTH AFRICA GROUND FLOOR, BUILDING F ALENTI OFFICE PARK 457 WITHERITE ROAD, THE WILLOWS, X82 PRETORIA PO BOX 40611, ARCADIA 0007 TELEPHONE: (012) 807-0152
Economics 53 Assignment: Interpreting the new GDP numbers.
 Economics 53 Assignment: Interpreting the new GDP numbers. Attached is the first estimate for 2016 Gross Domestic Product, released on January 27, 2017, at 5:30 AM. This shows that real GDP growth was
Swapalease.com Auto Lease Trends Report 4 th Quarter A snapshot of the auto lease industry
 Swapalease.com Auto Lease Trends Report 4 th Quarter 2016 A snapshot of the auto lease industry 1 About The Report Swapalease.com studies lease market trends and consumer insights each quarter. In order
CONSUMER TIRE REPORT APRIL Consumer Tires
 Consumer Tires President Obama announced in September of 2009 the imposition of special safeguard relief for the domestic passenger car and light truck tire industry and its workers who had been seriously
How Old Cars And New Solutions Will Impact Our Industry
 How Old Cars And New Solutions Will Impact Our Industry New Car Market Trends Watch the Used Car Market Tariffs and Other Concerns The Evolution of Mobility 1 2018 MID-YEAR REVIEW TRANSFORMING THE WAY
FISCAL YEAR MARCH 2014 FIRST HALF FINANCIAL RESULTS. New Mazda Axela (Overseas name: New Mazda3)
") FISCAL YEAR MARCH 2014 FIRST HALF FINANCIAL RESULTS New Mazda Axela (Overseas name: New Mazda3) Mazda Motor Corporation October 31, 2013 1 PRESENTATION OUTLINE Highlights Fiscal Year March 2014 First Half
FISCAL YEAR MARCH 2014 FIRST HALF FINANCIAL RESULTS New Mazda Axela (Overseas name: New Mazda3) Mazda Motor Corporation October 31, 2013 1 PRESENTATION OUTLINE Highlights Fiscal Year March 2014 First Half
Released: December 2018 Covering data thru November YTD 18 thru November % Change In New Retail Market vs. Year Earlier
 Released: December 2018 Covering data thru November 2018 Chicago Auto Outlook Comprehensive information on the Chicagoland automotive market TM Publication Sponsored by: YTD 18 thru November % Change In
Third Quarter Results (ended December 31, 2013)
") Fiscal Year 213 (ending March 31, 214) Third Quarter Results (ended December 31, 213) Brother Industries, Ltd. February 4, 214 Information on this report, other than historical facts, refers to future
Fiscal Year 213 (ending March 31, 214) Third Quarter Results (ended December 31, 213) Brother Industries, Ltd. February 4, 214 Information on this report, other than historical facts, refers to future
GROSS DOMESTIC PRODUCT
 GROSS DOMESTIC PRODUCT No. 2014/1 FOURTH QUARTER OF 2013 STATISTICS BOTSWANA Copyrights C Statistics Botswana 2014 March 2014 Statistics Botswana. Private Bag 0024 Botswana Tel: (267) 367 1300. Fax: (267)
BMW Group Corporate Communications
 14 March 2007 BMW Group to continue its successful course in 2007 Best year in company s history expected in operating terms Sales volume expected to rise to new record level Munich. The BMW Group plans
RVI RISK OUTLOOK RVI G R O U P. Forecast at a Glance. Our Experience is Your Assurance
 RVI G R O U P Our Experience is Your Assurance RVI RISK OUTLOOK Quarterly Analysis of Key Issues and Trends in Consumer Leasing September 2017 Forecast at a Glance Key economic indicators signal that the
AMAG posts record shipments in 2013; dividend recommendation of 0.60 EUR per share unchanged on last year
 Ranshofen, 28 February 2014 AMAG posts record shipments in 2013; dividend recommendation of 0.60 EUR per share unchanged on last year Shipments at an all-time high of 351,700 tonnes (t) in 2013, compared
Spring forecasts : a tough 2009, but EU economy set to stabilise as support measures take effect
 IP/09/693 Brussels, 4 May 2009 Spring forecasts 2009-2010: a tough 2009, but EU economy set to stabilise as support measures take effect In the Commission's spring forecast, GDP in the European Union is
U.S. Solar Market Insight 2012 Year-In-Review
 2012 SEIA 2012 SEIA U.S. Solar Market Insight 2012 Year-In-Review Justin Baca Director of Research Solar Energy Industries Association Andrew Krulewitz Solar Analyst GTM Research 2012 SEIA About SEIA Founded
The Russian building market
 The Russian building market Despite remaining in recession, the Russian economy began to show the first signs of improvement in 2016 (GDP -0.6% following the sharp -3.7% downturn in 2015). According to
Monthly Economic Letter
 Monthly Economic Letter Cotton Market Fundamentals & Price Outlook RECENT PRICE MOVEMENT Benchmark prices were flat or slightly higher over the past month. Prices for the May NY futures contract increased
SOLID WASTE SERVICES. City Council Budget Workshop August 2012
 SOLID WASTE SERVICES City Council Budget Workshop August 2012 SANITATION DIVISION Pick up garbage twice a week for 55,000 residents using 24 automated units per day and 3 rear loaders 5,720,000 Garbage
About Roadlux. About Omni United USA
 About Roadlux Roadlux tires are manufactured by the first all-steel truck radial tire production facility in China. Tires are manufactured under technical collaboration from Dunlop, UK. The machines that
I m Tetsuji Yamanishi, Corporate Officer at TDK. Thank you for taking the time to attend TDK s performance briefing for the fiscal year ended March
 I m Tetsuji Yamanishi, Corporate Officer at TDK. Thank you for taking the time to attend TDK s performance briefing for the fiscal year ended March 2016. I will be presenting an overview of our consolidated
Drive Market Share Gains - Automotive Industry Insights: Q4, 2010
 Drive Market Share Gains - Automotive Industry Insights: Q4, 2010 Jeffrey Anderson, Director of Consulting & Analytics 2011 Experian Information Solutions, Inc. All rights reserved. Experian and the marks
This is a licensed product of AM Mindpower Solutions and should not be copied
 1 TABLE OF CONTENTS 1. Indian Automobile Market Introduction 9 2. Indian Automobile Market Size, FY 2006-2011.10 3. Indian Auto-Components Industry Introduction.13 3.1. Indian Auto-Components Industry
STAFF REPORT CITY COUNCIL MEETING SEPTEMBER 15, 2015
 SHED BUSINESS a "making a positive difference now" TO: FROM: RE: STAFF REPORT CITY COUNCIL MEETING SEPTEMBER 15, 2015 Honorable Mayor and City Council Nancy Kerry, City Manager Discussion and Possible
Where are the Increases in Motorcycle Rider Fatalities?
 Where are the Increases in Motorcycle Rider Fatalities? Umesh Shankar Mathematical Analysis Division (NPO-121) Office of Traffic Records and Analysis National Center for Statistics and Analysis National
 Texas is one of the fastest growing states in the country, and Fort Worth and Tarrant County are among the fastest growing places in Texas. The T has taken important steps to improve transit service to
HOUSING REPORT SOUTHEAST MICHIGAN 2ND QUARTER 2018
 SOUTHEAST MICHIGAN 2ND QUARTER 218 Southeast Michigan Curb Appeal for Added Value Curb appeal plays a significant role in getting your home ready to sell. Among Realtors, 94% have suggested that sellers
MONRO MUFFLER BRAKE, INC. PROVIDES FOURTH QUARTER AND FISCAL 2017 FINANCIAL RESULTS
 CONTACT: John Van Heel Chief Executive Officer (585) 647-6400 Robert Gross Executive Chairman (585) 647-6400 FOR IMMEDIATE RELEASE Brian D Ambrosia Senior Vice President Finance Chief Financial Officer