BCA Benefits and Assumptions Summary
|
|
|
- Bruno Lambert Edwards
- 5 years ago
- Views:
Transcription
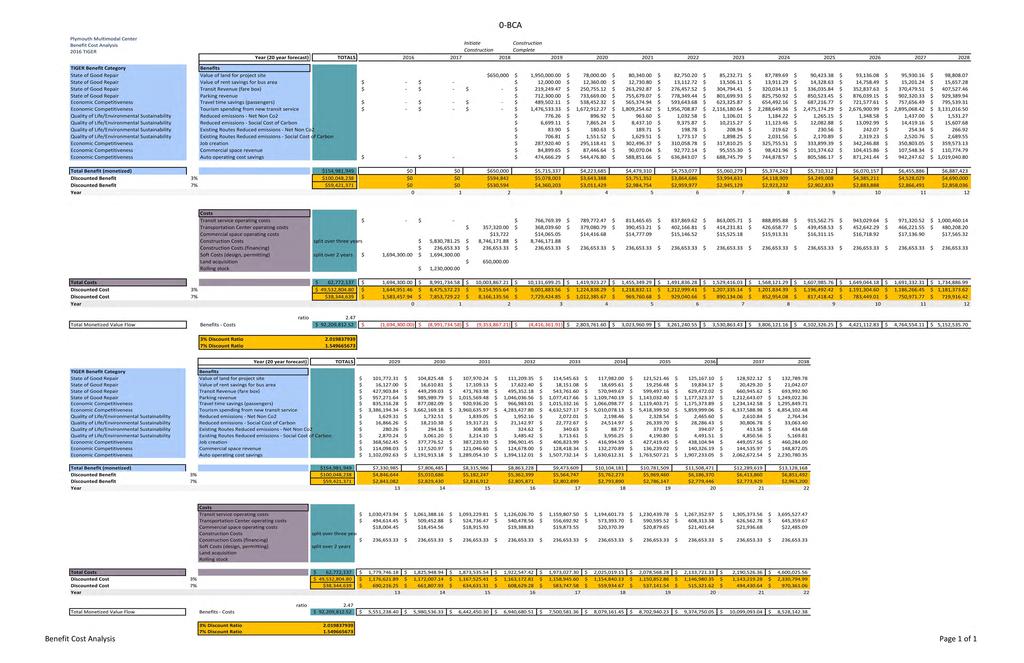
1 2016 TIGER Application - Plymouth Multimodal BCA Benefits and Assumptions Summary The Plymouth Multimodal generates a variety of benefits, ranging from monetary such as increased transit fare revenue, to social such as reduced emissions. Accounting for various costs that are realized over a 20-year period involves making assumptions based on current available data and anticipated trends over time. The bulk of the calculation of benefits in the BCA is based on the assumed growth of GATRA ridership due to the improved Plymouth Multimodal, and the four new routes made possible through the Project. As a result of the Project, existing GATRA routes will become more attractive to riders, increasing ridership on existing routes. The combination of net new riders to existing routes, and riders of new routes, serves as a base for calculating the following benefits: Transit revenue Travel time savings Tourism spending Reduced Emissions Net Non CO2 Reduced Emissions Social Cost of Carbon Auto operating cost savings The increase in transit riders on each route were developed based on annual transit riders on the four existing routes, with data provided by GATRA. The new ridership for the three proposed routes is based on daily one-way person trips and operating days per year, with data also provided by GATRA and the Southeastern Regional Planning and Economic Development District (SRPEDD) - the regional planning agency serving GATRA. The annual ridership for each existing route was grown at 5% per year for a no build scenario. For a build scenario ridership was grown by 10% for the first two years after the completion of construction in 2019, and 5% thereafter. Operating costs and revenues associated with the Project were developed by Project partners in consultation with MassDevelopment, and are included in the BCA. Assumptions regarding parking revenue, operating costs, and other factors are preliminary and will be refined as the Project progresses, but are appropriate for the 30 percent design level. Assumptions and sources for the benefits are provided below. 1
2 2016 TIGER Application - Plymouth Multimodal Criteria Benefit(s) Inputs Assumptions Value of Land The town of Plymouth is donating the land for the project site State of Good Repair Value of Rent Savings for bus area GATRA will not pay rent for the 600 SF passenger waiting area Transit Revenue Growth in riders will generate additional farebox revenue Existing lot value of Memorial Drive Parking lot Value of property upon project completion Net annual increase in property Value of GATRA Lease Annual rent increase Assumed fare box revenue in 2019 Net new transit riders for existing routes and new transit riders on new routes $650,000 value of Memorial Drive parking lot based on 2012 Site Selection Study, Appendix J Financial Feasibility, plus appreciation of 3% per year from 2011 when estimate was made, to 2015 when Project cost estimate was established. This cost is addressed as an in-kind donation by the Town of Plymouth as a Project Partner Multiplier of four used for improved value of property, based on Franklin Regional Transit, Greenfield, MA case study. Property value appreciation at 3%/year. Net increase included as a benefit 600 SF passenger waiting area Value of rent saved is estimated to be $20/SF, or $12,000 in the first year (MassDevelopment Proforma for commercial space) Annual rent increase of 3%/year 2014 GATRA fare is $1.00 and fare is assumed to be $1.25 at project completion in 2019 Fare increase of 5% every 5 years Fare structure provided by GATRA Economic Competitiveness Parking Revenue Additional parking will increase revenue Travel time savings 1. Increased route efficiency saves passenger time due to ease of transfer Gross revenues from parking garage and new Court Street area meters Annual increase in revenue Value of travel time savings Net new riders on existing routes and new riders on proposed routes Gross parking revenues based on PGCD and Mass Development Operating Proforma Total revenue of $712,300 in first year Annual increase of 3%/year Travel time savings determined based on the amount of time saved by riding a bus vs. walking a route, based on average driving and walking speeds. 2
3 2016 TIGER Application - Plymouth Multimodal 2. New routes provide people with the choice of riding transit over walking, which will reduce their travel time, particularly between the waterfront and uphill locations on Court Street. Assumed one mile (.3 hours) is saved by using the seasonal circulator Assumed 10 minutes (.17 hours) saved for riders on existing routes Value of travel time based on TIGER BCA Resource Guide at $13.00 per hour for all local travel purposes Tourism spending from new transit service Downtown Plymouth will be made more accessible to people who will spend more money on retail goods and at attractions New transit riders on Seasonal Circulator Number of visitors to downtown Plymouth Amount of time spent in downtown Plymouth Retail expenditures and the value of tourism expenditure per site Increase per year in spending The Seasonal Circulator route is expected to increase tourism spending. Other routes may also increase tourism spending, but are not included in the BCA due to qualitative benefits. Assumed 6,667 daily visitors to downtown Plymouth based on 1,000,000 visitors to downtown attractions per year and a tourist season of five months, or 150 days (Plymouth 400) Assumed three hour stay in downtown Plymouth (based on Plymouth Convention and Visitor s Bureau s (PCCV) data) of four-hour average stays in Plymouth. The four hours may include sites away from downtown, such as Plymouth Plantation, so a three hour stay downtown was assumed for this calculation. Assumed 30% of visitors arrive by bus, based on estimates by PCCV. These visitors are dependent on local transit provided by GATRA, pedestrian and bicycle amenities provided by the Project. Expenditures based on a $6.00 average price of adult admission to 6 main attractions and average expenditure of $25.00 at retail locations, based on Plymouth 400 estimates. 3% increase in spending per year Quality of Life/ Environmental Sustainability Reduced emissions Net Non Co2 from new transit routes Total Emissions Value of VOC Savings Total Emissions Value of NOx Savings Summer reduction of VOC and NOx per year in kg, estimated based on daily person trips by route (from Southeastern Regional Planning and Economic Development District (SRPEDD)) 3
4 2016 TIGER Application - Plymouth Multimodal Improved air quality is a social benefit and will enhance quality of life for residents and tourists Reduced emissions Net Non Co2 from additional riders on existing routes Improved air quality is a social benefit and will enhance quality of life for residents and tourists Reduced emissions Social cost of carbon from new routes Improved air quality is a social benefit and will enhance quality of life for residents and tourists Reduced emissions Social cost of carbon from additional riders on existing routes Improved air quality is a social benefit and will enhance quality of life for residents and tourists Total Emissions Value of VOC Savings Total Emissions Value of NOx Savings Total Emissions value of winter CO2 and Summer CO2 Social cost of carbon discount rate Total Emissions value of winter CO2 and Summer CO2 Social cost of carbon discount rate extrapolated for 20 years and SRPEDD CMAQ New Bus Service Air Quality Analysis worksheet developed in 2015 VOC and NOx value per short ton, based on TIGER BCA resource guide (3/27/15) for all local travel purposes. Summer reduction of VOC and NOx per year in kg, estimated based on net new daily person trips by route (estimated from annual net new riders) and SRPEDD CMAQ New Bus Service Air Quality Analysis worksheet, modified to not include bus emissions, as existing routes are already running VOC and NOx value per short ton, based on TIGER BCA resource guide (3/27/15) for all local travel purposes. Winter and summer reductions of CO2 per year in kg, estimated based on daily person trips by route (from SRPEDD) extrapolated for 20 years and SRPEDD CMAQ New Bus Service Air Quality Analysis worksheet Conversion factor of 1000 kg/metric ton, based on TIGER BCA resource guide (3/27/15) for all local travel purposes. Social cost of carbon discount rate of 3% per year in 2013 dollars, based on TIGER BCA resource guide (3/27/15) Winter and summer reductions of CO2 per year in kg, estimated based on net new daily person trips by route (estimated from annual net new riders) and SRPEDD CMAQ New Bus Service Air Quality Analysis worksheet, modified to not include bus emissions, as existing routes are already running on TIGER BCA resource guide (3/27/15) for all local travel purposes. Social cost of carbon discount rate of 3% per year in 2013 dollars, based on TIGER BCA resource guide (3/27/15) 4
5 2016 TIGER Application - Plymouth Multimodal Economic Competitiveness Job creation A new multimodal center will increase GATRA service and number of the employment opportunities directly related to the transit center Additional job creation will likely create secondary benefits not included in BCA Number of new jobs created for GATRA Service GATRA Annual salary Annual wage increase Assumed new routes add seven new drivers. Annual salary of $36, based on GATRA hourly rate of $19.42 and 36 hours per week, 52 weeks a year Annual wage increase of 2.5% Commercial space revenue Increased commercial space will lead to an increase in rental revenue Auto operating cost savings An increase in transit trips also results in a decrease in auto trips for those trips that are assumed to be diverted from cars to transit. This results in a reduced cost for auto operations. Effective Gross Revenues from commercial operations Rent growth per year Vehicle occupancy for standard and seasonal/tourist trips Percentage of transit riders diverted from vehicles on existing routes and new routes Net new diverted auto trips derived from net new riders on existing routes, and newly diverted auto trips derived from new riders on proposed routes VMT of net new diverted auto trips Vehicle operating costs Rental Revenues and Operating expense assumptions from PGDC and Mass Development Commercial Operating Proforma, starting at $84,900 in year one Rent growth per year of 3% Assumed vehicle occupancy of 1.06 for standard trips (SRPEDD) Assumed vehicle occupancy of 3.0 for seasonal/tourist routes in Plymouth (Plymouth Transportation Site Selection Study) 100% of transit riders diverted from vehicles on two new year-round routes (SRPEDD) 25% of transit riders diverted from vehicles on existing routes and new Seasonal Circulator route, as new riders are less likely to all shift from driving Assumed diverted VMT is 50% of existing routes and 100% of new routes Assumed vehicle operating costs of $0.592 per mile, based on American Automobile Association 2014 "Your Driving Costs" for average sudan driven 15,000 miles per year Assumed 3% increase per year in operating costs 5
6
7 1-transit riders Plymouth Multimodal Annual Transit Riders Initiate Construction Construction Complete Consistent growth 5% Growth No- Existing Routes 5% Build Manomet/Cedarville 10, ,458 12,031 12,633 13,264 13,928 14,624 15,355 16,123 16,929 17,776 Freedom 34, ,307 40,223 42,234 44,346 46,563 48,891 51,336 53,902 56,598 59,427 Mayflower 37, ,226 43,287 45,451 47,724 50,110 52,616 55,246 58,009 60,909 63,955 Liberty 43, ,048 50,450 52,973 55,622 58,403 61,323 64,389 67,608 70,989 74,538 Subtotal: , , , , , , , , , ,696 Existing Routes - first 10% two years 10% Growth 10% Growth Consistent growth 5% Manomet/Cedarville ,234 14,558 15,286 16,050 16,852 17,695 18,580 19,509 Freedom ,245 48,670 51,103 53,658 56,341 59,158 62,116 65,222 Mayflower ,616 52,377 54,996 57,746 60,633 63,665 66,848 70,191 Liberty ,496 61,045 64,097 67,302 70,667 74,201 77,911 81,806 Proposed Routes West Plymouth (Route 3) 45,900 50,490 53,015 55,665 58,448 61,371 64,439 67,661 Inter-City connector (Route 1) 83,000 91,300 95, , , , , ,351 Seasonal Connector (Route 2) 39,200 43,120 45,276 47,540 49,917 52,413 55,033 57,785 Subtotal: , , , , , , , ,525 Additional riders for Build (145,992) 175, , , , , , , ,829 Notes 5% Growth in transit for No Build is based on historical data for GATRA Plymouth Area Link (PAL) service. Projections included in 2010 Site Selection Study, from 2008 CSA for PAL restructuring of routes 10% Growth in transit assumes higher useage of transit for first 2 years with improved facilities and multi-modal connections provided by the project Proposed Routes - developed by GATRA and SRPEDD (see SRPEDD sheets 10, 11, 12 ) West Plymouth Inter-City connector Seasonal Connector Year-Round (Route 3) (Route 1) (Route 2) Days of service per week 6 Hours per day 12 # roundtrips 12 Days per year 306 Daily one-way person trips 150 Summer Days of service per week 7 7 Hours per day # roundtrips Days per year Daily one-way person trips Winter Days of service per week 6 Hours per day 10 # roundtrips 20 Days per year 220 Daily one-way person trips 250 Annual ridership Annual Transit Riders 1 of 2
8 1-transit riders Plymouth Multimodal Annual Transit Riders 2015 Growth No- Existing Routes 5% Build Manomet/Cedarville 10,393 Freedom 34,746 Mayflower 37,393 Liberty 43,581 Subtotal: ,664 19,598 20,577 21,606 22,687 23,821 25,012 26,263 27,576 28,955 30,402 31,922 62,399 65,519 68,795 72,234 75,846 79,638 83,620 87,801 92,191 96, , ,723 67,152 70,510 74,036 77,737 81,624 85,705 89,991 94,490 99, , , ,853 78,265 82,178 86,287 90,602 95,132 99, , , , , , , , , , , , , , , , , , ,359 - first Existing Routes 10% two years Manomet/Cedarville Freedom Mayflower Liberty Proposed Routes West Plymouth (Route 3) Inter-City connector (Route 1) Seasonal Connector (Route 2) Subtotal: Additional riders for Build 20,484 21,508 22,584 23,713 24,899 26,144 27,451 28,823 30,265 31,778 33,367 35,035 68,483 71,907 75,503 79,278 83,242 87,404 91,774 96, , , , ,129 73,700 77,385 81,254 85,317 89,583 94,062 98, , , , , ,052 85,897 90,191 94,701 99, , , , , , , , ,912 71,045 74,597 78,327 82,243 86,355 90,673 95,206 99, , , , , , , , , , , , , , , , ,724 60,674 63,708 66,893 70,238 73,750 77,437 81,309 85,375 89,643 94,126 98, , , , , , , , , , , , , , , , , , , , , , , , , ,778 Notes 5% Growth in transit for No Build is based on historical data for GATRA Plymouth Area Link (PAL) service. Projections included in 2010 Site Selection Study, from 2008 CSA for PAL restructuring of routes 10% Growth in transit assumes higher useage of transit for first 2 years with improved facilities and multi-modal connections provided by the project Annual Transit Riders 2 of 2
9 2-transit riders_net NEW Plymouth Multimodal Annual Net New Transit Riders Initiate Construction Construction Complete Consistent growth 5% Growth Existing Routes Transit 10% first 2 years Change No-Build to Build Manomet/Ceda 10, ,293 1,358 1,426 1,497 1,572 1,651 Freedom 34,746 2,011 4,324 4,540 4,767 5,006 5,256 5,519 Mayflower 37,393 2,164 4,653 4,886 5,130 5,387 5,656 5,939 Liberty 43,581 2,523 5,423 5,695 5,979 6,278 6,592 6,922 Proposed Routes West Plymouth (Route 3) 45,900 50,490 53,015 55,665 58,448 61,371 64,439 Inter-City conne(route 1) 83,000 91,300 95, , , , ,525 Seasonal Conne(Route 2) 39,200 43,120 45,276 47,540 49,917 52,413 55,033 Net New Riders , , , , , , ,027 Notes Existing Routes for 10% growth rate represents net new riders to those routes the first two years, then 5% growth for future years. These calculations serve as the basis for benefits generated by this net increase. Annual Net New Transit Riders Page 1 of 2
10 2-transit riders_net NEW Plymouth Multimodal Annual Net New Transit Riders Growth Transit Existing Routes 10% first 2 years Manomet/Ceda 10,393 Freedom 34,746 Mayflower 37,393 Liberty 43,581 Proposed Routes West Plymouth (Route 3) Inter-City conne(route 1) Seasonal Conne(Route 2) Net New Riders 1,733 1,820 1,911 2,006 2,107 2,212 2,323 2,439 2,561 2,689 2,823 2,964 3,113 5,795 6,084 6,388 6,708 7,043 7,395 7,765 8,153 8,561 8,989 9,439 9,911 10,406 6,236 6,548 6,875 7,219 7,580 7,959 8,357 8,775 9,213 9,674 10,158 10,666 11,199 7,268 7,631 8,013 8,414 8,834 9,276 9,740 10,227 10,738 11,275 11,839 12,431 13,052 67,661 71,045 74,597 78,327 82,243 86,355 90,673 95,206 99, , , , , , , , , , , , , , , , , ,724 57,785 60,674 63,708 66,893 70,238 73,750 77,437 81,309 85,375 89,643 94,126 98, , , , , , , , , , , , , , ,778 Notes Existing Routes for 10% growth rate represents net new ride those routes the first two years, then 5% growth for future y These calculations serve as the basis for benefits generated b increase. Annual Net New Transit Riders Page 2 of 2
11 3-land.rent Plymouth Multimodal Land and Transit space benefit Initiate Construction Annual Rental Increase 3% land value increase 3% Existing lot Improved* Value of Memorial Drive Parking lot $ 650, $ 2,600, $ 650, $ 2,600, $ 2,678, $ 2,758, $ 2,841, Net increase in value $ 650, $ 1,950, $ 78, $ 80, $ 82, Value of GATRA lease $12,000 $12,360 $12,731 $13,113 Construction Complete Notes Value of Memorial Drive parking lot based on 2012 Site Selection Study, Appendix J - Financial Feasibility, plus appreciation of 3% per year from 2011 when estimate was made, to 2015 when Project cost estimate was established. This cost is addressed as an in-kind donation by the Town of Plymouth as a Project Partner Multiplier of 4 used for improved value of property based on Franklin Regional Transit, Greenfield, MA case study 2009 value of 12 Olive Street $ 890, Developed value $ 3,551, GATRA will not pay rent for the 600 SF passenger waiting area. The value of the rent saved is estimated to be $20/SF (consistent with the MassDevelopment proforma for commercial space), or $12,000 the first year Land and Rent values Page 1 of 3
12 3-land.rent Plymouth Multimodal Land and Transit space benefit Annual Rental Increase 3% land value increase 3% Existing lot Improved* Value of Memorial Drive Parking lot $ 650, $ 2,600, Net increase in value Value of GATRA lease $ 2,926, $ 3,014, $ 3,104, $ 3,197, $ 3,293, $ 3,392, $ 3,494, $ 3,599, $ 85, $ 87, $ 90, $ 93, $ 95, $ 98, $ 101, $ 104, $13,506 $13,911 $14,329 $14,758 $15,201 $15,657 $16,127 $16,611 Notes Value of Memorial Drive parking lot based on 2012 Site Selection Study, Appendix J - Financial Feasibility, plus appreciation of 3% per year from 2011 when estimate was made, to 2015 when Project cost estimate was established. This cost is addressed as an in-kind donation by the Town of Plymouth as a Project Partner Multiplier of 4 used for improved value of property based on Franklin Regional Transit, Greenfield, MA case study 2009 value of 12 Olive Street $ 890, Developed value $ 3,551, GATRA will not pay rent for the 600 SF passenger waiting area. The value of the rent saved is estimated to be $20/SF (consistent with the MassDevelopment proforma for commercial space), or $12,000 the first year Land and Rent values Page 2 of 3
13 3-land.rent Plymouth Multimodal Land and Transit space benefit Annual Rental Increase 3% land value increase 3% Existing lot Improved* Value of Memorial Drive Parking lot $ 650, $ 2,600, Net increase in value Value of GATRA lease $ 3,706, $ 3,818, $ 3,932, $ 4,050, $ 4,172, $ 4,297, $ 4,426, $ 4,559, $ 107, $ 111, $ 114, $ 117, $ 121, $ 125, $ 128, $ 132, $17,109 $17,622 $18,151 $18,696 $19,256 $19,834 $20,429 $21,042 Notes Value of Memorial Drive parking lot based on 2012 Site Selection Study, Appendix J - Financial Feasibility, plus appreciation of 3% per year from 2011 when estimate was made, to 2015 when Project cost estimate was established. This cost is addressed as an in-kind donation by the Town of Plymouth as a Project Partner Multiplier of 4 used for improved value of property based on Franklin Regional Transit, Greenfield, MA case study 2009 value of 12 Olive Street $ 890, Developed value $ 3,551, GATRA will not pay rent for the 600 SF passenger waiting area. The value of the rent saved is estimated to be $20/SF (consistent with the MassDevelopment proforma for commercial space), or $12,000 the first year Land and Rent values Page 3 of 3
14 4-transit fare box Plymouth Multimodal Transit Fare Box revenue Fare Box Revenue $1.25 per rider in 2019 $1.25 $1.25 $1.25 $1.25 $ year increase in fares 5% Initiate Construction Construction Complete NO Build $1.25 Manomet/Cedarville $ - $ - $ - $ - $ - Freedom $ - $ - $ - $ - $ - Mayflower $ - $ - $ - $ - $ - Liberty $ - $ - $ - $ - $ - Subtotal: BUILD - Net New Riders Existing Routes $1.25 Manomet/Cedarville $ - $ $ 1, $ 1, $ 1, $ 1, Freedom $ - $ 2, $ 5, $ 5, $ 5, $ 6, Mayflower $ - $ 2, $ 5, $ 6, $ 6, $ 7, Liberty $ - $ 3, $ 6, $ 7, $ 7, $ 8, Proposed Routes West Plymouth $ - $ 57, $ 63, $ 66, $ 69, $ 76, Inter-City connector $ - $ 103, $ 114, $ 119, $ 125, $ 138, Seasonal Connector $ - $ 49, $ 53, $ 56, $ 59, $ 65, Notes Subtotal of Additional Build Fare Box , , , , ,794 Fare structure provided by GATRA. Current fare is $1, assumed to be $1.25 at project completion. Assumes fare increase of 5% every 5 years Transit Fare Box Revenue Page 1 of 3
15 4-transit fare box Plymouth Multimodal Transit Fare Box revenue Fare Box Revenue $1.25 per rider in year increase in fares 5% 2014 $1.31 $1.31 $1.31 $1.31 $1.31 $1.38 $1.38 $ NO Build $1.25 Manomet/Cedarville Freedom Mayflower Liberty Subtotal: BUILD - Net New Riders Existing Routes $1.25 Manomet/Cedarville Freedom Mayflower Liberty Proposed Routes West Plymouth Inter-City connector Seasonal Connector Subtotal of Additional Build Fare Box - $ - $ - $ - $ - $ - $ - $ - $ - $ - $ - $ - $ - $ - $ - $ - $ - $ - $ - $ - $ - $ - $ - $ - $ - $ - $ - $ - $ - $ - $ - $ - $ $ 2, $ 2, $ 2, $ 2, $ 2, $ 2, $ 2, $ 3, $ 6, $ 7, $ 7, $ 7, $ 8, $ 9, $ 9, $ 10, $ 7, $ 7, $ 8, $ 8, $ 9, $ 9, $ 10, $ 10, $ 8, $ 9, $ 9, $ 10, $ 11, $ 11, $ 12, $ 12, $ 80, $ 84, $ 88, $ 93, $ 102, $ 107, $ 113, $ 118, $ 145, $ 152, $ 160, $ 168, $ 185, $ 194, $ 204, $ 214, $ 68, $ 72, $ 75, $ 79, $ 87, $ 91, $ 96, $ 101, , , , , , , , ,764 Notes Fare structure provided by GATRA. Current fare is $1, assumed to be $1.25 at project completion. Assumes fare increase of 5% every 5 years Transit Fare Box Revenue Page 2 of 3
16 4-transit fare box Plymouth Multimodal Transit Fare Box revenue Fare Box Revenue $1.25 per rider in year increase in fares 5% 2014 $1.38 $1.38 $1.44 $1.44 $1.44 $1.44 $ NO Build $1.25 Manomet/Cedarville Freedom Mayflower Liberty Subtotal: BUILD - Net New Riders Existing Routes $1.25 Manomet/Cedarville Freedom Mayflower Liberty Proposed Routes West Plymouth Inter-City connector Seasonal Connector Subtotal of Additional Build Fare Box - $ - $ - $ - $ - $ - $ - $ - $ - $ - $ - $ - $ - $ - $ - $ - $ - $ - $ - $ - $ - $ - $ - $ - $ - $ - $ - $ - $ $ 3, $ 3, $ 3, $ 3, $ 4, $ 4, $ 4, $ 10, $ 11, $ 12, $ 12, $ 13, $ 14, $ 14, $ 11, $ 12, $ 13, $ 13, $ 14, $ 15, $ 16, $ 13, $ 14, $ 15, $ 16, $ 17, $ 17, $ 18, $ 124, $ 136, $ 143, $ 150, $ 158, $ 166, $ 174, $ 225, $ 247, $ 259, $ 272, $ 286, $ 300, $ 315, $ 106, $ 116, $ 122, $ 128, $ 135, $ 142, $ 149, , , , , , , ,993 Notes Fare structure provided by GATRA. Current fare is $1, assumed to be $1.25 at project completion. Assumes fare increase of 5% every 5 years Transit Fare Box Revenue Page 3 of 3
17 5-transitbenefit_travelsavings Plymouth Multimodal Transit Travel Time Savings Initiate Construction Construction Complete Existing Routes Manomet/Cedarville $ - $ 28, $ 31, $ 33, $ 34, $ 36, $ 38, Freedom $ - $ 95, $ 105, $ 110, $ 116, $ 122, $ 128, Mayflower $ - $ 103, $ 113, $ 119, $ 125, $ 131, $ 137, Liberty $ - $ 120, $ 132, $ 138, $ 145, $ 153, $ 160, Proposed Routes West Plymouth Inter-City connector Seasonal Connector $ - $ 141, $ 155, $ 163, $ 171, $ 180, $ 189, Subtotal: , , , , , ,492 Value of travel time savings $ - $ - $ - $ - $ - $ 489, $ 538, $ 565, $ 593, $ 623, $ 654, Notes Seasonal Connector 4.25 miles total route 1 mile saved w circulator for heart of downtown 3 mph walk speed 0.33 hours to walk the route 18 mph transit speed 0.1 hours to drive the route Travel time savings = 0.3 hours savd walking vs bus Value of time $13.00 per hour Travel time value = $3.61 TIGER BCA Resource Guide, updated 3/27/15 for all local travel purposes Riders of all routes (existing plus new riders attacted to service) save time 10 minutes 0.17 hours less wait time due to improved connections Travel time value = $2.17 Transit Travel Time Savings Page 1 of 3
18 5-transitbenefit_travelsavings Plymouth Multimodal Transit Travel Time Savings Existing Routes Manomet/Cedarville Freedom Mayflower Liberty Proposed Routes West Plymouth Inter-City connector Seasonal Connector $ 40, $ 42, $ 44, $ 46, $ 48, $ 51, $ 53, $ 56, $ 59, $ 62, $ 134, $ 141, $ 148, $ 155, $ 163, $ 171, $ 180, $ 189, $ 198, $ 208, $ 144, $ 152, $ 159, $ 167, $ 176, $ 184, $ 194, $ 203, $ 213, $ 224, $ 168, $ 177, $ 186, $ 195, $ 205, $ 215, $ 226, $ 237, $ 249, $ 261, $ 198, $ 208, $ 219, $ 230, $ 241, $ 253, $ 266, $ 279, $ 293, $ 308, Subtotal: - Value of travel time savings $ - 687, , , , , , , ,983 1,015,332 1,066,099 $ 687, $ 721, $ 757, $ 795, $ 835, $ 877, $ 920, $ 966, $ 1,015, $ 1,066, Notes Seasonal Connector 4.25 miles total route 1 mile saved w circulator for heart of downtown 3 mph walk speed 0.33 hours to walk the route 18 mph transit speed 0.1 hours to drive the rout Travel time savings = 0.3 hours savd walking vs b Value of time $13.00 per hour Travel time value = $3.61 TIGER BCA Resource Guide, updated 3/27/15 for all local travel purposes Riders of all routes (existing plus new riders attacted to service) save time 10 minutes 0.17 hours less wait time due to improved connections Travel time value = $2.17 Transit Travel Time Savings Page 2 of 3
19 5-transitbenefit_travelsavings Plymouth Multimodal Transit Travel Time Savings Existing Routes Manomet/Cedarville Freedom Mayflower Liberty Proposed Routes West Plymouth Inter-City connector Seasonal Connector $ 65, $ 68, $ 72, $ 75, $ 219, $ 230, $ 241, $ 253, $ 235, $ 247, $ 260, $ 273, $ 274, $ 288, $ 303, $ 318, $ 323, $ 339, $ 356, $ 374, Subtotal: - Value of travel time savings $ - 1,119,404 1,175,374 1,234,143 1,295,850 $ 1,119, $ 1,175, $ 1,234, $ 1,295, Notes Seasonal Connector 4.25 miles total route 1 mile saved w circulator for heart of downtown 3 mph walk speed 0.33 hours to walk the route 18 mph transit speed 0.1 hours to drive the rout Travel time savings = 0.3 hours savd walking vs b Value of time $13.00 per hour Travel time value = $3.61 TIGER BCA Resource Guide, updated 3/27/15 for all local travel purposes Riders of all routes (existing plus new riders attacted to service) save time 10 minutes 0.17 hours less wait time due to improved connections Travel time value = $2.17 Transit Travel Time Savings Page 3 of 3
20 6-diverted auto trips Diverted auto trips from Net New Transit Riders Initiate Construction Construction Complete Existing Routes No Build No Build Manomet/Cedarville 2,451 2,574 2,702 2,838 2,979 3,128 3,285 3,449 3,622 3,803 3,993 4,192 Freedom 8,195 8,605 9,035 9,487 9,961 10,459 10,982 11,531 12,107 12,713 13,348 14,016 Mayflower 8,819 9,260 9,723 10,209 10,720 11,256 11,818 12,409 13,030 13,681 14,365 15,084 Liberty 10,279 10,792 11,332 11,899 12,494 13,118 13,774 14,463 15,186 15,945 16,743 17,580 Existing Routes w growth Manomet/Cedarville ,121 3,433 3,605 3,785 3,975 4,173 4,382 4,601 Freedom ,435 11,479 12,053 12,655 13,288 13,952 14,650 15,383 Mayflower ,230 12,353 12,971 13,619 14,300 15,015 15,766 16,554 Liberty ,089 14,397 15,117 15,873 16,667 17,500 18,375 19,294 Proposed Routes West Plymouth (Route 3) ,302 47,632 50,014 52,514 55,140 57,897 60,792 63,832 Inter-City connector (Route 1) ,302 86,132 90,439 94,961 99, , , ,425 Seasonal Connector (Route 2) ,067 14,373 15,092 15,847 16,639 17,471 18,344 19,262 TOTAL , , , , , , , , Notes Assumes vehicle occupancy for standard trips 1.06 source: SRPEDD Assumes vehicle occupancy for seasonal/tourism 3 Source: Plymouth Transportation Site Selection Study, Plymouth Convention and Visitor Bureau, 2012 Percent of transit riders diverted from vehicles on new routes Percent of transit riders diverted from vehicles on existing routes 100% 25% SRPEDD (sheets 10, 11, 12) Diverted auto trips from Net New Transit Riders Page 1of 2
21 6-diverted auto trips Diverted auto trips from Net New Transit Riders Existing Routes No Build Manomet/Cedarville Freedom Mayflower Liberty No Build Existing Routes w growth Manomet/Cedarville - Freedom - Mayflower - Liberty - Proposed Routes West Plymouth (Route 3) - Inter-City connector (Route 1) - Seasonal Connector (Route 2) - TOTAL ,402 4,622 4,853 5,096 5,351 5,618 5,899 6,194 6,504 6,829 7,170 7,529 14,717 15,453 16,225 17,036 17,888 18,783 19,722 20,708 21,743 22,830 23,972 25,171 15,838 16,630 17,461 18,334 19,251 20,214 21,224 22,285 23,400 24,570 25,798 27,088 18,459 19,382 20,351 21,368 22,437 23,559 24,737 25,973 27,272 28,636 30,067 31,571 4,831 5,073 5,326 5,593 5,872 6,166 6,474 6,798 7,138 7,495 7,869 8,263 16,152 16,959 17,807 18,698 19,632 20,614 21,645 22,727 23,863 25,057 26,309 27,625 17,382 18,251 19,164 20,122 21,128 22,184 23,294 24,458 25,681 26,965 28,314 29,729 20,259 21,272 22,335 23,452 24,624 25,856 27,148 28,506 29,931 31,428 32,999 34,649 67,023 70,374 73,893 77,588 81,467 85,540 89,817 94,308 99, , , , , , , , , , , , , , , ,287 20,225 21,236 22,298 23,413 24,583 25,812 27,103 28,458 29,881 31,375 32,944 97, , , , , , , , , , , , , Notes Assumes vehicle occupancy for standard trips 1.06 source: SRPEDD Assumes vehicle occupancy for seasonal/tourism 3 Source: Plymouth Transportation Site Selection Study, Plymouth Convention and Visitor Bureau, 2012 Percent of transit riders diverted from vehicles on new routes Percent of transit riders diverted from vehicles on existing routes 100% 25% SRPEDD (sheets 10, 11, 12) Diverted auto trips from Net New Transit Riders Page 2of 2
22 7-net new_diverted auto trips Diverted auto trips from Net New Transit Riders Initiate Construction Construction Complete Existing Routes w growth Manomet/Cedarville Freedom 474 1,020 1,071 1,124 1,181 1,240 1,302 1,367 1,435 Mayflower 510 1,097 1,152 1,210 1,270 1,334 1,401 1,471 1,544 Liberty 595 1,279 1,343 1,410 1,481 1,555 1,633 1,714 1,800 Proposed Routes West Plymouth (Route 3) ,302 47,632 50,014 52,514 55,140 57,897 60,792 63,832 67,023 Inter-City connector (Route 1) ,302 86,132 90,439 94,961 99, , , , ,196 Seasonal Connector (Route 2) ,067 14,373 15,092 15,847 16,639 17,471 18,344 19,262 20,225 TOTAL , , , , , , , , , Notes Assumes vehicle occupancy for standard trips Assumes vehicle occupancy for seasonal/tourism 1.06 source: SRPEDD 3 Source: Plymouth Transportation Site Selection Study, Plymouth Convention and Visitor Bureau, 2012 Percent of transit riders diverted from vehicles on new routes Percent of transit riders diverted from vehicles 100% 25% Diverted Auto Trips from New New Transit Riders Page 1 of 2
23 7-net new_diverted auto trips Diverted auto trips from Net New Transit Riders Existing Routes w growth Manomet/Cedarville Freedom Mayflower Liberty ,507 1,582 1,661 1,744 1,831 1,923 2,019 2,120 2,226 2,337 2,454 1,621 1,703 1,788 1,877 1,971 2,069 2,173 2,282 2,396 2,515 2,641 1,890 1,984 2,084 2,188 2,297 2,412 2,533 2,659 2,792 2,932 3,078 Proposed Routes West Plymouth (Route 3) Inter-City connector (Route 1) Seasonal Connector (Route 2) 70,374 73,893 77,588 81,467 85,540 89,817 94,308 99, , , , , , , , , , , , , , ,287 21,236 22,298 23,413 24,583 25,812 27,103 28,458 29,881 31,375 32,944 34,591 TOTAL 224, , , , , , , , , , , Notes Assumes vehicle occupancy for standard trips Assumes vehicle occupancy for seasonal/tourism 1.06 source: SRPEDD 3 Source: Plymouth Transportation Site Selection Study, Plymouth Convention and Visitor Bureau, 2012 Percent of transit riders diverted from vehicles on new routes Percent of transit riders diverted from vehicles 100% 25% Diverted Auto Trips from New New Transit Riders Page 2 of 2
24 8-net new_diverted trips.vmt Diverted VMT from Net New Transit Riders Initiate Construction Construction Complete Existing Routes Manomet/Cedarville , , , , , , , Freedom - 2, , , , , , , , Mayflower - 3, , , , , , , , Liberty - 2, , , , , , , , Proposed Routes West Plymouth (Route 3) - 227, , , , , , , , Inter-City connector (Route 1) - 399, , , , , , , , Seasonal Connector (Route 2) - 55, , , , , , , , TOTAL , , , , , , , ,032, Notes Routes Route milles assumed VMT as % of route 50% Puritan Link Freedom Link Mayflower Link Liberty Link West Plymouth Inter-City connector Seasonal Connector % (diverted auto trips VMT = bus route VMT: see SRPEDD sheets 10, 11, 12 ) Diverted VMT from Net New Transit Riders Page 1 of 2
25 8-net new_diverted trips.vmt Diverted VMT from Net New Transit Riders Existing Routes Manomet/Cedarville Freedom Mayflower Liberty 1, , , , , , , , , , , , , , , , , , , , , , , , , , , , , , , , , , , , , , , , , , , , , , , , Proposed Routes West Plymouth (Route 3) Inter-City connector (Route 1) Seasonal Connector (Route 2) TOTAL 352, , , , , , , , , , , , , , , , , , , , , , ,006, ,057, , , , , , , , , , , , , ,083, ,138, ,194, ,254, ,317, ,383, ,452, ,525, ,601, ,681, ,765, ,853, Notes Diverted VMT from Net New Transit Riders Page 2 of 2
26 9-net divertedtripsautosavings Auto Operating Savings from Diverted VMT from Net New Transit Riders Initiate Construction Construction Complete Existing Routes w growth Manomet/Cedarville $ - $ - $ - $ - $ - $ $ $ $ $ 1, $ 1, $ 1, $ 1, $ 1, Freedom $ - $ - $ - $ - $ - $ 1, $ 3, $ 3, $ 3, $ 3, $ 4, $ 4, $ 4, $ 5, Mayflower $ - $ - $ - $ - $ - $ 2, $ 5, $ 6, $ 6, $ 7, $ 8, $ 8, $ 9, $ 10, Liberty $ - $ - $ - $ - $ - $ 1, $ 3, $ 4, $ 4, $ 4, $ 5, $ 5, $ 6, $ 6, Proposed Routes West Plymouth (Route 3) $ - $ - $ - $ - $ - $ 156, $ 177, $ 191, $ 207, $ 224, $ 242, $ 262, $ 283, $ 306, Inter-City connector (Route 1) $ - $ - $ - $ - $ - $ 274, $ 310, $ 335, $ 363, $ 392, $ 424, $ 459, $ 496, $ 537, Seasonal Connector (Route 2) $ - $ - $ - $ - $ - $ 38, $ 43, $ 46, $ 50, $ 54, $ 59, $ 63, $ 69, $ 74, TOTAL , , , , , , , , , Notes 2014 vehicle operating costs $ per mile source: American Automobile Association (AAA) 2014 "Your Driving Costs" for average sudan driven 15,000 miles per year Estimate increase per year 3% $ 0.61 $ 0.63 $ 0.65 $ 0.67 $ 0.69 $ 0.71 $ 0.73 $ 0.75 $ 0.77 $ 0.80 $ 0.82 $ 0.84 $ 0.87 Auto Operating Savings from Diverted VMT from Net New Transit Riders Page 1 of 2
27 9-net divertedtripsautosavings Auto Operating Savings from Diverted VMT from Net New Transit Riders Existing Routes w growth Manomet/Cedarville Freedom Mayflower Liberty $ 1, $ 1, $ 1, $ 1, $ 2, $ 2, $ 2, $ 2, $ 2, $ 3, $ 3, $ 5, $ 6, $ 6, $ 7, $ 7, $ 8, $ 9, $ 9, $ 10, $ 11, $ 12, $ 11, $ 12, $ 13, $ 14, $ 15, $ 16, $ 17, $ 19, $ 20, $ 22, $ 24, $ 7, $ 7, $ 8, $ 9, $ 9, $ 10, $ 11, $ 12, $ 13, $ 14, $ 15, Proposed Routes West Plymouth (Route 3) Inter-City connector (Route 1) Seasonal Connector (Route 2) TOTAL $ 331, $ 358, $ 387, $ 419, $ 453, $ 490, $ 530, $ 573, $ 620, $ 670, $ 725, $ 581, $ 628, $ 679, $ 735, $ 795, $ 859, $ 929, $ 1,005, $ 1,087, $ 1,176, $ 1,272, $ 80, $ 87, $ 94, $ 102, $ 110, $ 119, $ 129, $ 139, $ 151, $ 163, $ 176, ,019, ,102, ,191, ,289, ,394, ,507, ,630, ,763, ,907, ,062, ,230, Notes 2014 vehicle operating costs $ per mile source: American Automobile Association (AAA) 2014 "Your Driving Costs" for average sudan driven 15,000 miles per year Estimate increase per year 3% $ 0.90 $ 0.92 $ 0.95 $ 0.98 $ 1.01 $ 1.04 $ 1.07 $ 1.10 $ 1.13 $ 1.17 $ 1.20 Auto Operating Savings from Diverted VMT from Net New Transit Riders Page 2 of 2
28 CMAQ New Bus Service Air Quality Analysis Worksheet FILL IN SHADED BOXES ONLY TIP YEAR: 2015 MPO: Southeastern Regional Planning & Economic Development District RTA: Greater Attleboro Taunton Regional Transit Agency Project: Plymouth Proposed Route 1 (Inter-City) 10-plymouth rt 1 Summary of Vehicle Emission Rates: Emission Rates Milestone Year Oper. Speed Summer VOC Summer NOx Winter CO Summer CO2 by Vehicle Type for Rates (mph) (grams/mile) (grams/mile) (grams/mile) (grams/mile) Auto Bus* HDDV 4 Vehicle type used for Bus emission factors (For example, HDGV 6 or HDDV 2b) *Please refer to the 'Emission Factors' tab to determine the most appropriate 'Bus' factors based on fuel type and gross vehicle weight. If you require 'Bus' factors for an operating speed other that 18MPH, or for 'Auto' factors other than 20 MPH, please contact Ethan Britland at or at Ethan.Britland@state.ma.us Calculate VMT and emissions savings from private vehicles: Convert daily bus ridership into private auto VMT savings: Daily one way / average veh. = daily one-way x avg. auto trip = daily savings person trips (reduced) occupancy auto trips length (miles) auto VMT ,203 Calculate emissions change from auto VMT savings: Daily Auto VMT X Emission / 1000g = change/day Pollutant change (net) factor (auto) per kg in kg Summer VOC -1, Summer NOx -1, Winter CO -1, Summer CO2-1, Calculate bus route mileage and emissions per day: Pollutant Total Route X # of round = fleet miles X Emission / 1000g = change/day distance (miles) trips per day per day factor (bus) per kg in kg Summer VOC Summer NOx Winter CO Summer CO Add impact of bus emissions to emission savings from private vehicles Pollutant change/day + change/day = change/day auto (kg) bus or van (kg) (NET) in kg Summer VOC Summer NOx Winter CO Summer CO Calculate net emissions change in kilograms per year (seasonally adjusted) Pollutant change/day X operating X seasonal = change per (NET) in kg days per year adj factor year in kg Summer VOC Summer NOx Winter CO Summer CO Calculate cost effectiveness (cost per kg of emissions reduced) 10% 5% Pollutant Total Project / Project Life / reduction per = annual cost Cost in years year in kg per kg Summer VOC #DIV/0! Summer NOx #DIV/0! Winter CO #DIV/0! Summer CO #DIV/0! Spreadhseet Template Prepared by the Office of Transportation Planning Page 1 of 1
29 CMAQ New Bus Service Air Quality Analysis Worksheet FILL IN SHADED BOXES ONLY TIP YEAR: 2015 MPO: Southeastern Regional Planning & Economic Development District RTA: Greater Attleboro Taunton Regional Transit Agency Project: Plymouth Proposed Route 2 (Seasonal Circulator) 11-plymouth rt 2 Summary of Vehicle Emission Rates: Emission Rates Milestone Year Oper. Speed Summer VOC Summer NOx Winter CO Summer CO2 by Vehicle Type for Rates (mph) (grams/mile) (grams/mile) (grams/mile) (grams/mile) Auto Bus* HDDV 4 Vehicle type used for Bus emission factors (For example, HDGV 6 or HDDV 2b) *Please refer to the 'Emission Factors' tab to determine the most appropriate 'Bus' factors based on fuel type and gross vehicle weight. If you require 'Bus' factors for an operating speed other that 18MPH, or for 'Auto' factors other than 20 MPH, please contact Ethan Britland at or at Ethan.Britland@state.ma.us Calculate VMT and emissions savings from private vehicles: Convert daily bus ridership into private auto VMT savings: Daily one way / average veh. = daily one-way x avg. auto trip = daily savings person trips (reduced) occupancy auto trips length (miles) auto VMT ,717 Calculate emissions change from auto VMT savings: Daily Auto VMT X Emission / 1000g = change/day Pollutant change (net) factor (auto) per kg in kg Summer VOC -3, Summer NOx -3, Winter CO -3, Summer CO2-3, Calculate bus route mileage and emissions per day: Pollutant Total Route X # of round = fleet miles X Emission / 1000g = change/day distance (miles) trips per day per day factor (bus) per kg in kg Summer VOC Summer NOx Winter CO Summer CO Add impact of bus emissions to emission savings from private vehicles Pollutant change/day + change/day = change/day auto (kg) bus or van (kg) (NET) in kg Summer VOC Summer NOx Winter CO Summer CO Calculate net emissions change in kilograms per year (seasonally adjusted) Pollutant change/day X operating X seasonal = change per (NET) in kg days per year adj factor year in kg Summer VOC Summer NOx Winter CO Summer CO Calculate cost effectiveness (cost per kg of emissions reduced) 10% 5% Pollutant Total Project / Project Life / reduction per = annual cost Cost in years year in kg (daily passenges per kg input above) Summer VOC #DIV/0! Summer NOx #DIV/0! Winter CO #DIV/0! Summer CO #DIV/0! Spreadhseet Template Prepared by the Office of Transportation Planning Page 1 of 1
30 CMAQ New Bus Service Air Quality Analysis Worksheet FILL IN SHADED BOXES ONLY TIP YEAR: 2015 MPO: Southeastern Regional Planning & Economic Development District RTA: Greater Attleboro Taunton Regional Transit Agency Project: Plymouth Proposed Route 3 (West Plymouth) 12-plymouth rt 3 Summary of Vehicle Emission Rates: Emission Rates Milestone Year Oper. Speed Summer VOC Summer NOx Winter CO Summer CO2 by Vehicle Type for Rates (mph) (grams/mile) (grams/mile) (grams/mile) (grams/mile) Auto Bus* HDDV 4 Vehicle type used for Bus emission factors (For example, HDGV 6 or HDDV 2b) *Please refer to the 'Emission Factors' tab to determine the most appropriate 'Bus' factors based on fuel type and gross vehicle weight. If you require 'Bus' factors for an operating speed other that 18MPH, or for 'Auto' factors other than 20 MPH, please contact Ethan Britland at or at Ethan.Britland@state.ma.us Calculate VMT and emissions savings from private vehicles: Convert daily bus ridership into private auto VMT savings: Daily one way / average veh. = daily one-way x avg. auto trip = daily savings person trips (reduced) occupancy auto trips length (miles) auto VMT ,970 Calculate emissions change from auto VMT savings: Daily Auto VMT X Emission / 1000g = change/day Pollutant change (net) factor (auto) per kg in kg Summer VOC -1, Summer NOx -1, Winter CO -1, Summer CO2-1, Calculate bus route mileage and emissions per day: Pollutant Total Route X # of round = fleet miles X Emission / 1000g = change/day distance (miles) trips per day per day factor (bus) per kg in kg Summer VOC Summer NOx Winter CO Summer CO Add impact of bus emissions to emission savings from private vehicles Pollutant change/day + change/day = change/day auto (kg) bus or van (kg) (NET) in kg Summer VOC Summer NOx Winter CO Summer CO Calculate net emissions change in kilograms per year (seasonally adjusted) Pollutant change/day X operating X seasonal = change per (NET) in kg days per year adj factor year in kg Summer VOC Summer NOx Winter CO Summer CO Calculate cost effectiveness (cost per kg of emissions reduced) 10% 5% Pollutant Total Project / Project Life / reduction per = annual cost Cost in years year in kg per kg Summer VOC #DIV/0! Summer NOx #DIV/0! Winter CO #DIV/0! Summer CO #DIV/0! Spreadhseet Template Prepared by the Office of Transportation Planning Page 1 of 1
31 13-Emission Factors 2016 Emission Factors for CMAQ Analysis (all factors in g/day) Summer VOC Summer NOx Winter CO Summer CO Summer CO2 Intersection Analysis Idle Auto Emissions 20 mph mph Bus/Truck Emissions HDGV 18 mph HDGV 18 mph HDGV 18 mph HDGV 18 mph HDGV 18 mph HDGV 18 mph HDGV 18 mph HDDV 18 mph HDDV 18 mph HDDV 18 mph HDDV 18 mph HDDV 18 mph HDDV 18 mph HDDV 18 mph HDDV 18 mph HDGV 2b HDGV 3 HDGV 4 HDGV 5 HDGV 6 HDGV 7 HDGV 8a HDDV 2b HDDV 3 HDDV 4 HDDV 5 HDDV 6 HDDV 7 HDDV 8a HDDV 8b 8,501 to 10,000 lbs. Gross Vehicle Weight 10,001 to 14,000 lbs. Gross Vehicle Weight 14,001 to 16,000 lbs. Gross Vehicle Weight 16,001 to 19,500 lbs. Gross Vehicle Weight 19,501 to 26,000 lbs. Gross Vehicle Weight 26,001 to 33,000 lbs. Gross Vehicle Weight 33,001 to 60,000 lbs. Gross Vehicle Weight 8,501 to 10,000 lbs. Gross Vehicle Weight 10,001 to 14,000 lbs. Gross Vehicle Weight 14,001 to 16,000 lbs. Gross Vehicle Weight 16,001 to 19,500 lbs. Gross Vehicle Weight 19,501 to 26,000 lbs. Gross Vehicle Weight 26,001 to 33,000 lbs. Gross Vehicle Weight 33,001 to 60,000 lbs. Gross Vehicle Weight Greater than 60,000 lbs. Gross Vehicle Weight Emission Factors Page 1 of 1
32 14-emissions Emission Type $/short ton ($2013) $/metric ton ($2013) Metric ton per VMT Miles per gallon of gas kg/short ton kg/metric ton 1 ton = lbs , VOCs $ 1, $ 1, Nox $ 7, $ 7, PM $ 326, $ 350, Sox $ 42, $ 46, Passenger vehicles per year - Passenger vehicles are defined as 2-axle 4-tire vehicles, including passenger cars, vans, pickup trucks, and sport/utility vehicles. In 2011, the weighted average combined fuel economy of cars and light trucks combined was 21.4 miles per gallon (FHWA 2013). The average vehicle miles traveled in 2011 was 11,318 miles per year. In 2011, the ratio of carbon dioxide emissions to total greenhouse gas emissions (including carbon dioxide, methane, and nitrous oxide, all expressed as carbon dioxide equivalents) for passenger vehicles was (EPA 2013a, EPA 2013b). The amount of carbon dioxide emitted per gallon of motor gasoline burned is metric tons, as calculated in the Gallons of gasoline consumed section above. source TIGER BCA Resource Guide, updated 3/27/15 for all local travel purposes Emissions values from BCA Resource Guide Page 1 of 1
33 15-Emissions savings_voc Value of Emissions Savings VOC Initiate Construction Construction Complete Existing Routes no build Manomet/Cedarville Freedom Mayflower Liberty TOTAL Existing Routes w growth Manomet/Cedarville Freedom Mayflower Liberty Proposed Routes West Plymouth (Route 3) Inter-City connector (Route 1) Seasonal Connector (Route 2) TOTAL $ - $ $ $ $ $ $ $ $ $ Net New Riders Emissions Savings VOC Initiate Construction Construction Complete Existing Routes w growth Manomet/Cedarville Freedom Mayflower Liberty TOTAL $ - $ $ $ $ $ $ $ $ $ Value of Emissions Savings VOC Page 1 of 2
34 15-Emissions savings_voc Value of Emissions Savings VOC Existing Routes no build Manomet/Cedarville Freedom Mayflower Liberty TOTAL Existing Routes w growth Manomet/Cedarville Freedom Mayflower Liberty Proposed Routes West Plymouth (Route 3) Inter-City connector (Route 1) Seasonal Connector (Route 2) TOTAL $ $ $ $ $ $ $ $ $ $ $ Net New Riders Emissions Savings VOC Existing Routes w growth Manomet/Cedarville Freedom Mayflower Liberty TOTAL $ $ $ $ $ $ $ $ $ $ $ Value of Emissions Savings VOC Page 2 of 2
35 16-Emissions savings_nox Value of Emissions Savings Nox Initiate Construction Construction Complete Existing Routes no build Manomet/Cedarville Freedom Mayflower Liberty TOTAL Existing Routes w growth Manomet/Cedarville Freedom Mayflower Liberty Proposed Routes West Plymouth (Route 3) Inter-City connector (Route 1) Seasonal Connector (Route 2) TOTAL $ - $ $ $ $ $ $ $ $ $ Net New Riders Emissions Savings Nox Initiate Construction Construction Complete Existing Routes w growth Manomet/Cedarville Freedom Mayflower Liberty TOTAL $ - $ $ $ $ $ $ $ $ $ Value of Emissions Savings Nox Page 1 of 2
36 16-Emissions savings_nox Value of Emissions Savings Nox Existing Routes no build Manomet/Cedarville Freedom Mayflower Liberty TOTAL Existing Routes w growth Manomet/Cedarville Freedom Mayflower Liberty Proposed Routes West Plymouth (Route 3) Inter-City connector (Route 1) Seasonal Connector (Route 2) TOTAL 1, , , , , , , , , , , $ 1, $ 1, $ 1, $ 1, $ 1, $ 1, $ 1, $ 1, $ 1, $ 1, $ 1, Net New Riders Emissions Savings Nox Existing Routes w growth Manomet/Cedarville Freedom Mayflower Liberty TOTAL $ $ $ $ $ $ $ $ $ $ $ Value of Emissions Savings Nox Page 2 of 2
37 17-Emissions savings_co2 Co2 Emissions Initiate Construction Construction Complete Existing Routes no build Manomet/Cedarville Freedom Mayflower Liberty TOTAL Existing Routes w growth Manomet/Cedarville Freedom Mayflower Liberty Proposed Routes West Plymouth (Route 3) Inter-City connector (Route 1) Seasonal Connector (Route 2) TOTAL Net New Riders Emissions Savings CO2 Initiate Construction Construction Complete Existing Routes w growth Manomet/Cedarville Freedom Mayflower Liberty TOTAL TOTAL Co2 Emissions Page 1 of 2
38 17-Emissions savings_co2 Co2 Emissions Existing Routes no build Manomet/Cedarville Freedom Mayflower Liberty TOTAL Existing Routes w growth Manomet/Cedarville Freedom Mayflower Liberty Proposed Routes West Plymouth (Route 3) Inter-City connector (Route 1) Seasonal Connector (Route 2) TOTAL Net New Riders Emissions Savings CO2 Existing Routes w growth Manomet/Cedarville Freedom Mayflower Liberty TOTAL TOTAL Co2 Emissions Page 2 of 2
39 18-social cost of carbon Social Cost of Carbon and Net Non-Co2 Benefits Year Non CO2 Benefits (2013$) Non CO2 Costs (2013$) 7% NPV Non CO2 Benefits 3% NPV Non CO2 Benefits CO2 Reduced Metric Tons Undiscounted CO2 3% Avg SCC NPV Co2 3% Avg SCC 7% NPV Total Benefits 3% NPV Total Benefits Calendar Year Net non CO2 Benefits 3% SCC (2013$) $ $ $ - Total emissions value $ $ 6, $ $ 7, $ $ 8, $ 1, $ 9, $ 1, $ 10, $ 1, $ 11, $ 1, $ 12, $ 1, $ 13, $ 1, $ 14, $ 1, $ 15, $ 1, $ 16, $ 1, $ 18, $ 1, $ 19, $ 1, $ 21, $ 2, $ 22, $ 2, $ 24, $ 2, $ 26, $ 2, $ 28, $ 2, $ 30, $ 2, $ 33, Totals source: TIGER BCA Resource Guide, updated 3/27/15 Social Cost of Carbon and Net Non-Co2 Benefits Page 1 of 1
40 19-transit tourism $ Tourism spending through increased transit Initiate Construction Construction Complete Existing Routes Manomet/Cedarville Freedom Mayflower Liberty Growth No- Build Subtotal: $ - $ - $ - $ - $ - $ - $ - $ - $ - $ - $ - $ - $ - $ - $ - $ - Existing Routes Manomet/Cedarville Freedom Mayflower Liberty Proposed Routes West Plymouth Inter-City connector Seasonal Connector $ - $ - $ - $ - $ - $ 1,476, $ 1,672, $ 1,809, $ 1,956, $ 2,116, $ 2,288, $ 2,475, $ 2,676, $ 2,895, $ 3,131, $ 3,386, Subtotal: ,476,533 1,672,912 1,809,255 1,956,709 2,116,181 2,288,649 2,475,174 2,676,901 2,895,068 3,131,016 3,386,194 Additional tourism dollars $ - $ - $ - $ - $ - $ 1,476, $ 1,672, $ 1,809, $ 1,956, $ 2,116, $ 2,288, $ 2,475, $ 2,676, $ 2,895, $ 3,131, $ 3,386, Notes Seasonal Connector allows visitors to go to more tourism sites 2.00 more sites Value of toursim expenditure per site $6 average cost of admission per transit rider Retail expenditure $25.00 average expense on retail (Plymouth 400 Office) 3% increase per year Assuming 1,000,000 1 visitors to downtown attractions per year and a tourist season of 5 months (150 days), it is estimated that an average of 6,667 people visit downtown Plymouth daily. We assumed each visitor stayed about 3 hours in the downtown area. According to the Plymouth Convention and Visitor s Bureau, the average visitor stays in Plymouth for 4 hrs 1, but not all of that time is spent in the downtown (i.e. some time is spent at Plymouth Plantation and other non-downtown attractions). The Plymouth Convention and Visitor s Bureau estimated that approximately 30% of visitors arrive by bus. Plymouth data 2020 Projections Adults Seniors Children Family visitors 1,500,000 6,000,000 Pilgrim Hall Mus $8 $7 $5 $25 expenditures 350,000,000 1,400,000,000 Spooner House $6 $3 Hedge House $6 $3 per capita $ $ Mayflower Soci $7 $5 $5 Jabez Howland $5 $4 $1 Tourism marketing ROI Jenny Grist Mill $6 $4 International travel $1 $ Average $6 $4 Domestic travel $1 $ Jenny Grist Mill $10 $8 Shopper will spend $25 per person on local retail Mayflower II $12 $11 $8 Tourism spending through increased transit Page 1 of 2
41
42 20-Job creation Plymouth Multimodal Job Creation for Transit Initiate Construction Annual Wage Increase 2.5% GATRA Bus Routes # of Jobs GATRA hourly rate Annual salary 7 $ $ 36, $254,480 $260, $267, $274, $280, $287, $295, $302, $310, $317, $325, $333, $342, $350, $0 $0.00 $0.00 $0.00 $0.00 $0.00 $0.00 $0.00 $0.00 $0.00 $0.00 $0.00 $0.00 $0.00 Construction Complete TOTAL $254, $260, $267, $274, $280, $287, $295, $302, $310, $317, $325, $333, $342, $350, Job Creation for Transit Page 1 of 2
43 20-Job creation Plymouth Multimodal Job Creation for Transit Annual Wage Increase 2.5% GATRA Bus Routes # of Jobs GATRA hourly rate 7 $ $359, $368, $377, $387, $396, $406, $416, $427, $438, $449, $460, $0.00 $0.00 $0.00 $0.00 $0.00 $0.00 $0.00 $0.00 $0.00 $0.00 $0.00 TOTAL $359, $368, $377, $387, $396, $406, $416, $427, $438, $449, $460, Job Creation for Transit Page 2 of 2
44 21-transit costs Operating Costs $72.50 per hour $ $ $ $ $ $ $ $ $ $ $ $ $ Operating Hours 13 per day Operating Days 306 per year Inflation 3.00% per year Initiate Construction Construction Complete Existing Routes 4 No Build $ 1,188, $ 1,223, $ 1,260, $ 1,298, $ 1,337, $ 1,377, $ 1,418, $ 1,461, $ 1,505, $ 1,550, $ 1,596, $ 1,644, O&M for existing shelter/ curbspace $ 3, per year (source: GATRA) $ 3, $ 3, $ 3, $ 3, $ 3, $ 3, $ 3, $ 3, $ 3, $ 3, $ 4, $ 4, Subtotal Existing: $ 1,191, $ 1,226, $ 1,263, $ 1,301, $ 1,340, $ 1,380, $ 1,422, $ 1,465, $ 1,509, $ 1,554, $ 1,600, $ 1,648, Existing Routes - new cente 4 Build $ 1,337, $ 1,377, $ 1,418, $ 1,461, $ 1,505, $ 1,550, $ 1,596, $ 1,644, Proposed Routes West Plymouth $ 308, $ 317, $ 327, $ 337, $ 347, $ 357, $ 368, $ 379, Inter-City connector $ 301, $ 310, $ 320, $ 329, $ 339, $ 349, $ 360, $ 371, Seasonal Connector $ 150, $ 155, $ 159, $ 164, $ 169, $ 174, $ 179, $ 185, O&M for new transit center $ 9, per year $ 9, $ 9, $ 9, $ 9, $ 10, $ 10, $ 10, $ 11, Subtotal: ,107,508 2,170,733 2,235,855 2,302,931 2,372,018 2,443,179 2,516,474 2,591,969 Increase for Build from No Build $ - $ (1,301,687.65) $ 766, $ 789, $ 813, $ 837, $ 863, $ 888, $ 915, $ 943, Notes $72.50 Operating cost/hour from 2014 National Transit Database $ 9, O&M for new transit center 2% of capital cost of transit center $ 450, RLB Cost Estimate June 2015 O&M for existing shelter provided by GATRA. Inclues maintenance of shelter, snow removal, etc. Proposed Routes - developed by GATRA and SRPEDD West Plymouth Inter-City connector Seasonal Connector Year-Round (Route 3) (Route 1) (Route 2) Days of service per 6 Hours per day 12 # roundtrips 12 Days per year 306 Daily one-way pers 150 Summer Days of service per week 7 7 Hours per day # roundtrips Days per year Daily one-way person trips Winter Days of service per week 6 Hours per day 10 # roundtrips 20 Days per year 220 Daily one-way person trips 250 Transit Operating Costs Page 1 of 2

45
Travel Time Savings Memorandum
 04-05-2018 TABLE OF CONTENTS 1 Background 3 Methodology 3 Inputs and Calculation 3 Assumptions 4 Light Rail Transit (LRT) Travel Times 5 Auto Travel Times 5 Bus Travel Times 6 Findings 7 Generalized Cost
The Boston South Station HSIPR Expansion Project Cost-Benefit Analysis. High Speed Intercity Passenger Rail Technical Appendix
 The Boston South Station HSIPR Expansion Project Cost-Benefit Analysis High Speed Intercity Passenger Rail Technical Appendix Prepared by HDR August 5, 2010 The Boston South Station HSIPR Expansion Project
Benefit-Cost Analysis
 APPENDIX A Carbondale Station: Benefit-Cost Analysis April 2016 Location: Carbondale, Illinois Project Type: Urban Transit Multimodal Center Applicant: City of Carbondale Type of Applicant: City Government
Air Quality Impacts of Advance Transit s Fixed Route Bus Service
 Air Quality Impacts of Advance Transit s Fixed Route Bus Service Final Report Prepared by: Upper Valley Lake Sunapee Regional Planning Commission 10 Water Street, Suite 225 Lebanon, NH 03766 Prepared for:
Benefit-Cost Analysis
 APPENDIX A Southern Illinois Multi-Modal Station: Benefit-Cost Analysis October 2017 Location: Carbondale, Illinois Project Type: Urban Transit Multi-Modal Center Applicant: City of Carbondale Type of
2 VALUE PROPOSITION VALUE PROPOSITION DEVELOPMENT
 2 VALUE PROPOSITION The purpose of the Value Proposition is to define a number of metrics or interesting facts that clearly demonstrate the value of the existing Xpress system to external audiences including
Feasibility Study. Community Meeting March, North-South Commuter Rail Feasibility Study
 Feasibility Study Community Meeting March, 2017 1 Agenda 1. Welcome / Introductions 2. Background / Meeting Purpose 3. Progress to Date Options Evaluated Capital/Operating Costs Ridership 4. Financial
PEACHTREE CORRIDOR PARTNERSHIP. Current Status & Next Steps
 PEACHTREE CORRIDOR PARTNERSHIP Current Status & Next Steps PEACHTREE CORRIDOR PARTNERSHIP Why Peachtree? Why Now? I. THE CONTEXT High Level View of Phasing Discussion Potential Ridership Segment 3 Ease
Attachment C: Benefit-Cost Analysis Spreadsheet
 Attachment C: Benefit-Cost Analysis Spreadsheet TIGER VII Application Collier Blvd. Corridor Improvements June 5 th, 2015 Collier Blvd BCA Summary The Collier Boulevard Benefit Cost Analysis (BCA) has
QUALITY OF LIFE EXECUTIVE SUMMARY REPORT I O N S TAT I O N
 QUALITY OF LIFE EXECUTIVE SUMMARY REPORT UN I O N S TAT I O N T R AV E L by TR A I N Published September 2017 2015 PROGRESS MAP This document reports FasTracks progress through 2015 BACKGROUND RTD The
Summit County Greenhouse Gas Emissions Summary, 2017
 Summit County Greenhouse Gas Emissions Summary, 2017 In 2018, Summit County completed its first greenhouse gas inventory to better understand its emissions profile and to give insight to policies and programs
Bella Vista Bypass Benefit Cost Analysis
 Bella Vista Benefit Cost Analysis The Benefit Cost Analysis (BCA) was performed in accordance with the ARRA guidance provided in the Federal Register. These benefits and costs were quantified in accordance
Three ULTra Case Studies examples of the performance of the system in three different environments
 Three ULTra Case Studies examples of the performance of the system in three different environments airport application: London Heathrow : linking business and staff car parks through the access tunnel
Vanpooling and Transit Agencies. Module 3: Benefits to Incorporating Vanpools. into a Transit Agency s Services
 Vanpooling and Transit Agencies Module 3: Benefits to Incorporating Vanpools into a Transit Agency s Services A common theme we heard among the reasons why the transit agencies described in Module 2 began
Sustainability SFMTA Path to Platinum
 Sustainability SFMTA Path to Platinum Ed Reiskin San Francisco Municipal Transportation Agency, Director of Transportation San Francisco, CA Timothy Papandreou Deputy Director Strategic Planning & Policy
The Smart Growth Countywide Transit Master Plan
 Choose the Future The Smart Growth Transit Master Plan What is the Transit Master Plan? A robust and integrated plan to establish countywide public transportation priorities over the next thirty years
Needs and Community Characteristics
 Needs and Community Characteristics Anticipate Population and Job Growth in the City Strongest density of population and jobs in Ann Arbor are within the Study Area Population expected to grow 8.4% by
The Value of Travel-Time: Estimates of the Hourly Value of Time for Vehicles in Oregon 2007
 The Value of Travel-Time: Estimates of the Hourly Value of Time for Vehicles in Oregon 2007 Oregon Department of Transportation Long Range Planning Unit June 2008 For questions contact: Denise Whitney
Benefit-Cost Analysis
 APPENDIX A Southern Illinois Multi-Modal Station: Benefit-Cost Analysis Location: Carbondale, Illinois July 2018 Project Type: Urban Multi-Modal Transportation Center Applicant: City of Carbondale Type
STRATEGIC PRIORITIES AND POLICY COMMITTEE MAY 5, 2016
 STRATEGIC PRIORITIES AND POLICY COMMITTEE MAY 5, 2016 Shift Rapid Transit Initiative Largest infrastructure project in the city s history. Rapid Transit initiative will transform London s public transit
TRANSIT FEASIBILITY STUDY Town of Bradford West Gwillimbury
 TRANSIT FEASIBILITY STUDY Town of Bradford West Gwillimbury Open House Presentation January 19, 2012 Study Objectives Quantify the need for transit service in BWG Determine transit service priorities based
State Highway 32 East TIGER Discretionary Grant Application APPENDIX C - BENEFIT COST ANALYSIS REPORT
 State Highway 32 East TIGER Discretionary Grant Application APPENDIX C - BENEFIT COST ANALYSIS REPORT April 2016 I. COST-EFFECTIVENESS ANALYSIS A Benefit-Cost Analysis (BCA) was conducted in conformance
Benefit Cost Analysis
 Benefit Cost Analysis The Benefit Cost Analysis (BCA) was performed in accordance with the ARRA guidance provided in the Federal Register. These benefits and costs were quantified in accordance with the
Funding Scenario Descriptions & Performance
 Funding Scenario Descriptions & Performance These scenarios were developed based on direction set by the Task Force at previous meetings. They represent approaches for funding to further Task Force discussion
West Broadway Transit Study. Community Advisory Committee September 17, 2015
 West Broadway Transit Study Community Advisory Committee September 17, 2015 Introductions Community Engagement Summer Outreach Fall Outreach Technical Analysis Process Update Alternatives Review Economic
City of Pacific Grove
 Regional Study Utilizing Caltrans Intersection Evaluation Section 7: City of Pacific Grove s: FIRST STREET AT CENTRAL AVENUE Transportation Agency for Monterey County Prepared by Transportation Agency
CLRP. Performance Analysis of The Draft 2014 CLRP. Long-Range Transportation Plan For the National Capital Region
 NATIONAL CAPITAL REGION TRANSPORTATION PLANNING BOARD Item 12 CLRP Financially Constrained Long-Range Transportation Plan For the National Capital Region 2014 Performance Analysis of The Draft 2014 CLRP
CITY OF LONDON STRATEGIC MULTI-YEAR BUDGET ADDITIONAL INVESTMENTS BUSINESS CASE # 6
 2016 2019 CITY OF LONDON STRATEGIC MULTI-YEAR BUDGET ADDITIONAL INVESTMENTS BUSINESS CASE # 6 STRATEGIC AREA OF FOCUS: SUB-PRIORITY: STRATEGY: INITIATIVE: INITIATIVE LEAD(S): BUILDING A SUSTAINABLE CITY
Utah Transit Authority Rideshare. CTAA Conference June 12, 2014
 Utah Transit Authority Rideshare CTAA Conference June 12, 2014 UTA Statistics and Info A Public Transit Agency Six counties, about 1600 square miles Within this area is 80% of the state s population, an
METRONext. Vision & Moving Forward Plans. Board Workshop. December 11, DRAFT For Preliminary Discussion Only
 METRONext Vision & Moving Forward Plans Board Workshop December 11, 2018 Disclaimer This presentation is being provided solely for discussion purposes by the Board of Directors of the Metropolitan Transit
Tempe Streetcar. March 2, 2016
 Tempe Streetcar March 2, 2016 Tempe Profile 40 sq. miles, highest density in state University Town, center of region Imposed growth boundaries (density increase) Mixed use growth/intensifying land use
The Case for. Business. investment. in Public Transportation
 The Case for Business investment in Public Transportation Introduction Public transportation is an enterprise with expenditure of $55 billion in the United States. There has been a steady growth trend
Waco Rapid Transit Corridor (RTC) Feasibility Study
 Feasibility Study") Waco Rapid Transit Corridor (RTC) Feasibility Study Chris Evilia, Director of Waco Metropolitan Planning Organization Allen Hunter, General Manager Waco Transit System Jimi Mitchell, Project Manager AECOM
Waco Rapid Transit Corridor (RTC) Feasibility Study Chris Evilia, Director of Waco Metropolitan Planning Organization Allen Hunter, General Manager Waco Transit System Jimi Mitchell, Project Manager AECOM
GATRA/Plymouth Multimodal Transit Center Estimation of Downtown Parking Demand DRAFT August 18, 2011
 GATRA/Plymouth Multimodal Transit Center Estimation of Downtown Parking DRAFT August 18, 2011 As part of Task IIB, Determine Net Parking and Transit, Facility Needs, McMahon prepared estimates of current
CTfastrak Expansion. Stakeholder Meeting #4 Manchester Town Hall June 3, 2016
 CTfastrak Expansion Stakeholder Meeting #4 Manchester Town Hall June 3, 2016 Today s Agenda Phase I Update 2016 Service Plan Implementation Schedule & Cost Update Phase II Services Timeline Market Analysis
Ideas + Action for a Better City learn more at SPUR.org. tweet about this #DisruptiveTransportation
 Ideas + Action for a Better City learn more at SPUR.org tweet about this event: @SPUR_Urbanist #DisruptiveTransportation TNCs & AVs The Future Is Uncertain The Future Is Uncertain U.S. Dept of Transportation
Policy Note. Vanpools in the Puget Sound Region The case for expanding vanpool programs to move the most people for the least cost.
 Policy Note Vanpools in the Puget Sound Region The case for expanding vanpool programs to move the most people for the least cost Recommendations 1. Saturate vanpool market before expanding other intercity
Trip Generation Study: Provo Assisted Living Facility Land Use Code: 254
 Trip Generation Study: Provo Assisted Living Facility Land Use Code: 254 Introduction The Brigham Young University Institute of Transportation Engineers (BYU ITE) student chapter completed a trip generation
Parking & TOD around BART Stations. Jessica ter Schure November 1, 2009 Rail~Volution 2009 Boston, Massachusetts
 Parking & TOD around BART Stations Jessica ter Schure November 1, 2009 Rail~Volution 2009 Boston, Massachusetts Outline Background Replacement Parking Policy South Hayward BART MacArthur BART Parking Privatization
Michigan/Grand River Avenue Transportation Study TECHNICAL MEMORANDUM #18 PROJECTED CARBON DIOXIDE (CO 2 ) EMISSIONS
 EMISSIONS") TECHNICAL MEMORANDUM #18 PROJECTED CARBON DIOXIDE (CO 2 ) EMISSIONS Michigan / Grand River Avenue TECHNICAL MEMORANDUM #18 From: URS Consultant Team To: CATA Project Staff and Technical Committee Topic:
TECHNICAL MEMORANDUM #18 PROJECTED CARBON DIOXIDE (CO 2 ) EMISSIONS Michigan / Grand River Avenue TECHNICAL MEMORANDUM #18 From: URS Consultant Team To: CATA Project Staff and Technical Committee Topic:
West Broadway Transit Study. Minnesota APA Conference Charles Carlson, Metro Transit Adele Hall, SRF Consulting September 24, 2015
 West Broadway Transit Study Minnesota APA Conference Charles Carlson, Metro Transit Adele Hall, SRF Consulting September 24, 2015 Study Context: Blue Line Planning 2 Study Context: Arterial BRT Study completed
KANSAS CITY STREETCAR
 KANSAS CITY STREETCAR KAREN CLAWSON MID-AMERICA REGIONAL COUNCIL KANSAS CITY STREETCAR Regional Context Alternatives Analysis Kansas City Streetcar Project KANSAS CITY REGION KANSAS CITY REGION KANSAS
Travel and Tourism in Malaysia to 2017
 Published on Market Research Reports Inc. (https://www.marketresearchreports.com) Home > Travel and Tourism in Malaysia to 2017 Travel and Tourism in Malaysia to 2017 Publication ID: TMC0513014 Publication
Georgia Department of Transportation 2006 Fact Sheet Lovejoy to Atlanta Rail Line visit the website at
 Overview Georgia Department of Transportation 2006 Fact Sheet Lovejoy to Atlanta Rail Line visit the website at www.garail.com Commuter rail service between Lovejoy and Atlanta is ready for implementation:
Art Griffith, Capital Projects Manager, ,
 Part 1 Base Information 1. Project Title Broadway & Highlands Ranch Pkwy. Intersection Capacity and Safety Improvement Project 2. Project Start/End points or Geographic Area Provide a map with submittal,
Downtown Transit Connector. Making Transit Work for Rhode Island
 Downtown Transit Connector Making Transit Work for Rhode Island 3.17.17 Project Evolution Transit 2020 (Stakeholders identify need for better transit) Providence Core Connector Study (Streetcar project
Proposal for September 2006 Start of Commuter Rail from Lovejoy on the Macon Line to Atlanta
 Proposal for September 2006 Start of Commuter Rail from Lovejoy on the Macon Line to Atlanta Overview Commuter rail service between Lovejoy and Atlanta is ready for implementation: $87.08 Million is in
City of Marina. Regional Roundabout Study Utilizing Caltrans Intersection Control Evaluation Section 4: Transportation Agency for Monterey County
 Regional Roundabout Study Utilizing Caltrans Intersection Control Evaluation Section 4: City of Marina Study Intersections: RESERVATION ROAD AT BEACH ROAD RESERVATION ROAD AT DEFOREST ROAD CARDOZA AVENUE
Address Land Use Approximate GSF
 M E M O R A N D U M To: Kara Brewton, From: Nelson\Nygaard Date: March 26, 2014 Subject: Brookline Place Shared Parking Analysis- Final Memo This memorandum presents a comparative analysis of expected
KRM Corridor Transit Service Options: Frequently Asked Questions
 December 2008 KRM Corridor Transit Service Options: Frequently Asked Questions by Thomas A. Rubin and Robert W. Poole, Jr. FREQUENTLY ASKED QUESTIONS 1 2 3 4 5 6 7 8 How many net new transit riders would
Green Line Long-Term Investments
 Enhancements Short-term improvements to keep Austin moving. Investments Long-term projects to support our future. Mobility Hubs MetroRapid MetroRail MetroExpress Connectors Circulators Project Connect
Central Maryland Transit Development Plan
 Central Maryland Transit Development Plan Planning the Future of Transit in Our Region Anne Arundel County Transportation Commission December 13, 2017 Anne Arundel County Howard County Prince George s
Bi-County Transitway/ Bethesda Station Access Demand Analysis
 Bi-County Transitway/ Bethesda Station Access Demand Analysis Prepared for: Washington Metropolitan Area Transit Authority Office of Planning and Project Development May 2005 Prepared by: in conjunction
Transportation 2040: Plan Performance. Transportation Policy Board September 14, 2017
 Transportation 2040: Plan Performance Transportation Policy Board September 14, 2017 Today Background Plan Performance Today s Meeting Background Board and Committee Direction 2016-2017 Transportation
METRO Orange Line BRT American Boulevard Station Options
 METRO Orange Line BRT American Boulevard Station Options Bloomington City Council Work Session November 18, 2013 Christina Morrison BRT/Small Starts Project Office Coordinating Planning and Design AMERICAN
Transportation: On the Road to Cleaner Air Did you know?
 Opposite and above State transportation officials are urging commuters to use mass transit, carpool, ride a bike, or to telecommute, in a campaign to help communities get cleaner air. Cities are also turning
TBARTA USF to Wesley Chapel Express Bus Service Operating Plan. Draft 3/25/2014
 TBARTA USF to Wesley Chapel Express Bus Service Operating Plan Draft 3/25/2014 March 2014 Table of Contents 1.0 Introduction... 1 2.0 Study Area... 1 3.0 Existing Available Service... 3 4.0 Proposed Service...
DRAFT Evaluation Scores. Transit
 DRAFT Evaluation s The criteria for evaluating applications for new funding commitments are used to measure how well they advance the six goals identified for the MTP. Through transportation: Reduce per
Alternative 3 Air Quality and Climate Change Calculations
 Alternative 3 Air Quality and Climate Change Calculations 10/15/2009 07:40:06 PM Urbemis 2007 Version 9.2.4 Combined Summer Emissions Reports (Pounds/Day) File Name: Z:\Alan Sako\112.23 OVOV\Alternatives\OVOV
Mass Transit in Charlotte and San Antonio. Keith T. Parker, AICP
 Mass Transit in Charlotte and San Antonio Keith T. Parker, AICP President/CEO Presentation Overview Charlotte Agency and Customer Profile San Antonio Agency and Customer Profile Attracting New Customers
UTA Transportation Equity Study and Staff Analysis. Board Workshop January 6, 2018
 UTA Transportation Equity Study and Staff Analysis Board Workshop January 6, 2018 1 Executive Summary UTA ranks DART 6 th out of top 20 Transit Agencies in the country for ridership. UTA Study confirms
TRAVEL DEMAND FORECASTS
 Jiangxi Ji an Sustainable Urban Transport Project (RRP PRC 45022) TRAVEL DEMAND FORECASTS A. Introduction 1. The purpose of the travel demand forecasts is to assess the impact of the project components
CEDAR AVENUE TRANSITWAY Implementation Plan Update
 CEDAR AVENUE TRANSITWAY Implementation Plan Update EECUTIVE SUMMARY DECEMBER 2015 Executive Summary In 2013, the Twin Cities metropolitan area s first bus rapid transit (BRT) line, the METRO Red Line,
Treasure Island Mobility Management Program
 Treasure Island Mobility Management Program Preliminary Toll Policy Recommendations For Buildout Year (2030) Draft SAN FRANCISCO COUNTY TRANSPORTATION AUTHORITY May 20, 2015 About the Treasure Island Mobility
Presentation A Blue Slides 1-5.
 Presentation A Blue Slides 1-5. 1 Presentation A Blue Slides 1-5. 2 Presentation A Blue Slides 1-5. 3 Presentation A Blue Slides 1-5. 4 Presentation A Blue Slides 1-5. 5 Transit Service right. service
DEVELOPMENT OF RIDERSHIP FORECASTS FOR THE SAN BERNARDINO INFRASTRUCTURE IMPROVEMENT STUDY
 APPENDIX 1 DEVELOPMENT OF RIDERSHIP FORECASTS FOR THE SAN BERNARDINO INFRASTRUCTURE IMPROVEMENT STUDY INTRODUCTION: This Appendix presents a general description of the analysis method used in forecasting
PHILADELPHIA SUBURBAN RAIL SUMMARY (COMMUTER RAIL, REGIONAL RAIL)
") PHILADELPHIA SUBURBAN RAIL SUMMARY (COMMUTER RAIL, REGIONAL RAIL) October 2003 The Philadelphia commuter rail service area consists of 5.1 million people, spread over 1,800 square miles at an average population
PHILADELPHIA SUBURBAN RAIL SUMMARY (COMMUTER RAIL, REGIONAL RAIL) October 2003 The Philadelphia commuter rail service area consists of 5.1 million people, spread over 1,800 square miles at an average population
Restoration of Historic Streetcar Services in Downtown Los Angeles
 Restoration of Historic Streetcar Services in Downtown Los Angeles Early Scoping Meeting for Alternatives Analysis (AA) May 17, 2011 Introduction Key players Local lead agency: Metro Federal lead agency:
Background Information about the Metrobus 29 Lines Study
 Background Information about the Metrobus 29 Lines Study Questions Overview of Existing Service Q. Why is the study being conducted? A. The 29 Lines provide an important connection between Annandale and
The capital cost estimates do not include allowances for: ROW acquisition. Third-party mitigation works. Hazardous materials handling.
 Mode Selection Report 7 Cost Evaluation The cost evaluation criteria used in the evaluation of the transit modes are: Capital cost. operating costs. Fare revenue. Net cost per passenger/passenger-mile.
San Francisco Mobility, Access & Pricing Study
 San Francisco Mobility, Access & Pricing Study SAN FRANCISCO COUNTY TRANSPORTATION AUTHORITY Summer Workshops 2010 Downtown Growth Projections + 24,000 hsg units + 107,000 jobs +184,000 auto trips +88,000
Passenger rail service is returning to Greenfield!
 Passenger rail service is returning to Greenfield! How do we take advantage of this opportunity to boost our economy? Greenfield s train station circa 1920 Greenfield s train stop in 2014 Current Passenger
Connect. Thrive. Develop. KC Streetcar Riverfront Extension & Multi-Modal Feasibility Study
 Connect. Thrive. Develop. Why go to the Riverfront? KC Streetcar is a proven catalyst for development & connecting people to Downtown. < $2 billion in adjacent development: new businesses, hotels, apartments
Caltrain Downtown Extension Study Ridership Forecast Summary
 Caltrain Downtown Extension Study Ridership Forecast Summary presented to Transbay Joint Powers Authority presented by Cambridge Systematics date: March 12, 2009 Transportation leadership you can trust.
Red Line/Healthline Extension Major Transportation Improvement Analysis Tier 2 Detailed Alternatives Screening Report
 Greater Cleveland Regional Transit Authority August 2014 Red Line/Healthline Extension Major Transportation Improvement Analysis Tier 2 Detailed Alternatives Screening Report GREATER CLEVELAND REGIONAL
Miami Streetcar Efficient Transportation. A Discussion on Future Transportation Opportunities
 Miami Streetcar Efficient Transportation A Discussion on Future Transportation Opportunities Discussion Item City Commission Meeting September 29 th, 2014 Miami Streetcar has been supported through the
Table 8-1: Service Frequencies for All Short-List Alternatives by Day of Week and Time of Day Frequency Day of Week Time of Day Time Period
 8. Operating Plans The following Section presents the operating plans for the Short-List Alternatives. The modern streetcar operating plans are presented for Alternatives 2 and 3, followed by bus rapid
Chapter 7: Travel Demand Analysis. Chapter 8. Plan Scenarios. LaSalle Community Center. Image Credit: Town of LaSalle
 Chapter 7: Travel Demand Analysis Chapter 8 Plan Scenarios LaSalle Community Center. Image Credit: Town of LaSalle 164 Chapter 8: Plan Scenarios Moving Ahead for Progress in the 21 st Century Act (MAP
LADOT Enhancing Transit Services through Competitive Bidding
 LADOT Enhancing Transit Services through Competitive Bidding Corinne Ralph, Chief of Transit Programs City of Los Angeles Department of Transportation October 1, 2018 LADOT Vision Los Angeles will have
ROCHESTER, MINNESOTA
 ROCHESTER, MINNESOTA Rochester Public Works TRANSIT AND PARKING DIVISION Transit and Parking Manager Tony Knauer tknauer@rochestermn.gov SERVICE ATTITUDE CONSISTENCY - TEAMWORK ROCHESTER TRANSIT & PARKING
Port of South Louisiana. Benefit Cost Analysis. Globalplex Intermodal Efficiency Improvements Project
 October 2017 Port of South Louisiana Benefit Cost Analysis Globalplex Intermodal Efficiency Improvements TIGER IX Grant Cost-Benefit Analysis in Support of the Globalplex Intermodal Efficiency Improvements
Chapter 4 : THEME 2. Transportation
 Chapter 4 : THEME 2 Strengthen connections to keep the Central Area easy to reach and get around 55 Figure 4.2.1 Promote region-wide transit investments. Metra commuter rail provides service to the east,
Kendall Drive Premium Transit PD&E Study Project Kick-Off Meeting SR 94/Kendall Drive/SW 88 Street Project Development and Environment (PD&E) Study
 Study") Florida Department of Transportation District Six Kendall Drive Premium Transit PD&E Study Project Kick-Off Meeting SR 94/Kendall Drive/SW 88 Street Project Development and Environment (PD&E) Study What
Florida Department of Transportation District Six Kendall Drive Premium Transit PD&E Study Project Kick-Off Meeting SR 94/Kendall Drive/SW 88 Street Project Development and Environment (PD&E) Study What
Kenosha-Racine-Milwaukee (KRM)
") Kenosha-Racine-Milwaukee (KRM) Commuter Rail #147925 November 6, 2009 1 Guidance of KRM Commuter Rail Studies Intergovernmental Partnership Technical Steering Committee Temporary and Limited Authority
Kenosha-Racine-Milwaukee (KRM) Commuter Rail #147925 November 6, 2009 1 Guidance of KRM Commuter Rail Studies Intergovernmental Partnership Technical Steering Committee Temporary and Limited Authority
Help shape your community investment in Wake Transit. Fiscal Year 2019 Draft Work Plan Summary
 Help shape your community investment in Wake Transit Fiscal Year 2019 Draft Work Plan Summary Wake County, growth and transit The Triangle is one of the fastest-growing regions in the nation. Wake County
METRO TRANSIT a n n ua l re p o r t. madison, wisconsin // mymetrobus.com
 METRO TRANSIT 2016 a n n ua l re p o r t madison, wisconsin // mymetrobus.com metro transit In 2016, Metro Transit took steps to address capacity issues both on and off the road. Off the road, Metro began
The City of Toronto s Transportation Strategy July 2007
 The City of Toronto s Transportation Strategy July 2007 Presentation Outline Transportation Statistics Transportation Building Blocks Toronto s Official Plan Transportation and City Building Vision Projects
Treasure Island Mobility Management Program
 Treasure Island Mobility Management Program Preliminary Toll Policy Recommendations For Buildout Year (2030) Draft TIDA CAB June 2, 2015 About the Treasure Island Mobility Management Program 2003 2008
SFMTA Energy Use by Vehicle Type: Transit Investments vs Life Cycle Costs
 SFMTA Energy Use by Vehicle Type: Transit Investments vs Life Cycle Costs Peter Brown Project Manager, Long Range Planning Sustainable Streets Division 10 17 2011 Lake Arrowhead, California Outline of
METRO Light Rail Update
 American Society of Highway Engineers METRO Light Rail Update Brian Buchanan Director, Design and Construction October 13, 2009 1 High Capacity Transit System 2 20-Mile Light Rail Line 3 Operations Operations
Contents. Executive Summary...1 Introduction...2 Operating Plan...4 System Connectivity...5
 Contents Executive Summary...1 Introduction...2 Operating Plan...4 System Connectivity...5 Project Benefits...6 Economic Growth...7 Infrastructure Improvements...9 Quality of Life... 11 Next Steps... 12
Charlotte Area Transit System: Moving Forward John Lewis CATS Chief Executive Officer
 Charlotte Area Transit System: Moving Forward John Lewis CATS Chief Executive Officer House Select Committee March 2018 1 Charlotte Long-Term Growth Management Strategy Centers, Corridors and Wedges Five
Madison BRT Transit Corridor Study Proposed BRT Operations Plans
 Madison BRT Transit Corridor Study Proposed BRT Operations Plans This paper presents a description of the proposed BRT operations plan for use in the Madison BRT Transit Corridor Study. The objective is
EMBARGOED UNTIL RELEASE AT 8:30 A.M. EST, WEDNESDAY, JANUARY 30, 2013 GROSS DOMESTIC PRODUCT: FOURTH QUARTER AND ANNUAL 2012 (ADVANCE ESTIMATE)
") NEWS RELEASE EMBARGOED UNTIL RELEASE AT 8:30 A.M. EST, WEDNESDAY, JANUARY 30, 2013 Lisa Mataloni: (202) 606-5304 (GDP) gdpniwd@bea.gov Recorded message: (202) 606-5306 BEA 13-02 GROSS DOMESTIC PRODUCT:
NEWS RELEASE EMBARGOED UNTIL RELEASE AT 8:30 A.M. EST, WEDNESDAY, JANUARY 30, 2013 Lisa Mataloni: (202) 606-5304 (GDP) gdpniwd@bea.gov Recorded message: (202) 606-5306 BEA 13-02 GROSS DOMESTIC PRODUCT:
Review of the Wake County Transit Plan
 Review of the Wake County Transit Plan David T. Hartgen Thomas A. Rubin February 2012 EXECUTIVE S U M MARY Review of the Wake County Transit Plan By David T. Hartgen, Ph.D., P.E. The Hartgen Group Charlotte,
The Village at Playa Vista. Appendix E-6. Alternative Analysis
 The Village at Playa Vista Appendix E-6 Alternative Analysis E-6a Remaining Existing Specific Plan Operations Summary Electricity and Natural Gas Usage URBEMIS2002 Output Files Miscellaneous Sources Emissions
EMBARGOED UNTIL RELEASE AT 8:30 A.M. EST, WEDNESDAY, JANUARY 31, 2007 GROSS DOMESTIC PRODUCT: FOURTH QUARTER 2006 (ADVANCE)
") NEWS RELEASE EMBARGOED UNTIL RELEASE AT 8:30 A.M. EST, WEDNESDAY, JANUARY 31, 2007 Virginia H. Mannering: (202) 606-5304 BEA 07-02 Recorded message: (202) 606-5306 GROSS DOMESTIC PRODUCT: FOURTH QUARTER
NEWS RELEASE EMBARGOED UNTIL RELEASE AT 8:30 A.M. EST, WEDNESDAY, JANUARY 31, 2007 Virginia H. Mannering: (202) 606-5304 BEA 07-02 Recorded message: (202) 606-5306 GROSS DOMESTIC PRODUCT: FOURTH QUARTER
Commuter Transit Service Feasibility
 Commuter Transit Service Feasibility West Michigan Transit Linkages Study Submitted to: Ottawa County, Michigan Submitted by: MP2PLANNING, LLC AUGUST 2012 Table of Contents 1. Introduction... 2 2. Overall
The Latest on Joint Development Policy Guidance
 Panelists The Latest on Joint Development Policy Guidance Moderator: Jonathan Davis Deputy General Manager and Chief Financial Officer Massachusetts Bay Transportation Authority James Blakesley, Attorney-Advisor,
NEW YORK SUBURBAN RAIL SUMMARY (COMMUTER RAIL, REGIONAL RAIL)
") NEW YORK SUBURBAN RAIL SUMMARY (COMMUTER RAIL, REGIONAL RAIL) October 2003 New York: The New York commuter rail service area consists of 20.3 million people, spread over 4,700 square miles at an average
NEW YORK SUBURBAN RAIL SUMMARY (COMMUTER RAIL, REGIONAL RAIL) October 2003 New York: The New York commuter rail service area consists of 20.3 million people, spread over 4,700 square miles at an average