Red Line/Healthline Extension Major Transportation Improvement Analysis Tier 2 Detailed Alternatives Screening Report
|
|
|
- Bennett Owen
- 6 years ago
- Views:
Transcription


1 Greater Cleveland Regional Transit Authority August 2014 Red Line/Healthline Extension Major Transportation Improvement Analysis Tier 2 Detailed Alternatives Screening Report
2 GREATER CLEVELAND REGIONAL TRANSIT AUTHORITY RED LINE / HEALTHLINE EXTENSION MAJOR TRANSPORTATION IMPROVEMENT ANALYSIS TIER 2 DETAILED ALTERNATIVES SCREENING REPORT VERSION 3 Prepared by: AECOM 1001 Lakeside Avenue, Suite 1010 Cleveland, OH August 2014
3 Table of Contents 1. Introduction Tier 2 Alternatives Evaluation of Alternatives Goal 1 Mobility Accessibility and Ridership New Starts Mobility Benefit Highway and Traffic Impacts Goal 2 Economy Estimates of Probable Capital Cost Expenditures Estimated Total Capital Costs for Cuyahoga County Extensions Estimated Total Capital Costs for Extensions to Lake County Estimated Annualized Capital Costs Estimates of Probable Operating and Maintenance Costs Annualized Cost per Trip on Project Annualized Cost per Trip on Project Goal 3 Environment Decrease Vehicle Miles Traveled (VMT) Potential for Reductions in Carbon Footprint Air Quality Decrease Use of Single Occupant Vehicles Decrease Energy Consumption Natural Resources Goal 4 Livability Number of Streets Closed or Improved with Complete Streets Treatments Number of Cultural Resources Impacted Number of Households Affected within 25 yards of the Alignment Impacts on Public Parklands and Open Spaces Number of Zero Car Households Public Comment Summary of Analysis Next Steps i
4 List of Tables Table 1-1 Criteria Used in the Tier 2 Screening Assessment... 2 Table 3-1: Alignment Alternatives Catchment Area Analysis... 4 Table 3-2: Transit Trips on Project with Frequency Sensitivity Tests... 6 Table 3-3: Transit Trips on Project with Downtown Euclid Sensitivity Tests... 7 Table 3-4: Transit Trips on Project with Lake County Sensitivity Tests... 8 Table 3-5: New Start Mobility Improvements Criterion... 9 Table 3-6: Changes in Annual Automobile Vehicle Miles Traveled Table 3-7: Estimates of Probable Capital Expenditures East 260 th Street Terminus Table 3-8: Estimates of Probable Capital Expenditures East 300 th Street/Shoregate Table 3-9: Annual Net Operating & Maintenance Expenditures East 260 th Street Terminus Table 3-10: Annual Net Operating & Maintenance Expenditures East 300 th Street/Shoregate Table 3-11: Cost Effectiveness Index Cost per Trip Babbitt Road/East 260 th Street Terminus Table 3-12: Cost Effectiveness Sensitivity Tests for Frequency and Terminus (Alternatives E and G) Table 3-13: Alignment Alternatives Catchment Area Analysis Table 3-14: Alignment Alternatives Catchment Area Analysis Appendix - Maps Appendix A Figure 1 Study Area Map....A-1 ii
5 1. Introduction The Greater Cleveland Regional Transit Authority (RTA) is examining potential Red Line/HealthLine transit extensions. A series of initial alternatives have been defined by the study team after a series of public meetings held in the study area September 10-12, These initial alignments were screened in accordance with the Alternatives Analysis Methodology Report (November 2013). The screening process included subjecting alignments to two levels of sifting. The first level of sifting examined transit technologies that were suitable for operation along the alignment. The second level of sifting examined engineering constraints, environmental red flags, operational issues and travel market characteristics defined by the number of people and jobs within station catchment areas. The Tier 1 Screening Report (December 2013) resulted in advancing a series of alternatives to more detailed technical analysis. These alternatives were defined in the Definition of Tier 2 Alternatives Report (April2014). The proposed alternatives for the Red Line/HealthLine Extension were evaluated based on the project goals and objectives conceived during project scoping. Evaluation criteria were developed directly from these project goals and objectives, which flowed from the purpose of the project. These evaluation factors include transportation impacts, cost-effectiveness, potential for transit oriented development and growth near stations and likely community support. The goals, objectives and evaluation criteria were highlighted in the Purpose and Need Report. The evaluation will center on the principle goals of the Red Line/HealthLine Extension: Goal 1: Mobility Providing more transportation choices, especially for transit dependent groups, such as low-income and minority populations, and the aged to jobs, housing and other trip purposes. Provide high-quality bus and rapid transit service for local trips between new employment in the eastern suburbs and the core study area, as well as for access to key core destinations, including University Circle and downtown Cleveland. Increase transit ridership and mode share for all communities. Establish a more balanced transportation system which enhances modal choices and encourages walking, bicycle and transit use.. Goal 2: Economy and Economic Development Provide cost effective solutions and value for money invested. Encourage transit-oriented mixed-use development along the corridor that would support population and employment growth along the corridor. Reinvest in the local economy by maximizing the economic impact of transportation investments as related to land use redevelopment, infrastructure improvements, and housing. Support regional economic development initiatives. Incorporate considerations into new development design that support transit as a transportation option. Goal 3: Environmental Sustainability Delivering world-leading performance in environmental sustainability through responsible use of resources, minimizing pollution, and preserving Cleveland s environment. Minimize adverse air, land and water environmental impacts of transportation investments. Serve households at a range of income levels. Support lifestyle choices for environmentally sustainable communities. Implement strategies for reducing transportation-related greenhouse gas emissions. Promote green and sustainable technologies and solutions that enhance economic development opportunities. Goal 4: Strengthen Study Area Image and Identity Support private investments in transit friendly, and pedestrian and bicycle-focused developments. Support improvements in neighborhood connectivity through attention to safety, comfort and aesthetics in the design of transportation infrastructure. Serve areas of and complement initiatives for affordable housing. The screening criteria included stakeholder comment, ridership, competitive travel times (versus automobile travel), potential environmental impacts, and ability to integrate with other public 1
6 transportation services. The following table outlines indicative criteria used in the Tier 2 screening assessment: Table 1-1 Criteria Used in the Tier 2 Screening Assessment Goal Objective Indicative Tier 2 Screening Criteria Mobility Economy Environment Livability Improve regional connectivity Promote positive benefits of public transportation access to significant sites and neighborhoods Enhance the pedestrian realm Provide convenient accessibility and improve interchange with other modes of public transportation Reduce reliance on automobile Minimize total travel times to points accessible from the proposed metro rail and bus network Increase public transportation ridership and mode share Provide for the long-term expansion of the future public transportation system Provide pedestrian and bicycle accessibility to transit Minimize congestion Provide improved access to employment centers Provide a cost-effective project that moves the most people at the lowest cost Improve operating efficiency by lowering operating costs Take account of life-cycle costs when planning alternatives; and Optimize and prioritize investment initiatives to maximize benefits. Preserve the critical natural environment Protect and enhance the cultural heritage, landmarks, national symbols and monuments Decrease dependency on single occupant vehicle Decrease energy consumption and vehicle miles traveled Improve air quality Minimize adverse impacts on existing neighborhoods and communities. Improve health and safety for workforce, passengers and communities Integrate transportation and land use by locating stations where there is greatest potential for TODs. Integrate with local development plans Enhance urban design features and complete streets program Number of jobs within ½-mile of the stations Number of people within ½-mile of the station Travel time savings and other transportation system user benefits Travel time saving per passenger mile Total trips on project Congestion relief (reduction in highway trips or trips diverted to transit; change in mode shares and VMT) Peak period travel times Comparison of highway, and transit trips times between major travel pairs) (running times, headways, average system speed and station spacing) Transit network length Number of stations Estimates of probable capital costs Estimates of probable operating and maintenance costs Annualized cost per rider O&M cost per passenger mile Annualized costs per new transit rider Vehicle-miles traveled (VMT) within study area Potential for reductions in CO2. Air quality. Decrease in single occupant vehicles Natural resources Number of streets closed or improved with complete streets treatments Number of buildings impacted Number of residential households impacted Number of households affected within 25 yards of the alignment Impacts on public parklands and open spaces Number of zero car households 2
7 This report documents the detailed technical analysis conducted as part of the Tier 2 screening. A comparison of how well each alternative meets the study goals and objectives and FTA New Starts criteria is presented in this Tier 2 Detailed Alternatives Screening Report. 2. Tier 2 Alternatives All of the alternatives are defined in the Definition of Tier 2 Alternatives Report and are illustrated in Appendix A. A brief description of each alternative is provided below: Alternative B Alternative B is an electrified heavy rail Red Line extension that begins at Louis Stokes Station at Windermere and continues to run east adjacent to the Norfolk Southern (NS) freight railroad corridor. Alternative B would terminate at the Euclid Park-N-Ride near the intersection of St Clair Avenue and Babbitt Road in the vicinity of Euclid Square Mall. As seen in Figure 1, Appendix A, this line could potentially be extended to Lake County with stations in Wickliffe, Willoughby and Mentor. Results of the sensitivity tests examining a Lake County terminus are described in Section An alternative to the heavy rail technology would be the utilization of dieselelectric hybrid commuter rail technologies (DMU) that could operate on Red Line and Norfolk Southern tracks. The DMU would operate from Tower City to the Euclid Park-N-Ride, as described in the Definition of Tier 2 Alternatives Report. Alignment E Alternative E is a HealthLine bus rapid transit or Rapid+ LRT/streetcar extension that begins at Louis Stokes Station at Windermere and runs east along Euclid Avenue to Ivanhoe Road where the alignment turns north to East 152 nd and St. Clair. At Five Points the alignment continues north on East 152 nd Street crossing over the CSX railroad on a bridge to Waterloo Road, then turning east through the Waterloo Arts District to East 156 th Street. The alignment again turns north on East 156 th Street until reaching Lake Shore Boulevard, where it turns east to East 260 th Street. As described in Section , sensitivity tests were done to determine if an extension into Lake County would be feasible. Alignment G Alternative G is a HealthLine bus rapid transit or Rapid+ LRT/streetcar extension that begins at Louis Stokes Station at Windermere and runs east along Euclid Avenue to Ivanhoe Roads. At Ivanhoe Road the alignment turns northwest to East 152nd where it turns north and travels along East 152nd Street to Five Points at Ivanhoe and St. Clair. At Five Points the alignment turns east on St Clair Avenue to Nottingham Road and then turns north under the railroad overpass until reaching East 185th Street. At East 185th Street, the alignment turns northeast and travels along East 185th Street serving the East 185th commercial district up to Lake Shore Boulevard. At Lakeshore Boulevard the alignment turns east to East 260 th Street. As described in Section , sensitivity tests were done to determine if an extension into Lake County would be feasible. 3. Evaluation of Alternatives 3.1 Goal 1 Mobility This section summarizes how each alternative promotes economic competitiveness and regional vitality by examining the improvements to regional mobility, including public transportation ridership impacts and local roadway impacts. 3
8 3.1.1 Accessibility and Ridership Ridership is used as a proxy for measuring economic and mobility benefits. This study assumes that people who use a new public transportation service are receiving benefits and therefore the higher the ridership, the greater the economic benefit. Mobility benefits are measured by accessibility to the system and public transportation system boardings or trips on project. One is a measure of potential users and the second measures the intensity of project use. For the alternatives analysis, RTA used the simplified national model called Simplified Trips On Project Software (STOPS). This model was developed to assist transit agencies in streamlining the length of time required to generate the ridership estimates and vehicle miles traveled data for use in the project justification evaluation measures. FTA officially introduced STOPS in September The STOPS model defines bus rapid transit, light rail transit and heavy rail transit in terms of speed and other characteristics that affect individual transportation choice behaviors Accessibility Accessibility is measured by the number of people living or working within ½-mile of station entrances, which is the FTA New Starts criterion for project evaluation. The length of the line and number of stations contributes to the accessibility measure illustrating the number of people and jobs with easy access of each line and station. This study also examined the ¼-mile catchment, which is RTA standard for comfortable walk distance during the extreme cold of the winter season. The differences in ridership among the alignments under consideration are due in large measure to the access of the system as measured by the proximity of residents and jobs to the station locations for each alignment. Table 3-1 tabulates the number of residents and jobs within station catchment areas, which are the ¼-mile and ½-mile radii distances measured from the center of the station platform. The estimate is the based on the 2010 census and the East 260 th Street terminus for the Rapid+ and BRT options of Alternatives E and G. Table 3-1: Alignment Alternatives Catchment Area Analysis Criteria Alt B Alt E Alt G Alignment Features Terminus Babbitt E. 260 th E. 260 th Length of alignment Number of stations ¼-mile catchment Population 7,385 27,242 24,679 Employment 2,233 4,659 4,928 Total population + employment 9,618 31,901 29,607 Total catchment per station 1, , ,287.3 Total catchment per mile 1, , ,
9 Criteria Alt B Alt E Alt G ½-mile catchment Population 24,752 54,470 53,012 Employment 10,050 8,744 10,117 Total population + employment 34,802 63,214 63,129 Total catchment per station 4, , ,744.7 Total catchment per mile 5, , ,012.3 Source: US Census The total ¼-mile catchment of Alternative B is approximately percent of the total catchment of Build alternatives E and G respectively. However, the total catchment per station for Alternative B is nearly identical to Alternatives E and G. Total catchment per mile for Alternative B is approximately percent of the total catchment for Alternatives E and G respectively. Total ¼-mile catchment for Alternative E when compared to Alternative G is slightly higher, with E having more people and G having more jobs within the ¼-mile catchment area. The total ½-mile catchment of Alternative B is approximately 55 percent of the total catchment of Build alternatives E and G. However, the total catchment per station for Alternative B is 1.8 times more than the total catchment per station for Alternatives E and G. Total catchment per mile for Alternative B is approximately 90 percent of the total catchment for Alternatives E and G. Total catchment for Alternative E when compared to Alternative G is nearly identical with E having slightly more people and G having slightly more jobs within the ½-mile catchment area Ridership Public transportation ridership is typically quantified in two ways. Summing transit boardings is the most common measure. A transit boarding occurs whenever a passenger boards a public transportation vehicle in the course of making a trip. Boardings are calculated for peak travel in the peak direction and at stations as a means of determining system capacity at peak loading points. Station level ridership allows designs to consider the passenger flows at these critical locations along the routes being evaluated. Peak hour boardings are then factored up based on survey data to derive average daily ridership. A linked trip is the other common measure of ridership. A linked trip includes all segments of a trip that a passenger travels from a trip origin to a trip destination. For example, a linked trip could include a walk from home to a bus stop, a bus ride with a transfer to a rail route, and a walk to the final destination. A single linked trip could require more than one transit boarding, especially if transfers are required. The FTA New Starts guidance uses the linked trip as its underlying measure of system effectiveness. A transit trip is considered as a project linked trip if the trip involves boarding or alighting at one of the project stations. Table 3-2 shows the operating statistics and average weekday transit trips on the project for the proposed Build alternatives under consideration. STOPS forecasts of linked trips on the project are very similar for all the alternatives, ranging from 8,200 for Alternative B (DMU) to 9,800 trips for Alternative G (BRT) and Alternative B (HRT). The STOPS model estimates that approximately 30 percent of the riders require a transfer. 5
10 Table 3-2: Transit Trips on Project with Frequency Sensitivity Tests Alternative B Alternative E Alternative G HRT DMU Rapid+ BRT Rapid+ BRT Operating Statistics Terminus Babbitt Babbitt E. 260 th E. 260 th E. 260 th E. 260 th Route Miles Percent dedicated transit 100.0% 100.0% 54.5% 54.5% 34.4% 34.4% Directional Route Miles Stations Ridership Estimates Peak Period Frequency 15 min 15 min (east from Tower City) 15 min 7 min 15 min 7 min Daily trips on project 9,800 8,200 8,800 9,500 9,000 9,800 Annualized trips on project (Millions of Trips) Ridership Estimates Sensitivity Tests (Frequency) Peak Period Frequency 7.5 min 15 min (east from Windermere) n/a 15 min n/a 15 min Daily trips on project 13,400 3,700 n/a 5,800 n/a 6,200 Annualized trips on project (Millions of Trips) n/a 1.74 n/a 1.86 Source: AECOM, STOPS model runs April When matching existing Red Line and HealthLine frequencies, Alternative B (HRT) and Alternative G (BRT) have the highest total daily transit trips on the project at 9,800 trips. Alternative E (BRT) has the second highest ridership at 9,500 trips. If the Red Line frequency for Alternative B was increased to 7½ -minute headways, ridership on the project would increase to 13,400 trips per day. The Rapid+ (light rail/streetcar) options for Alternatives E and G generate fewer passenger boardings and linked transit trips than the BRT. This is because the Rapid+ has lower frequency of service in the peak period than the BRT alternatives. Rapid+ matches the headways of the Red Line at 15 minutes and the BRT options matches the headways of the HealthLine with 7-6
11 minute average headway during the peak periods. On average, there are more trips per day on the BRT than the Rapid+ options resulting in greater choices for travelers. However, if the BRT options for Alternatives E and G operated on the same 15-munute headway as the Rapid+ option, ridership would be lower. Sensitivity tests using the STOPS model indicated that Alternatives E and G (BRT) would generate only 5,800 to 6,200 trips per day when compared to the 8,800 to 9,000 trips of the Rapid+ option. Finally, Alternative B (DMU) generates fewer trips than the HRT alternative operating at the same frequencies. If the DMU operated with a forced transfer at Windermere on the existing 15-minute headway, ridership is substantially lower and is estimated to be 3,700 trips. Operating at a 30-minute headway in the off-peak period connecting to every other Red Line train at Windermere and maintaining a 15-minute frequency during the peak periods, trips drop to 2,900. Analysis of Logical Termini Additional ridership sensitivity tests were done to ensure the appropriate termini for the remaining alternatives had been selected. A key threshold to consider when analyzing logical termini is the FTA statutory requirement for dedicated transitway that requires a BRT project to have at least 50% of its alignment operating in a transit-only lane to qualify for funding 1. Terminate Service in Downtown Euclid (East 222 nd Street): Downtown Euclid/East 222 nd Street was the original terminus of for the street-running alternatives (E and G). The terminus was extended to East 260 th at the request of the Steering Committee in January 2014, as described in the Definition of Tier 2 Alternatives Report. Sensitivity tests were done to ensure there was an added benefit to this 1.4 mile extension. Cutting back service to Downtown Euclid/East 222 nd Street would result in slightly lower trips on the project, resulting in approximately 600 fewer trips (depending on alternative and technology option) than continuing the service to East 260 th Street. In addition, by reducing the length of the dedicated transitway to below 50 percent of the total project length results in a project that does not comply with statutory requirements of the latest FTA guidance for definition of a BRT project. Therefore, East 260 th Street should be the furthest west termini that is considered. Table 3-3: Transit Trips on Project with Downtown Euclid Sensitivity Tests Alternative B Alternative E Alternative G HRT DMU Rapid+ BRT Rapid+ BRT Operating Statistics Terminus Babbitt Rd Babbitt Rd E. 222 nd E. 222 nd E. 222 nd E. 222 nd Route Miles Percent dedicated transit 100.0% 100.0% 45.2% 45.2% 20.5% 20.5% Directional Route Miles Chapter 53, Title and 5309; Proposed Circular FTA C State of Good Repair Grants Program: Guidance and Application Instructions; March,
12 Alternative B Alternative E Alternative G Stations Peak Period Frequency 15 min 15 min 15 min 7 min 15 min 7 min Ridership Estimates with Downtown Euclid Termini Daily trips on project 9,800 8,200 8,200 8,900 8,500 9,300 Decrease from East 260th 0 0 (600) (600) (500) (500) Source: AECOM, STOPS model run April Extensions to Lake County: During the public meetings held in September and December of 2013, there was considerable interest expressed in possible extensions of the remaining alternatives into adjacent communities in bordering Lake County. The STOPS model was used to estimate the change in ridership for these possible extensions. Alternative B (HRT) was extended to Mentor and Alternatives E and G (BRT) were extended to East 300 th Street (Shoregate Shopping Center). As previously shown in Table 3-2, Alternative B (DMU) and Alternatives E and G (Rapid+) generate fewer riders than HRT and BRT, respectively. Therefore, these technologies were not tested for a potential extension into Lake County. Table 3-4 shows the total ridership and net increases from the extensions. Table 3-4: Transit Trips on Project with Lake County Sensitivity Tests Alternative B Alternative E Alternative G HRT DMU Rapid+ BRT Rapid+ BRT Operating Statistics Terminus Mentor n/a n/a Shoregate n/a Shoregate Route Miles 17.3 n/a n/a 10.5 n/a 10.4 Percent dedicated transit 100.0% n/a n/a 63.8% n/a 47.7% Directional Route Miles 34.6 n/a n/a 21.0 n/a 20.8 Stations 10 n/a n/a 23 n/a 23 Peak Period Frequency 15 min n/a n/a 7 min n/a 7 min Ridership Estimates with Lake County Termini Daily trips on project 12, 200 n/a n/a 10,000 n/a 10,400 Increase from East 260 th 2,400 n/a n/a 500 n/a 600 Source: AECOM, STOPS model runs April
13 The Red Line (HRT) option was extended 10.8 miles to Mentor with three stations added. The increase in ridership was 2,300 or about 230 people per mile, which is not as cost effective as the extension to Babbitt Road in Euclid, which generates slightly over 1,500 riders per mile. The BRT extensions of Alternatives E and G generate 500 and 600 more daily trips respectively New Starts Mobility Benefit FTA evaluates mobility improvements for New Start projects as the total number of linked trips using the proposed project, with a weight of two given to trips that would be made on the project by transit dependent persons. Linked trips using the proposed project include all trips made on the project whether or not the rider boards or alights on the project or elsewhere in the transit system. The estimate of trips was made using the simplified national FTA STOPS model. Trips made by transit dependent persons are trips made by persons in households that do not own a car. The mobility improvements measure is computed by adding together the estimated number of linked transit trips on the project taken by non-transit dependent persons and the number of linked transit trips taken by transit dependent persons multiplied by a factor of two, thereby giving extra weight to these trips. Table 3-5 shows the results of the computations for each of the Alternatives under consideration. The results outlined in Table 3-5 are for Alternative B (HRT) operating at a 15- minute peak period frequency between Tower City and Euclid, the Rapid+ and BRT options of Alternatives E and G terminating at East 260 th Street and the DMU option of Alternative B operating every 15-minutes in the peak period in-between a regular HRT Red Line train. Table 3-5: New Start Mobility Improvements Criterion Alternative B Alternative E Alternative G HRT DMU Rapid+ BRT Rapid+ BRT Operating Statistics Terminus Babbitt Babbitt E. 260 th E. 260 th E. 260 th E. 260 th Route Miles Frequency 15 min 15 min 15 min 7 min 15 min 7 min Number of Zero Car Households Ridership Estimates Daily trips on project 9,800 8,200 8,800 9,500 9,000 9,800 % trips from zero car households 33% 34% 41% 40% 40% 39% Transit dependent trips 3,234 2,788 3,608 3,800 3,600 3,822 Non-transit dependent trips 6,566 5,412 5,192 5,700 5,400 5,978 9
14 Annualized mobility improvements Source: AECOM ; STOPS model runs March and April 2014 and calculations. Alternative B Alternative E Alternative G 3,910,200 3,296,400 3,722,400 3,990,000 3,780,000 4,086,600 All of the alternatives would be rated low-medium using FTA s criterion definition for mobility improvements with the threshold being million trips. However, if the frequency of the Alternative B (HRT) option increased to 7½ -minutes ridership on the Red Line extension increases to 13,400 as indicated in Section , then the mobility improvement rating for Alternative B would increase to 5.3 million resulting in a medium rating Highway and Traffic Impacts In this section, the effects of the Red Line/HealthLine extension on the street and highway transportation system are investigated. The Build alternatives have the potential for both positive and negative impacts on the street and highway system. On a regional level, the public transportation improvements would be expected to improve mobility by providing an alternate choice to travel by automobile. This would be measured through changes in vehicle miles traveled by automobile. On a local level, operating a Rapid+ streetcar or BRT through city streets will affect vehicular traffic, which may cause added delay and congestion. In addition, the location of the stations could also have an effect on localized traffic flow and parking. Regional and corridor impacts on congestion are measured through changes in vehicle miles traveled (VMT), levels of service for freeways, street lanes, and intersections. All of these measures are for the current year of 2014 and are derived from the STOPS model. The effectiveness of the Build alternatives to alter travel patterns on a regional basis can be evaluated in the changes in VMT Vehicle Miles Traveled The greater the numbers of auto vehicle trips eliminated by diverting people to public transportation, the greater the reductions in regional VMT. Table 3-5 presents the tabulation of auto travel VMT for the alternatives examined. The table highlights the change in auto travel VMT for the Build alternatives when compared to the No Build alternative. All the alternatives lower regional VMT for auto travel in the region. Alternative B (HRT) lowers automobile VMT more than Alternative B (DMU) by 2,300 miles and is over 44 percent higher than the BRT options in Alternatives E and G. All the rail alternatives lower VMT more than the BRT options. Table 3-6: Changes in Annual Automobile Vehicle Miles Traveled Alternative B Alternative E Alternative G HRT DMU Rapid+ BRT Rapid+ BRT Operating Statistics Terminus Babbitt Babbitt E. 260 th E. 260 th E. 260 th E. 260 th Route Miles Source: AECOM; STOPS model runs March
15 Percent dedicated transit 100.0% 100.0% 54.5% 54.5% 34.4% 34.4% Directional Route Miles Stations Peak Period Frequency 15 min 15 min 15 min 7 min 15 min 7 min Travel Time Savings Economic theory predicts that time saved from travel will have value for two reasons. First, it may be devoted instead to other activities. Second, if travel is associated with conditions such as crowding, congestion, exposure to weather, or risk other, cutting the time it requires is considered beneficial. Thus the value of saving time may vary, depending on both the purpose of travel and the conditions under which it occurs. Out of vehicle time includes the time it takes a person to walk to a rail station or bus rapid transit stop. An increase in public transportation trips will always result in an increase in out of vehicle time reflecting the access trip to the public transportation station and the time waiting for the public transportation vehicle. Consequently, only in-vehicle travel time is a valid comparison. However, travel time savings is not computed by the STOPS model and this analysis needs to be deferred to the Business Case when the NOACA regional travel demand model is used to estimate travel demand. 3.2 Goal 2 Economy Changes in Vehicle Miles Traveled (VMT) Daily trips on project 9,800 8,200 8,800 9,500 9,000 9,800 Changes in Daily VMT (-) (36,000) 2 (33,700) (23,100) (22,000) (26,400) (24,900) Alternatives that are extremely costly on a comparative basis with no apparent increase in benefit as measured by potential ridership should not be carried forward into the Business Case analysis (Tier 3). To determine cost effectiveness of the alternatives, estimates of probable capital expenditures (CAPEX) and operating and maintenance costs (OPEX) are required. This study is designed to screen alternatives for advancement to the Business Case phase of screening (Tier 3) where project appraisal is completed and a FTA New Starts application to enter Project Development is prepared if warranted. For the alternatives analysis, the change in the annualized costs per trip on the project using the STOPS model will be used to calculate the FTA New Starts cost-effectiveness criterion. The analysis of whether the preferred alternative should be built is conducted when the project appraisal process is completed as part of the Business Case preparation. During this phase of analysis, the FTA cost-effectiveness criterion will be recalculated calculated using the more rigorous NOACA regional travel demand model for estimating trips on the project. 2 With the 7½ minute peak period headway on Alternative B (HRT), changes in daily VMT is (75,200). 11
16 3.2.1 Estimates of Probable Capital Cost Expenditures Estimates of probable capital cost expenditures (CAPEX) are key ingredients in determining the cost-effectiveness, financial capacity and overall engineering feasibility of major capital investments. Capital costs are those expenditures that are incurred to design and construct the infrastructure and physical facilities. This includes the planning, design, and construction of stations, guideway structure, utilities, train control, maintenance facilities, power distribution system, communications system, vehicles, road improvements, parking lots, and other such items. At this stage of the analysis, land acquisition costs have not been estimated and are not included in the analysis. Capital cost estimating methodologies are intended to yield cost estimates useful in comparing the cost effectiveness of various transit alternatives being considered. Estimates are typically developed at unit cost levels to provide a consistent basis for comparisons across each study alternative. This basis also supports the re-application of unit capital costs to specific investment alternatives, as definitions of alternatives are refined, changed or new alternative options are created. At this early planning phase, estimates of probable cost were developed based on unit costs for significant construction items in order to provide a consistent basis of comparison for each alternative. Preliminary estimates of probable costs were prepared for each technology option and alternative, which consist of the following: Mode of operation (i.e. HRT, DMU, BRT or Rapid+) Differing segment lengths of elevated structure or at-grade typical sections Station and design elements surrounding the stations. Operating configuration including the number of transit vehicle required. Unit costs were estimated by obtaining data from several sources: cost history from local public works projects, experience of metro and public transport projects from other cities and other published sources. This broad-based approach yields estimated costs that reflect local construction pricing and address the specific needs of rail transit construction projects. As built construction costs from the HealthLine and recent Red Line improvements were also available and used to develop cost estimates for specific bus rapid transit and rail transit system components Estimated Total Capital Costs for Cuyahoga County Extensions Estimates of probable capital expenditures for infrastructure are presented in US dollars escalated to year of expenditure. These costs represent the total project costs including guideway structures, operating and maintenance facilities, control and communication systems, stations, special conditions, vehicles, utility relocation costs and add-on costs which include engineering and design, project management, construction management, agency costs and allocated and unallocated contingencies. Capital costs were estimated based on planning level project definitions. Non-construction costs used in the capital cost estimate were developed using standard industry practice and locally gained experience for projects of this complexity. These costs include project management, project administration, design, construction management, quality assurance, quality control, contractor allowances, insurance, start-up and testing, and project reserve. The estimated capital costs do NOT include finance charges. The capital costs also do NOT include costs of land acquisition, building protection or demolition, tenant or business relocation, and other 12
17 related real property costs. Nor do the costs consider the time impacts of such property related impacts. The total capital costs to construct the alternatives being evaluated are summarized in Table 3-6 below. Table 3-7: Estimates of Probable Capital Expenditures (000 US$) East 260 th Street Terminus FTA SCC Number Description Alt B Alt E Alt G HRT DMU Rapid+ BRT Rapid+ BRT Guideway and track elements Stations, stops, terminals, intermodal centers Support facilities: yards, depots, buildings Site work and special conditions 151, , , , , ,621 34,185 34,185 25,667 25,667 25,667 25, , , ,669 83, ,480 82, Systems 144,668 37, ,377 31, ,915 31, Construction Subtotal (10-50) 565, , , , , ,710 Right-of-way, land, existing improvements Rolling stock 0 50, ,000 20, ,000 20, Professional services 198, , ,000 45, ,000 44, Unallocated contingency Estimated finance costs 153, ,000 64,000 21,000 62,000 21, Total Project Costs (10-100) 916, , , , , ,500 Annualized Cost 25,890 22,268 30,747 11,260 29,345 11,525 Source: AECOM; Capital Cost Estimating Methodology and Results Report; March The construction costs vary considerably due to alignment length, the number of stations, type of rolling stock and right-of-way requirements, the number and types of structures needed, and other factors. For example, the HRT options are generally more expensive than DMU, Rapid+ and the BRT alternatives because heavy rail requires significant grade-separation, track, signalization, electrification and larger stations than light rail and bus rapid transit improvements. Maps showing the lengths of elevated and at-grade alignment segments for each of the Alternative B HRT and DMU alternatives and the median or general traffic typical sections of the Rapid+ and BRT options of Alternatives E and G were used to develop lengths. The most expensive alternative is Alternative B (HRT). The least expensive alternative is Alternative G (BRT). However, Alternative G does not meet the FTA requirement of more than 50 percent of the project length being in a dedicated transitway. Alternative E satisfies this requirement. 13
18 Estimated Total Capital Costs for Extensions to Lake County During the public meetings held in September and December of 2013, there was considerable interest expressed in possible extensions of the Red Line/HealthLine services into adjacent communities in bordering Lake County. Extending Alternative B from Babbitt Road in Euclid an additional 10 miles to Mentor in Lake County is intuitively not as cost effective as terminating the service in Cuyahoga County. The six mile extension to Babbitt Road in Euclid costs over $916 million without right-of-way acquisition from adjacent property owners and Norfolk Southern, which breaks down to approximately $141M per mile of rail extension. If the costs are similar for the extension to Mentor, it would cost well over $1B to build this additional infrastructure, while only generating an additional 2,300 additional trips. Therefore, no detailed cost estimating was completed for the rail line extension to Mentor. Additional cost estimates were prepared for the BRT extensions to Shoregate Shopping Center in Lake County for Alternatives E and G. These estimates of probable cost can be found in Table 3-7 below. As previously shown in Table 3-2, Alternative B (DMU) and Alternatives E and G (Rapid+) generate fewer riders than HRT and BRT, respectively. Therefore, cost estimates were not done for these technologies for a potential extension into Lake County. Table 3-8: Estimates of Probable Capital Expenditures - East 300 th Street/ Shoregate FTA SCC Number Description Alt B Alt E Alt G HRT DMU Rapid+ BRT Rapid+ BRT Guideway and track elements Stations, stops, terminals, intermodal centers Support facilities: yards, depots, buildings Site work and special conditions n/a n/a n/a 159,667 n/a 158,189 n/a n/a n/a 29,517 n/a 29,517 n/a n/a n/a 0 n/a 0 n/a n/a n/a 102,152 n/a 101, Systems n/a n/a n/a 37,102 n/a 36, Construction Subtotal (10-50) n/a n/a n/a 328,438 n/a 325,844 Right-of-way, land, existing improvements n/a n/a n/a 70 Rolling stock n/a n/a n/a 23,100 n/a 23, Professional services n/a n/a n/a 54,000 n/a 53, Unallocated contingency Estimated finance costs n/a n/a n/a 25,000 0 n/a n/a n/a n/a n/a 0 n/a ,000 Total Project Costs (10-100) n/a n/a n/a 430,538 n/a 426,944 Annualized Costs n/a n/a n/a 13,829 n/a 13,734 14
19 Source: AECOM; Capital Cost Estimating Methodology and Results Report; March The construction costs vary considerably due to alignment length and other factors. The number of transit vehicles, stations and other communications and control elements are identical as can be seen in the cost categories. Alternative G does not satisfy the statutory requirement in which the majority of the BRT line operates in a separated right-of-way dedicated for public transportation use during peak periods and includes features that emulate the services provided by rail fixed guideway systems either as a BRT Lite or Full BRT configuration Estimated Annualized Capital Costs The evaluation of the cost effectiveness of an alternative requires that all evaluation measure (capital costs, operations and maintenance costs and user benefits) be expressed in annual terms. Since capital costs are estimated as a total expenditure of constant (base year) dollars, an annual payment will be computed that is equivalent to what is in reality a one-time expenditure of capital funds. For each capital cost item, the annualized equivalent will be computed through application of the following annualization factor: ( ) ( ) Where: i = discount rate; and n = economic life. The annualized cost of the line item is the total cost of that line item multiplied by its annualization factor. Annualization factors have been determined based on FTA-prescribed guidance for economic life and discount rates. The method for calculating the annualized capital cost is embedded in the FTA New Starts SCC Workbook. The summation of all annualized line item costs gives the overall annualized cost for the alternative. Table 3-8 below lists the annualized capital costs for the various alternatives under consideration assuming the terminus to be Babbitt Road for Alternative B and East 260 th Street for Alternatives E and G. The relatively high annualized cost for the Rapid+ options of Alternatives E and G when compared to Alternative B is the result of acquiring a new fleet of railcars capable of operating on the Red Line and in-street running east of Windermere. There can be a substantial project cost savings if RTA decides to procure a new fleet of railcars to replace the LRV operating on the Blue, Green and Waterfront Lines with cars capable of operating on the Red Line in addition to the light rail lines. This would reduce the project CAPEX by $126 million and reduce the annualized capital cost by $7.7 million. The annualized costs for the Shoregate extension can be found in Table Estimates of Probable Operating and Maintenance Costs Operating and maintenance expenses (OPEX) include all expenditures required to provide daily service, including system administrative costs, wages and benefits for transit vehicle operators and maintenance workers, security, and the maintenance of the transit guideway, stations, facilities, buses and rolling stock. The development of estimated annual operating and maintenance (O&M) costs for the Red Line/HealthLine extension alternatives analysis can be developed several different ways. One way is to base the estimates on the average unit costs derived from an examination of rail and bus operating costs in other cities. Another way is to use a cost build-up approach, which is a zero-base budgeting technique. For purposes of determining and testing operating cost assumptions in the alternatives analysis, the average unit cost approach was used. The OPEX cost estimating methodologies are outlined and described in more detail in the Operation and Maintenance Cost Estimating Methodology Report. 15
20 Annual operating and maintenance costs (OPEX) costs for the alternatives under consideration were calculated based on the theoretical operating plans specified for the alternatives including reductions in underlying bus services in the service area and are shown in Table 3-9 below. Table 3-9: Annual Net Operating & Maintenance Expenditures - East 260 th Street OPEX Cost Drivers Alt B Alt E Alt G HRT DMU Rapid+ BRT Rapid+ BRT System length Stations Peak vehicles Changes to Underlying Bus System Annual bus hours -5,344-5,344-10,749-10, Annual bus miles -98,328-98, , , Changes to Rail/BRT Network (East 260th Street terminus) Annual train/bus hours 16,060 48,180 70,368 70,368 70,368 70,368 Annual railcar hours 32,120 48, ,736 n/a 140,736 n/a Annual train miles 319, , ,218 n/a 799,384 n/a Annual railcar /bus miles 639, ,096 1,474, ,651 1,598, ,269 Annualized Net OPEX $9,254 $30,820 $16,321 $6,030 $18,281 $7,151 Source: AECOM; Operating and Maintenance Cost Methodology Report; April Alternative E has the lowest cost to operate because many of the existing local services operating along Lake Shore Boulevard are re-routed or eliminated resulting in considerable cost savings. The underlying bus service plan under Alternative G does not change from the existing service patterns resulting in no operating cost savings. The operating costs to extend BRT service to Shoregate Shopping Center was also investigated and are illustrated in Table 3-10 below. 16
21 Table 3-10: Annual Net Operating & Maintenance Expenditures - East 300 th Street/Shoregate OPEX Cost Drivers Alt B Alt E Alt G HRT DMU Rapid+ BRT Rapid+ BRT System length n/a n/a n/a 8.8 n/a 8.7 Stations n/a n/a n/a 23 n/a 23 Peak vehicles n/a n/a n/a 17 n/a 17 Changes to Underlying Bus System Annual bus hours n/a n/a n/a -20,933 n/a -10,131 Annual bus miles n/a n/a n/a -269,816 n/a -180,553 Changes to Rail/BRT Network (East 300 th Street/Shoregate terminus) Annual train/bus hours n/a n/a n/a 79,384 n/a 79,384 Annual railcar hours n/a n/a n/a n/a n/a n/a Annual train miles n/a n/a n/a n/a n/a n/a Annual railcar /bus miles n/a n/a n/a 985,152 n/a 975,770 Annualized Net OPEX n/a n/a n/a $6,114 n/a $7,060 Source: AECOM; Operating and Maintenance Cost Methodology Report; April NOTE: Rapid+ is not extended to Shoregate Shopping Center. Extending the service to Shoregate Shopping Center adds additional operating expenses for the BRT services but results in some additional savings from eliminating duplicate local bus services in the service area resulting in a net increase for Alternative E and a net decrease in OPEX for Alternative G. The Rapid+ service is not extended to Shoregate Shopping Center as the increase in CAPEX would be expected to exceed $100 million to attract 500 more riders Annualized Cost per Trip on Project For the purpose of evaluating the potential build alternatives in the Red Line/HealthLine extension study the cost per trip on project criterion was used to determine whether the proposed investment was cost-effective. The FTA cost effectiveness measure for New Starts projects is the annual capital and operating and maintenance cost per trip on the project. The number of transit trips attracted to the alternative is determined by calculating the number of linked transit trips using the project. Costs and annualized costs were highlighted in the preceding sections. The incremental cost per transit trip on the project is calculated by determining the annualized capital expenditure of the alternative and adding the annual net operating cost to obtain the sum of annualized costs. For calculation of this measure, the capital costs of scope elements considered enrichments are either reduced by an FTA defined percentage or eliminated entirely from the annualized 17
22 capital cost calculation. Enrichments are improvements to the transit project that are desired by the project sponsor but are non-integral to the planned functioning of the project, and whose benefits are not captured in whole by the criteria. Enrichments are allowable expenses for reimbursement under a future New Starts construction grant. Enrichments are based on costs associated with certain Activity Line Items (ALIs) in the FTA Standard Cost Category worksheets. At the conceptual level of engineering and cost estimating, enrichments were not identified and therefore not considered in the capital costs. The annualized costs are divided by the annualized number of trips attracted to the alternative for each alternative under consideration Annualized Cost per Trip on Project Table 3-11 shows the results of these calculations for the East 260 th Street terminus and presents the cost per trip for each alternative and an index value where the lowest cost per trip is indexed to 1.00 and the alternatives are then indexed and compared to the alternative with the lowest cost per trip. Table 3-11: Cost Effectiveness Index Cost per Trip Babbitt Road/East 260 th Street Terminus Description Alt B Alt E Alt G HRT DMU Rapid+ BRT Rapid+ BRT Peak Period Frequency 15 min 15 min 15 min 7 min 15 min 7 min Terminus Babbitt Babbitt E. 260 th E. 260 th E. 260 th E. 260 th Total CAPEX ($ 000) 916, , , , , ,500 Annualized CAPEX ($ 000) 25,890 22,268 30,747 11,620 29,345 11,525 Annualized Net OPEX ($ 000) 9,254 30,820 16,321 6,030 18,281 7,151 Total Annualized Costs ($ 000) 35,144 53,088 47,068 17,650 47,626 18,676 Average Daily Trips on Project 9,800 8,200 8,800 9,500 9,000 9,800 Annualized Trips on Project 2,940,000 2,460,000 2,640,000 2,850,000 2,700,000 2,940,000 Cost per Trip on Project $11.96 $21.59 $17.83 $6.19 $17.64 $6.35 Indexed to Lowest Source: AECOM; FTA New Starts SCC Workbook. The FTA threshold for a medium rating for cost effectiveness requires a cost per trip between $6.00 and $ All the BRT options satisfy this criterion in terms of cost per trip. Alternative 3 Federal Transit Administration, New Starts Guidance FY2015; Washington, DC; August
23 E (BRT) has the lowest cost per trip of any of the alternatives considered at $6.19 while Alternative G (BRT) has the second lowest cost per trip at $6.35. However, as indicated earlier Alternative G does not have sufficient dedicated transitway to qualify for FTA New Starts BRT funding. The rail options (HRT, DMU and Rapid+) of Alternatives B, E and G all exceed the $10.00 threshold value and are determined to be not cost effective. However, Alternative B (HRT) at $11.96 is only about 20 percent higher than the $10.00 threshold and it was determined to test whether increasing service frequency to 7½ minutes during peak periods would attract enough riders to lower the cost effectiveness index value. The relatively competitive cost effectiveness index value for Alternative E (BRT) suggests that the extension to Shoregate Shopping Center would also be cost effective. However, if Alternative E (BRT) is extended to Shoregate Shopping Center, the extension must include a median dedicated transit guideway to continue qualifying for FTA New Starts BRT funding. Additional cost estimates were completed to determine the cost effectiveness of the Alternative E (BRT) extension to Shoregate. Table 3-12 illustrates the results of this additional analysis. Table 3-12: Cost Effectiveness Sensitivity Tests for Frequency (Alternative B) and Terminus (Alternatives E and G) Description Frequency (Bold indicates a change from Table 3-10) Terminus (Bold indicates a change from Table 3-10) Alt B Alt E Alt G HRT DMU Rapid+ BRT Rapid+ BRT 7.5 min n/a n/a 7 min n/a 7 min Babbitt Rd n/a n/a Shoregate n/a Shoregate Total CAPEX ($ 000) 916,125 n/a n/a 430,538 n/a 426,944 Annualized CAPEX ($ 000) 25,890 n/a n/a 13,829 n/a 13,734 Annualized Net OPEX ($ 000) 11,950 n/a n/a 6,114 n/a 7,060 Total Annualized Costs ($ 000) 37,840 n/a n/a 19,943 n/a 20,794 Average Daily Trips on Project 13,400 n/a n/a 10,000 n/a 10,400 Annualized Trips on Project 4,020,000 n/a n/a 3,000,000 n/a 3,120,000 Cost per Trip on Project $9.41 n/a n/a $6.65 n/a $6.66 Source: AECOM; FTA New Starts SCC Workbook. Although the BRT extension to Shoregate is less cost effective than the terminus at East 260 th Street, it would still achieve a medium rating with a cost per trip of $6.65 and it provides a direct connection to Laketran s services. Alternative G is slightly less cost effective than Alternative E. The Full BRT extension of Alternative G to East 300 th Street/Shoregate Shopping Center does not satisfy the statutory requirement in which the majority of the BRT line operates in a separated right-of-way dedicated for public transportation use during peak periods and includes features that emulate the services provided by rail fixed guideway systems. 19
24 Alternative B (HRT) was examined to determine if the increased frequency between Tower City and Babbitt Road would lower the cost per trip to below the $10.00 threshold. Ridership increased by 3,600 trips on the project to an average daily total of 13,400 trips. The increased operating cost for added service in the peak period amounted to $2.7 million annually. This resulted in reducing the cost per trip to $9.41, which is below the threshold value of $ However, as previously noted, the capital costs do not include right of way or land acquisition costs. The HealthLine (BRT) extension options of Alternatives E and G are still the least costly to build, operate and maintain and have the lowest cost effectiveness index value when compared to the Red Line (HRT) extension of Alternative B. 3.3 Goal 3 Environment For the Tier 1 screening of the alternatives the environmental review consisted of fatal flaws or showstoppers analysis and the findings are contained in the Environmental Red Flag Analysis dated December This high level review consisted of a GIS mapping exercise and a strategic review of potential environmental effects. There were no fatal flaws in the alternatives that advanced to the Tier 2 screening. Environmental impacts can either be avoided, minimized or can be mitigated with suitable strategies. The balance of the analysis was qualitative in nature and is discussed in the following subsections Decrease Vehicle Miles Traveled (VMT) All the alternatives will reduce the number of vehicle miles traveled on highways compared to the No Build base case. However, the BRT options of build Alternatives E and G will not be as beneficial as the proposed rail alternatives in decreasing VMT because the HRT, DMU and Rapid+ options attract substantially more new riders by diverting many auto trips to rail. Alternative B (DMU) reduces VMT more than the BRT options of Alternative E and G. Alternative B (HRT) also reduces VMT more than the BRT options of Alternative E and G and is the best alternative at reducing VMT Potential for Reductions in Carbon Footprint The BRT options for Alternatives E and G will require the acquisition of 20 BRT vehicles for peak service, including spares. The proposed bus fleet will be modern, regularly maintained and could use more environmentally friendly fuels such as compressed natural gas (CNG) low sulfur diesel in accordance with local regulations. Moreover, the articulated buses could be electric hybrid technology reducing the carbon footprint of the BRT service. During operation, the BRT will be a minor part of the overall proposed bus fleet of approximately 400 buses in Cleveland. It is not envisaged that the proposed BRT will significantly increase environmental impacts during operation. Alternative B (DMU) will require the purchase of eight diesel-multiple unit (DMU) vehicles with six operating during the peak period. As with the BRT vehicles, the proposed DMU fleet will be modern, regularly maintained and could use more environmentally friendly fuels such as compressed natural gas (CNG) low sulfur diesel in accordance with local regulations. In addition, the DMU could be dual-mode electric hybrid technology reducing the carbon footprint of the DMU service by drawing propulsion power from the Red Line catenary between Tower City and Windermere and then switching to diesel or CNG east of Windermere. During 20
25 operation, the DMU will be a minor part of the overall existing RTA rail fleet of 108 rapid transit railcars. Alternative B (HRT) and Alternatives E and G (Rapid+) consist of electrically powered rail transit vehicles drawing energy from the power grid. As the US develops carbon neutral power plants using wind, solar and nuclear power generating facilities the Rail-Build alternatives will be more beneficial in lowering the carbon footprint than the BRT Alternative, which for the foreseeable future will still rely on fossil fuel to power the diesel/electric hybrid propulsion system Air Quality All the Build alternatives will reduce the number of cars on the highways. However the BRT options for Alternatives E and G will not be as beneficial as the proposed Alternative B Red Line extension in improving local air quality because the rail alternatives attract substantially more riders by diverting many auto trips to rail. The proposed service improvements will marginally improve local air quality and will not likely assist in the substantial reduction of Greenhouse Gases (GHGs) at the regional level. However, when the BRT options are compared to the rail alternatives, the rail alternatives will provide more air quality benefits because the rail alternatives attract substantially more riders by diverting many more auto trips to rail. Alternative B (HRT) reduces auto VMT more than any of the alternatives being considered and also attracts the most new riders to the RTA system Decrease Use of Single Occupant Vehicles All the alternatives will reduce the number of and use of single occupant vehicles (SOV) on the highways. However, the BRT options of Alternatives E and G will not be as beneficial as the proposed Rail-Build alternatives in decreasing the number of SOV because the HRT, DMU and Rapid+ alternatives attract substantially more new riders by diverting many auto trips to rail. Alternative B (HRT) diverts the highest number of automobile trips than any of the alternatives being considered by attracting the most new riders to the RTA system Decrease Energy Consumption All the alternatives will reduce the number of cars on the highways compared to the base case. However the BRT options of Alternatives E and G will not be as beneficial Alternative B in decreasing energy consumption because the rail alternatives attract substantially more new riders by diverting many auto trips to rail. Alternative B (HRT) diverts the highest number of automobile trips than any of the alternatives being considered by attracting the most new riders to the RTA system. The BRT options of build Alternatives E and G attract fewer new riders and simply divert current local bus riders to trips on the project Natural Resources The proposed build alternatives all have a positive impact when assessed against the baseline conditions. Because of the general urbanized setting of the study area, there would be minimal impact to the ecosystem. Construction activities and the location of tracks may disrupt the habitat of squirrels, rabbits and other animals that are adaptive to changes in the natural environment. Construction of bridge piers near the Euclid Creek for the Alternative B alignment may disturb the aquatic habitat of some aquatic species. However, the disturbance would occur during construction and would be temporary. There would be no habitat disturbance results from Alternatives E and G. 21
26 3.4 Goal 4 Livability The livability goal was designed to foster community development and cohesion through investment in transportation infrastructure consistent with the needs and aspirations of the residents. Several objectives were identified for this goal: Provide linkages among neighborhoods. Minimize adverse impacts on existing neighborhoods and communities. Improve health and safety for workforce, passengers and communities Integrate transportation and land use by locating stations where there is greatest potential for transit oriented developments (TOD). Integrate with local development plans Enhance urban design features and complete streets program Therefore, the evaluation of the ability of the alternatives to promote efficient land use patterns focuses on the ability of the alternatives to support development objectives, support local land use policies, provide access to major activity centers and support regional land use and related development policies. The evaluation also included environmental screening to examine whether any of the alternatives under consideration had any adverse impacts that would affect community acceptance. Community acceptance of the alternatives is highly dependent on whether adverse environmental impacts on neighborhoods can be avoided, minimized or mitigated appropriately. Adverse impacts on neighborhoods can occur where the alternatives disrupt the community by introducing physical barriers within or between neighborhoods, creating visual impacts by building new facilities (i.e. overhead wires), creating increased local traffic in station areas and by increasing noise and vibration. Positive impacts can result from improved accessibility and by reducing traffic caused by motorists from adjacent communities driving through neighborhoods to avoid traffic congestion on major highway routes. The alternatives utilized existing transportation corridors to minimize disruption to the neighborhoods. Alternative B is located within railroad rights-of-way which have existed within the community since All of the alternatives examined provide improved linkages among and between Collinwood, East Cleveland and Euclid and University Circle and Midtown. The alternatives have minimal adverse impacts on neighborhoods and could engender community acceptance Number of Streets Closed or Improved with Complete Streets Treatments No streets are closed by the project alternatives being evaluated. All segments of city streets used for the Rapid+ and BRT technology options in Alternatives E and G include complete streets treatments. Many segments of Alternatives E and G include full BRT dedicated median transitway and landscaping similar to the existing HealthLine urban design in Midtown and Downtown Cleveland. The segment lengths of this full BRT treatment vary by alternative and terminus but range between 3.3 miles and 6.7 miles Number of Cultural Resources Impacted The following existing inventories were consulted to identify cultural resources of local, state, or national historic significance: 22
27 Ohio Historic Preservation Office s (OHPO) Online Mapping System and related inventory and administrative files (includes historic properties listed in and determined eligible for listing in the National Register of Historic Places and cemeteries) Ohio Department of Transportation s (ODOT) Historic Bridge List and Buckeye Assets (bridges and structures listed in and determined eligible for listing in the National Register of Historic Places) Cleveland Landmarks Commission (locally designated landmarks) Euclid Landmarks Commission (locally designated landmarks). Alternative B contains one property located at Eddy Road determined eligible for the National Register of Historic Places. Alternative E contains four properties listed in the National Register of Historic Places, two properties determined eligible for the National Register of Historic Places, one columbarium/cemetery whose eligibility for the National Register of Historic Places is not known, and six Cleveland Landmarks whose eligibility for the National Register of Historic Places is not known. Alternative G contains five properties listed in the National Register of Historic Places, two properties determined eligible for the National Register of Historic Places, one columbarium/cemetery whose eligibility for the National Register of Historic Places is not known, and three Cleveland Landmarks whose eligibility for the National Register of Historic Places is not known Number of Households Affected within 25 yards of the Alignment The potential disturbance to community cohesion and well-being was assessed for each alternative. It included an assessment of the impact of each alternative on individual properties located within 25 yards of the alignments. The impacts of the alternatives are minimal. The most serious impact is noise and vibration. Table 3-13 shows how many households are located adjacent to the alternative alignments and are within 25 yards of the alignment. Table 3-13: Alignment Alternatives Catchment Area Analysis Criteria Alt B Alt E Alt G Alignment Features Length of alignment Number of stations ½-mile catchment Number of Households 12,410 23,955 22,318 Number of households within 25 yards % Households within 25 yards 0.72% 1.97% 1.53% Source: US Census Alternative B is in a freight railroad right-of-way and has less than 1 percent of total residential households located within 25 yards of the alignment. The noise from the heavy rail rapid transit trains (HRT) is masked by the freight railroad trains. Alternatives E and G both have less than 2 percent of residential households located within 25 yards of the Rapid+ or BRT option alignments. Noise generated by bus rapid transit vehicles in 23
28 Alternatives E and G is not a factor because of the existing high ambient noise levels of the supporting city streets. The bus rapid transit option simply adds a few more buses to already noisy urban streets Rapid+ (light rail/streetcar) has more community impact with regard to noise, vibration and visual disturbances than does the HRT and BRT alternatives. Light rail transit operating primarily on surface streets is generally noisier to sensitive receptors than a HRT running on an elevated guideway and embankment in a railroad right-of-way. The Rapid+ can cause vibration to sensitive receptors and care must be taken in the design phase to mitigate the potential for severe vibration impacts. It is expected that the slight or moderately adverse impacts identified for all the alternatives could be mitigated with appropriate environmental mitigation strategies Impacts on Public Parklands and Open Spaces Section 4(f) refers to the Department of Transportation (DOT) Act of 1966 which set the requirement for the consideration of publicly owned parks and recreation areas, publicly owned wildlife and waterfowl refuges, and public and privately owned historic sites. Section 4(f) applies when four conditions are met; project requires DOT funding and/or approval; project is transportation related; project requires the use of land from a Section 4(f) protected property; and no regulatory applicability rules or exceptions apply. Alternative B includes approximately eight mapped Section 4(f) resources: two playgrounds, one public pool, four parks, and one NRHP-DOE property. Alternative E includes approximately 22 mapped Section 4(f) resources: one public school, one playground, two trails/bikeways, one state park, six parks, six NRHP Listed or NRHP-DOE properties, and six Cleveland Landmarks. Alternative G includes approximately 20 mapped Section 4(f) resources: four public schools, one playground, two trails/bikeways, three parks, seven NRHP Listed or NRHP-DOE properties, and three Cleveland Landmarks Number of Zero Car Households A key factor in evaluating service equity is to examine the extent to which any of the build alternatives offer new and improved services to minorities, senior citizens, low-income persons and transit-dependent people. As shown in Section 3.1.2, FTA evaluates mobility improvements for New Starts projects as the total number of linked trips using the proposed project, with a weight of two given to trips that would be made on the project by transit dependent persons. The FTA national STOPS model calculates trips made by transit dependent persons as trips made by persons in households that do not own a car. Therefore, the number of zero car households located within a ½-mile of system boarding points is an important measure of mobility improvements to low income households. Table 3-14 presents the total number of households, the number of zero car households located and the percent of zero car households to total households within a ½-mile of stations for the alternatives under study. 24
29 Table 3-14: Alignment Alternatives Catchment Area Analysis Criteria Alt B Alt E Alt G Alignment Features Length of alignment Number of stations ½-mile catchment Number of Households 12,410 23,955 22,318 Number of Zero Car Households % Households with Zero Cars 4.23% 3.77% 3.86% Source: US Census Public Comment The third round of public meetings was held in late May Meeting times and locations were as follows: Tuesday May 20, 6-8pm, East Cleveland Public Library, City of East Cleveland Wednesday May 21, 6-8pm, Moore Mediation and Counseling Services, City of Euclid Thursday May 22, 6-8pm, Collinwood Recreation Center, City of Cleveland In addition to the public meetings, the study team facilitated a Steering Committee meeting and a Stakeholder Involvement Committee meeting on May 6, 2014 and May 8, 2014 respectively. These sessions focused on updating the Committees on the progress of the study, delivering updated information on the Tier 2 technical analysis results, discussing these findings, and soliciting feedback from Committee members on how to enhance the presentation prior to the public meetings. Overall, the public meetings were well attended and individuals provided valuable comments and ideas that helped inform the study team. A total of 68 individuals attended these meetings. There were several repeat attendees, which directly illustrated the vested interest of the public, and the importance of these decisions as it relates to RTA s next steps. All in all, the general public feedback was positive, and meeting attendees have appreciated RTA s outreach efforts. The key themes arising from the third round of meetings were: If a street-running alternative is used in the extension, attendees indicated they would like to see a route from Windermere extended to Ivanhoe before turning to Five Points.. Many attendees favored Alternatives E and G (either Rapid+ or BRT) for city residents that rely on bus service to encourage more ridership and attract more transit-oriented development (TOD) that will bring people back to city (idea of live, work and play). Many attendees favored the rail option for suburban commuters and the BRT option for local travel between Euclid and University Circle. Most Lake County residents who attended the meetings favored the Red Line extension (Alternative B). 25
30 Most Cuyahoga County residents favored investing in the street running alternatives (Alternatives E and G) to better serve existing neighborhoods. Many people asked if there is a possibility of developing hybrid alternatives. 5. Summary of Analysis Key differences exist when comparing the Red Line and HealthLine extension alternatives. The Red Line extension (Alternative B) attracts more riders, has more mobility benefits, diverts more auto trips and generally has higher levels of environmental benefit than the HealthLine extension alternatives (Alternatives E and G). But the Red Line extension costs $916 million when compared to the less costly and more cost effective HealthLine alternatives costing approximately $430 million on average. 5.1 Goal 1: Mobility Accessibility: Accessibility is measured by the number of people living or working within ½-mile of station entrances, which is the FTA New Starts criterion for project evaluation. The total ½-mile catchment of Alternative B is approximately 55 percent of the total catchment of Build alternatives E and G. However, the total catchment per station for Alternative B is 1.8 times more than the total catchment per station for Alternatives E and G. Total catchment per mile for Alternative B is approximately 90 percent of the total catchment for Alternatives E and G. Total catchment for Alternative E when compared to Alternative G is nearly identical with E having slightly more people and G having slightly more jobs within the ½-mile catchment area. Ridership. When matching existing Red Line and HealthLine frequencies, Alternative B (HRT) and Alternative G (BRT) have the highest total daily transit trips on the project at 9,800 trips. Alternative E (BRT) has the second highest ridership at 9,500 trips. If the Red Line frequency for Alternative B was increased to 7½ -minute headways equalizing service on East Side with West Side service frequencies, ridership on the project would increase to 13,400 trips per day. Mobility Benefit: All of the alternatives would be rated low-medium using FTA s criterion definition for mobility improvements with the threshold being million annual trips. However, if the frequency of the Alternative B (HRT) option increased to 7½ -minutes ridership then the mobility improvement rating for Alternative B would increase to 5.3 million annual trips resulting in a medium rating. Highway and Traffic Impacts. All the alternatives lower regional VMT for auto travel in the region. All the rail alternatives lower VMT more than the BRT options Alternative B (HRT) lowers automobile VMT more than Alternative B (DMU) by nearly 2,300 miles and is over 44 percent greater than the BRT options in Alternatives E and G. 5.2 Goal 2 Economy Capital Expenditure (CAPEX). The most expensive alternative is Alternative B (HRT) at over $916 million. The least expensive alternative is Alternative G (BRT) at $353 million. However, Alternative G does not meet the FTA requirement of more than 50 percent of the project length being in a dedicated transitway. Alternative E satisfies this requirement. Alternative E costs $357 million. Operating and Maintenance Expenditures (OPEX). Alternative E has the lowest cost to operate because many of the existing local services operating along Lake 26
31 Shore Boulevard are re-routed or eliminated resulting in considerable cost savings. The net increase in OPEX is a little over $6 million annually for Alternative E. The underlying bus service plan under Alternative G does not change from the existing service patterns resulting in no operating cost savings. The net increase in OPEX is $7.1 million. Alternative B adds $9.2 million to the annual cost of operating the Red Line. Cost-Effectiveness. Alternative E (BRT) is the most cost effective of all the alternatives considered at $6.65 annualized cost per trip for the Shoregate terminus. Alternative G has $6.66 cost per trip but does not meet the FTA requirement of more than 50 percent of the project length being in a dedicated transitway. Alternative B (HRT) has a cost per trip of $9.41. All these alternatives would receive a medium rating for cost effectiveness. 5.3.Goal 3 Environment Energy Consumption and Vehicle Kilometers Traveled. All the alternatives will reduce the number of vehicle miles traveled on highways compared to the No Build base case. However, the BRT options of build Alternatives E and G will not be as beneficial as the proposed rail alternatives in decreasing VMT because the HRT, DMU and Rapid+ options attract substantially more new riders by diverting many auto trips to rail. Alternative B (DMU) reduces VMT more than the BRT options of Alternative E and G. Alternative B (HRT) also reduces VMT more than the BRT options of Alternative E and G and is the second best alternative at reducing VMT. Air Quality and Greenhouse Gas Emissions. All the Build alternatives will reduce the number of cars on the highways. However the BRT options for Alternatives E and G will not be as beneficial as the proposed Alternative B Red Line extension in improving local air quality because the rail alternatives attract substantially more riders by diverting many auto trips to rail. Congestion Mitigation. All the alternatives will reduce the number of and use of single occupant vehicles (SOV) on the highways. However, the BRT options of Alternatives E and G will not be as beneficial as the proposed Rail-Build alternatives in decreasing the number of SOV because the HRT, DMU and Rapid+ alternatives attract substantially more new riders by diverting many auto trips to rail. Alternative B (HRT) diverts the highest number of automobile trips than any of the alternatives being considered by attracting the most new riders to the RTA system Goal 4 Livability Number of Streets Closed. No streets are closed by the project alternatives being evaluated. All segments of city streets used for the Rapid+ and BRT technology options in Alternatives E and G include complete streets treatments. Many segments of Alternatives E and G include full BRT dedicated median transitway and landscaping similar to the existing HealthLine urban design in Midtown and Downtown Cleveland. The segment lengths of this full BRT treatment vary by alternative and terminus but range between 3.3 miles and 6.7 miles. Number of Cultural Resources Impacted. Alternative B impacts one historic property determined eligible for the National Register of Historic Places. Alternative E contains four properties listed in the National Register of Historic Places, two properties determined eligible for the National Register of Historic Places, one columbarium/cemetery whose eligibility for the National Register of Historic Places is not known, and six Cleveland Landmarks whose eligibility for the National Register of Historic Places is not known. Alternative G contains five properties listed in the National 27
32 Register of Historic Places, two properties determined eligible for the National Register of Historic Places, one columbarium/cemetery whose eligibility for the National Register of Historic Places is not known, and three Cleveland Landmarks whose eligibility for the National Register of Historic Places is not known. Number of Households Affected within 25 yards of Alignment. Alternative B is in a freight railroad right-of-way and has less than 1 percent of total residential households located within 25 yards of the alignment. Alternatives E and G both have less than 2 percent of residential households located within 25 yards of the Rapid+ or BRT option alignments. Impacts on Parklands and Open Spaces. Alternative B includes approximately eight mapped Section 4(f) resources: two playgrounds, one public pool, four parks, and one NRHP-DOE property. Alternative E includes approximately 22 mapped Section 4(f) resources: one public school, one playground, two trails/bikeways, one state park, six parks, six NRHP Listed or NRHP-DOE properties, and six Cleveland Landmarks. Alternative G includes approximately 20 mapped Section 4(f) resources: four public schools, one playground, two trails/bikeways, three parks, seven NRHP Listed or NRHP- DOE properties, and three Cleveland Landmarks. Number of Zero Car Households. A key factor in evaluating service equity is to examine the extent to which any of the build alternatives offer new and improved services to minorities, senior citizens, low-income persons and transit-dependent people. Therefore, the number of zero car households located within a ½-mile of system boarding points is an important measure of mobility improvements to low income households. Alternative E has over 900 zero car households within ½ mile of station entrances, Alternative G has over 860 and Alternative B has 525 zero car households. Potential for Transit-Oriented Development. The HealthLine extension alternatives have the greatest potential for TOD because of the length and number of stations. Alternative B could have significant TOD at Noble Road Station and the Babbitt Road terminus. Integration with Public Transport. All Build alternatives are integrated with the existing and committed future bus system. 5.5 Other Considerations Rail transit tends to provide better service quality, which attracts more riders, particularly discretionary users as shown in the ridership forecasts. Bus based transport systems are best when serving less dense areas with more dispersed destinations and lower demand. As has been shown in the comparative evaluation of the alternatives, Alternative B contributes more to relieve congestion than the BRT options but costs significantly more to design, build, operate and maintain than improving RTA bus services in the study area. The rail extension seems to be favored by many of the stakeholders based on future vision, aspirations and city building. Both bus and rail systems become more efficient and effective at achieving planning objectives if implemented with supportive policies that improve service quality, create supportive land use patterns and encourage ridership. Consequently, developing a hybrid alternative that blends the attractiveness of a Red Line extension and the cost effectiveness of HealthLine extensions at lower initial cost should be examined as part of the Business Case evaluation. Therefore, none of the Build alternatives can be eliminated and a new hybrid alternative should be more fully developed and explored. 28
33 There is need for further analysis as part of the Tier 3 screening during the preparation of the Business Case for a locally preferred alternative. 6. Next Steps The third tier of screening is referred to as the Business Case. After this final level of evaluation, which includes detailed ridership forecasting using the NOACA regional travel demand model and a refined analysis of cost-effectiveness, one Locally Preferred Alternative will remain. As summarized in this report, three alternatives remain at the end of Tier 2 analysis and a need to define an additional multi-modal hybrid alternative has been identified. A Workshop with the Project Team and Steering Committee members will be held that discusses the results of the Tier 2 screening and defines the multi-modal hybrid alternative. Alternative B (HRT), Alternative E (BRT), Alternative G (BRT) and the hybrid will then be evaluated and compared to No Build and Do Minimum alternatives as part of the Business Case (Tier 3). During the Business Case analysis, the remaining alternatives may need to be refined even further to achieve greater cost effectiveness. This could include modifying the alignments, adjusting line insertion strategies, reducing the number of stations and amending operating patterns for Build alternatives under consideration. The objective will be to reduce the total investment cost without significantly reducing mobility benefits. In addition, more study of a hybrid alternative would include the adjustment of the feeder system and testing the network effects of the improved and refined hybrid alternative on travel demand. 29
34 Appendix A Study Area Map 30
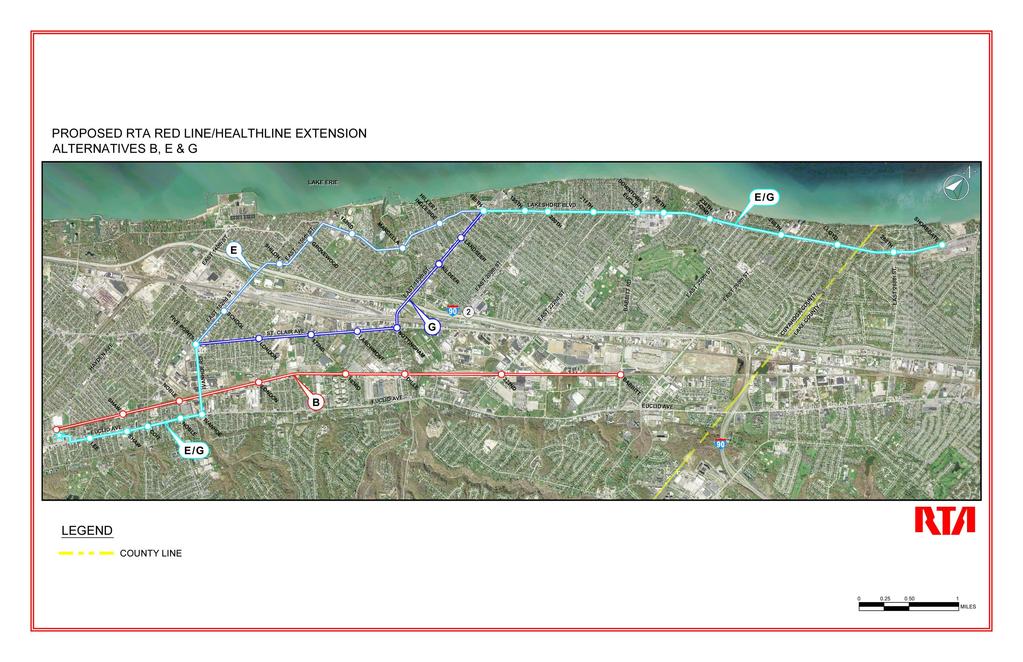
35 A-1
4.0 TIER 2 ALTERNATIVES
 4.0 TIER 2 ALTERNATIVES The Tier 2 Alternatives represent the highest performing Tier 1 Alternatives. The purpose of the Tier 2 Screening was to identify the LPA utilizing a more robust list of evaluation
Needs and Community Characteristics
 Needs and Community Characteristics Anticipate Population and Job Growth in the City Strongest density of population and jobs in Ann Arbor are within the Study Area Population expected to grow 8.4% by
Executive Summary. Treasure Valley High Capacity Transit Study Priority Corridor Phase 1 Alternatives Analysis October 13, 2009.
 Treasure Valley High Capacity Transit Study Priority Corridor Phase 1 Alternatives Analysis October 13, 2009 Background As the Treasure Valley continues to grow, high-quality transportation connections
The Boston South Station HSIPR Expansion Project Cost-Benefit Analysis. High Speed Intercity Passenger Rail Technical Appendix
 The Boston South Station HSIPR Expansion Project Cost-Benefit Analysis High Speed Intercity Passenger Rail Technical Appendix Prepared by HDR August 5, 2010 The Boston South Station HSIPR Expansion Project
I-26 Fixed Guideway Alternatives Analysis
 I-26 Fixed Guideway Alternatives Analysis Steering & Technical Advisory Committees Joint Meeting January 15, 2016 @ 10:00 AM SC/TAC Meeting Winter 2016 Agenda I. Welcome & Introductions II. III. Project
Kenosha-Racine-Milwaukee (KRM)
") Kenosha-Racine-Milwaukee (KRM) Commuter Rail #147925 November 6, 2009 1 Guidance of KRM Commuter Rail Studies Intergovernmental Partnership Technical Steering Committee Temporary and Limited Authority
Kenosha-Racine-Milwaukee (KRM) Commuter Rail #147925 November 6, 2009 1 Guidance of KRM Commuter Rail Studies Intergovernmental Partnership Technical Steering Committee Temporary and Limited Authority
Waco Rapid Transit Corridor (RTC) Feasibility Study
 Feasibility Study") Waco Rapid Transit Corridor (RTC) Feasibility Study Chris Evilia, Director of Waco Metropolitan Planning Organization Allen Hunter, General Manager Waco Transit System Jimi Mitchell, Project Manager AECOM
Waco Rapid Transit Corridor (RTC) Feasibility Study Chris Evilia, Director of Waco Metropolitan Planning Organization Allen Hunter, General Manager Waco Transit System Jimi Mitchell, Project Manager AECOM
Kendall Drive Premium Transit PD&E Study Project Kick-Off Meeting SR 94/Kendall Drive/SW 88 Street Project Development and Environment (PD&E) Study
 Study") Florida Department of Transportation District Six Kendall Drive Premium Transit PD&E Study Project Kick-Off Meeting SR 94/Kendall Drive/SW 88 Street Project Development and Environment (PD&E) Study What
Florida Department of Transportation District Six Kendall Drive Premium Transit PD&E Study Project Kick-Off Meeting SR 94/Kendall Drive/SW 88 Street Project Development and Environment (PD&E) Study What
7 COMPARATIVE EVALUATION OF ALTERNATIVES
 7 COMPARATIVE EVALUATION OF ALTERNATIVES 7.1 INTRODUCTION This chapter presents the comparative analysis of the four Level 2 build alternatives along with a discussion of the relative performance of the
Michigan/Grand River Avenue Transportation Study TECHNICAL MEMORANDUM #18 PROJECTED CARBON DIOXIDE (CO 2 ) EMISSIONS
 EMISSIONS") TECHNICAL MEMORANDUM #18 PROJECTED CARBON DIOXIDE (CO 2 ) EMISSIONS Michigan / Grand River Avenue TECHNICAL MEMORANDUM #18 From: URS Consultant Team To: CATA Project Staff and Technical Committee Topic:
TECHNICAL MEMORANDUM #18 PROJECTED CARBON DIOXIDE (CO 2 ) EMISSIONS Michigan / Grand River Avenue TECHNICAL MEMORANDUM #18 From: URS Consultant Team To: CATA Project Staff and Technical Committee Topic:
Alternatives Analysis Findings Report
 6.0 This chapter presents estimates of the potential capital, operations and maintenance costs associated with the alternatives carried forward for detailed evaluation. The methodology used to develop
August 2, 2010 Public Meeting
 Public Meeting LYMMO Expansion Alternatives Analysis Study Purpose of study is to provide a fresh look at potential LYMMO expansion, following Federal Transit Administration (FTA) Alternatives Analysis
A Presentation to: Project Advisory Group Meeting #10
 A Presentation to: Project Advisory Group Meeting #10 October 21, 2015 Agenda Introductions Action Items From Last PAG Meeting (August 26, 2015) Recent Agency Involvement Update on Refined Alternative
METRO Orange Line BRT American Boulevard Station Options
 METRO Orange Line BRT American Boulevard Station Options Bloomington City Council Work Session November 18, 2013 Christina Morrison BRT/Small Starts Project Office Coordinating Planning and Design AMERICAN
EUGENE-SPRINGFIELD, OREGON EAST WEST PILOT BRT LANE TRANSIT DISTRICT
 EUGENE-SPRINGFIELD, OREGON EAST WEST PILOT BRT LANE TRANSIT DISTRICT (BRIEF) Table of Contents EUGENE-SPRINGFIELD, OREGON (USA)... 1 COUNTY CONTEXT AND SYSTEM DESCRIPTION... 1 SYSTEM OVERVIEW... 1 PLANNING
Northeast Corridor Alternatives Analysis. Public Involvement Round 2 Input on Alternatives for Further Study
 Northeast Corridor Alternatives Analysis Public Involvement Round 2 Input on Alternatives for Further Study Feb. 7-9, 2012 Agenda Review project background Progress summary Recommended alternatives for
Bi-County Transitway/ Bethesda Station Access Demand Analysis
 Bi-County Transitway/ Bethesda Station Access Demand Analysis Prepared for: Washington Metropolitan Area Transit Authority Office of Planning and Project Development May 2005 Prepared by: in conjunction
2 VALUE PROPOSITION VALUE PROPOSITION DEVELOPMENT
 2 VALUE PROPOSITION The purpose of the Value Proposition is to define a number of metrics or interesting facts that clearly demonstrate the value of the existing Xpress system to external audiences including
6/6/2018. June 7, Item #1 CITIZENS PARTICIPATION
 June 7, 2018 Item #1 CITIZENS PARTICIPATION 1 Item #2 APPROVAL OF MINUTES Item #3 TRAC GOALS, FRAMEWORK & AGENDA REVIEW 2 COMMITTEE GOALS Learn about Southern Nevada s mobility challenges, new developments
Energy Technical Memorandum
 Southeast Extension Project Lincoln Station to RidgeGate Parkway Prepared for: Federal Transit Administration Prepared by: Denver Regional Transportation District May 2014 Table of Contents Page No. Chapter
Green Line Long-Term Investments
 Enhancements Short-term improvements to keep Austin moving. Investments Long-term projects to support our future. Mobility Hubs MetroRapid MetroRail MetroExpress Connectors Circulators Project Connect
5. OPPORTUNITIES AND NEXT STEPS
 5. OPPORTUNITIES AND NEXT STEPS When the METRO Green Line LRT begins operating in mid-2014, a strong emphasis will be placed on providing frequent connecting bus service with Green Line trains. Bus hours
I-20 EAST TRANSIT INITIATIVE Tier 1 and Tier 2 Alternatives Screening Report EXECUTIVE SUMMARY
 EXECUTIVE SUMMARY The purpose of this report is to document the results of the Tier 1 and Tier 2 Screening of alternatives for the I-20 East Transit Initiative. The two-tier screening process presented
Public Meeting. March 21, 2013 Mimosa Elementary School
 Public Meeting March 21, 2013 Mimosa Elementary School Today s Meeting Purpose 2 Where We Are The Process What We ve Heard and Findings Transit Technologies Station Types Break-out Session Where We Are
Draft Results and Open House
 Waco Rapid Transit Corridor (RTC) Feasibility Study Draft Results and Open House Chris Evilia, Director of Waco Metropolitan Planning Organization Allen Hunter, General Manager Waco Transit System Jimi
Operating & Maintenance Cost Results Report
 Operating & Maintenance Cost Results Report Prepared for: Hennepin County Regional Railroad Authority Prepared by: Connetics Transportation Group Under Contract To: Kimley-Horn and Associates FINAL June
Executive Summary. Draft Environmental Impact Statement/Environmental Impact Report ES-1
 Executive Summary Introduction The Eastside Transit Corridor Phase 2 Project is a vital public transit infrastructure investment that would provide a transit connection to the existing Metro Gold Line
TRAVEL DEMAND FORECASTS
 Jiangxi Ji an Sustainable Urban Transport Project (RRP PRC 45022) TRAVEL DEMAND FORECASTS A. Introduction 1. The purpose of the travel demand forecasts is to assess the impact of the project components
CEDAR AVENUE TRANSITWAY Implementation Plan Update
 CEDAR AVENUE TRANSITWAY Implementation Plan Update EECUTIVE SUMMARY DECEMBER 2015 Executive Summary In 2013, the Twin Cities metropolitan area s first bus rapid transit (BRT) line, the METRO Red Line,
TBARTA USF to Wesley Chapel Express Bus Service Operating Plan. Draft 3/25/2014
 TBARTA USF to Wesley Chapel Express Bus Service Operating Plan Draft 3/25/2014 March 2014 Table of Contents 1.0 Introduction... 1 2.0 Study Area... 1 3.0 Existing Available Service... 3 4.0 Proposed Service...
BROWARD BOULEVARD CORRIDOR TRANSIT STUDY
 BROWARD BOULEVARD CORRIDOR TRANSIT STUDY FM # 42802411201 EXECUTIVE SUMMARY July 2012 GOBROWARD Broward Boulevard Corridor Transit Study FM # 42802411201 Executive Summary Prepared For: Ms. Khalilah Ffrench,
TORONTO TRANSIT COMMISSION REPORT NO.
 Form Revised: February 2005 TORONTO TRANSIT COMMISSION REPORT NO. MEETING DATE: October 24, 2012 SUBJECT: DOWNTOWN RAPID TRANSIT EXPANSION STUDY (DRTES) PHASE 1 STRATEGIC PLAN ACTION ITEM RECOMMENDATIONS
I-26 Fixed Guideway Alternatives Analysis
 I-26 Fixed Guideway Alternatives Analysis Public Meetings: North Charleston, January 25, 2016 Charleston: January 26, 2016 Summerville: January 28, 2016 Agenda I. Project Update II. III. IV. Screen Two
CITY OF LONDON STRATEGIC MULTI-YEAR BUDGET ADDITIONAL INVESTMENTS BUSINESS CASE # 6
 2016 2019 CITY OF LONDON STRATEGIC MULTI-YEAR BUDGET ADDITIONAL INVESTMENTS BUSINESS CASE # 6 STRATEGIC AREA OF FOCUS: SUB-PRIORITY: STRATEGY: INITIATIVE: INITIATIVE LEAD(S): BUILDING A SUSTAINABLE CITY
4 COSTS AND OPERATIONS
 4 COSTS AND OPERATIONS 4.1 INTRODUCTION This chapter summarizes the estimated capital and operations and maintenance (O&M) costs for the Modal and High-Speed Train (HST) Alternatives evaluated in this
STRATEGIC PRIORITIES AND POLICY COMMITTEE MAY 5, 2016
 STRATEGIC PRIORITIES AND POLICY COMMITTEE MAY 5, 2016 Shift Rapid Transit Initiative Largest infrastructure project in the city s history. Rapid Transit initiative will transform London s public transit
Madison BRT Transit Corridor Study Proposed BRT Operations Plans
 Madison BRT Transit Corridor Study Proposed BRT Operations Plans This paper presents a description of the proposed BRT operations plan for use in the Madison BRT Transit Corridor Study. The objective is
Public Meeting. June 15, :30 7:30 p.m.
 Public Meeting June 15, 2017 5:30 7:30 p.m. Welcome 2015 Naval Station Norfolk Transit Extension Study 2015 Naval Station Norfolk Transit Extension Study 2017 Norfolk Westside Transit Study HRT and the
Draft Results and Recommendations
 Waco Rapid Transit Corridor (RTC) Feasibility Study Draft Results and Recommendations Chris Evilia, Director of Waco Metropolitan Planning Organization Allen Hunter, General Manager Waco Transit System
Broward County Intermodal Center And People Mover. AASHTO Value Engineering Conference Presentation. September 1, 2009 San Diego, CA
 Project Development & Environment Study Broward County Intermodal Center And People Mover AASHTO Value Engineering Conference Presentation September 1, 2009 San Diego, CA Background P D & E Study Regional
Pacific Electric Right-of-Way / West Santa Ana Branch Corridor Alternatives Analysis
 Pacific Electric Right-of-Way / West Santa Ana Branch Corridor Alternatives Analysis Transit Coalition September 26, 2012 2 Study Area Pacific Electric Rightof-Way/West Santa Ana Branch (PEROW/ WSAB) extends
DRAFT Evaluation Scores. Transit
 DRAFT Evaluation s The criteria for evaluating applications for new funding commitments are used to measure how well they advance the six goals identified for the MTP. Through transportation: Reduce per
TIER TWO SCREENING REPORT
 TIER TWO SCREENING REPORT November 2012 Parsons Brinckerhoff DRAFT November 2012 1 Parsons Brinckerhoff DRAFT November 2012-2 TABLE OF CONTENTS Table of Contents...3 List of Tables...4 List of Figures...5
Greater Cleveland Regional Transit Authority. Joe Calabrese CEO/General Manager
 Greater Cleveland Regional Transit Authority Joe Calabrese CEO/General Manager Greater Cleveland RTA Overview Service Area Population of 1.5 million Customers Served 200,000 on a typical weekday 1.6 million
The capital cost estimates do not include allowances for: ROW acquisition. Third-party mitigation works. Hazardous materials handling.
 Mode Selection Report 7 Cost Evaluation The cost evaluation criteria used in the evaluation of the transit modes are: Capital cost. operating costs. Fare revenue. Net cost per passenger/passenger-mile.
Central City Line Locally Preferred Alternative (LPA) Amendment Public Hearing. July 24, 2014
 Amendment Public Hearing. July 24, 2014") Central City Line Locally Preferred Alternative (LPA) Amendment Public Hearing July 24, 2014 Project Description The Central City Line is a High Performance Transit project that will extend from Browne
Central City Line Locally Preferred Alternative (LPA) Amendment Public Hearing July 24, 2014 Project Description The Central City Line is a High Performance Transit project that will extend from Browne
CITY OF ANN ARBOR, MICHIGAN 301 E. Huron St., P.O. Box 8647 Ann Arbor, Michigan
 Date: Wednesday, June 18, 2014 Location: Ann Arbor District Library Attendees: 14 citizen attendees Ann Arbor Station Environmental Review Citizen Working Group Meeting Notes Meeting #3 The third meeting
Executive Summary. Phase 2 Evaluation Report. Introduction
 , Executive Summary Executive Summary Introduction TransLink and the Province of British Columbia sponsored a multi-phase study to evaluate alternatives for rapid transit service in the Broadway corridor
Public Meeting. City of Chicago Department of Transportation & Department of Housing and Economic Development
 Public Meeting City of Chicago Department of Transportation & Department of Housing and Economic Development Funded by Regional Transportation Authority September 12, 2011 In partnership with Presentation
STH 60 Northern Reliever Route Feasibility Study Report
 #233087 v3 STH 60 Northern Reliever Route Feasibility Study Report Washington County Public Works Committee Meeting September 28, 2016 1 STH 60 Northern Reliever Route Feasibility Study Hartford Area Development
Rapid Transit and Land-Use Integration a Reality
 City of Charlotte Rapid Transit and Land-Use Integration a Reality Transportation Oversight Committee Carolyn Flowers CEO Charlotte Area Transit System April 29, 2010 Charlotte Region Statistics Mecklenburg
CITY OF ANN ARBOR, MICHIGAN 301 E. Huron St., P.O. Box 8647 Ann Arbor, Michigan
 Date: Wednesday, June 24, 2014 Location: Ann Arbor District Library Attendees: 40 citizen attendees Ann Arbor Station Environmental Review Public Meeting Meeting Notes Meeting #2 The second public meeting
Tempe Streetcar. March 2, 2016
 Tempe Streetcar March 2, 2016 Tempe Profile 40 sq. miles, highest density in state University Town, center of region Imposed growth boundaries (density increase) Mixed use growth/intensifying land use
Attachment C: Benefit-Cost Analysis Spreadsheet
 Attachment C: Benefit-Cost Analysis Spreadsheet TIGER VII Application Collier Blvd. Corridor Improvements June 5 th, 2015 Collier Blvd BCA Summary The Collier Boulevard Benefit Cost Analysis (BCA) has
The City of Toronto s Transportation Strategy July 2007
 The City of Toronto s Transportation Strategy July 2007 Presentation Outline Transportation Statistics Transportation Building Blocks Toronto s Official Plan Transportation and City Building Vision Projects
Downtown Transit Connector. Making Transit Work for Rhode Island
 Downtown Transit Connector Making Transit Work for Rhode Island 3.17.17 Project Evolution Transit 2020 (Stakeholders identify need for better transit) Providence Core Connector Study (Streetcar project
CLRP. Performance Analysis of The Draft 2014 CLRP. Long-Range Transportation Plan For the National Capital Region
 NATIONAL CAPITAL REGION TRANSPORTATION PLANNING BOARD Item 12 CLRP Financially Constrained Long-Range Transportation Plan For the National Capital Region 2014 Performance Analysis of The Draft 2014 CLRP
UTA Transportation Equity Study and Staff Analysis. Board Workshop January 6, 2018
 UTA Transportation Equity Study and Staff Analysis Board Workshop January 6, 2018 1 Executive Summary UTA ranks DART 6 th out of top 20 Transit Agencies in the country for ridership. UTA Study confirms
Charlotte-Mecklenburg Region Rapid Transit and Land-Use Integration
 Charlotte-Mecklenburg Region Rapid Transit and Land-Use Integration Legislative Committee on Urban Growth and Infrastructure Carolyn Flowers CEO Charlotte Area Transit System March 23, 2010 Charlotte Region
Valley Metro Overview. ITE/IMSA Spring Conference March 6, 2014
 Valley Metro Overview ITE/IMSA Spring Conference March 6, 2014 Valley Metro Who Are We? Operate Regional Transit Services Valley Metro and Phoenix are region s primary service providers Light Rail and
Submission to Greater Cambridge City Deal
 What Transport for Cambridge? 2 1 Submission to Greater Cambridge City Deal By Professor Marcial Echenique OBE ScD RIBA RTPI and Jonathan Barker Introduction Cambridge Futures was founded in 1997 as a
Recommended Vision for the Downtown Rapid Transit Network
 Recommended Vision for the Downtown Rapid Transit Network April 2008 Presentation Overview Context Transit options Assessment of options Recommended network Building the network 2 1 Rapid Our Vision Reliable
Transit Access to the National Harbor
 Transit Access to the National Harbor December 2014 Table of Contents Executive Summary... 3 Introduction and Project Purpose... 6 Methodology.. 9 Definition of Alternatives..... 9 Similar Project Implementation
City of Pacific Grove
 Regional Study Utilizing Caltrans Intersection Evaluation Section 7: City of Pacific Grove s: FIRST STREET AT CENTRAL AVENUE Transportation Agency for Monterey County Prepared by Transportation Agency
Subarea Study. Manning Avenue (CSAH 15) Corridor Management and Safety Improvement Project. Final Version 1. Washington County.
 Corridor Management and Safety Improvement Project. Final Version 1. Washington County.") Subarea Study Manning Avenue (CSAH 15) Corridor Management and Safety Improvement Project Final Version 1 Washington County June 12, 214 SRF No. 138141 Table of Contents Introduction... 1 Forecast Methodology
Subarea Study Manning Avenue (CSAH 15) Corridor Management and Safety Improvement Project Final Version 1 Washington County June 12, 214 SRF No. 138141 Table of Contents Introduction... 1 Forecast Methodology
Letter EL652 City of Mercer Island. Page 1. No comments n/a
 Letter EL652 City of Mercer Island Page 1 No comments n/a Page 2 Response to comment EL652 1 Section 4.5.3 of the Final EIS presents the range of potential impacts of the project. This project also lists
Stakeholders Advisory Working Groups (SAWGs) Traffic and Transit SAWG Meeting #7
 Traffic and Transit SAWG Meeting #7") Presentation Tappan Zee Bridge/I-287 Corridor Environmental Review December 4, 2008 Slide 1 Title Slide Slide 2 This presentation discusses the contents of the Transit Mode Selection Report. Slide 3 The
Presentation Tappan Zee Bridge/I-287 Corridor Environmental Review December 4, 2008 Slide 1 Title Slide Slide 2 This presentation discusses the contents of the Transit Mode Selection Report. Slide 3 The
FREQUENTLY ASKED QUESTIONS
 FREQUENTLY ASKED QUESTIONS 2018 What is the More MARTA Atlanta program? The More MARTA Atlanta program is a collaborative partnership between MARTA and the City of Atlanta to develop and implement a program
A Transit Plan for the Future. Draft Network Plan
 A Transit Plan for the Future Draft Network Plan Project Overview and Status Completed Market Analysis and Service Evaluation. Developed Plan Framework and Guiding Principles. Developed a draft Five Year
Parking Management Element
 Parking Management Element The State Transportation Planning Rule, adopted in 1991, requires that the Metropolitan Planning Organization (MPO) area implement, through its member jurisdictions, a parking
What is the Connector?
 What is the Connector? The Connector is a plan for a high-capacity transit system from northeast to south Ann Arbor, connecting major destinations including downtown, commercial, and residential areas,
Point A Point B Point C Point D. Fulton County Board of Commissioners and Mayors Meeting December 14, 2017
 Fulton County Board of Commissioners and Mayors Meeting December 14, 2017 Master Plan Overview Phase 1 Community Vision and Existing Transit Conditions Phase 2 Scenario Development Phase 3 Transit Master
Sales and Use Transportation Tax Implementation Plan
 Sales and Use Transportation Tax Implementation Plan Transportation is more than just a way of getting from here to there. Reliable, safe transportation is necessary for commerce, economic development,
West Broadway Transit Study. Community Advisory Committee September 17, 2015
 West Broadway Transit Study Community Advisory Committee September 17, 2015 Introductions Community Engagement Summer Outreach Fall Outreach Technical Analysis Process Update Alternatives Review Economic
US 81 Bypass of Chickasha Environmental Assessment Public Meeting
 US 81 Bypass of Chickasha Environmental Assessment Public Meeting March 14, 2013 Introductions ODOT FHWA SAIC Meeting Purpose Present need for bypass Provide responses to 10/04/11 public meeting comments
QUALITY OF LIFE EXECUTIVE SUMMARY REPORT I O N S TAT I O N
 QUALITY OF LIFE EXECUTIVE SUMMARY REPORT UN I O N S TAT I O N T R AV E L by TR A I N Published September 2017 2015 PROGRESS MAP This document reports FasTracks progress through 2015 BACKGROUND RTD The
We Want Your Input! Review the design alternatives and tell us what s important to you in the design of these areas of the approved BRT Network:
 We Want Your Input! Review the design alternatives and tell us what s important to you in the design of these areas of the approved BRT Network: Richmond North of Oxford Street Richmond Row Dundas Street
6/11/2018. June 7, Item #1 CITIZENS PARTICIPATION
 June 7, 2018 Item #1 CITIZENS PARTICIPATION 1 Item #2 APPROVAL OF MINUTES Item #3 TRAC GOALS, FRAMEWORK & AGENDA REVIEW 2 COMMITTEE GOALS Learn about Southern Nevada s mobility challenges, new developments
BCA Benefits and Assumptions Summary
 2016 TIGER Application - Plymouth Multimodal BCA Benefits and Assumptions Summary The Plymouth Multimodal generates a variety of benefits, ranging from monetary such as increased transit fare revenue,
REPORT CARD FOR CALIFORNIA S INFRASTRUCTURE WHAT YOU SHOULD KNOW ABOUT CALIFORNIA S TRANSIT FACILITIES
 TRANSIT GRADE: C- WHAT YOU SHOULD KNOW ABOUT TRANSIT FACILITIES California needs robust, flexible and reliable transit systems to reduce peak congestion on our highways, provide options for citizens who
I-20 East Transit Initiative
 I-20 East Transit Initiative PRELIMINARY ORDER OF MAGNITUDE CAPITAL COST ESTIMATING METHODOLOGY Technical Memorandum December 2011 Prepared for: Metropolitan Atlanta Rapid Transit Authority Atlanta, GA
Feasibility Study. Community Meeting March, North-South Commuter Rail Feasibility Study
 Feasibility Study Community Meeting March, 2017 1 Agenda 1. Welcome / Introductions 2. Background / Meeting Purpose 3. Progress to Date Options Evaluated Capital/Operating Costs Ridership 4. Financial
Challenges in a Post-Katrina Environment East-West Corridor Project Overview February, 2007
 EAST-WEST CORRIDOR Challenges in a Post-Katrina Environment East-West Corridor Project Overview February, 2007 Presentation Agenda Project Overview / Purpose and Need Highway Component Transit Component
Tier 1 and Tier 2 Alternatives Screening Report
 I - 2 0 E A S T T R A N S I T I N I T I A T I V E Tier 1 and Tier 2 Alternatives Screening Report Prepared for: Metropolitan Atlanta Rapid Transit Authority Prepared by: AECOM/JJG Joint Venture Atlanta,
The Screening and Selection of Regionally Significant Projects
 The Screening and Selection of Regionally Significant Projects UTC 2018 Seminar Series March 15, 2018 Claire Bozic Martin Menninger ON TO 2050 CMAP is the Region s MPO, seven county region Land use and
2030 Multimodal Transportation Study
 2030 Multimodal Transportation Study City of Jacksonville Planning and Development Department Prepared by Ghyabi & Associates April 29,2010 Introduction Presentation Components 1. Study Basis 2. Study
3.17 Energy Resources
 3.17 Energy Resources 3.17.1 Introduction This section characterizes energy resources, usage associated with the proposed Expo Phase 2 project, and the net energy demand associated with changes to the
WELCOME. Transit Options Amherst - Buffalo Public Workshops
 WELCOME Transit Options Amherst - Buffalo Public Workshops Sponsored by Niagara Frontier Transportation Authority Greater Buffalo Niagara Regional Transportation Council Where do you live? Where do you
US 29 Bus Rapid Transit Planning Board Briefing. February 16, 2017
 US 29 Bus Rapid Transit Planning Board Briefing February 16, 2017 Project Goals Improve the quality of transit service Improve mobility opportunities and choices Enhance quality of life Support master
Restoration of Historic Streetcar Services in Downtown Los Angeles
 Restoration of Historic Streetcar Services in Downtown Los Angeles Early Scoping Meeting for Alternatives Analysis (AA) May 17, 2011 Introduction Key players Local lead agency: Metro Federal lead agency:
Midtown Corridor Alternatives Analysis. Policy Advisory Committee Meeting February 12, 2014
 Midtown Corridor Alternatives Analysis Policy Advisory Committee Meeting February 12, 2014 Today s Agenda Introductions Outreach efforts and survey results Other updates since last meeting Evaluation results
Develop ground transportation improvements to make the Airport a multi-modal regional
 Project Overview TRANSPORTATION IMPROVEMENTS WHAT ARE THE PROJECT GOALS? Transportation transportation hub. Develop ground transportation improvements to make the Airport a multi-modal regional Land Use
Preliminary Definition of Alternatives. 3.0 Preliminary Definition of Alternatives
 3.0 What preliminary alternatives are being evaluated? The alternatives for the East San Fernando Valley Transit Corridor project that were considered for screening include the No Build Alternative, Transportation
ANDERSON PROPERTY SITE ANALYSIS
 ANDERSON PROPERTY SITE ANALYSIS Introduction The Montgomery County Department of Transportation (MCDOT) initiated a feasibility study in the fall of 2012 to evaluate the need for transit service expansion
Regional Transit Extension Studies. Hampton Roads Transportation Planning Organization Passenger Rail Task Force Meeting December 17, 2013
 Regional Transit Extension Studies Hampton Roads Transportation Planning Organization Passenger Rail Task Force Meeting December 17, 2013 Topics Virginia Beach Transit Extension Study (VBTES) Naval Station
Service Quality: Higher Ridership: Very Affordable: Image:
 Over the past decade, much attention has been placed on the development of Bus Rapid Transit (BRT) systems. These systems provide rail-like service, but with buses, and are typically less expensive to
The Eastern Connector Study November, 2007 planning for the future
 The Eastern Connector Study November, 2007 planning for the future In late 2006, Albemarle County and the City of Charlottesville jointly initiated the Eastern Connector Corridor Study. The Project Team
Attachment D Environmental Justice and Outreach
 Attachment D Environmental Justice and Outreach ATTACHMENT D Environmental Justice and Outreach Indicate whether the project will have disproportionately high and adverse impacts on minority or low income
Troost Corridor Transit Study
 Troost Corridor Transit Study May 23, 2007 Kansas City Area Transportation Authority Agenda Welcome Troost Corridor Planning Study Public participation What is MAX? Survey of Troost Riders Proposed Transit
Comprehensive Regional Goods Movement Plan and Implementation Strategy Goods Movement in the 2012 RTP/SCS
 Comprehensive Regional Goods Movement Plan and Implementation Strategy Goods Movement in the 2012 RTP/SCS Annie Nam Southern California Association of Governments September 24, 2012 The Goods Movement