DESIGN OF A 5 KILOGRAM SOLAR POWERED UNMANNED AIRPLANE FOR PERPETUAL SOLAR ENDURANCE FLIGHT. A Project. Presented to
|
|
|
- Kelly Kelley
- 5 years ago
- Views:
Transcription
1 DESIGN OF A 5 KILOGRAM SOLAR POWERED UNMANNED AIRPLANE FOR PERPETUAL SOLAR ENDURANCE FLIGHT A Project Presented to The Faculty of the Department of Mechanical and Aerospace Engineering San José State University In Partial Fulfillment of the Requirements for the Degree Master of Science In Aerospace Engineering by Sean A. Montgomery May 2013
2 2013 Sean A. Montgomery ALL RIGHTS RESERVED ii
3 The Designated Project Committee Approves the Project Titled DESIGN OF A 5 KILOGRAM SOLAR POWERED UNMANNED AIRPLANE FOR PERPETUAL SOLAR ENDURANCE FLIGHT by Sean A. Montgomery APPROVED FOR THE DEPARTMENT OF MECHANICAL AND AEROSPACE ENGINEERING SAN JOSÉ STATE UNIVERSITY May 2013 Dr. Nikos J. Mourtos, Committee Chair Department of Mechanical and Aerospace Engineering Date Dr. Periklis Papadopoulos, Committee Member Department of Mechanical and Aerospace Engineering Date Soren LaForce, Committee Member NASA Ames Research Center Date iii
4 ABSTRACT DESIGN OF A 5 KILOGRAM SOLAR POWERED UNMANNED AIRPLANE FOR PERPETUAL SOLAR ENDURANCE FLIGHT by Sean A. Montgomery The objective of this project was to design an airplane with the ability to fly all day and all night using only solar power. The airplane also had to satisfy Fédération Aéronautique Internationale (FAI) rules for model airplane records by weighing less than 5 kg and having a combined wing area plus horizontal stabilizer area of less than 1.5 m 2. The airplane design presented in this paper, named the Photon, achieved both of these objectives. The key features of the Photon design were a lack of ailerons, a cruise/climb power switch, and a custom propeller design. The potential benefit of in-flight adjustable propeller pitch was also investigated. The Photon was designed to use Sunpower A-300 photovoltaic panels, and Panasonic NCR18650B lithium-ion batteries. Detailed analysis of the Photon design, including the effect of solar panels on the wing boundary layer, showed that the Photon design would be capable of perpetual solar endurance flight between May 21, and July 21, 2013 at latitude above the Equator (latitude of Morgan Hill, California). The best opportunity would occur on the day of the summer solstice. On this day, there would be 6.3% more solar energy than required and the batteries could store 8.4% more energy than required to fly through that night. These margins were less than the 10% that was desired, which showed how difficult it was to achieve perpetual solar endurance flight given the constraints for this design. As battery energy density continues to improve, perpetual solar endurance flight will become easier to achieve and more useful. iv
5 ACKNOWLEDGEMENTS "Knowledge is not the personal property of its discoverer, but the common property of all. As we enjoy great advantages from the inventions of others, we should be glad of an opportunity to serve others by any invention of ours, and this we should do freely and generously." -Benjamin Franklin This project was the result of more than three years of work. I owe a great deal to my professors, friends, family, and coworkers who have been patient and supportive while I pursued my interests. Dr. Mourtos laid the foundation for my understanding of aircraft design, and he was my guide through this important part of my life. Dr. Papadopoulos greatly increased my appreciation of high speed flow and spacecraft. Soren LaForce encouraged me by taking an interest in my project and provided a sounding board for my ideas. I never would have been able to pursue a master s degree if my parents hadn t pushed me while I was young, and then let me pursue my own interests later in life. I also want to thank the many students I encountered during my time at San José State University. Their many different skills and interests in the aerospace field enriched, encouraged, and challenged me. The legacy of aircraft designs and analysis programs by Mark Drela were essential to my understanding of aircraft design. Finally, this project would not have happened without the pioneering work of Alan Cocconi with Solong, and André Noth with Sky-Sailor. Their ambitions encouraged me to pursue my own dreams of flying forever. v
6 Table of Contents 1.0 Introduction Motivation Literature Review Technology Overview and Selection Mission Specification Energy Balance Diagram Solar Energy Available Energy Required Energy Balance Altitude Energy Storage Key Assumptions Design Method Analysis Tools EnergyBalance.m Matlab Script Solar Panel and Battery Selection Critical Design Parameters Sizing Wing Sizing Power Sizing Configuration Design Design drivers Propulsion Configuration Fuselage Configuration Wing Configuration Empennage Configuration Final Configuration Design Fuselage Design Wing Planform Design Empennage Design Horizontal Stabilizer vi
7 9.2 Vertical Stabilizer Airfoil Design Wing Airfoils Empennage Airfoil Propulsion System Design Cruse/Climb Battery Configurations Electronic Speed Controller Motor and Gearbox Selection Propeller Design Climb Rate Analysis Adjustable Propeller Pitch Overall Propulsion System Efficiency Structural Analysis Wing Spar Bending D-tube Twist Tailboom Bending Tailboom Twist Fuselage and Tailboom Weights Weight and Balance Airframe Weight Weight Margin Inertia Static Margin Stability and Control Drag Analysis Wing Drag Empennage Drag Fuselage Drag Tailboom Drag Other Drag Total Aircraft Drag vii
8 16.0 Power Required Analysis Drag Coefficient Drag Force L/D Ratio L 3 /D 2 Ratio Power Required Design Evaluation Final Energy Balance Conclusions Critical Design Parameters Comparison Mission Requirements Comparison Major Design Assumptions Design Improvements Comments on Perpetual Solar Endurance Flight Battery Energy Density Correction References APPENDICES Appendix A: Solar Irradiation Data for Morgan Hill, California Appendix B: Weather Data for Morgan Hill, California in July Appendix C: 3-View Renderings Appendix D: Drawings Appendix E: Airfoil Coordinates E.1: Modified AG34 Airfoil Coordinates E.2: AG36 Airfoil Coordinates E.3: HT21 Airfoil Coordinates Appendix F: Detailed Component Weights, Locations, Materials Appendix G: AVL Files G.1: photon.avl G.2: photon.run Appendix H: QMIL and QPROP Files H.1: solar8.mil viii
9 H.2: solar8.prop H.3: Model Motors AXI AC2217/20 with 6:1 Reduction Gearbox Appendix I: Energy Balance Matlab Files I.1: energybalance.m I.2: energybalanceplot.m Appendix J: QPROP Analysis Matlab Files J.1: importmoto.m J.2: MotoCalcAnalysis.m J.3: qpropvolt.m Appendix K: Structure Matlab Code K.1: chord.m K.2: coeffmom.m K.3: dtubeam.m K.4: dtubel.m K.5: dtubethick.m K.6: importfile.m K.7: liftloc.m K.8: mac.m K.9: plotboombend.m K.10: plotboomtwist.m K.11: plotwingsparbend.m K.12: plotwingtwist.m K.13: spararea.m K.14: sparinertia.m K.15: sparmomentellip.m K.16: spartb.m K.17: sparthick.m K.18: spartt.m K.19: spartw.m K.20: sparw.m K.21: tailboombending.m ix
10 K.22: tailboominertia.m K.23: tailboomtwisting.m K.24: wingsparbending.m K.25: wingtoque.m K.26: wingtwisting.m K.27: xle.m K.28: zle.m K.29: sparparameters.txt K.30: wingparameters.txt Appendix L: Wing Boundary Layer Analysis Matlab Files L.1: BLtransition.txt L.2: importfile2.m L.3: totalcdprofileavl.m L.4: XFOILinput.m L.5: AVL Output File (master9_fs_0.7.txt) x
11 List of Tables Table 2-1 Mission specifications Table 4-1 Sunpower A-300 cell specifications Table 4-2 Panasonic NCR18650B battery specifications Table 4-3 Photon solar cells and batteries Table 4-4 Critical design parameters Table 8-1 Wing planform parameters Table 9-1 Horizontal stabilizer parameters Table 9-2 Vertical stabilizer parameters Table 10-1 Modified AG34 airfoil parameters Table 10-2 AG36 airfoil parameters Table 10-3 HT21 airfoil parameters Table 11-1 Jeti Spin 22 Pro specifications Table 11-2 AXI 2217/20 motor specifications Table 11-3 VMGM6 gearbox specifications Table 11-4 Propeller specifications Table 12-1 Wing spar bending analysis parameters and results Table 12-2 Wing torque load analysis parameters and results Table 12-3 Tailboom bending analysis parameters and results Table 12-4 Tailboom torque load analysis parameters and results Table 13-1 Aircraft inertias Table 13-2 Weight and center of gravity location of major components Table 14-1 Aircraft dynamic modes pole values Table 14-2 Period and damping ratio of the aircraft dynamic modes Table 15-1 Wing profile drag analysis results Table 15-2 Wing drag Table 15-3 Empennage drag Table 15-4 Fuselage drag Table 15-5 Tailboom drag Table 15-6 Other source of drag Table 15-7 Total drag Table 18-1 Comparison of desired and achieved critical design parameters Table 18-2 Desired and achieved mission requirements comparison xi
12 List of Figures Figure 1.1 Sunriser II...4 Figure 1.2 Solar Challenger...6 Figure 1.3 Helios...8 Figure 1.4 Solong...9 Figure 1.5 Sky-Sailor Figure 1.6 Solar Impulse Figure 1.7 Zephyr Figure 3.1 Energy balance diagram: solar energy available Figure 3.2 Energy balance diagram: solar power available and power required Figure 3.3 Energy balance diagram: solar energy consumed and excess solar energy Figure 3.4 Energy balance diagram: battery energy required Figure 3.5 Energy balance diagram: adjusted excess solar energy Figure 3.6 Energy balance diagram with altitude energy storage Figure 4.1 Design process flow chart Figure 4.2 Sunpower A-300 photovoltaic panels Figure 4.3 Panasonic NCR18650B lithium-ion batteries Figure 6.1 Early configuration Figure 6.2 Intermediate configuration Figure 6.3 Final design 4-view drawing with dimensions Figure 6.4 Final design with spoiler stowed Figure 6.5 Final design with spoiler deployed Figure 7.1 Fuselage drawing with dimensions Figure 7.2 Fuselage cutaway view with internal components displayed Figure 7.3 Closed fuselage rendering Figure 8.1 Trefftz plot without wing twist Figure 8.2 Trefftz plot with 1.5 washout Figure 8.3 Wing top view with solar arrays marked Figure 8.4 Wing top and front view drawing with dimensions Figure 9.1 Isometric view of the empennage configuration Figure 9.2 Side view of the empennage configuration Figure 9.3 Horizontal stabilizer drawing with dimensions Figure 9.4 Vertical stabilizer drawing with dimensions Figure 10.1 Wing airfoil geometry Figure 10.2 Modified AG34 airfoil polar Figure 10.3 Empennage airfoil geometry Figure 10.4 HT21 airfoil polar Figure 11.1 Cruise/climb battery configurations Figure 11.2 Jeti Spin 22 Pro electronic speed controller Figure 11.3 AXI 2217/20 motor xii
13 Figure 11.4 AXI gearbox Figure 11.5 Propeller and motor efficiency without gearbox Figure 11.6 Propeller and motor efficiency with gearbox Figure 11.7 Propeller and motor efficiency with gearbox close-up Figure 11.8 Propeller and spinner isometric view rendering Figure 11.9 Propeller and spinner front view rendering Figure Propeller and spinner top view rendering Figure Propeller Reynolds number over blade radius Figure Propeller airfoil geometry Figure Propeller airfoil drag polar Figure Combined propeller and motor efficiency for fixed pitch propeller Figure Combined propeller and motor efficiency for different propeller pitch angles Figure Combined propeller and motor efficiency for fixed and adjustable propellers Figure Total solar energy conversion efficiency Figure 12.1 Photon structure rendering Figure 12.2 Elliptical and uniform lift distributions for 9 G load Figure 12.3 Elliptical and uniform lift distribution bending moment comparison Figure 12.4 Wing spar bending analysis Figure 12.5 Wing torque load analysis Figure 12.6 Tailboom bending analysis Figure 12.7 Tailboom torque load analysis Figure 13.1 Weight breakdown Figure 13.2 Center of gravity location diagram Figure 14.1 Aircraft dynamic modes pole plot Figure 15.1 Wing boundary layer transition location and local profile drag Figure 15.2 Trefftz plot with elliptical lift distribution Figure 15.3 Fuselage 2-D profile drag analysis in XFOIL Figure 15.4 Photon drag polar Figure 15.5 Cruise drag breakdown Figure 15.6 Drag coefficient breakdowns for different velocities Figure 16.1 C D plot for the design velocity range Figure 16.2 Drag force plot for the design velocity range Figure 16.3 L/D ratio plot for the design velocity range Figure 16.4 L 3 /D 2 ratio plot for the design velocity range Figure 16.5 Thrust power required for the design velocity range Figure 17.1 Energy balance diagram for Morgan Hill, California on June 21, Figure 17.2 Energy margins for Morgan Hill, California on June 21, Figure 17.3 Energy balance diagram for Morgan Hill, California on July 21, Figure 17.4 Energy margins for Morgan Hill, California on July 21, xiii
14 Nomenclature AR b c c d c l c m C D C Di C f C L D e g i w i h K 1 K 2 L m n x h x v P mot P req P req_batt Re Re L S t T V V h V v V v W aspect ratio wingspan wing chord airfoil drag coefficient airfoil lift coefficient airfoil pitching moment coefficient aircraft drag coefficient aircraft induced drag coefficient skin friction drag coefficient aircraft lift coefficient drag Oswald efficiency acceleration of gravity wing incidence angle horizontal stabilizer incidence angle zero lift drag constant induced drag constant lift aircraft mass aircraft load factor horizontal stabilizer moment arm vertical stabilizer moment arm motor power output thrust power required battery power required Reynolds number Reynolds number for entire surface length wing area airfoil thickness thrust velocity horizontal stabilizer volume coefficient vertical stabilizer volume coefficient climb rate weight dihedral angle efficiency taper ratio ¼ chord sweep angle air density xiv
15 Structural Nomenclature A m c E G I I 0 L M n P crit q q(x) Q r t T T crit V V w(x) W x X mean area enclosed by tube thickness centerline distance between the neutral axis to the point farthest away from the neutral axis modulus of elasticity shear modulus section moment of inertia reference section moment of inertia length bending moment load factor critical point load shear flow load function first moment of area for section of interest radius of curvature thickness torque critical torque load shear force velocity displacement function aircraft weight distance moment arm deflection displacement deflection angle tension/compression stress shear stress angle of twist Acronyms BEC CAD CFD ESC FAI MAC MPPT NASA RPM battery elimination circuit computer aided design computational fluid dynamics electronic speed controller Fédération Aéronautique Internationale mean aerodynamic chord maximum power point tracker National Aeronautics and Space Administration revolutions per minute xv
16 1.0 INTRODUCTION The first half century of powered flight was characterized by flying faster, farther, and higher. Present day aviation no longer pushes as hard on these boundaries. Focus has shifted to improving fuel efficiency and reducing operating costs. There is, however, another boundary that has been receiving more attention: duration. Growing demand for airborne surveillance has led to the adoption of unmanned aircraft which can remain in the air much longer than aircraft with pilots onboard. Although many unmanned aircraft can remain in the air for most of a day, even longer endurance is in demand. Ideally, the endurance of the aircraft would be as long as the mission required, which could last for months or even years for missions such as communication relay or persistent uninterrupted surveillance. Extreme endurance of months or years is not possible with traditional propulsion systems which consume fuel. However, a solar powered aircraft might be able to fly for months or years. If an aircraft could convert enough solar energy into stored energy during the daytime, the stored energy could be used to continue flying through the night. After the sun rises the next day, the cycle could be repeated. In theory, such an aircraft would never have to land as long as enough solar energy could be stored each day for the next night. There is no common term to describe this ability to fly all day and all night using only solar power. Only a few aircraft have ever demonstrated this ability and most of those flights only occurred in the past few years. Some papers have called this ability perpetual flight. So far, perpetual flight is only feasible during the summer when the days are long and the nights are short. These aircraft also fly so slowly that a strong headwind could prevent them from moving forward. To better qualify the term perpetual flight to reflect these limitations, this paper uses the term perpetual solar endurance flight. 1
17 The technology for perpetual solar endurance flight has only become available in the past decade. As technology improves, perpetual solar endurance flight will become easier to achieve and aircraft with this capability will become more common. The objective of this project was to explore the capabilities and limitations of a small airplane designed for perpetual solar endurance flight using current technology. The design presented in this paper was named the Photon. 1.1 MOTIVATION In the summer of 2009, this project was initiated with a question: if perpetual solar endurance flight is feasible today, why aren t there more solar powered aircraft flying for multiple days on a regular basis? The original plan was to answer this question by designing an airplane capable of perpetual solar endurance flight, and then test flying a prototype of the design for multiple days to see how well it performed. Although no aircraft had been constructed at the time this paper was written, this approach had a number of implications for this project. This project focuses more on detailed design than preliminary design. In preliminary design, emphasis is placed on the critical requirements that drive the design, but this emphasis often causes details to be ignored that make the design infeasible. Since the Photon design was intended to be constructed and flown, any infeasible details would have to be fixed. It made more sense to spend more time on the detail design. The drawback of this focus on the detail design is that this project cannot easily be generalized to other solar powered aircraft designs. However, there are some detail design considerations for this project that would apply to other solar powered airplanes, such as the effect of solar panels on the wing boundary layer transition point. These detail design considerations were not mentioned in the papers found during the literature review process, so these detail design considerations for the Photon design should be useful for other solar powered airplane designs. Other solar powered airplane designs should also benefit 2
18 from the detailed design process described in this paper. Other designs will have different requirements and different operating conditions, but the design process will be similar. A maximum gross weight of 5 kg was imposed on the design to limit the cost of building a prototype. Solar powered aircraft tend to be very large because there are many advantages to scaling the aircraft up. Propulsion system component efficiencies are higher for larger aircraft. The Reynolds number is also higher for large aircraft which reduces skin friction drag. Structures can be made more weight efficient when they are larger because they can avoid minimum gauge of materials problems that smaller structures must deal with. However, large aircraft are more expensive to build. Scaling an aircraft down makes it cheaper to build, but the advantages of scaling up act as disadvantages when scaling down. The maximum gross weight of 5 kg was believed to be an acceptable balance between scaling advantages and cost. The 5 kg limit would also make the Photon design eligible for a Fédération Aéronautique Internationale (FAI) [17] model aircraft record. At 5 kg, the Photon design would also be between the weights of Sky- Sailor (2.6 kg) and Solong (12.6 kg) which both had demonstrated perpetual solar endurance flight in the past. 1.2 LITERATURE REVIEW The history of solar powered flight spans nearly four decades. An overview of significant solar powered aircraft and papers will be presented in this section. Most of the practical missions for solar powered aircraft require the aircraft to fly at high altitudes. Design considerations for solar powered aircraft flying at high altitudes will be included in the overview, even though the Photon design presented in this paper was designed to fly at low altitudes. After the overview of past aircraft and papers, recent papers involving solar powered aircraft will be discussed. 3
![SOLAR AIRPLANE HISTORY The first solar powered aircraft flight occurred in 1974. The aircraft was the Sunrise I, designed and built by Robert Boucher and Roland Boucher [4, 5].](/docs-images/84/90817870/images/19-0.jpg "The Sunrise I was designed to demonstrate both solar powered flight and perpetual flight. The Boucher brothers realized an aircraft capable of perpetual flight could be used as a low cost satellite.")
19 SOLAR AIRPLANE HISTORY The first solar powered aircraft flight occurred in The aircraft was the Sunrise I, designed and built by Robert Boucher and Roland Boucher [4, 5]. The Sunrise I was designed to demonstrate both solar powered flight and perpetual flight. The Boucher brothers realized an aircraft capable of perpetual flight could be used as a low cost satellite. At the time, batteries were too heavy to store energy for night flight. Instead, the Sunrise I was supposed to store energy in the form of altitude by using excess energy to climb during the day, and gliding from sunset until sunrise the next day. Sunrise I was destroyed by turbulence before it could accomplish this. The second aircraft, Sunrise II, reached an altitude of approximately 17,000 ft before radio control was lost and the aircraft broke apart in a high speed dive. Figure 1.1 Sunriser II Source: [27] The Boucher brothers were not the only people thinking about solar powered flight around this time. In 1974, F. Irving and D. Morgan presented a paper on the feasibility of solar powered flight [21]. In the paper they considered many of the requirements for adapting photovoltaic cells to aircraft, such as protecting the cells through encapsulation and maintaining 4
20 solar cell temperature with air cooling. They acknowledged that solar power could be harvested through thermodynamic means (using sunlight to heat up a fluid for an engine cycle) instead of directly converting sunlight into electricity using photovoltaics, but they did not see any advantages to the thermodynamic system. Their performance analysis found flight was possible if the aircraft was designed like a sailplane. By the early 1980 s, more people realized perpetual solar endurance flight could be possible and that such aircraft flying at high altitudes could perform the duties of satellites for a much lower cost. William Phillips at the NASA Langley Research Center published a technical report in 1980 that considered the design of high altitude perpetual flight aircraft [37]. Phillips determined such an aircraft would need to be very large and have a very low wing loading. The lower limit of the wing loading would be constrained by the wind speeds the aircraft would encounter. For this reason, the aircraft would fly above 20 km (65,000 ft) where the wind speeds were lower. Gliding all night would not be feasible since the altitude loss would be too great. Batteries were considered too heavy to store the energy required for night. Future improvements in fuel cells appeared to be the most promising form of energy storage and would make perpetual solar endurance flight possible in the future. Phillips also recognized the difficulty of obtaining perpetual solar endurance flight at high latitudes and winter solar conditions where the sun would not rise as high above the horizon. He proposed a cruciform wing where the solar panels could track the sun through the day. The development of light weight structures for human powered aircraft in the 1970 s helped pave the way for solar powered aircraft in the 1980 s. The design of human powered aircraft and solar powered aircraft have a lot in common since both need to minimize the power required for level flight. After the successful crossing of the English Channel by the Gossamer 5
![Albatross in 1979, Paul MacCready and his team at Aerovironment investigated converting their aircraft to electric power [4, 29].](/docs-images/84/90817870/images/21-0.jpg "A smaller backup version of the Gossamer Albatross, the Gossamer Penguin, was fitted with electric motors designed by Robert Boucher and solar cells left over from the Sunrise aircraft.")
21 Albatross in 1979, Paul MacCready and his team at Aerovironment investigated converting their aircraft to electric power [4, 29]. A smaller backup version of the Gossamer Albatross, the Gossamer Penguin, was fitted with electric motors designed by Robert Boucher and solar cells left over from the Sunrise aircraft. The solar cells were mounted on a panel that could be tilted toward to sun to allow level flight during the morning when the air was calm enough to fly. The first manned solar powered flight occurred on May 18, DuPont sponsored Paul MacCready to design a new aircraft that would cross the English Channel using solar power. Unlike the Albatross, which flew at a low altitude, the Solar Challenger flew at a high altitude, so the structure was designed to withstand +6.0 G and -4.0 G loads. The Solar Challenger had an unusually large horizontal stabilizer to place some of the solar cells which were different and could not be mixed with the other cells on the wing. Solar Challenger successfully flew over the English Channel on July 7, 1981 and reached a maximum altitude of 11,000 ft. Figure 1.2 Solar Challenger Source: In 1982, another NASA Langley employee, J.W. Youngblood, published a paper on the design of high altitude long endurance solar powered aircraft [52]. The resulting design had a 6
22 wing loading of 0.78 lb/ft 2, wingspan of 305 ft, and an aspect ratio of 29.25, to carry a 100 lb payload consuming 100 watts at an altitude of 59,000 ft. This design was in line with many of the design studies published later. Youngblood also considered the possibility of mounting solar cells on the bottom of the wing, but found they added too much weight. In 1983, the most thorough paper on high altitude solar powered flight came out. The paper was a NASA report made in collaboration with Lockheed [19]. Detailed analysis of the solar energy available was conducted. The effects of atmospheric attenuation, reflected sunlight from the Earth (albedo), and even the effect of infrared radiation on the temperature of the solar panels were considered. Thermodynamic harvesting of solar energy was also considered. Mirrors would concentrate sunlight to heat a fluid to high temperatures where the thermodynamic cycle efficiency is higher. However, the thermodynamic system was ultimately discarded since it weighed more than the photovoltaic system. The structural design used wire bracing to make the structure lighter. A separate report was published in 1984 which detailed the structural design requirements for the aircraft [20]. Many design configurations were considered, with various combinations of vertical area to capture sunlight at low sun angles. The final configuration had five vertical surfaces distributed along the wing. The outer panels were large winglets which rotated to a horizontal position at night for improved aerodynamic efficiency. Two widely spaced tailbooms supported the empennage. There were no ailerons. Instead, roll control was accomplished by differential elevator deflection which twisted the wing. Bank angles, however, were limited to very small values since the large wingspan and slow speed made it very easy to stall the inside wingtip. The report included many parametric studies of important design parameters, and also graphed the altitudes, latitudes, and times of year where perpetual solar endurance flight was possible for the design considered. 7

23 After Solar Challenger, Aerovironment received funding to develop a solar powered high altitude long endurance aircraft. A prototype, HALSOL was developed and flight tested. However, it was determined that fuel cell technology was not mature enough for perpetual flight and the project was shelved. By the 1990 s, fuel cell technology had improved and the program was revived. A series of solar powered aircraft were constructed under the NASA Environmental Research Aircraft and Sensor Technology (ERAST) program. By then, the conceptual design of solar powered aircraft was well understood and the focus shifted to proving the concept. One of the goals of the program was to validate the maximum altitude predicted for a solar powered aircraft. Helios did this in 2001 when it flew to a record 96,863 ft altitude, close to the predicted 100,000 ft altitude. Part of the challenge of reaching the high altitude was that solar panel efficiency decreased above 12 km (39,000 ft) because the low air density did not provide sufficient cooling for the solar panels [9]. Anthony Colozza at the NASA Glenn Research Center published a paper in 2003 which proposed to include cooling ducts underneath solar panels mounted on a wing to improve their efficiency [10]. After Helios proved the high altitude a solar powered aircraft could reach, Helios was refitted with fuel cells to demonstrate perpetual solar endurance flight. However, low altitude turbulence encountered shortly after takeoff destroyed the aircraft. The Helios crash was the end of the NASA ERAST program. Perpetual solar endurance flight had still not been demonstrated. Figure 1.3 Helios Source: 8
![Perpetual solar endurance flight was first achieved in 2005 by Alan Cocconi and his airplane, Solong [1].](/docs-images/84/90817870/images/24-0.jpg "Unlike previous concepts for perpetual solar endurance flight, Solong was not designed to fly at high altitudes. It had a wingspan of only 4.75 m (15.6 ft) and weighed 12.6 kg (28 lbs).")
24 Perpetual solar endurance flight was first achieved in 2005 by Alan Cocconi and his airplane, Solong [1]. Unlike previous concepts for perpetual solar endurance flight, Solong was not designed to fly at high altitudes. It had a wingspan of only 4.75 m (15.6 ft) and weighed 12.6 kg (28 lbs). Most of the flight was flown under manual control so the pilots could utilize rising air from thermals and avoid downdrafts. The efficiency of most speed controllers is very low at the cruise power setting. Crucial to the success of Solong was the custom speed controller designed by Cocconi, which achieved above 88% efficiency between 60 watts to 800 watts. Solong used Sunpower A-300 solar panels which had a high efficiency of 21.5%. The energy for flying at night was stored in lithium-ion batteries designed for laptop computers. The solar panels were molded into the composite wing. On June 3, 2005, Solong landed after flying for 48 hours. Figure 1.4 Solong Source: [1] 9
![The next demonstration of perpetual solar endurance flight occurred in 2008 [27].](/docs-images/84/90817870/images/25-0.jpg "André Noth, a PhD candidate at ETH Zurich came up with a conceptual design model that could be applied to a wide range of solar powered aircraft.")
25 The next demonstration of perpetual solar endurance flight occurred in 2008 [27]. André Noth, a PhD candidate at ETH Zurich came up with a conceptual design model that could be applied to a wide range of solar powered aircraft. He validated the model by designing and flying an airplane named Sky-Sailor which weighed 2.6 kg (5.7 lbs) and had a wingspan of 3.2 m (10.5 ft). The solar panels on Sky-Sailor were RWE-S-32 panels which had a lower efficiency (16%) than the Sunpower A-300 panels, but a better power to weight ratio. Instead of mounting the solar panels to the wing skin, the solar panels replaced the wing skin. Sky-Sailor also used lithium-ion laptop batteries like Solong did. Perpetual solar endurance flight attempts were made in the summer of 2007, but were unsuccessful because turbulent wind conditions during the night drained the batteries before sunrise. On June 21, 2008, Sky-Sailor landed after flying for 27 hours with a fully charged battery capable of repeating the cycle. Sky-Sailor had a custom autopilot that kept the aircraft between 200 m (650 ft) and 400 m (1300 ft) above the ground, so rising air from thermals was not depended on. Figure 1.5 Sky-Sailor Source: [27] 10


26 In 2010, two large solar powered airplanes also demonstrated perpetual solar endurance flight. Solar Impulse was the first plane to demonstrate perpetual solar endurance with a human pilot onboard [44]. With a wingspan of 63.4 m (208 ft), Solar Impulse flew for 26 hours in July, 2010 over Switzerland. The Zephyr solar powered airplane produced by the company, QinetiQ, had a smaller wingspan than Solar Impulse, but Zephyr did not carry a person [38]. The 22.5 m (74 ft) wingspan unmanned airplane flew continuously for 14 days until it landed by choice. Zephyr proved conclusively that perpetual solar endurance flight for multiple days was feasible. Figure 1.6 Solar Impulse Source: [44] Figure 1.7 Zephyr Source: 11
27 SOLAR AIRPLANE DESIGN MODELS Over the years there have been many conceptual design models proposed for perpetual solar powered flight. Most of these simply rehash previous work with slightly different derivations or assumptions. Since these models only used paper designs and no physical aircraft was constructed or flown, optimistic values could be assumed without validation or consideration of practical limitations. Optimization that neglected important parameters such as aspect ratio and Reynolds number effects would not be very useful for designing real aircraft [43]. Brandt used solar array areas larger than the wing area, which implied panels mounted underneath the wing would receive the same amount of sunlight as panels mounted on top of the wing [6]. Some early papers neglected the variation of collected solar power with the variation of sun angle [37]. Most models assumed the solar panels were a flat surface parallel to the ground, but a few more recent papers have accounted for mounting the solar panels on curved wing surfaces [2]. One of the most difficult parameters to model was the structural weight of the aircraft. Many models used a statistical approach. Lacking better models, many early papers used empirical sailplane design equations. Noth improved upon this through statistical analysis of aircraft of all sizes and assumed solar aircraft would be in the top 5% [27]. A recent paper by Leutenegger instead calculated the structural weight based on the type of structure used. However, even this method differed significantly when compared with actual solar aircraft [25]. Some models used Helios as a benchmark, but this only provided validation for a specific size of aircraft [39]. The HELIPAT project at the Politecnico di Torino in Italy did extensive analysis and experimental validation for the structural design of a solar powered aircraft, but only for one particular design [40, 41]. 12
28 Recent papers have considered ways to augment perpetual flight aircraft. Klesh developed a model for the energy balance of a solar airplane as the flight path varies [24]. Spangelo used this model to calculate the best path for a solar airplane remaining over a target location. At low sun angles, this path optimization can improve the energy balance by as much as 15% [45]. Another idea to help solar powered aircraft stay in the air would be to beam power from a ground station to the aircraft. Microwaves transmit power very efficiently over large distances through the atmosphere. Wickenheiser considered the design requirements for a perpetual flight aircraft incorporating both solar panels and a microwave antenna to receive beamed power [50]. 1.3 TECHNOLOGY OVERVIEW AND SELECTION There is a large range of technology that can be used for perpetual solar endurance flight. The two important functions the technology must provide are converting sunlight into a more useful form of energy, and storing energy for use at night. SUNLIGHT CONVERSION TECHNOLOGY Sunlight can be collected to power a thermodynamic propulsion system. This involves using mirrors to concentrate sunlight and using the concentrated sunlight to raise the temperature of a gas such as steam. An engine can then extract energy from the gas to propel the aircraft. Although such a system should be feasible to power a solar powered aircraft, the author is not aware of any solar powered aircraft that have used such a system. Some studies from the literature review concluded such systems are heavy compared to photovoltaic systems [19]. Such thermodynamic systems would probably be too heavy for use on a small aircraft. 13
29 A common way to collect solar energy is to use photovoltaic solar panels to convert sunlight into electricity. There a number of different types of photovoltaic panels. The most common type is based on silicon because they are cheaper to manufacture than other types of solar panels. Silicon solar panels are typically found on top of residential and commercial buildings. Silicon solar panels typically have efficiencies around 15%. There are other types of solar panels which use different materials to achieve much higher efficiencies up to 40% or more. Some high efficiency panels have multiple layers to capture different wavelengths of sunlight. Many of these high efficiency solar panels are used for spacecraft. These panels are much more expensive than silicon solar panels. High efficiency panels can have high power to weight ratios, but their high cost generally makes them too expensive to use on solar airplanes. Another type of photovoltaic panel with high power to weight ratios is thin film solar panels. Thin film solar panels are easier to mount on wings since they can bend easily. However, current thin film solar panels have lower efficiencies around 10%. Thin film solar panels are promising for solar powered aircraft because they offer the best power to weight ratios. However, until efficiencies improve, most thin film solar panels will not be suitable for solar powered aircraft. Photovoltaic solar panels usually require some sort of voltage regulator. The voltage where the solar panels operate most efficiently is usually different than the output voltage required for the load using the solar power. A device that attempts to optimize these voltages for the greatest efficiency is known as a maximum power point tracker (MPPT). For a solar powered airplane with batteries, a maximum power point tracker is required to regulate the voltage between the solar arrays and the batteries. 14
30 ENERGY STORAGE TECHNOLOGY The energy storage technology is even more important than the sunlight conversion technology. Airplanes have been able to fly from shortly after sunrise to shortly before sunset using photovoltaic solar panels since the 1970 s [5], but aircraft powered by electric energy storage systems have not been able to fly for that long until the past decade. This is because current energy storage technology is much heavier than current photovoltaic technology. The amount of energy that can be stored per unit weight of the storage system is known as the energy density. Typical aviation fuels such as kerosene have much higher energy densities than other technologies for energy storage. Kerosene has an energy density of 11,900 W h/kg [18] while current lithium-ion batteries have an energy density of only 265 W h/kg [36]. The lower the energy density of the storage system, the heavier the storage system must be. An overweight energy storage system can create an unsolvable cycle, where the extra storage system weight increases the power required for cruise flight, which increases the energy that must be stored, which increases the weight of the energy storage system even more. A light weight energy storage system makes the cycle work in reverse, which makes perpetual solar endurance flight easier to achieve. This is why the energy density of the energy storage system is the most important parameter for an airplane designed for perpetual solar endurance flight. Perpetual solar endurance flight becomes infeasible if the energy density of the storage system is too low. There are two primary technologies to store energy that can easily be converted into electricity: fuel cells and chemical batteries. The compatibility of these two technologies with electricity makes them well suited for use with photovoltaic solar panels. Both fuel cells and chemical batteries can be rechargeable, which is necessary for perpetual solar endurance flight for multiple days. Fuel cells have much higher energy densities than batteries, which makes fuel 15
31 cells preferable for perpetual solar endurance flight. However, fuel cells uses gasses which require a lot of volume to store, often more volume than the total volume of the aircraft. This problem can be solved by cooling the gasses to very low temperatures and storing them as much denser liquids. The cooling system required for this would be difficult to fit on a small aircraft. Batteries are more suitable for a small airplane. Batteries do not perform well at cold temperatures, so they either must be heated or limited to relatively low altitudes where the air is warmer. There are quite a few different types of chemistries for rechargeable batteries. Lead-acid and nickel-cadmium batteries have been used for a long time, but they have low energy densities. Lithium-ion batteries are presently very common because they are used for many consumer electronic devices such as phones, laptops, and tablets. These consumer electronic devices use lithium-ion batteries because they allow the devices to be lighter thanks to the higher energy density of lithium-ion batteries. A drawback of lithium-ion batteries is that they catch on fire more easily if they are overcharged or mistreated. Lithium-ion battery fires usually cannot be extinguished once they begin. For safety, lithium-ion batteries should be used with protection circuits to monitor and regulate the batteries. An important advantage of Lithium-ion batteries is that they can go through many charge and discharge cycles without losing much capacity. There are several other battery chemistries based on lithium, such as lithium sulfur batteries, with significantly higher energy densities than lithium-ion batteries. However, these other lithium batteries currently lose significant capacity each time they are charged and discharged, requiring them to be replaced frequently. This makes them poorly suited for most applications which require rechargeable batteries. 16
32 A variation of the lithium-ion battery is the lithium-ion polymer battery. Lithium-ion polymer batteries can be discharged at much higher rates than regular lithium-ion batteries, which make them useful for applications which require high peak power output. In recent years, energy densities for regular lithium-ion batteries have continued to improve while lithium-ion polymer batteries have focused on power density instead, and their energy densities have stagnated. At the time the Photon aircraft was designed, the energy density of regular lithium-ion batteries was higher than the energy density of lithium-ion polymer batteries. TECHNOLOGY SELECTION The sunlight conversion technology and energy storage technology selected for a solar powered airplane strongly affects the design of the airplane. It was important to select the technology to use early in the design process for the Photon so the design could be tailored to match the technology. The Photon design was limited to 5 kg gross weight to reduce costs, so the technology selected needed to be appropriate for a small, inexpensive solar powered airplane. Silicon photovoltaic solar panels seemed to be the most appropriate technology for sunlight conversion because of their low cost, moderate efficiency, and moderate power to weight ratio. Batteries would be easier to install in a small airplane than fuel cells. Lithium-ion batteries had the highest energy density available for mass produced, commercially available batteries, so lithium-ion batteries were selected for the energy storage system. 17
33 2.0 MISSION SPECIFICATION The mission for the Photon design was to achieve perpetual solar endurance flight and satisfy FAI rules for model airplane records. The only firm mission requirements for the Photon design were derived from this goal. The plane had to be able to fly for at least 48 hours continuously to prove it could achieve perpetual solar endurance flight. The FAI rules limited the gross weight to 5 kg for model aircraft record attempts. The rules also limited the total projected area of the wing and the horizontal stabilizer combined to 1.5 m 2. The rest of the mission requirements were created to make it easier to achieve perpetual solar endurance flight. There was no payload requirement so no extra weight would have to be carried. There was also no range requirement since the goal was simply to remain flying, not to reach any destination. This was also why the standard mission profile diagram was omitted for the Photon design, since the airplane was not expected to cover any distance over the ground. The Photon was expected to circle for the entire flight over the takeoff location until it would land. To save weight, the Photon design did not use landing gear. Takeoffs would occur by a running hand toss. To land, the aircraft would simply slide on the fuselage belly and the edge of the vertical stabilizer that extended below the tailboom. The aircraft could only demonstrate perpetual solar endurance in the summer, so hot temperatures would reduce the air density and increase the power required for flight. An average air density of 1.15 kg/m 3 was assumed for all calculations, except the critical structural load calculations. This assumption was probably conservative since the aircraft would also fly during the night, when temperatures would be cooler and the air density would be higher. 18
34 The Photon design had to cruise at a low speed to save power. The stall speed had to be far enough below the cruise speed so the airplane would not stall frequently during cruise. To cruise at 20% above the stall speed, the stall speed had to be 17% below the cruise speed. The cruise speed also had to be high enough to overcome the strongest expected headwinds. Based on weather data for Morgan Hill, California (Appendix B), the Photon design needed to cruise at 7.7 m/s (15 knots) or faster. The climb rate requirement was the only other critical requirement for the Photon design other than achieving perpetual solar endurance flight. The flight could end prematurely if the aircraft became stuck in a downdraft. If the air descended faster than the maximum climb rate of the aircraft, the aircraft would be forced down to the ground. An airplane with a high climb rate could get out of this situation, but a high climb rate also required much more power, which would require more batteries for energy storage. A climb rate requirement of 1.5 m/s (300 ft/min) was selected for the Photon design. The climb requirement was established late in the design process once the capabilities and limitations of the design were better understood. The 1.5 m/s climb rate requirement was a low climb rate that still made it difficult for the plane to escape downdrafts. This was a necessary tradeoff for a design that cruised very efficiently. A propulsion system sized for efficient cruise power would have trouble with the much higher power needed to climb. The last two mission requirements were specific to perpetual solar endurance flight. The battery margin requirement of 10% meant there had to be 10% more battery capacity than the energy required to fly through the night. The solar charging margin of 10% meant there had to be 10% more excess solar energy available to charge the batteries during the day than the capacity of the batteries. These 10% margins seemed prudent given the uncertainty of the actual solar 19
35 energy available and the power consumption for a long flight. The next chapter will describe how these margins were calculated. Table 2-1 Mission specifications Parameter SI Units Imperial Units Perpetual Solar Endurance 48 hours Gross Weight 5 kg 11.0 lbs Wing Area 1.5 m ft 2 Payload None Range None Takeoff Distance None (hand toss launch) Landing Distance None (belly landing) Average Air density 1.15 kg/m slugs/ft 3 Stall Speed 83% of cruise speed Cruise Speed 7.7 m/s 15 kts (17.2 mph) Climb Rate 1.5 m/s 300 ft/min Battery Margin 10% Solar Charging Margin 10% 20
36 3.0 ENERGY BALANCE DIAGRAM The energy balance diagram was essential for designing an airplane for perpetual solar endurance flight. The energy balance diagram graphed the solar power collected and consumed over time. The integration of power over time is energy, so the area under the power plot represented energy. The energy balance diagram provided a graphical representation of whether the total solar energy collected over a 24 hour period exceeded the total energy consumed in that same period, which is the definition of perpetual solar endurance flight. 3.1 SOLAR ENERGY AVAILABLE To design an aircraft for perpetual solar endurance flight, it was necessary to know the amount of solar energy that could be collected in a day. The total energy was determined by first determining the solar power available over a day and then integrating to get the total energy. The solar power that reaches the Earth at a given time is known as solar irradiation and it is expressed in units of W/m 2. The intensity of solar irradiation depends on the distance of the Earth from the sun, the tilt of the Earth s axis toward the sun, the latitude on the Earth, and attenuation and scattering by the atmosphere. Historical data and theoretical models for solar irradiation have already been established for the design of residential and commercial solar arrays. The Bird Clear Sky Model [3] is commonly used by solar engineers so it was selected for the Photon design. As the model name implied, the model did not consider the effect of clouds. This was acceptable because it was assumed the Photon design would only fly on a clear day. The electrical output of a photovoltaic solar panel depends on the incidence angle of the light rays striking the panel. The output is proportional to the sine of the incidence angle (maximum when the light rays are perpendicular to the panel, zero when the light rays are 21
37 parallel to the panel). For a solar panel that is flat on the ground (parallel to the surface of the Earth), the power output over a day resembles a sine curve as the sun rises in the sky and then sinks back down to the horizon. Just after sunset, the solar panel still produces a tiny amount of electricity as light is scattered or reflected by the atmosphere from the sun to the solar panel. This small amount of energy after sunset was negligible for the Photon design, so the solar power over a day was approximated as a sine curve. With this approximation, the solar power available over a day could be modeled using only the sunrise and sunset times, and the maximum solar irradiation value for the day from the Bird Clear Sky Model. The Bird Clear Sky Model assumed the solar power was calculated for a solar panel parallel to the surface of the Earth. For the Photon design, the solar panels were mounted on the top surface of the wing, which was curved. The orientation of the panels also would change as the aircraft maneuvered or changed heading. For simplicity, the design process assumed the solar panels remained parallel to the surface of the Earth at all times. This greatly simplified the analysis since a more accurate method would have had to model the path and orientation of the aircraft and the corresponding variation in solar energy over time (see references [24, 45]). However, the assumption that the solar panels remained parallel to the surface of the Earth should be viewed with some skepticism because it could significantly overestimate or underestimate the amount of solar energy available for the aircraft. A much more complex analysis without the simplifying assumptions or flight test data could determine how much accuracy was sacrificed by assuming the solar panels remained parallel to the ground at all times. For the Photon design, it was useful to construct the energy balance diagram in terms of the energy flowing into and out of the batteries. The propulsion system was designed to only draw power directly from the batteries. The power from the solar panels recharged the batteries. 22
38 The solar panels never directly powered the propulsion system. This allowed the batteries to act as a buffer, providing smoother power delivery. If the solar panels had directly powered the propulsion system, the power would have varied as the airplane maneuvered and tilted the solar panels. For the Photon design, the solar energy available was the total energy that flowed into the batteries, and the energy required was the total energy that flowed out of the batteries. The rate of energy that flowed into the batteries was the solar power available, which was equal to the solar irradiance multiplied by the total efficiency of the sunlight conversion system (encapsulation, solar panels, and MPPT). After the solar power available was established, its variation over a day was plotted. Figure 3.1 shows the solar power available over a 48 hour period. Although perpetual solar endurance flight only required the energy balance for a 24 hour period, 48 hours were shown in the following figures to emphasize this was a 24 hour cycle that repeated. Since energy is the integral of power, the total solar energy available was the area under the curve. Figure 3.1 Energy balance diagram: solar energy available 23
39 3.2 ENERGY REQUIRED The solar energy available had to be balanced against the energy required for the aircraft to remain in flight. Once again, the total energy required was found by first determining the power required over a day and then integrating to get the total energy. Another major assumption was made to simplify the energy required analysis. It was assumed the Photon would fly at a constant speed and altitude for the entire day, which kept the power required constant. This was not a totally unreasonable assumption. If the airplane began the day already flying and did not land, no change in altitude would be required. A good pilot or autopilot could hold altitude and airspeed very well in good weather conditions. The major assumption was that steady wind, gusts, rising air, or sinking air would not significantly change the power required to maintain flight. The accuracy of this assumption depended on the actual weather conditions at the time of flight. It was simpler to neglect the weather conditions for the design analysis. The total energy required could be calculated by integrating the power coming out of the batteries over time. The power required from the batteries was different than the thrust power required for flight since battery power was lost as it was transferred through the propulsion system. In the context of the energy balance diagram, the phrases power required or energy required refer to the power and energy required from the batteries, not the thrust power or energy. The battery power required was calculated by multiplying the thrust power required by the efficiency of the propulsion system. The battery power required was plotted on the energy balance diagram (blue line in Figure 3.2). The total energy required was the area under the power required line. 24
40 Figure 3.2 Energy balance diagram: solar power available and power required 3.3 ENERGY BALANCE Once the total solar energy available and the total energy required were determined, the energy balance was evaluated to determine if perpetual solar endurance flight would be possible. Figure 3.3 shows the total solar energy available. This energy was divided into two parts. The part below the blue line was solar energy that was immediately consumed to keep the airplane flying (dark yellow area in Figure 3.3). The area above the blue line was excess solar energy that was not used for flight during the daytime (bright yellow area in Figure 3.3). Once the solar power curve dropped below the power required (where the black line intersects the blue line around 19:00), the batteries had to supply the missing power until the sun had risen high enough the next day to supply all the power required (where the black line intersects the blue line around 7:00). The total energy the batteries had to supply was the dark red area in Figure 3.4. If the excess solar energy (bright yellow area) was greater than the battery energy required (dark red 25

41 area), then there was enough excess solar energy to fully charge the batteries for night flight and perpetual solar endurance flight was possible. Figure 3.3 Energy balance diagram: solar energy consumed and excess solar energy Figure 3.4 Energy balance diagram: battery energy required 26
42 3.4 ALTITUDE ENERGY STORAGE Not all of the excess solar energy available could be used to charge the batteries. Once the batteries were fully charged, excess solar energy could not be added to the batteries. It was possible to design the airplane so the excess solar energy would exactly match the battery capacity, however, such a design would have been marginal. The actual excess solar energy for a flight could be less than expected due to clouds or landscape obscuring the sun, or higher than expected power consumption by the aircraft. If this occurred, the batteries would not be fully charged, which would result in unused battery weight being carried around all day and all night. Unused battery weight provided no benefits and increased the power required. To avoid carrying unused battery weight, it was better to design the plane to have more excess solar energy than the batteries could store. When the energy balance diagram was adjusted to show not all of the excess solar energy was used to charge the batteries, the bright yellow area was equal to the dark red area, which left a portion of the solar energy unused (Figure 3.5). Figure 3.5 Energy balance diagram: adjusted excess solar energy 27
43 Batteries are not the only way to store solar energy. Solar energy can also be stored as potential energy in the form of altitude. Unused solar energy can be converted to potential energy by using solar energy to climb to a higher altitude. The stored potential energy can later be released by descending to a lower altitude. An advantage of using altitude to store energy is that it doesn t add any weight to the airplane. However, this is not a very efficient way to store energy. Air density decreases as altitude increases, and an airplane has to fly faster in lower density air to produce the same amount of lift, which causes the power required to go up as the altitude increases. Despite this drawback, altitude energy storage is an easy way to make use of unused solar energy that would otherwise be wasted. The benefits of altitude energy storage are shown in Figure 3.6. Once the batteries were fully charged around 16:00, the plane would begin climbing using the excess solar power available (orange area). As the sun would move lower in the sky, the excess solar power would decrease and the plane would climb more slowly. When there was no more excess solar power available, the aircraft would level off briefly (around 18:00). As the sun continued to move lower in the sky, the solar power would no longer be sufficient to maintain altitude. Instead of using battery power to maintain altitude, the airplane would begin to descend slowly. The descent rate would increase as the sun moved toward the horizon. After sunset, the airplane would no longer use electrical power and would be in a pure glide. Once the plane reached the original cruise altitude, all of the energy stored as altitude would have been used. At this altitude the plane would have to use battery power to supply all of the power required to maintain altitude. In Figure 3.6, this occurred just after sunset (20:00). Altitude energy storage reduced the total battery capacity required. Comparing Figure 3.5 to Figure 3.6, the dark red area in Figure 3.5 was reduced by the size of the green area, which would reduce the total battery weight required. 28
44 To be conservative, the Photon design did not depend on altitude energy storage. The mission requirement to have 10% more battery capacity than required assumed no altitude energy storage was used. The other energy margin requirement was to have 10% more excess solar energy than required to charge the batteries. These were the battery and solar charging margins. Figure 3.6 Energy balance diagram with altitude energy storage 3.5 KEY ASSUMPTIONS The battery and solar charging margins seemed prudent as long as the energy balance analysis was fairly accurate. The accuracy of the analysis depended on these key assumptions: The solar panels remained parallel to the ground at all times Clear sky with no clouds Power for cruise remained constant The effect of temperature on the solar cell efficiency was neglected 29
45 4.0 DESIGN METHOD The design method for the Photon design was very similar to the design methods used for other aircraft. An initial design was proposed and then iterated through more and more detailed analysis and redesign until a design was found which satisfied the requirements. The main difference between the Photon design and other aircraft was the requirements for perpetual solar endurance flight were so demanding that a much better initial guess was needed. A flow chart of the design process is shown in Figure 4.1. The first step was the same as for any airplane design. Some assumptions were made about the aircraft parameters and then the design was analyzed to see if these parameter values could satisfy the mission requirements. For the Photon design, this first step was repeated many times so a Matlab script was created to speed up the process. The Matlab script performed the energy balance analysis for the design to see if it could meet the requirements (section 4.2). Initially, the author had no clue what parameter values could satisfy the requirements for perpetual solar endurance. This Matlab script was necessary to quickly test many different parameter values for feasibility. The script was used throughout the design process, even after the design had been finalized. The Matlab script was used to reevaluate the energy margins after minor adjustments were made to the final design parameters. Once some feasible parameter values had been found, the next step was to come up with a preliminary design. This preliminary design was analyzed to see if it could actually achieve the assumed parameter values. At this point in the design process only rough estimates were calculated. If the preliminary design could achieve the assumed parameter values, the preliminary design advanced to the detail design step. If the preliminary design did not achieve 30
46 the assumed parameter values but was close, an attempt was made to improve the design. If the preliminary design was not close to achieving the assumed parameter values, the design had to start all over from the beginning with different assumed parameter values. The detail design step required a much more complete design than the preliminary design step. In the detail design step, the aircraft was modeled in detail using computer aided design (CAD) software. All the details of the design had to be considered, from the propeller design to the thickness of the wing ribs. The design was analyzed again to see if the assumed parameter values had been satisfied, but this time the analysis was much more thorough for better accuracy. If the parameter values were not met but were close, the design was refined. In the detail design analysis, the parameter values had to match much more closely than for the preliminary design analysis. If the design could not match the initial assumed parameter values, then the process had to start over from the beginning again with different parameter value assumptions. Once the detail design achieved the assumed parameter values, the design was finalized. Further redesign iterations could have improved the design, but the gains from the redesign would have been smaller. Once the requirements were satisfied, the design was capable of perpetual solar endurance flight, so no further design was needed. 31

47 Figure 4.1 Design process flow chart 4.1 ANALYSIS TOOLS A number of analysis tools were used in the design process. The CAD software, CATIA, was used to model the detailed design of the Photon. The detailed CATIA model was used to determine component weights, total aircraft inertias, and the location of the center of gravity. Several programs developed by Mark Drela were used extensively to design the Photon. Two dimensional airfoil analysis was performed with XFOIL [14]. XFOIL was used for several applications besides analyzing airfoils. XFOIL was used to estimate the profile drag of the wing, and to estimate the potential drag increase if the solar panels tripped the boundary layer on the 32
48 top of the wing (section 15.1). XFOIL was also used to estimate the fuselage drag, and to analyze the propeller airfoil. QMIL was used to design the propeller, and QPROP [13] was used to analyze the combined motor and propeller performance. The vortex lattice code, AVL [12] was used to estimate the 3-D flow around the plane. AVL was used to obtain the wing lift distribution for calculating induced drag and structural loads. AVL also performed the stability and control analysis for the Photon design. Matlab was used throughout the design process to speed up and automate calculations that were repeated many times. 4.2 ENERGYBALANCE.M MATLAB SCRIPT Energybalance.m was the Matlab script that was written to check the feasibility of perpetual solar endurance flight. The script was used and improved throughout the design process and it may be the most useful result from the project. How the script was used will be explained, since the script is a good starting point for any future designers pursuing perpetual solar endurance flight. The script can be found in Appendix I. Before reviewing the script, it is useful to be familiar with the energy balance analysis from chapter 3.0. The script assumed the gross weight of the airplane was already known, since the Photon design had a fixed maximum weight of 5 kg. Instead of specifying the weight of the aircraft structure, the airframe weight was used as a figure of merit to evaluate the design. The required weight of the batteries and solar panels could be determined from the energy balance analysis. Subtracting the battery and solar panel weight from the 5 kg gross weight gave the weight available for everything else including the airframe structure. This was done partly because the author did not have the experience to know what a viable airframe weight would be for this type of aircraft. The airframe weight was considered a figure of merit for comparing designs. Designs with weight available for the airframe were considered better designs. 33
49 The other important criteria used evaluate designs were the energy margins. The energy balance calculations determined the margin of extra battery capacity and the margin of extra solar energy for charging the batteries. Designs with larger margins were better designs. If either of these margins were negative, perpetual solar endurance flight was not possible. The main purpose of the script was to determine what combination of input parameters could produce a feasible design. The primary input parameters were the aircraft gross weight, the wing area, the cruise lift coefficient, the cruise lift to drag ratio, the efficiency of the propulsion system components, the solar panel properties, the battery properties, and the solar irradiation parameters. For the Photon design, FAI rules largely determined the aircraft weight and the wing area values. The selection of the solar panels, the batteries, and the date and location of the flight largely determined the rest of the input values. The three critical values determined by the design were the total propulsion system efficiency, the weight of the airframe, and the cruise lift to drag ratio. The solar panels and batteries had to be selected before these three critical design parameter values could be determined for the Photon design. 4.3 SOLAR PANEL AND BATTERY SELECTION The type of solar conversion technology and the energy storage technology were selected early in the project (section 1.3). This section describes the specific commercial products that were selected for the Photon design. SOLAR PANELS The solar panels selected for the Photon design were Sunpower A-300 photovoltaic solar panels [46]. These were the same type of solar panels that were used on the Solong solar powered airplane. The Sunpower panels were more efficient than most silicon based solar 34

50 panels. The 21.5% efficiency of the A-300 panels was significantly better than typical silicon solar panels with efficiencies around 15%. There were other panels with better power to weight ratios, such as the RWE-S-32 panels used on Sky-Sailor [27], but the A-300 panels were much less expensive since they were mass produced for residential and commercial rooftop installations. An example of the A-300 solar panel is shown in Figure 4.2. The corners were rounded because the panels were cut from cylindrical silicon crystals. This manufacturing method reduced the amount of silicon wasted to produce each panel, which helped to reduce the cost of each panel. However, the rounded corners decreased the total power a given surface area could produce since the corner gaps produce no electricity. The corner gaps were not a big problem for rooftop installations, but the gaps were significant for solar airplane designs because of the limited surface area available for solar panels. Some of the lost area was offset by the placement of all the wiring connections on the back side of the A-300 panels, which kept the entire front side unobstructed. The properties of the A-300 panels are listed in Table 4-1. Figure 4.2 Sunpower A-300 photovoltaic panels Source: 35
51 Table 4-1 Sunpower A-300 cell specifications Parameter SI Units Imperial Units Length and Width 12.5 x 12.5 cm 5 x 5 in Thickness 0.3 mm 0.01 in Surface Area 150 cm 2 23 in 2 Cell Weight 11 g 0.4 oz Efficiency 21.5% BATTERIES The batteries were the most critical technology for perpetual solar endurance flight, since the batteries accounted for most of the gross weight of the aircraft. The energy density of the batteries was the most important parameter for the Photon design. The lithium-ion battery with the highest energy density at the time was selected from among the commercially produced batteries that were available. Initially, these were the Panasonic NCR18650A batteries [35]. After the Photon design had been completed, Panasonic came out with a newer version of the battery, the NCR18650B, which had a higher energy density [36]. The newer NCR18650B batteries had an energy density of 265 W h/kg, which was 10% higher than the older NCR18650A batteries. Since energy density was so important, the newer NCR18650B batteries replaced the older NCR18650A batteries in the Photon design. The newer batteries could store more energy, so more solar panels were required to fully charge the batteries. However, the wing design had already been finalized and there wasn t room to add more solar panels. Instead, the improved energy density of the new batteries was used to reduce the number of batteries required. This made weight available that could be used to allow for manufacturing errors, to carry extra battery capacity, or to reduce the gross weight of the airplane, which would also reduce the power required. 36

52 A disadvantage of lithium-ion batteries was that they could catch on fire easily if they were overcharged. The NCR18650B batteries were designed to be used in laptops, so they did not have a built in overcharging protection. Either protection circuits would have to be added to each battery, or the maximum power point tracker (MPPT) that charged the batteries would have to be designed to avoid overcharging the batteries. Figure 4.3 Panasonic NCR18650B lithium-ion batteries Source: Table 4-2 Panasonic NCR18650B battery specifications Parameter SI Units Imperial Units Diameter 1.83 cm 0.75 inches Length 6.5 cm 2.5 inches Weight 45 g 1.59 oz Nominal Voltage 3.6 volts Fully Charged Voltage 4.3 volts Fully Discharged Voltage 2.5 volts Amp Hours Capacity 3400 mah Energy Capacity 12.2 W h Energy Density 265 W h/kg 37
53 PHOTON SOLAR ARRAYS AND BATTERIES A total of 48 A-300 panels were used for the Photon design to provide enough solar power to charge the batteries. The panels covered 54% of the top surface of the wing for a total solar array area of 0.72 m 2. The NCR18650B batteries were small so 43 of them were required for the Photon design. For other electric propulsion system designs, the maximum discharge rate of the batteries would be important because the discharge rate would limit the maximum power output of the propulsion system. Since the Photon design had to use many batteries in parallel, each battery discharged slowly so maximum discharge rate was not a concern. Table 4-3 Photon solar cells and batteries Parameter SI Units Imperial Units Total Number of A-300 Cells 48 Total Solar Array Surface Area 0.72 m ft 2 Wing Area Covered by Solar Cells 54% Number of NCR18650B Batteries CRITICAL DESIGN PARAMETERS The properties of the A-300 solar panels and the NCR18650B batteries were input into the energybalance.m Matlab script described previously (section 4.2). The script showed the Photon design would have to achieve the following critical design values to be capable of perpetual solar endurance flight. The total propulsion system efficiency would have to be at least 55%, the airframe could not weigh more than 1.5 kg, and the total airplane lift to drag ratio would have to be at least 22 (Table 4-4). These were very challenging requirements and they were the design targets that guided the rest of the design process. Table 4-4 Critical design parameters Critical Design Parameter Requirement propulsion 55% W airframe 1.5 kg L/D 22 38
54 5.0 SIZING An important early step of the design process was to determine the size of the wing and the power output of the propulsion system. Traditionally, these two values would be determined by a matching graph, which would plot the wing size and power constraints for various performance requirements such as takeoff distance, climb angle, and top speed. The only firm requirement for the Photon design was to achieve perpetual solar endurance flight, so there were not enough requirements to constrain the matching graph. The Photon design was constrained by other requirements, such as the placement of solar panels on the wing and the weight of the propulsion system. The Photon design was also limited by FAI rules for model airplane records. Ultimately, these other constraints were what sized the wing and the propulsion system, so a matching graph was not constructed. 5.1 WING SIZING Solar powered airplanes tend to have very large wings. One reason large wings are favored is that they provide more surface area to mount solar panels. However, the main reason large wings are common is because they allow solar powered airplanes to fly slower, which reduces the power required for level flight. Structural limitations usually determine how large the wings can be. The Photon design, however, had a different limitation. The FAI rules for model airplane records [17] limited the total projected area of the wing and horizontal stabilizer combined to 1.5 m 2. Given this constraint, the wing and horizontal stabilizer for the Photon were carefully designed together so the wing could be as large as possible without violating the rules. The final wing area was 1.34 m 2. The weight of the Photon design was fixed at 5 kg, so the wing loading was 3.7 kg/m 2. In imperial units, the wing loading was about 0.75 lb/ft 2, which was about one seventeenth of the 13.2 lb/ft 2 wing loading for a Cessna 172 [8]. Even though the wing 39
55 area for the Photon design was limited by FAI rules, it still had a very low wing loading compared to most airplanes. There was another important consideration for a small solar powered airplane that limited the maximum wing area. A very low wing loading would allow the plane to fly very slowly, but the low flight speed would make the plane more susceptible to wind conditions. Since the Photon design would have to fly for multiple days, a design which required perfectly calm wind conditions would have fewer chances to demonstrate perpetual solar endurance flight. Although it was not practical to design a solar powered plane to handle strong winds, the design should at least be able to handle moderate winds that would be likely to occur on a summer day. The Photon design used Morgan Hill, California as the reference location for the design. Wind data for Morgan Hill during the summer was found (Appendix B). Based on this data, the strongest wind the Photon would need to handle would be a 15 knot wind. If a steady wind speed higher than the cruise speed of the Photon design was encountered, the airplane would either have to use more power to overcome the wind, or the plane would drift downwind. Since the energy margins were already very low, an increase in power even for a short period would most likely prevent the Photon design from achieving perpetual solar endurance flight. If the airplane was allowed to drift downwind, it could require a very large area for drifting. The size of the area would depend on the wind speed and how long the wind remained above the cruise speed of the airplane. To avoid both of these problems, the Photon was designed to cruise at a speed greater than the highest wind speed likely to be encountered. A cruise speed of 7.7 m/s (15 knots) or more should satisfy this requirement for Morgan Hill, California. The wing loading required to satisfy this requirement is shown below. The cruise lift coefficient for the Photon design was 0.7, which is explained in section
56 (5.1) (5.2) The FAI rules had already set the wing size for the Photon design to a wing loading of 3.7 kg/m 2. This wing loading exceeded the 2.45 kg/m 2 wing loading required to overcome a 15 knot headwind, so the wing size did not have to be changed. The Photon design would easily cruise faster than 7.7 m/s. The FAI rule was the critical requirement that sized the Photon wing. 5.2 POWER SIZING The power sizing for the Photon design was a tradeoff between climb rate and motor weight. A more powerful motor would allow the aircraft to climb faster, but it would also weigh more. A larger, more powerful motor could be more efficient, but it would have to operate at higher voltages. The only mission requirement that applied to the power sizing was the climb rate requirement of 300 ft/min. The rate of climb was given by Eq. (5.3), which could be expressed in terms of the power to weight ratio in Eq. (5.4). Except for the motor power, the parameters for this equation had already been determined from the energy balance analysis (section 4.1). The power to weight ratio required for the Photon design to climb at 1.5 m/s (300 ft/min) was 3.8 W/kg. This was equivalent to hp/lb, which was about one third of the power to weight ratio for a Cessna 172 [8]. The climb rate was also about one third of the climb rate for the Cessna 172. This showed that climb rate mostly depended on the power to weight 41
57 ratio, and that the power sizing for the Photon design was reasonable. To achieve the 3.8 W/kg power to weight ratio, the motor had to be capable of producing at least 187 watts. (5.3) (5.4) The AXI 2217/20 motor that was selected for the Photon design (see section 11.3 for more details) could produce as much as 259 watts (14.4 volts x 18 amps for 60 seconds), which satisfied the power sizing requirement. However, the power sizing analysis assumed the propeller efficiency for climbing was the same as for cruising, which was later found to be incorrect. The propeller blades would stall under climb power, which would dramatically lower the propeller efficiency. The actual climb rate did not meet the mission requirement. This is described in more detail in section
58 6.0 CONFIGURATION DESIGN The overall configuration design determined most of the performance of the airplane. Perpetual solar endurance flight was such a demanding mission requirement that only a very good design could meet the requirements. The design configuration had to be changed several times before a configuration was found that could meet the requirements. This chapter will explain how the final design configuration was determined and describe some of the other configurations that were considered. Chapters 7, 8, and 9 will describe in more detail how the fuselage, wing, and empennage were designed. 6.1 DESIGN DRIVERS The primary design driver was to minimize the power required for level flight. This implied the configuration design had to minimize drag and allow the propulsion system to operate at a high efficiency. In addition, the configuration design had to provide adequate surface area to mount solar panels and adequate payload volume to carry the batteries. Since the mission for the Photon design required it to fly for a long time, the configuration design had to make sure the airplane would be easy to control and reliable. 6.2 PROPULSION CONFIGURATION Large solar powered airplanes, such as Helios, have used multiple small motors and propellers distributed over a large wingspan instead of a single large motor and propeller. An advantage of electric propulsion is that it can more easily distribute power to multiple motors. Multiple motors provide redundancy, and allow thrust to be distributed more evenly for an airplane with a very large wingspan. However, multiple motors use smaller diameter propellers than a single motor would use, and smaller diameter propellers are less efficient than larger 43
59 diameter propellers. The propeller efficiency penalty is small for a very large airplane, since a 3 meter diameter propeller won t be much more efficient than a 2 meter diameter propeller. For a small airplane like the Photon, the propeller efficiency penalty was much larger since a 60 cm diameter propeller would be much more efficient than a 40 cm diameter propeller. For this reason, the propulsion configuration for the Photon design used a single motor and propeller. The other consideration for the propulsion configuration was whether to use a tractor or a pusher propeller. The Photon did not have any payload that would influence the propeller placement, so the only requirement was to maximize propeller efficiency. A pusher propeller configuration might be more efficient than a traditional tractor configuration if the design accounted for the effect of the aircraft body on the air flowing into the propeller. The QPROP program that was used to design the Photon s propeller could not account for this effect, which left the tractor configuration as the best choice for the Photon design for high propeller efficiency. 6.3 FUSELAGE CONFIGURATION Since no passengers or other payloads would be carried by the aircraft, the fuselage only had to be large enough carry the batteries, propulsion system, and electronics. Some airplane designs have used twin fuselages or twin tailbooms to reduce the weight of the airframe. In general, moving weight farther out on the wings relieves the bending load and allows the structure to be lighter. However, neither twin fuselages nor twin tailbooms would have been beneficial for the Photon design. A twin fuselage configuration would have more surface area than a single fuselage, which would have resulted in more skin friction drag. Since the Photon design only had a single propeller, a separate pylon would have been required to mount the propeller on the centerline of the aircraft, which would have added more drag and weight. The 44
60 twin tailboom configuration would not have reduced the structural weight significantly if the batteries were carried in the fuselage. The batteries accounted for half of the total aircraft weight, so very little weight would have been carried by the twin booms. Any structural weight savings from reducing the wing bending moment would have been very small and offset by the weight of the second tailboom. Since the twin fuselage and twin tailbooms were not beneficial for the Photon design, a traditional configuration was selected. The Photon design used a centerline fuselage and a single tailboom to connect the empennage. 6.4 WING CONFIGURATION The wing configuration was very important for the Photon design. The wing was the source of most of the total drag for the airplane, so it was important to select a wing configuration for low drag. Another important design driver was the need to fit enough solar panels on the wing. The wing configuration was also important for the lateral stability and control of the Photon. The wing configuration was influenced by the decision to eliminate ailerons from the Photon design. The lack of ailerons required the Photon wing to have a lot of dihedral so the roll angle could be controlled with the rudder. The ailerons were eliminated from the Photon design because of several small advantages that added up to a significant improvement for the Photon design. Removing the ailerons from the wing made more wing area available to mount solar panels. Some weight was saved because the wing structure did not have to be divided into multiple surfaces, and the aileron servos and the wiring for them were removed from the wing. Drag was reduced since there were no aileron hinge gaps. The ailerons would have upset the elliptical lift distribution of the wing when they were deflected, which would have increased the induced drag of the wing. Removing the ailerons also made the Photon design simpler and more 45
61 reliable since there were two fewer servos that could fail. The large wing dihedral angle required to control roll without ailerons made the Photon spirally stable. This was beneficial, since the airplane would tend to circle in place if the radio control link with the airplane was ever lost. The disadvantage of eliminating the ailerons was that yaw and roll could no longer be controlled independently. Instead of using ailerons, roll would be controlled by rudder deflection combined with a lot of wing dihedral. Rudder deflection would yaw the airplane and initiate a sideslip. The large wing dihedral angle would cause the airplane to roll when it experienced a sideslip. Since the rudder would control both the yaw angle and the roll angle, it would not be possible to change one angle without affecting the other. In calm air, the combined yaw and roll control would not be a problem since turning would require both yaw and roll anyway. However, if a wind gust were to upset the roll angle, the roll angle could not be corrected without also yawing the airplane. The combined yaw and roll control also made it impossible to deliberately cross control the aircraft, which would be required for crosswind landings. Since these situations should occur rarely and may not even be encountered on a perpetual solar endurance flight, the linked yaw and roll control was acceptable for the Photon design. Polyhedral was used to achieve the required large effective dihedral angle for the Photon wing since polyhedral was more effective than simple dihedral and had other benefits. A wing with polyhedral has multiple angle breaks in the wings instead of a single break at the wing root for simple dihedral. Polyhedral is more effective because it uses the outer portions of the wing to achieve most of the dihedral. The outer portions of the wing are more effective for rolling the airplane since they have a longer moment arm. Ideally, the wing would have continuous curvature that increased near the wingtips. This could be approximated by breaking the wing into many segments and using many polyhedral breaks, but this would add complexity and would 46
62 make it difficult to place solar panels on the wing segments. The Photon wing originally had only three wing segments for simplicity, but three segments were not enough to achieve all the requirements of the wing design. Adding a fourth wing segment (Figure 6.1) resolved the problems of the three segment wing. However, another requirement added in the middle of the design process caused an additional wing segment to be added. A spoiler was added to the Photon design once it was realized that the spoiler would be an essential feature for the design. Originally, a spoiler was considered undesirable since it would add complexity, weight, drag, and reduce reliability since it would be another component that could fail. However, later in the design process it became apparent the Photon design would have difficulty descending or landing without a spoiler due to the high lift to drag ratio for the design. A single spoiler was preferred for simplicity and reliability even though multiple spoilers could have provided more roll control. The single spoiler had to be in the center of the wing, so a fifth wing segment was added to make the center of the wing straight without any dihedral to interfere with the straight spoiler. The last change to the wing configuration was to add taper to the wing. A straight wing without taper was used well into the detail design process since it was easier to fit solar panels on the untapered wing (Figure 6.2). The untapered wing design almost met the requirements, but the drag was slightly too high and the wing weighed too much. Tapering the wing solved these problems, but 4 solar panels had to be cut in half to fit on the tapered wing. The final wing configuration with five wing segments, polyhedral, and taper was a very good solution to the physics which constrained the wing design. Polyhedral and taper shifted lift toward the center of the wing. Polyhedral increased lift in the center of the wing and decreased 47
63 lift at the wingtips by making the wing center more level and the wingtips more inclined compared to a wing with simple dihedral. Taper shifted lift to the center of the wing by moving wing area from the tips of the wings to the center. Shifting lift to the center of the wing was beneficial because it made the lift distribution elliptical which reduced the induced drag. The wing spar weight was also reduced since redistributing lift to the center of the wing decreased the wing bending moment. Taper also reduced the structural weight of the wing because it made the wing thicker at the root, and a small increase in wing spar thickness dramatically increased the stiffness of the wing spar. The weight of the wingtips was also reduced since taper made them thinner. This was appropriate since the loads were lowest at the wingtips. The redistribution of wing mass also helped to reduce the roll and yaw inertia of the plane, which allowed the empennage to be smaller. The profile drag of the wing was reduced with taper because most of the wing area operated at a higher Reynolds number than an untapered wing. Wing taper enhanced the benefits of polyhedral, so a large amount of taper was used for the Photon wing. 6.5 EMPENNAGE CONFIGURATION Both Solong and Sky-Sailor had V-tail configurations. A V-tail configuration for the Photon design would keep the empennage surfaces away from the ground, which was important for belly landings. The V-tail configuration was commonly believed to reduce drag because the total empennage surface area based on the projected area sizing method for V-tails was smaller than a traditional empennage configuration. However, the projected area sizing method did not take into account the reduced angle of attack changes the V-tail would experience. For a horizontal surface, a 1 change in the pitch angle of the aircraft would also result in a 1 change in the horizontal surface. For a surface with 60 of dihedral, a 1 change in aircraft pitch angle would produce only 0.5 of change in angle of attack for the inclined surface. For a surface with 48
64 90 of dihedral, the aircraft pitch angle would have no effect on the angle of attack of the surface. To compensate for the reduced angle of attack change, the V-tail surfaces would have to be larger than the size calculated by the projected area method. A properly designed V-tail would have about the same surface area as a traditional empennage, so the drag would be about the same for both configurations. The initial empennage configuration for the Photon design assumed a V-tail design would be used (Figure 6.1). Once the tail sizing requirements had been estimated, it was discovered the vertical stabilizer area would need to be much larger than the horizontal stabilizer area. The wing had a low pitching moment, which only required a small horizontal stabilizer. The large wingspan and lack of ailerons required a large vertical stabilizer. For a V-tail configuration, this meant the two V-tail surfaces would be closer to vertical than horizontal and the gap between them would be smaller than usual. The unusually close V-tail surfaces could interfere with each other. This could increase the drag and could even reduce stability or control. The V-tail configuration also produced larger torque loads on the tailboom than a traditional configuration, which required a heavier tailboom. For these reasons, the V-tail configuration was abandoned. After determining the V-tail configuration was not suitable for the Photon design, a solution was found on the Daedalus human powered aircraft design [42]. The Daedalus empennage design separated the horizontal and vertical stabilizers. The horizontal stabilizer was mounted on a V-mount above the tailboom. The vertical stabilizer was behind the horizontal stabilizer, mounted to the end of the tailboom. This was an elegant solution to the design problems presented by different horizontal and vertical stabilizer size requirements. By placing the vertical stabilizer behind the horizontal stabilizer, the vertical stabilizer had a longer moment arm which allowed the vertical stabilizer to be smaller yet more effective. Separating the 49


65 horizontal stabilizer from the vertical and attaching it to the tailboom with the V-mount allowed the horizontal stabilizer to be a single surface that could pivot about the V-mount for pitch control. This single surface all moving horizontal stabilizer weighed less and provided more control authority than a separate elevator surface. The V-mount kept the horizontal stabilizer out of the thick boundary layer of the tailboom, and provided some ground clearance for belly landings. A portion of the vertical stabilizer extended below the tailboom, which greatly reduced the torque loads on the tailboom (section 12.4), and increased the ground clearance of the horizontal stabilizer. The Daedalus empennage configuration was adopted for the Photon design (Figure 6.2). Figure 6.1 Early configuration Figure 6.2 Intermediate configuration 50
66 6.6 FINAL CONFIGURATION DESIGN The final configuration incorporated all of the lessons learned from the previous configurations. The final configuration featured a five segment wing with polyhedral and taper. The wing had a single spoiler in the center and no ailerons. A single motor and propeller were attached to the front of the fuselage to pull the airplane through the air. The fuselage carried all the batteries and absorbed the landing loads since there was no landing gear. A single tailboom connected the empennage to the back of the fuselage. The horizontal stabilizer and vertical stabilizer were separated to make the surfaces more effective and to reduce weight. The final configuration resembled the Bubble Dancer remote control glider design by Mark Drela [22]. The Photon and Bubble Dancer configurations were driven by similar requirements to minimize weight and drag while operating at low Reynolds numbers. Both designs used a single spoiler and no ailerons. The final configuration was a very good solution to these requirements. Figure 6.3 Final design 4-view drawing with dimensions (solar panels and covering removed to show structure on left half of airplane) 51

67 Figure 6.4 Final design with spoiler stowed Figure 6.5 Final design with spoiler deployed 52
68 7.0 FUSELAGE DESIGN The primary function of the fuselage was to carry the batteries. The fuselage was 1.05 m (3 ft 5 in.) long and 10.0 cm (4 in.) in diameter (Figure 7.1). The diameter was large enough to fit 10 NCR18650B batteries packed in a pyramid shape. The battery pack was the largest item that had to fit inside the fuselage. There were 5 battery packs which were placed one behind another inside the fuselage (Figure 7.2). The propulsion system components were mounted in the front of the fuselage and the electronics were placed behind the batteries toward the rear of the fuselage. The tailboom connected to the back of the fuselage. The fuselage was longer than necessary so the battery packs could be shifted forward or backward to adjust the center of gravity. The extra drag caused by the oversized fuselage was necessary to make sure the aircraft would be stable even if the weight and balance estimations were off. Once the weight and balance had been verified by constructing a prototype, the design could be improved by redesigning the fuselage to be smaller. The wing was attached to the fuselage by a pylon integrated into the top of the fuselage (Figure 7.3). The pylon mount reduced the interference drag between the wing and fuselage and kept the fuselage open for payload placement. The disadvantage of this design was that most of the fuselage was not accessible from above. Three access hatches were placed along the left side of the fuselage to provide access to the batteries and electronics even when the wing was attached. A fourth access hatch was placed on the top front of the fuselage where there was no conflict with the pylon. The fuselage was designed to be made of woven Kevlar and carbon fiber. This composite material would be flexible enough to conform to the fuselage shape, yet strong enough to act as a 53
69 contact surface for belly landings. The fuselage would have a foam floor to make it easier to mount components inside. A more optimized fuselage design would probably store most or all of the batteries in the wing to reduce drag. Such as design would require more integration and would make it more difficult to access the batteries. However, such poor access was not appropriate for an initial proof of concept prototype aircraft, so the Photon design used a large fuselage. Once the design and systems have been proven, an improved design should be able to make the fuselage much smaller. Figure 7.1 Fuselage drawing with dimensions 54


70 Figure 7.2 Fuselage cutaway view with internal components displayed Figure 7.3 Closed fuselage rendering 55
71 8.0 WING PLANFORM DESIGN More time was spent on the design of the Photon wing than any other part of the design. The wing design had to satisfy many conflicting requirements including drag, weight, stability, airfoil, solar panel, and FAI requirements. The wing went through many design iterations and the wing configuration changed several times, which was described in section 6.4. The wing planform, wing airfoil, and horizontal stabilizer all had to be designed together because FAI rules limited the area of the wing and horizontal stabilizer combined to 1.5 m 2 [17]. The final wing airfoil had a low pitching moment (section 10.1), which allowed the horizontal stabilizer to be small (section 9.1) and the wing area to be 1.34 m 2. The wingspan was 4.25 m, which resulted in an aspect ratio of If there had not been other considerations, a larger aspect ratio would have been preferred since it would have reduced the induced drag. However, a larger aspect ratio wing would operate at a lower Reynolds number, which would increase the profile drag and offset some of the induced drag improvement. A larger aspect ratio wing would have been more flexible and would have required more structural weight. The main reason a larger aspect ratio was not used was because it would have been difficult to fit enough solar panels on the larger aspect ratio wing. The solar panels could not be mounted near the leading edge since the solar panels could not bend around the leading edge without breaking. A larger aspect ratio would have given the wing more leading edge area and made less area available for the solar panels. The wing required a lot of polyhedral since there were no ailerons (section 6.4). The center wing segment had to be flat for the spoiler. The middle wing segments were longer and flatter than ideal to fit more solar panels. The middle wing segments were inclined only 9 to keep the solar panels closer to horizontal. To compensate for the long and flatter middle wing 56
72 segments, the wingtip segments had to be inclined 31. This wing geometry (Figure 8.4) resulted in an effective dihedral angle of 12. The effective dihedral angle was the equivalent dihedral angle a straight wing with simple dihedral would have. The wing sweep angle was zero since the aircraft would not experience any meaningful compressibility drag. The wing was mounted at a 2 incidence angle for low cruise drag. AVL analysis showed this incidence angle would place the fuselage at a slight angle of attack during cruise, allowing it to contribute slightly to the overall wing lift and improve the lift distribution. As described in the wing configuration section (section 6.4), tapering the wing provided many advantages. Tapering the wing allowed the aspect ratio to be increased slightly, which reduced the induced drag a little. Wing taper also reduced weight, drag, and inertia, so a large amount of taper was used. The final wing design had a taper ratio of 0.34, which meant the wing root chord length was about three times longer than the wingtip chord length. Since the local Reynolds number was proportional to the local chord length, the Reynolds number at the wingtip was one third of the Reynolds number at the wing root. A 10% thick airfoil was used for most of the wing, but the airfoil thickness had to decrease to 8.2% at the wingtip due to the lower Reynolds number at the wingtip. A disadvantage of the large taper ratio was that it tended to promote wingtip stall. This can be seen in Figure 8.1, where the red dashed line shows the local lift coefficient. The local lift coefficient was greatest about 1.5 m from the fuselage centerline, which was the portion of the wing that would stall first and likely cause the wing to drop on one side. This problem was solved by adding 1.5 of washout to the middle wing segments. Figure 8.2 shows the maximum local lift coefficient moved in to about 0.5 m from the fuselage centerline after the washout was added. The AVL analysis also showed the wing lift distribution would be elliptic, which was ideal for reducing the induced drag of the wing. 57
73 Figure 8.1 Trefftz plot without wing twist Figure 8.2 Trefftz plot with 1.5 washout 58

74 The wing planform had to be designed with the solar panels in mind. Figure 8.3 shows how the solar panels were positioned on top of the wing. There were a total of 48 solar panels which covered 54% of the wing area. Although it seemed like there should have been another 46% of the wing available for solar panels, this was not true because the solar panels could not be placed on the leading edge or over the spoiler. A significant amount of area was also unavailable due to the rounded solar panel corners. Four of the solar panels had to be cut in half to fit on the tapered wing. More solar panels might fit on the wing, but they would have to connect to one of the three solar arrays. The 48 panels were arranged into three arrays, which are shown in Figure 8.3. The arrays were significant because the maximum output of each array could only be as great as the minimum output of any panel in the array. It was best if all the panels in an array faced the same direction and none were shaded by other parts of the airplane. This was true for the center array, but not for the side arrays. The side arrays each had two panels mounted on the tip wing segments, and the tip wing segments were significantly more inclined than the middle wing segments. This was the only solution that was found to fit all of the solar panels onto the wing. Flight testing would show whether the two panels on the wingtip were worth the trouble. If they reduce more solar power than they add, they will be removed and the solar arrays will have to be redesigned with fewer panels. Figure 8.3 Wing top view with solar arrays marked 59
75 Table 8-1 Wing planform parameters Parameter Symbol SI Units Imperial Units Wing Area S 1.34 m ft 2 Wing Span b 4.25 m 13 ft 11 in Mean Chord c m 1 ft Mean Aerodynamic Chord MAC m 1 ft 1 in Aspect Ratio AR 13.6 Thickness Ratio at Root (t/c) r 10.0% Thickness Ratio at Tip (t/c) t 8.2% Total Taper Ratio 0.34 Inner Dihedral 9 Outer Dihedral 31 Total Effective Dihedral 12 Sweep Angle (¼ Chord) 0 Incidence Angle i w 2 Twist (mid panel only) 1.5 washout Figure 8.4 Wing top and front view drawing with dimensions 60


76 9.0 EMPENNAGE DESIGN As described in section 6.5, the empennage evolved from a V-tail configuration into the final configuration which separated the horizontal and vertical stabilizers. This final configuration allowed the empennage to be smaller and lighter. The details of the empennage design were a result of tradeoffs between stability, structural weight, and drag. The design of the empennage used AVL extensively to evaluate the stability, control, and induced drag of potential designs. The tailboom structure required for potential designs was analyzed using Matlab scripts (sections 12.3 and 12.4). Figure 9.1 Isometric view of the empennage configuration Figure 9.2 Side view of the empennage configuration 61
77 9.1 HORIZONTAL STABILIZER The horizontal stabilizer on an airplane is required for pitch stability and control, but the horizontal stabilizer also adds drag without providing meaningful lift to the airplane. The challenge when designing a horizontal stabilizer is to make it as small as possible while still providing adequate stability and control. This challenge was even more important for the Photon design since it had to satisfy FAI rules. The FAI rules limited the maximum area for the wing and horizontal stabilizer combined to 1.5 m 2 [17], so the larger the horizontal stabilizer was, the smaller the wing had to be. This required the horizontal stabilizer and the wing for the Photon to be designed together. It took several design iterations to get the wing as large as possible and the horizontal stabilizer just large enough for adequate stability and control within the FAI rules. The size of the horizontal stabilizer depended on the length of the tailboom, and the length of the tailboom depended on structural considerations. Once the tailboom length was established, the horizontal stabilizer was placed just in front of the vertical stabilizer. This location put the horizontal stabilizer about four mean aerodynamic chord lengths behind the wing. The horizontal stabilizer had a longer moment arm than usual for most airplanes, which allowed the size of the stabilizer to be smaller than usual. The final horizontal stabilizer design was one tenth of the size of the wing. The tail volume coefficient for the horizontal stabilizer was 0.40, which was within the normal range for most airplanes but slightly on the small side. The stability analysis showed this was sufficient for stability (chapter 14.0). The horizontal stabilizer was sized appropriately small, but not too small. Part of the reason the horizontal stabilizer could be small was because of the careful wing design. The wing used an airfoil with a low pitching moment, so the horizontal stabilizer did not have to provide much force to trim the airplane. In fact, the center of gravity was positioned so 62
78 the horizontal stabilizer would have no load in the trimmed cruise condition. This reduced the overall drag for the Photon since the wing did not have to produce more lift to offset downforce from the tail, and the tail did not produce induced drag. The horizontal stabilizer only had to deflect by 0.3 to trim the airplane for the design cruise condition (Figure 8.2). Even though the horizontal stabilizer usually would not produce much lift, it was still designed to reduce induced drag. The horizontal stabilizer had a relatively high aspect ratio of 6, which helped make it more effective and reduced the induced drag. AVL analysis showed a taper ratio of 0.5 would also help to reduce the induced drag. The taper also allowed the structure to be lighter and stronger. Instead of a separate elevator surface, pitch control for the Photon design was achieved by pivoting the entire horizontal stabilizer. The all moving horizontal stabilizer had several advantages over an elevator. The control surface was larger, which provided more pitch control authority. This compensated for the slightly small horizontal stabilizer size. An elevator would have required a hinge gap which would have added drag. An elevator also would have divided the horizontal stabilizer into two surfaces which would have weighed more than the single all moving surface. Table 9-1 Horizontal stabilizer parameters Parameter Symbol SI Units Imperial Units Horizontal Stabilizer Area S h m ft 2 Horizontal Stabilizer Moment Arm x h m 4 ft 4 in Horizontal Stabilizer Volume Coefficient V h 0.40 Horizontal Stabilizer Span b h 0.9 m 3 ft Horizontal Stabilizer Mean Chord c h 0.15 m 0 ft 6 in Horizontal Stabilizer Aspect Ratio AR h 6 Horizontal Stabilizer Taper Ratio h 0.5 Horizontal Stabilizer Dihedral h 0 Horizontal Stabilizer Sweep Angle h 0 Horizontal Stabilizer Incidence Angle i h N/A 63
79 Figure 9.3 Horizontal stabilizer drawing with dimensions 9.2 VERTICAL STABILIZER The goal of the vertical stabilizer design was to make it as small as possible while providing adequate stability and control, much like the design of the horizontal stabilizer. Since the wing had no ailerons, the vertical stabilizer also had to provide adequate roll control authority. The design of the vertical stabilizer depended on the length of the tailboom even more than the horizontal stabilizer, since yaw damping depended on to the square of the moment arm. The length of the tailboom was limited by the amount of structural deflection at the end of the tailboom under critical loads. The deflection was a highly nonlinear function of the tailboom length. The deflection would increase exponentially for longer tailboom lengths. The structural weight required to offset the deflection also increased exponentially for long tailboom lengths, so the only practical solution was to limit the length of the tailboom. Once the tailboom length was set, the vertical stabilizer size ended up being about the same as the horizontal stabilizer, although the vertical stabilizer had a longer moment arm than the horizontal stabilizer. The tail volume coefficient for the vertical stabilizer was This was intentionally larger than normal to make sure the rudder would have enough roll control authority. 64
80 The details of the vertical stabilizer design were shaped by very different criteria than the horizontal stabilizer design. The vertical stabilizer had a much lower aspect ratio of 1.9. The low aspect ratio allowed the vertical stabilizer to operate at larger angles of attack without stalling. Induced drag was not a concern since the vertical stabilizer would only produce lift during maneuvering. The primary reason for the low aspect ratio was to reduce the structural weight required for the tailboom. The vertical stabilizer was not symmetric like the horizontal stabilizer, so the vertical stabilizer produced torque loads on the tailboom. A higher aspect ratio would have increased the moment arm of the vertical stabilizer surfaces about the tailboom, which would have increased the torque loads. The low aspect ratio helped reduce the torque load on the tailboom. The torque load was also reduced by placing some of the vertical stabilizer area below the tailboom (section 12.4). The portion of the vertical stabilizer below the tailboom also provided more ground clearance for the horizontal stabilizer during belly landings. The fixed portion of the vertical stabilizer below the tailboom was reinforced to withstand landing loads. If more of the vertical stabilizer area had been moved below the tailboom, the torque load could have been eliminated. However, the extra area below the tailboom would have made landing more difficult since the tail would have touched the ground significantly before the fuselage. The vertical stabilizer was swept slightly and tapered to improve the aesthetics and to decrease the chance of the tail getting caught by something on the ground during landing. The sweep also moved the aerodynamic center back, which increased the effective moment arm of the vertical stabilizer. Half of the vertical stabilizer area was used for the rudder. This provided plenty of control authority for both yaw and roll. The bottom of the rudder was angled up slightly to prevent the rudder from touching the ground on landing. 65
81 Table 9-2 Vertical stabilizer parameters Parameter Symbol SI Units Imperial Units Vertical Stabilizer Area S v m ft 2 Vertical Stabilizer Moment Arm x v m 5 ft 4 in Vertical Stabilizer Volume Coefficient V v Vertical Stabilizer Span b v 0.5 m 1 ft 8 in Vertical Stabilizer Mean Chord c v m 0 ft 10 in Vertical Stabilizer Aspect Ratio AR v 1.9 Vertical Stabilizer Top Taper Ratio 0.57 Vertical Stabilizer Bottom Taper Ratio 0.71 Vertical Stabilizer Dihedral v 90 Vertical Stabilizer Top Sweep Angle 17.8 Vertical Stabilizer Bottom Sweep Angle 26.6 Rudder Area Ratio S r /S v 50% Figure 9.4 Vertical stabilizer drawing with dimensions 66
82 10.0 AIRFOIL DESIGN Aircraft design is a highly integrated process where one part of the design often affects many other parts of the design. This was especially true for the Photon airfoil design, which was important for the aerodynamics, structure, stability, and control aspects of the design. The airfoil for the Photon design had to be designed simultaneously with many other parts of the aircraft. By the time the wing airfoil design was completed for the Photon, the entire aircraft had essentially been designed. Accurate and quick analysis was essential for the airfoil design since the airfoils had to be evaluated for many different conditions. The airfoil analysis program, XFOIL, by Mark Drela, was used extensively for this purpose. XFOIL had been used by many designers for many years and had proven to be very accurate up to near stall conditions WING AIRFOILS The most important requirement for the wing airfoil design was to minimize the profile drag of the wing. The large wing combined with the slow flight speed for the Photon design meant the wing profile drag accounted for a large portion of the total aircraft drag. A low drag airfoil design was essential for perpetual solar endurance flight. The Photon was expected to fly at the design cruise speed for as long as possible to demonstrate perpetual solar endurance flight. It was tempting to optimize the airfoil design for the cruise condition. An airfoil optimized for cruise would have a lot of camber so it could cruise at a high lift coefficient and high lift to drag ratio. Such a high camber airfoil was considered early in the design process, but analysis revealed the high camber airfoil was impractical. The high camber airfoil would perform well at the cruise condition, but the drag would increase 67
83 rapidly if the aircraft deviated from the design condition. The high camber airfoil design would make perpetual solar endurance flight more difficult to achieve since the drag penalties from inevitable cruise speed deviations would more than offset slightly better cruise drag. There were many other considerations which drove the wing airfoil toward a low camber design. A high camber airfoil would increase the airfoil pitching moment, which would require a heavier wing structure to prevent the wing from twisting. The tail load to trim the airplane would also increase, which would add drag. A high camber airfoil would need an undercambered lower surface. The lower surface undercamber would keep the flow attached at high angles of attack, reducing drag at high lift coefficients. However, at low angles of attack, the lower boundary layer would not be able to follow the undercamber and would separate. This would result in high drag at low lift coefficients, which would make it difficult for the airplane to penetrate headwinds. The advantage of a low camber airfoil for high speed flight was even greater when Reynolds number effects were considered. The Reynolds number would be higher at faster flight speeds, so a high camber airfoil that was appropriate at the cruise Reynolds number would be poorly suited for the higher Reynolds numbers. A low camber airfoil would have much less difficulty operating at higher Reynolds numbers. For all of the above reasons, a low camber wing airfoil was most suitable for the Photon design. The wing airfoil design process began by searching for an existing airfoil that would be appropriate for the Photon design. The Profili airfoil database [15] contained many low Reynolds number airfoils, so the database was searched for an appropriate airfoil that could be customized for the Photon design. The airfoil that was selected was the AG34 airfoil designed by Mark Drela (Appendix E.1). Other similar airfoils, such as the WE3.55/9.3 airfoil used on the Sky-Sailor design, could also have been used for the Photon design. Some of these other airfoils had slightly 68
84 less cruise drag, however, the AG34 airfoil had several desirable characteristics that were worth a small drag penalty. The low drag of an airfoil would be ruined if the solar panels tripped the boundary layer and caused the drag to increase. The AG34 airfoil was more tolerant of different boundary transition locations than any other potential airfoil examined. The AG34 airfoil had a large range of upper surface transition points that had little effect on the airfoil drag (section 15.1). The upper airfoil surface also had gentle curvature which would make it easier to mount solar panels. The lower airfoil surface had no undercamber, so it would be easier for the wing skin covering to match the intended airfoil shape. A large portion of the lower airfoil surface was straight (Figure 10.1), which would make the wing easier to construct. All of these features of the AG34 airfoil made it better suited for the Photon design than any other airfoil. Customizing the AG34 airfoil for the Photon design was challenging. Most modifications to the AG34 airfoil made it worse in some aspect. The only modification that was clearly beneficial was to increase the thickness of the airfoil. The thicker airfoil allowed the wing spar to be thicker, which dramatically increased the stiffness of the wing spar and allowed the wing spar weight to be reduced. The AG34 airfoil was designed for lower Reynolds numbers than it would experience on the Photon wing. At higher Reynolds numbers, the thickness of the airfoil could be increased without significantly affecting the performance of the airfoil, as long as it was not too thick. The AG34 airfoil was modified slightly from 9.3% thickness to 10.0% thickness. The Reynolds number was lower at the wingtips of the Photon wing due to the large amount of wing taper. At these lower Reynolds numbers, the 10% thick airfoil caused the boundary layer to separate and increased drag. The boundary layer separation was fixed by using a thinner airfoil near the wingtip. The AG36 airfoil (Appendix E.2) used for the wingtip was essentially the same as the AG34 airfoil, except the AG36 was only 8.2% thick. The similar shape of the modified 69
85 AG34 and AG36 airfoils made it easy to linearly interpolate between the two airfoils from the root of the outer wing segment to the wingtip. The modified AG34 airfoil used on most of the wing would operate at Reynolds numbers between 116,000 and 255,000 during cruise. The transition to the AG36 airfoil would occur at Reynolds numbers between 86,000 and 116,000 in the cruise condition. The modified AG34 airfoil had a low camber value of only 2.5%. The low camber helped to achieve the low pitching moment coefficient of However, the low camber also limited the maximum lift coefficient. XFOIL typically overestimated the maximum lift coefficient, so the maximum lift coefficient was assumed to be around 1.2. This was acceptable since the Photon would cruise at a lift coefficient of 0.7 (section 16.5). Table 10-1 Modified AG34 airfoil parameters Parameter Value Thickness 10% of chord Max Thickness Location 27.8% of chord Camber 2.5% of chord Max Camber Location 36.5% of chord Leading Edge Radius 0.9% of chord Cruise Re # Range 116k to 255k c m c lmax 1.2 Cruise c l 0.7 Cruise c d (Re # = 194,000) Table 10-2 AG36 airfoil parameters Parameter Value Thickness 8.2% of chord Max Thickness Location 27.2% of chord Camber 2.2% of chord Max Camber Location 36.4% of chord Leading Edge Radius 0.7% of chord Cruise Re # Range 86k to 116k c m c lmax 1.2 Cruise c l 0.7 Cruise c d (Re # = 101,000)
86 Figure 10.1 Wing airfoil geometry (root airfoil in black, tip airfoil in blue) Figure 10.2 Modified AG34 airfoil polar 10.2 EMPENNAGE AIRFOIL The empennage airfoil design was less critical than the wing airfoil design. During cruise flight, the empennage would operate near zero lift force. The empennage lift for maneuvering would be small and brief, so the maximum lift coefficient of the empennage airfoil was not 71
87 important. A symmetric airfoil with no camber would be adequate. For angles of attack near zero lift, the boundary layer would be fully laminar, so the airfoil design would have little effect on the profile drag. The drag profile drag would be close to the skin friction on a flat plate as long as the airfoil was not so thick that it tripped the boundary layer. The main goal of the empennage airfoil design was to provide consistent control authority. The HT21 airfoil (Appendix E.3) was a symmetric airfoil designed by Mark Drela for use as an empennage airfoil operating at low Reynolds numbers. The HT21 was suitable for the Photon empennage airfoil, so it was adopted without modification. The airfoil thickness could have been increased since the Photon empennage operated at higher Reynolds numbers than the HT21 was designed for. This modification did not seem necessary since little structural weight was required to support the low loads on the Photon empennage. The drag polar for the HT21 airfoil is shown in Figure Up to a lift coefficient of 0.3, the boundary layer would be fully laminar and the drag would be constant. Typical maneuvers would not require a lift coefficient above 0.3, so this was ideal. If more extreme maneuvers were needed, the airfoil remained well behaved up to a maximum lift coefficient of 0.6. Table 10-3 HT21 airfoil parameters Parameter Value Thickness 5.1% of chord Max Thickness Location 19.4% of chord Camber 0% Max Camber Location N/A Leading Edge Radius 0.6% of chord Cruise Re # Range 58k to 202k c m 0.00 c lmax 0.6 Cruise c d (Re # = 72,500)
88 Figure 10.3 Empennage airfoil geometry Figure 10.4 HT21 airfoil polar 73
89 11.0 PROPULSION SYSTEM DESIGN Perpetual solar endurance flight would only be possible with a very efficient propulsion system. The Photon design required a propulsion system with much higher efficiency than typical for small remote control airplanes. Since power would be transferred through all of the propulsion system components in series, the efficiency of each component had to be as high as possible. The entire system efficiency would suffer if any one component had low efficiency, even if the rest of the propulsion system was very efficient. The Photon propulsion system consisted of the electronic speed controller (ESC), brushless motor, gearbox, and propeller. All commercial ESCs had low efficiency at cruise power levels, which was a big problem for the Photon design. To solve this problem the Photon design used different cruise and climb battery configurations CRUSE/CLIMB BATTERY CONFIGURATIONS The propulsion system component that presented the greatest efficiency challenge was the electronic speed controller for the brushless motor. Standard ESCs had very high efficiencies (>90%) at maximum power. However, efficiencies were much lower at low power levels. A typical ESC might only be 50% efficiency at 50% throttle. Since the Photon design would spend most of the time cruising at a low power setting, low ESC efficiency was not acceptable. Alan Cocconi solved this problem for the Solong airplane with a custom ESC design which achieved very high efficiencies above 88% at low power settings [1]. An ESC with such high cruise power efficiency was not available for the Photon design, so a different solution was found. Instead of using the ESC as the primary power setting control, a switch would be used to change the battery voltage from cruise power to climb power. The switch would connect more batteries in series 74
90 which would increase the voltage and provide extra power for climbing. The ESC would operate at full power for maximum efficiency for both cruise and climb. Even though the ESC would not perform throttling in this configuration, it could not be eliminated since the ESC was required to perform polarity switching for the motor. A drawback of the cruise/climb battery configurations was that fine power control was sacrificed. Most aircraft use fine power setting adjustments to maintain a desired cruise altitude. The Photon design only had two primary power settings, cruise and climb, so it would be difficult for the Photon to maintain altitude precisely. The Photon design would have to slowly lose altitude during cruise. Once a minimum altitude threshold was reached, power would be switched to the climb setting and the airplane would climb until it reached a maximum threshold altitude. Cruise power would be restored, and the aircraft would again begin to slowly lose altitude. This cycle would be repeated as often as required to keep the plane within the minimum and maximum threshold altitudes. Fine power adjustments might be possible with an in-flight adjustable propeller pitch system (section 11.6). The other compromise of the cruise/climb battery configurations solution was that separate batteries were required to provide the extra voltage for climb power. If the separate climb batteries did not have enough capacity, the airplane could be forced to land prematurely once the climb batteries were drained, even if the cruise batteries had plenty of energy left. If the separate climb batteries had much more capacity than required, the extra batteries would add weight without providing any benefit. A decision was made to use three climb batteries for the Photon design. Three climb batteries provided enough capacity for the Photon to climb for 45 minutes. The number of climb batteries could be increased if 45 minutes was not long enough. Only a few climb batteries were required because most of the extra climb power came from the 75
 and 20 batteries in parallel (2S20P) for a total of 40 cruise batteries.")
91 cruise batteries. The climb batteries provided the extra voltage, but the extra current came from all of the batteries. The cruise and climb battery configurations are shown in Figure The cruise configuration had two batteries in series (7.2 volts nominal) and 20 batteries in parallel (2S20P) for a total of 40 cruise batteries. An electric relay switch connected the three climb batteries in series for climb power. The climb batteries increased the voltage by 50%, which would increase the propeller RPM. The motor would then draw more current from the batteries to balance the higher torque load on the motor. The extra current in addition to the extra voltage was why the power output increased 200% instead of just 50% when the climb batteries were connected. There were so many cruise batteries in parallel that the current draw on each battery was very low. The current draw on the climb batteries was higher, but still within the tolerances of the NCR18650B batteries. Figure 11.1 Cruise/climb battery configurations (the battery colors correspond to their location inside the fuselge) 76
 [23] was selected to be the ESC for the Photon design.")

92 11.2 ELECTRONIC SPEED CONTROLLER The next component in the Photon s propulsion system was the electronic speed controller (ESC). A Jeti Spin 22 Pro BEC (battery elimination circuit) [23] was selected to be the ESC for the Photon design. Since there was little difference in efficiency between different ESC units, the main goal was to choose the smallest ESC that would handle the current and voltage requirements. The Jeti Spin 22 Pro only weighed 26 grams and it could handle 22 amps of sustained current, which was more than enough for the Photon design. The battery elimination circuit allowed the control servos to be powered by the same batteries used for propulsion. This eliminated the need to carry separate batteries just for the servos that actuated the flight controls. Figure 11.2 Jeti Spin 22 Pro electronic speed controller Source: Table 11-1 Jeti Spin 22 Pro specifications Parameter SI Units Imperial Units Weight 26 g 0.9 oz Length 3.2 cm 1.26 in Width 2.3 cm 0.91 in Thickness 0.7 cm 0.28 in Maximum Sustained Current 22 amps 77
93 11.3 MOTOR AND GEARBOX SELECTION The motor and gearbox converted electrical power into mechanical power which the propeller would convert into thrust. The performance of the motor, gearbox, and propeller all depended on each other, so they had to be designed together. The program, QPROP [13], was used to analyze the combined performance of the motor, gearbox, and propeller. Most motor and propeller analysis programs used simple propeller models described by thrust and torque coefficients. QPROP had a much more sophisticated propeller model, which used the propeller geometry and blade element theory for much better accuracy. The decision to use a brushless motor instead of a brushed motor was made early in the design process. The efficiency for both types of motors was similar, but brushless motors weighed less and could output more power for climbing. The motor and gearbox were selected based on the results of a brute force search which analyzed thousands of potential motors and gearboxes. A very large database of potential motors and their properties was obtained from MotoCalc [7]. The MotoCalc database had 2158 motors in it at the time the analysis was performed, which included most of the motors available for model aircraft. A Matlab script was created to call QPROP to analyze the efficiency of potential motor and gearbox combinations with the propeller (Appendix J). When the propeller design changed, the motor analysis had to be repeated. The brushless outrunner motors that met certain requirements for weight, motor constant, and cruise efficiency were compared. About 40 motors satisfied the requirements, and all of these motors were very similar. Some motors were operating outside of the manufacturer s specifications during cruise or climb, so these motors were eliminated. The manufacturer specifications could not be found for some of the motors so they were also eliminated. The remaining motors all had very similar specifications and 78

 had specifications (Table 11-2) that fit the Photon design even better than the AXI motor from the brute force search results.")
94 efficiency, so the final motor selection was based on the reputation of the manufacturer. The motor would have to operate for at least 48 hours continuously to demonstrate perpetual solar endurance flight, so the quality and consistency of the motor was important. The AXI (also known as Model Motors) brand seemed to be the most appropriate. A search of the AXI website revealed some new motors that had not been included in the MotoCalc database. The new AXI 2217/20 motor (Figure 11.3) had specifications (Table 11-2) that fit the Photon design even better than the AXI motor from the brute force search results. QPROP analysis showed the new 2217/20 motor was as efficient as the motor from the search results, so the 2217/20 was selected instead. Figure 11.3 AXI 2217/20 motor Source: Table 11-2 AXI 2217/20 motor specifications Parameter SI Units Imperial Units Weight 70 g 2.5 oz Diameter 2.77 cm 1.1 in Length 3.5 cm 1.4 in RPM/Volt 840 Maximum Current 18 Amps for 60 seconds Efficiency at Cruise 80.7% 79
 was the only AXI gearbox with a high enough gear ratio (6:1) to work with the custom propeller design for the Photon. The VMGM6 was a planetary gearbox.")

95 Another advantage of selecting the AXI motor was there were AXI gearboxes that could fit the motor. The VMGM6 gearbox (Figure 11.4 and Table 11-3) was the only AXI gearbox with a high enough gear ratio (6:1) to work with the custom propeller design for the Photon. The VMGM6 was a planetary gearbox. The manufacturer specifications for the VMGM6 gearbox did not specify the efficiency of the gearbox. Manufacturer specifications for other similarly size planetary gearboxes suggested the VMGM6 efficiency should be very high, but there was no data to validate these claims. The actual gearbox efficiency probably depended on how well the gearbox would be adjusted and lubricated. A gearbox efficiency of 95% was assumed for the propulsion system design. If the actual gearbox efficiency turned out to be lower than expected, a custom gearbox would probably need to be designed to achieve the high efficiency required for perpetual solar endurance flight. Figure 11.4 AXI gearbox Source: Table 11-3 VMGM6 gearbox specifications Parameter SI Units Imperial Units Weight 23 g 0.8 oz Diameter 2.4 cm 0.95 in Length 2.8 cm 1.1 in Maximum Design Power 250 watts Reduction Ratio 6:1 80
96 Many design iterations were required to match the motor and gearbox with the propeller design. The propeller operated most efficiently at a low RPM, while the motor operated most efficiently at much higher RPMs (Figure 11.5). The gearbox was needed so both the propeller and the motor could operate at an efficient RPM. A 6:1 gearbox reduction ratio worked best for the motor and propeller combination used for the Photon design. Figure 11.6 shows the peak efficiency values for the motor and propeller overlap with this 6:1 ratio gearbox. A closer inspection of the efficiency curves (Figure 11.7) shows that both were maximized at 900 RPM, which was the design cruise condition. The propulsion system design went through enough iteration to make sure the propeller and motor efficiencies were maximized during cruise. Figure 11.5 Propeller and motor efficiency without gearbox 81
97 Figure 11.6 Propeller and motor efficiency with gearbox Figure 11.7 Propeller and motor efficiency with gearbox close-up (design cruise speed marked) 82
98 11.4 PROPELLER DESIGN The last component of the propulsion system was the propeller which converted mechanical rotational power into thrust power. The propulsion system could only achieve the required very high efficiency with a custom propeller design. The propeller was designed using QMIL [13], a companion program to QPROP. QMIL used an inverse method based on the same blade element theory as QPROP to design the propeller. Many input parameters had to be specified before QMIL could design the propeller. The QMIL propeller design file required the number of blades, forward speed, thrust, hub radius, tip radius, design lift coefficient, RPM, and airfoil properties to be specified. Some of these parameters were easy to determine, while other parameters required careful tradeoffs between the many considerations that governed the propeller design. The propeller design input parameters that were easy to determine were the number of blades, the hub radius, the forward speed, and the thrust. The number of blades was set to two since fewer blades were more efficient and two blades would be easier to mass balance. The hub radius was assumed to be 0.04 m. The forward speed was determined from the cruise power analysis (section 16.5). The thrust required for this speed was determined from the drag force versus speed plot (section 16.2). The forward speed and thrust values could only be determined after the drag analysis was finalized. Since the propeller design depended on these values, the propeller was the very last part of the design to be finalized for the Photon design. This is yet another example of how integrated the Photon design had to be to achieve perpetual solar endurance flight. The drag of the real aircraft may be different than the drag value from the analysis, so the propeller may have to be redesigned again after the real aircraft is constructed. 83
99 The tip radius and RPM of the propeller were two of the more difficult values to determine. In general, a large diameter propeller spinning slowly would be more efficient than a smaller diameter propeller spinning faster. It was more efficient to produce the same amount of thrust by accelerating a large mass of air a little than by accelerating a small mass of air a lot. It seemed desirable to make the Photon propeller radius as large as possible and the RPM low for high efficiency. However, the Photon propeller had to operate at even lower Reynolds numbers than the Photon wing. A larger propeller radius and lower RPM created problems similar to increasing the aspect ratio of the wing. The Reynolds number would decrease, which would increase skin friction drag that would offset improvements in induced drag. The longer propeller blades would be more flexible and heavier. Trial and error experiments with QMIL allowed the Photon propeller tip radius to be large enough for higher efficiency, but not so large that weight increased with little efficiency gain. The design lift coefficient was also very important for the propeller design. A high design lift coefficient meant the propeller would operate near its maximum thrust, since thrust could not increase once the propeller blades stalled. The importance of the maximum thrust capability was not realized until after the climb rate analysis (section 11.5). If all other propeller design parameters were held constant, a lower design lift coefficient would increase the chord of the propeller. The longer chord would increase the Reynolds number, which was beneficial, but the longer chord also increased the weight of the propeller significantly, which was often more detrimental than the Reynolds number improvement. The propeller tip radius, RPM, and design lift coefficient were varied and tested with QMIL until a satisfactory combination was found. The QMIL and QPROP files for the propeller can be found in Appendix H. The final propeller design was 60 cm (2 ft) in diameter and 84

100 operated at 900 RPM to produce 2.25 N (0.5 lbf) of thrust for cruise flight (Table 11-4). Figure 11.8 shows the complex geometry of the propeller. The propeller had a thick chord and the pitch angle changed dramatically along the length of the blade. The design lift coefficient was 0.45, which was somewhat high to avoid making the propeller chord too large. The propeller was a very large for the amount of thrust it produced, which allowed it to achieve a high efficiency of 85%. The actual propeller efficiency in flight would not always operate at the maximum propeller efficiency, so a more conservative value of 80% was assumed for the total propulsion system efficiency analysis (section 11.7). The propeller would be made of carbon fiber since the high efficiency of the design would only be achieved if the propeller did not flex significantly. The Photon did not have landing gear so the propeller would need a hinge at the root of each blade. The hinge would allow the propeller to fold on landing to avoid damage. Figure 11.8 Propeller and spinner isometric view rendering 85

101 Figure 11.9 Propeller and spinner front view rendering Figure Propeller and spinner top view rendering Table 11-4 Propeller specifications Parameter SI Units Imperial Units Diameter 60 cm 2 ft Design Speed 9.5 m/s 21 mph Design RPM 900 RPM Design Thrust 2.25 N 0.5 lbf Design C L 0.45 Advance Ratio 0.34 Efficiency 85% The airfoil for the propeller had to operate at even lower Reynolds numbers than the wing airfoils. Figure shows the Reynolds number along the blade radius for the cruise condition. The maximum Reynolds number was less than 90,000, and the hub and tip of the propeller would experience Reynolds numbers under 50,000. These were very low Reynolds numbers and it was challenging to find a suitable propeller airfoil. Out of a handful of low Reynolds number propeller airfoils that were found, the Gunther propeller airfoil was selected because it would be easier to manufacture. The original Gunther airfoil did not perform well at the very low Reynolds numbers the Photon propeller would operate at, so the airfoil thickness was decreased from 6.4% to 4.0%. Even after the thickness reduction, the erratic drag polar (Figure 11.13) showed the boundary layer did not behave well at such low Reynolds numbers. The maximum lift coefficient was only 0.8, which limited the operating range and the maximum thrust of the propeller. This limited the maximum climb rate of the Photon design (section 11.5). The propeller used the same 86
102 airfoil along the entire blade for simplicity. A better design would have used thicker airfoils near the root where structural considerations were more important than aerodynamics. The propeller may have to be redesigned if it proves to be too flexible or too heavy. Figure Propeller Reynolds number over blade radius Figure Propeller airfoil geometry 87
103 Figure Propeller airfoil drag polar 11.5 CLIMB RATE ANALYSIS The power sizing analysis in section 5.2 determined the motor power that was required to achieve the desired climb rate of 300 ft/min. The original analysis did not consider the design of the propeller. The original analysis used Eq. (5.4), which was based on the propulsion system efficiency. The mistake the original analysis made was it assumed the propulsion system efficiency for climbing would be the same as for cruising. After the propeller was designed, QPROP analysis showed the propeller blades would stall when climb power was applied. The stalled blades would only produce 7 Newtons (1.6 lbf) of thrust. When this thrust value was substituted into Eq. (5.3), the alternative climb rate equation, the maximum climb rate the Photon could achieve was only 183 ft/min. Even though the motor could output the power required to climb at 300 ft/min, the propeller design limited the climb rate. 88
104 (5.3) The reason the propeller blades would stall under climb power was because the maximum lift coefficient of the propeller airfoil was only 0.8 and the propeller design lift coefficient for cruise was The propeller RPM did not have to increase very much to exceed the maximum lift coefficient. The maximum lift coefficient could not be increased much because of the low Reynolds numbers the propeller operated in. The design lift coefficient could not be reduced much because the propeller chord would become too large to be feasible. The physics that constrained the Photon s propeller design simply made it infeasible to design a propeller with both high cruise efficiency and high maximum thrust. The low climb rate had to be accepted to achieve the high efficiency required for perpetual solar endurance flight ADJUSTABLE PROPELLER PITCH The Photon propeller design was most efficient at the design cruise condition. Efficiency decreased the more the propeller deviated from the design conditions. This can be seen in Figure 11.14, which shows the combined motor and propeller efficiency for different voltages (propeller RPM was roughly proportional to voltage). The efficiency dropped off for voltages further from the design condition of 7.2 volts for cruise. At the nominal climb voltage of 10.8 volts, the efficiency was about 10% less than the cruise efficiency. The cruise and climb voltage marks in Figure were the nominal voltages. The actual voltages would vary during the flight as the batteries were charged and drained. The cruise voltage would be as high as 8.4 volts for fully charged batteries and as low as 6.0 volts for discharged batteries. This meant the Photon would only spend a little time at the maximum efficiency condition of 7.2 volts. 89
105 Figure Combined propeller and motor efficiency for fixed pitch propeller (cruise and climb marks are nominal voltages) Although it was not possible to change the design of the propeller during flight, this could be approximated by adjusting the pitch of the propeller blades. The rotation angle of the propeller blades was known as the propeller beta angle. Small beta angle changes had a large effect on the propeller performance, since changing the propeller beta angle was similar to changing the angle of attack of the wing. The efficiency plots for beta angles between -5 and 5 are shown Figure At the nominal climb voltage of 10.8 volts, the efficiency was 52% for a beta angle of 5, and 67% for a beta angle of -5, which shows how much of a difference the beta angle could make. 90
106 Figure Combined propeller and motor efficiency for different propeller pitch angles (cruise and climb marks are nominal voltages) If the propeller beta angle could be continuously adjusted for maximum efficiency throughout the flight, the average efficiency would improve, which would make perpetual solar endurance flight easier to achieve. The maximum potential efficiency improvement for a continuously adjustable pitch propeller compared to the fixed pitch propeller is shown in Figure The average efficiency improvement for a 48 hour flight would be 3% to 5%. This did not seem to justify the extra complexity that would be required to implement an adjustable propeller pitch system for the Photon design. However, an adjustable pitch system would enable small adjustments to the cruise thrust. Thrust adjustments could provide the fine power control that was sacrificed with the cruise and climb battery configurations (section 11.1). An adjustable propeller pitch system was not designed for the Photon, but the analysis showed that it could be worthwhile. 91
107 Figure Combined propeller and motor efficiency for fixed and adjustable propellers (cruise and climb marks are nominal voltages) 11.7 OVERALL PROPULSION SYSTEM EFFICIENCY The total propulsion system efficiency had to achieve 55% efficiency or higher to satisfy the critical design parameter requirements for perpetual solar endurance flight (section 4.4). Figure shows the Photon propulsion system met, but did not exceed this efficiency requirement. Although 55% efficiency did not seem very high, each propulsion system component had either 95% or 80% efficiency. It would be difficult to achieve much higher component efficiencies for an aircraft the size of the Photon. The efficiency of the solar collection system also appears in Figure Only about 18% of the energy from sunlight would flow into the batteries. This was mostly limited by the efficiency of the solar panels, so the aircraft design had little effect on the efficiency of this process. The total sunlight to thrust 92

108 efficiency was only 7%, which showed how little energy was available for solar powered airplanes. Figure Total solar energy conversion efficiency 93

109 12.0 STRUCTURAL ANALYSIS The next critical design parameter that had to be verified was the airframe weight. The airframe weight depended on the structure required to support the loads the aircraft would have to handle. This chapter analyzes the main structural components of the aircraft, and the total aircraft weight breakdown is described in the next chapter. Figure 12.1 Photon structure rendering The airframe had to be very light, so it was important the aircraft structure weighed no more than it needs to. The two primary structures for the Photon design were the wing spar and the tailboom. Both of these were analyzed in detail so they could be light weight yet strong enough to support the design loads. There wing spar had to carry three primary loads: the wing bending load produced by lift, the transverse shear load caused by wing bending, and the torque load produced by the pitching moment of the wing airfoil. The tailboom had to carry the bending 94
110 loads produced by the horizontal and vertical stabilizers, and the torque load produced by the vertical stabilizer since it was not symmetric. The wing spar and tailboom were made of composite materials. Composite materials can support very high loads before they fail, so structures made of composites typically deform a large amount before they break. For aerodynamic surfaces, even a small amount of deformation could potentially upset the stability or control of the airplane. For example, if the tailboom would bend under high loads, the angle of attack of the empennage surfaces would change. Since the Photon was designed without accounting for such aeroelastic deformations, the stability of the Photon design would be less than expected if the tailboom deformed significantly. The torque load on the wing could also cause problems. The wing was carefully designed with 1.5 of washout to achieve the desired lift distribution and stall behavior. If the pitching moment of the wing airfoil caused the wing to twist even 0.5, the desired lift distribution and stall behavior could not be achieved. The stiffness of the structure was more critical than the ultimate load because of the potential problems caused by deformations. The geometry of the wing spar and the tailboom varied along their lengths. Calculating the structural deformation using an analytical method would have been impractical. Instead, Matlab was used to analyze the structures using numerical methods. The Matlab code for these calculations can be found in Appendix K. Another potential approach would have been to use finite element analysis to determine how the structures deformed. However, the wing spar and tailboom were very thin, so the accuracy of finite element analysis results would have been questionable. 95
111 12.1 WING SPAR BENDING The wing spar was made of unidirectional carbon fiber laminates and epoxy. The spar was analyzed as one continuous structure, even though it was made of 5 pieces joined together. This assumption was valid as long as the joiners were stronger than the spar itself. The structure and loads were symmetric about the aircraft s plane of symmetry, so only half of the spar needed to be analyzed. The half spar analyzed was composed of 3 segments: half of the wing center panel, the wing mid panel, and the wingtip panel. The thickness of the spar caps decreased from the root to the wingtips. The center wing segment used 3 plies, the mid panel used 2 plies, and the wingtip used 1 ply. Each ply was 0.15 mm thick. There were the same number of plies on the top spar cap and the bottom spar cap. The height of the spar also varied along the spar length due to the taper of the wing. The section moment of inertia strongly depended on the distance between the top and bottom spar caps, so the stiffness of the spar changed significantly between the wing root and the wingtip. The shear web consisted of one ply of 0.1 mm thick Kevlar fabric wrapped around the entire spar with a 45 bias angle. The taper of the wing also caused the stiffness of the shear web to vary from root to tip. This was desirable since the wing root required more stiffness than the wingtips. The critical design load for the wing spar bending analysis was a 9 G load. This was a very high load that was greater than most aircraft ever experience. The wing had a relatively high aspect ratio so the wingtips could flex easily. A lower design load would have allowed the wingtips to flex excessively under unexpected high loads, and controllability might have been lost. The slow cruise speed of the Photon design also made it more susceptible to vertical wind gusts which could briefly produce large G loads. Overall, the 9 G design load was conservative, and it made sure the wing was strong enough to handle unexpected loads. 96
112 The calculations assumed the spar was a straight beam and did not take into account the wing polyhedral. Accounting for polyhedral would have made the equations much more complicated. The wing spar bending analysis also assumed the primary wing spar was the only structure that resisted the bending due to lift. In reality, the secondary wing spar, the leading edge D-tube, the trailing edge, and the wing skin all would help resist the bending load. However, including all of these components would have made the analysis much more complicated. The primary wing spar did carry most of the load, and ignoring the other components was a conservative assumption, so the real wing spar bending should be less than the results from this analysis. The wing spar bending analysis considered both an elliptical lift distribution and a uniform lift distribution. The real lift distribution should have been close to elliptic since the Oswald efficiency during cruise was almost 1.0. The uniform lift distribution was more conservative since it placed more of the lift at the wingtips (Figure 12.2). A comparison of the bending moment for the elliptical and uniform lift distributions showed the root bending moment was only 10% higher for the uniform lift distribution (Figure 12.3). Since the 9 G critical design load was already conservative, the slightly more conservative uniform load did not seem necessary, so the elliptical lift distribution was used for the wing spar bending analysis. 97
113 Figure 12.2 Elliptical and uniform lift distributions for 9 G load Figure 12.3 Elliptical and uniform lift distribution bending moment comparison 98
114 The wing spar bending deflection was given by the equation: (12.1) where E was the modulus of elasticity, I was the section moment of inertia, q(x) was the distributed load acting on the beam, and w(x) was the beam deflection. The equation would easily be solved when E, I, and q(x) were constant, by using the boundary conditions to determine the four unknown constants of the differential equation. However, the wing spar geometry varied along the length of the spar, so the value of I for the Photon design was not constant. This made the equation much more difficult to solve. Timoshenko s Strength of Materials book [48] had a method to solve for the deflection at a point for a beam with a variable cross section, which was be applied to the spar deflection analysis. The curvature of the beam depended on the ratio of M/EI, where M was the bending moment: (12.2) For a small segment of the beam, the deflection angle could be approximated by: (12.3) For small angles, the line segment distance, ds, was very close to dx, so it could be rewritten as: (12.4) The total deflection angle over a segment from A to B on the beam was: (12.5) For small angles, the deflection at the tip was simply the angle in radians multiplied by the distance to the tip: 99
115 (12.6) The total deflection at the tip was the total contribution of each small segment along the beam curving slightly: (12.7) This was a much simpler equation to solve than equation (12.1). The integral was solved numerically as represented by: (12.8) where n was the number of segments, L was the distance between A and B, and I 0 was the section moment of inertia at one end of the beam. Since it was the ratio of M/EI that was important, the correct answer could be found by holding I constant and varying M the appropriate amount to account for the variation of I. By making the denominator constant, the equation was much easier to solve, and no loss of accuracy was sacrificed. Only a very small amount of accuracy was sacrificed by using a numerical method, as verified by benchmarks of the Matlab scripts. In addition to the bending deflection, the bending stress and transverse shear stress were also calculated. The bending stress was given by: (12.9) where c was the maximum distance from the neutral axis. The transverse shear stress due to bending was given by: (12.10) 100
116 where V was the shear force, Q was the first moment of the cross section area about the neutral axis, and t was the thickness of the shear web. The critical design load parameters and the results of the analysis are listed in Table The analysis results were plotted graphically in Figure The analysis showed the wingtip would deflect 31.7 cm (12.4 in) under a 9 G load. This corresponded to a dihedral angle of 8.2 for a wing with no dihedral. Since the real aircraft has polyhedral, the real wingtip deflection would be less than 8.2. This would not cause any unusual control problems, so the wing spar would be stiff enough even under high loads. The bending stress had a safety factor of about 2.0 and the shear stress had a safety factor of about 1.5. Figure 12.4 Wing spar bending analysis 101
117 Table 12-1 Wing spar bending analysis parameters and results Parameter Symbol SI Units Imperial Units Critical Load Parameters Aircraft Weight W 49 N 11 lbf Load Factor n 9 G Half Wingspan b/2 2.2 m 7 ft 3 in Modulus of Elasticity E 135 GPa 19,600 ksi Elliptical Lift Distribution Calculated in liftloc.m (see Appendix K.7) Results Tip Deflection 31.6 cm 12.4 inches Max Bending Stress max GPa 80,800 psi Allowed Bending Stress allowed 1.2 GPa 174,000 psi Max Shear Stress max 33.2 MPa 4,820 psi Allowed Shear Stress allowed 50 MPa 7,250 psi 12.2 D-TUBE TWIST The positive camber of the wing airfoil produced a negative pitching moment. The negative pitching moment resulted in a torque across the wingspan that tended to twist the leading edge down, especially at the wingtips. The twist would change the angle of attack, and, therefore, change the lift distribution over the wing. Since the lift distribution was carefully tailored to reduce drag, even 0.5 of twist could cause problems. For this reason, the wing had a D-tube construction to resist twisting. The D-tube consisted of a leading edge piece that extended to the wing spar. Together, these formed a D shaped tube along the entire wingspan. The leading edge piece was made of woven Kevlar and carbon fiber cloth oriented with a 45 bias. Since the chord varied along the wingspan, the cross section properties of the D-tube also varied along the wingspan. Once again, a numerical method was employed to account for the variation, and a Matlab script computed the solution. See Appendix K for the code. The angle of twist for a general closed thin wall tube of any shape was given by: (12.11) 102
118 where T was the torque, L was the length of the tube, Am was the mean enclosed area, G was the shear modulus, t was the thickness of the wall, and the integral of ds was the perimeter of the tube cross section. The average shear stress in a general closed thin wall tube was given by: (12.12) The critical design load parameters and the results of the analysis are listed in Table The analysis results were plotted graphically in Figure The torque load increased with speed, so the analysis assumed high speed flight at 25 m/s. The polyhedral of the wing was neglected to simplify the equations. The slope of the deflection plot changed at 1.6 m along the wingspan because the D-tube thickness decreases at that point. The analysis showed the wing would twist down a total of 1.5. This would change the lift distribution, increasing induced drag. The pitching moment would also change some, probably requiring a trim change. However, the airplane should be able to fly at this speed under control, so the critical design condition was satisfied. The shear stress had a safety factor of 24, so there was no risk of the wing breaking from torque. Table 12-2 Wing torque load analysis parameters and results Parameter Symbol SI Units Imperial Units Critical Load Parameters Velocity V 25 m/s 56 mph Air Density 1.23 kg/m slugs/ft 3 Half Wingspan b/2 2.2 m 7 ft 3 in Shear Modulus G 5 GPa 725,000 psi Torque Calculated in wingtorque.m (see Appendix K.25) Results Maximum Wing Twist 1.5 Max Shear Stress max 2.07MPa 300 psi Allowed Shear Stress allowed 50 MPa 7,250 psi 103
119 Figure 12.5 Wing torque load analysis 12.3 TAILBOOM BENDING The tailboom had to resist bending loads to keep the empennage surfaces at the proper aerodynamic incidence with the wing. If the tailboom flexed too much, control effectiveness would be reduced. The tailboom bending load was greatest when the empennage surfaces operated at a high lift coefficient and the aircraft was flying at a high speed. For the tailboom bending analysis, it was assumed the aircraft was flying at 25 m/s. The vertical stabilizer produced the largest bending moment because it had a longer moment arm than the horizontal stabilizer. A maximum lift coefficient of 0.5 was assumed. This would be a low lift coefficient for a wing, but it was a high lift coefficient for a tail surface because the tail surfaces should not approach stall or control effectiveness would be lost. The empennage airfoil stalled at a lift coefficient of 0.6, but the actual empennage surfaces would stall at a lift coefficient below that 104
120 part of the surface would stall before the rest of the surface. A maximum lift coefficient of 0.5 seemed like a reasonable assumption. The tailboom had to resist both bending loads and torque loads, so unidirectional carbon fiber was not used. The properties assumed for the tailboom bending are in Table Since the cross section varied along the length of the tailboom, Matlab was used again to solve for the deformation using a numerical method. The bending load on the tailboom could be treated as a point load acting at the end of the tailboom: (12.13) The critical design load parameters and the results of the analysis are listed in Table The analysis results were plotted graphically in Figure The analysis showed the end of the tailboom deflected 2.2 cm (0.86 in) under the critical design load. For the empennage surfaces, the angle of deflection was more important than the deflection distance. The angle of deflection was 1.9, which would not cause any major stability or control problems. The bending stress had a safety factor of 2.8, and the shear stress had a safety factor of 103, so the tailboom would not be close to breaking at the critical design load. Table 12-3 Tailboom bending analysis parameters and results Parameter Symbol SI Units Imperial Units Critical Load Parameters Velocity V 25 m/s 56 mph Air Density 1.23 kg/m slugs/ft 3 Vertical Stabilizer Area S v m ft 2 Maximum Lift Coefficient, Tail C Lmax, Vstab 0.5 Critical Bending Load P crit 25.9 N 5.82 lbf Tailboom Length L 1.2 m 3 ft 11 in Modulus of Elasticity E 70 GPa 10,200 ksi Results Tip Deflection 2.2 cm 0.86 inches Deflection Angle 1.9 Max Bending Stress max 39.1 MPa 5,670 psi Allowed Bending Stress allowed 110 MPa 16,000 psi Shear Stress max MPa 98.6 psi Allowed Shear Stress allowed 70 MPa 10,000 psi 105
121 Figure 12.6 Tailboom bending analysis 12.4 TAILBOOM TWIST The horizontal stabilizer did not produce meaningful torque on the tailboom because the loads were symmetric. The vertical stabilizer, however, had more surface area above the tailboom than below it, which created a torque load on the tailboom. Although twisting of the empennage surfaces was not as problematic for stability and control as bending of the tailboom, excessive tailboom twisting would make the control response less consistent. The torque load on the tailboom increased with speed, so a high speed of 25 m/s was assumed for the analysis. The critical torque load was given by: (12.15) 106
122 where S t and S b were the top and bottom areas of the vertical stabilizer, and X t and X b were the vertical distances from the tailboom centerline to the aerodynamic center of each area. Placing part of the vertical stabilizer below the tailboom reduced the torque load by about 50% compared to if the entire area had been above the tailboom. The critical design load parameters and the results of the analysis are listed in Table The analysis results were plotted graphically in Figure The analysis showed the tailboom twisted a total of 2.4 under the critical design load. This would not cause any noticeable stability or control problems. The shear stress had a safety factor of 18.6, so there was no chance the tailboom would break under the critical torque load. Figure 12.7 Tailboom torque load analysis 107
123 Table 12-4 Tailboom torque load analysis parameters and results Parameter Symbol SI Units Imperial Units Critical Load Parameters Velocity V 25 m/s 56 mph Air Density 1.23 kg/m slugs/ft 3 Vertical Stabilizer Area Above Tailboom S t 0.10 m ft 2 Vertical Stabilizer Area Below Tailboom S b m ft 2 Moment Arm for Top Stabilizer Area X t 11.6 cm 4.6 in Moment Arm for Bottom Stabilizer Area X b 5.0 cm 2.0 in Maximum Lift Coefficient, Tail C Lmax,Vstab 0.5 Total Critical Torque Load T crit 1.91 N m 1.41 lbf ft Tailboom Length L 1.2 m 3 ft 11 in Shear Modulus G 5 GPa 725,000 psi Results Boom Tip Twist 2.4 Max Shear Stress max 4.85 MPa 703 psi Allowed Shear Stress allowed 90 MPa 13,100 psi 12.5 FUSELAGE AND TAILBOOM WEIGHTS The thorough structural analysis allowed the wing spar and tailboom to weigh very little and still support all of the critical loads for the Photon design. The total wing spar weight was 316 grams (11.1 oz) and the total tailboom weight was 120 grams (4.2 oz). 108
124 13.0 WEIGHT AND BALANCE 13.1 AIRFRAME WEIGHT The energy balance analysis determined the Photon airframe had to weigh 1.5 kg or less to achieve perpetual solar endurance flight (section 4.4). To verify the Photon airframe weight, the details of the airframe design and the weight of each component had to be accurately estimated. The structural analysis in the previous chapter determined the weight of the wing spar and tailboom. The rest of the airframe weight was estimated from a detailed CATIA model of the Photon design. The CATIA model included all of the pieces that would be required to construct the Photon design, including the glue to hold pieces together. The geometry of each piece was modeled in detail so the weight of each piece could be accurately estimated from material density values. A detailed table of all the components, weights, and materials can be found in Appendix F. The airframe weight estimated from the CATIA model was 1.45 kg. This was 50 grams underweight, but only 3% less than allowed. The airframe would still have to be constructed very carefully to avoid exceeding the 1.5 kg limit. The low airframe weight was achieved through careful design that used lightweight materials. Carbon fiber was used for the structures that required strength or stiffness, which included the wing spars, empennage spars, tailboom, fuselage, wing leading edge, propeller, and trailing edges. Kevlar was used where shear resistance or flexibility was important, which included the wing spars, empennage spars, fuselage, and wing leading edge. Balsa wood was used for the wing ribs and empennage. Foam was used for the wing spar cores, empennage spar cores, wing leading edge, and fuselage floor. The top surface of the wing was covered by the solar panels and the thin film that encapsulated them. The bottom of the wing and the empennage 109
125 surfaces were covered by a thin plastic film called Oracover. The airframe structure and the materials that were used can be seen in Figure 12.1 at the beginning of the previous chapter WEIGHT MARGIN After the Photon design was completed, Panasonic came out with a new version of the NCR18650A battery. The NCR18650B battery had a higher energy density than the NCR18650A battery, so the NCR18650B was adopted for the Photon design. The weight breakdown of the Photon design with the NCR18650B batteries is shown in Figure The new batteries increased the unused weight margin to 8% of the 5.0 kg total weight allowed for the Photon design. The weight margin could be used to absorb higher than expected airframe weight, to add more batteries, or to reduce the gross weight of the Photon, which would also reduce the power required for flight. Margin 8% Weight Fractions Batteries 40% Solar Panels 13% Propulsion 6% Airframe 29% Electronics 4% Figure 13.1 Weight breakdown Kevlar 6% Carbon 12% Foam 5% Plastic/Nylon 1% Balsa 3% Glue 1% Oracover 1% 110
126 13.3 INERTIA The way the Photon s weight was distributed was also important for the design. The more inertia the Photon design had, the larger the tail surfaces had to be. The tail surfaces were far from the aircraft s center of gravity, so larger tail surfaces would have added weight and increased the inertia even more. The extra inertia would require the tail surfaces to be enlarged again, and the cycle would have to be repeated until the aerodynamic forces could overpower the inertial forces. The yaw and roll inertia of the Photon design decreased significantly when the wing was tapered (section 6.4). The low inertia values (Table 13-1) allowed the Photon tail to be smaller, which saved weight and reduced drag. Table 13-1 Aircraft inertias IX (roll inertia) 1.79 kg m 2 IY (pitch inertia) 0.66 kg m 2 IZ (yaw inertia) 2.36 kg m STATIC MARGIN The detailed CATIA model of the Photon design provided a good estimate for the aircraft s center of gravity location. Table 13-2 summarizes the major aircraft component weights and their distance from the nose. The neutral point of the aircraft was calculated by AVL. A diagram of the static margin for the Photon is shown in Figure The static margin was 19%, which provided plenty of stability for the design (chapter 14.0). The center of gravity could be adjusted as needed by shifting the batteries inside the fuselage. Since the Photon did not consume any fuel, the center of gravity location would not change during flight. 111

127 Table 13-2 Weight and center of gravity location of major components Component Weight (g) Center of gravity location (distance from nose in) (cm) Wing Root Wing Middle Wing Tip Fuselage Tailboom Horizontal Stabilizer Vertical Stabilizer Propulsion Electronics Solar Panels Batteries Total Neutral Point 62.3 Figure 13.2 Center of gravity location diagram 112
128 14.0 STABILITY AND CONTROL Although stability and control were not part of the energy balance analysis, stability and control were essential for the Photon to achieve perpetual solar endurance flight. A difficult to control airplane would deviate from the design cruise speed more often, which would consume more energy. The very long flight time required to demonstrate perpetual solar endurance flight would make the Photon more susceptible to be upset by wind conditions, or temporary loss of the radio control link. Such unexpected events could cause a poorly designed airplane to crash. Stability and control considerations were critical drivers of the Photon design, so stability and control analysis was used throughout the design process. The analysis was performed by AVL, which used a vortex lattice method to approximate the 3-D flow around the aerodynamic surfaces of the aircraft. Since the fuselage of the Photon design was small, this was an acceptable approximation. The AVL model file for the Photon design can be found in Appendix G. The stability and control of the Photon design was determined from the dynamic modes of the aircraft. The short period mode and phugoid mode were the longitudinal modes. The roll mode, dutch roll mode, and spiral mode were the lateral modes. The way the Photon would respond to disturbances or control inputs depended on the pole locations of these modes. The pole values calculated by AVL are listed in Table 14-1, and plotted in Figure The corresponding period and damping ratio for each mode are listed in Table Table 14-1 Aircraft dynamic modes pole values Mode Real Imaginary Short Period /-5.39i Phugoid /-0.89i Roll /-0.0i Spiral /-0.0i Dutch Roll /-3.37i 113
129 Figure 14.1 Aircraft dynamic modes pole plot Table 14-2 Period and damping ratio of the aircraft dynamic modes Mode Period (seconds) Damping Ratio Short Period Phugoid Roll N/A Overdamped Spiral N/A Overdamped Dutch Roll All of the poles for the Photon design were on the left side of the imaginary axis, which indicated all of the dynamic modes were stable. The short period mode was fast and well damped, which showed the horizontal stabilizer was designed well. The phugoid mode was very slow and had almost no damping. This was unavoidable for a design with a very high lift to drag ratio, and a pilot could easily correct the slow phugoid oscillation. The roll mode was very overdamped, which was normal. Tapering the wing made the Photon more responsive in roll, which made it easier to control roll with the rudder. The dutch roll mode was somewhat fast and moderately damped. The Photon design would tend to experience small but continuous dutch roll oscillations during cruise flight. The oscillations would not be very noticeable, and they would 114
130 not add meaningful drag or prevent control of the aircraft. Most airplanes have a slightly unstable spiral mode, but the spiral mode was stable for the Photon design. This was beneficial since the Photon design would tend to circle in place if the radio control link with the aircraft was lost. The stability and control of the Photon design were driven by the decision to eliminate ailerons from the aircraft. The wing required a lot of effective dihedral angle so the rudder could control the roll of the aircraft. The final dihedral angle was a tradeoff between many conflicting requirements. More dihedral made the dutch roll oscillations worse, but improved the spiral stability. Less dihedral allowed the solar panels to be more horizontal, but made roll more difficult to control. Polyhedral was used to achieve the effective dihedral angle of 12 to keep the solar panels more horizontal while providing adequate roll control. A longer tailboom would have improved the dutch roll damping and the spiral stability, but the tailboom length was limited by structural considerations. 115
131 15.0 DRAG ANALYSIS The Photon design had to achieve a cruise lift to drag ratio of 22 or higher to satisfy the final critical design parameter for perpetual solar endurance flight (section 4.4). Traditional design methods estimated the total aircraft drag based on the total wetted area compared to similar aircraft. Since perpetual solar endurance flight was sensitive to the lift to drag ratio, a more accurate method to estimate the total aircraft drag was needed for the Photon design. The drag for each major aircraft surface was analyzed and added together to get the total aircraft drag. The drag of each surface could be estimated quite accurately, so this approach resulted in a much more accurate estimate of the total aircraft drag. In addition to estimating the cruise drag, the drag values for other flight speed were also estimated so they could be used to construct the power required curve (section 16.5). Unlike most aircraft which operate at higher Reynolds numbers, the Photon design drag polar could not be approximated accurately by a standard drag polar equation: (15.1) where K 1 was the zero lift drag constant, and K 2 was the induced drag constant. For the Photon design, the zero lift drag was not constant and varied significantly. At low Reynolds numbers, the Reynolds number changed significantly as the flight speed changed. The skin friction drag depended on the Reynolds number, so the zero lift drag changed as the flight speed changed. The pressure drag could also change with the Reynolds number if the boundary layer separated. For these reasons, the Photon drag polar could not be represented by Eq Instead, the drag polar was constructed by calculating the drag for various flight speeds while taking Reynolds number effects into account. 116
132 The drag analysis could be separated into profile drag and induced drag. Other sources of drag (interference, gaps, bumps, etc) would be small for the Photon design and these were accounted for in section The profile drag was skin friction drag plus pressure drag. XFOIL did a good job of calculating the profile drag for 2-D shapes. Since there was not a lot of spanwise flow on the Photon design, XFOIL was used to estimate the profile drag for most surfaces. The induced drag was the drag produced by lift. The induced drag depended on the lift distribution for a surface. Since AVL calculated the lift distribution for all aerodynamic surfaces, most of the induced drag estimates were based on AVL results WING DRAG Most of the total aircraft drag was produced by the wing, so it was important to estimate the wing drag accurately. The solar panels mounted on top of the wing made the wing drag more difficult to estimate since the solar panels could disrupt the boundary layer of the wing. The solar panels were only 0.3 mm thick, but they could trip the boundary layer from laminar to turbulent if they were poorly mounted to the wing. The solar panels could also heat up and the temperature difference could trip the boundary layer. XFOIL allowed the boundary layer transition point to be specified. A Matlab script was created to use XFOIL to analyze the profile drag at critical sections along the wing. The script also took into account the local Reynolds number variation due to the wing taper. The drag contribution of different wing sections was added together and weighted appropriately to get the total wing profile drag. The details of the script can be found in Appendix L. Since XFOIL was used, the script didn t take into account the spanwise flow over the wing. However, the wing had a large aspect ratio so the spanwise flow would be small except near the wingtip where the profile drag contribution was small. 117
133 The script considered two scenarios. In the first scenario, the boundary layer was allowed to transition naturally. The second scenario considered the worst case condition where the boundary layer transitioned at the leading edge of the solar panels. This was the worst case scenario since the boundary layer would become turbulent much earlier than usual, increasing the skin friction drag. The difference between the free transition and the forced solar panel transition is shown in Figure The top half of the figure shows a top view of the wing with the transition lines for free and forced transition shown. An image of the wing with solar panels has been overlaid in the background (not to scale) to show the forced transition line accurately matched the leading edge location of the solar panels on the wing. The free transition line and the forced transition line overlapped near the wingtip since there were no solar panels mounted in this area. The Matlab script also took into account the local lift coefficient by using the wing lift distribution calculated by AVL. This was why the boundary layer transition point was at the trailing edge for the wingtip. The lift dropped to zero at the wingtip so the wingtip effectively operated at a zero lift angle of attack. At that angle of attack, the boundary layer remained laminar over the entire chord. In reality, the flow could be turbulent at the wingtip due to the wingtip vortices and spanwise flow effects, but the difference in total wing profile drag would be small since the wingtip contributed very little to the total wing profile drag. The lower half of Figure 15.1 shows the local drag coefficient over the wingspan. Except for two spikes where the solar panels were quite close to the leading edge, the local drag coefficient was very similar for both natural boundary layer transition and forced transition. When the total profile drag for the wing was calculated, the two spikes made very little difference. Table 15-1 shows the difference in profile drag due to the forced transition was less than 2%. The tiny drag increase confirmed the wing airfoil choice was very appropriate for the 118
 Table 15-1 Wing profile drag analysis results C D for wing profile drag with free")
, the wing aspect ratio (AR), and the Oswald efficiency (e): (15.")
134 Photon design. The modified AG34 airfoil was very tolerant of different boundary layer transition points. Figure 15.1 Wing boundary layer transition location and local profile drag (wing top view superimposed, not to scale) Table 15-1 Wing profile drag analysis results C D for wing profile drag with free transition (no solar panels) C D for wing profile drag with forced transition (with solar panels) The other component to the wing drag was the induced drag. The induced drag depended on the aircraft lift coefficient (C L ), the wing aspect ratio (AR), and the Oswald efficiency (e): (15.2) The Oswald efficiency was a function of the lift distribution over the wing. The wing lift distribution for the Photon design was obtained from AVL. The Trefftz plot for the Photon design is shown in Figure The green line represented the overall lift distribution for the wing, and the red dashed line showed the local lift coefficient. The lift distribution dipped 119
135 slightly in the center because of the fuselage. The dip was small because the aircraft was designed to cruise with the fuselage at a 2 angle of attack. The fuselage produced a little lift in this position, which helped to prevent the wing lift distribution from sagging more. The lift distribution for the horizontal stabilizer is also shown in the figure (the short green line just above the 0.0 value for the horizontal axis on the plot). The horizontal stabilizer essentially produced zero lift in the trimmed cruise flight condition (section 9.1), so it did not add to the wing induced drag. The Oswald efficiency calculated by AVL was Tests of other airplane designs under different conditions showed that AVL frequently calculated a lift distribution with an Oswald efficiency of 1.0 or slightly above. An Oswald efficiency of 1.0 was the best that could be obtained in theory, so instead of using the AVL results, an Oswald efficiency of 0.95 was used for the wing induced drag analysis to be conservative. Figure 15.2 Trefftz plot with elliptical lift distribution 120
136 The results of the wing drag analysis are listed in Table The drag results were listed in terms of the drag coefficient for the aircraft. This made it easier to add the drag results for the other surfaces together to get the total aircraft drag coefficient. The drag values were organized by the lift coefficients for the aircraft, which made it easier to construct the drag polar for the entire aircraft. Both the wing profile drag and the wing induced drag increased as the lift coefficient increased. The increase in induced drag was expected for higher lift coefficients, but the increase in profile drag demonstrated the strong effect of Reynolds number changes. Table 15-2 Wing drag C L Wing Profile C D Wing Induced C D EMPENNAGE DRAG The empennage surfaces produced profile drag and induced drag like the wing. However, induced drag was a function of C L 2. The lift coefficient value for the empennage surfaces was very small for all trimmed flight speeds so the induced drag was neglected. Like the wing, the local profile drag for the horizontal stabilizer and the vertical stabilizer varied along their spans because they were tapered. The local profile drag depended on the local Reynolds number, and the local Reynolds number varied with the local chord length. To account for this, the same Matlab script that was used for the wing was also used to calculate the total profile drag for the empennage surfaces. The results are listed in Table Table 15-3 Empennage drag C L Hstab C D Vstab C D
137 15.3 FUSELAGE DRAG The fuselage drag was more difficult to calculate because the flow around the fuselage was much more three dimensional. Using computational fluid dynamics (CFD) to accurately model the three dimensional flow would have been very time consuming, so an alternative approach was used. An estimation of the fuselage drag was made by treating the fuselage as a body of revolution with constant profile drag. This assumption allowed the fuselage to be modeled as a 2-D shape in XFOIL to obtain the profile drag (Figure 15.3). Although this approach sacrificed some accuracy, the XFOIL analysis did show the initial fuselage design caused the boundary layer to separate before it reached the tailboom, which added significant pressure drag. The fuselage was redesigned with a smoother tailboom fairing, and the XFOIL analysis showed the boundary layer remained fully attached for the new design. The boundary layer separation caught by the XFOIL analysis would probably have occurred on the real airplane. Since this project did not have time for CFD analysis, the fuselage separation would not have been discovered if the XFOIL modeling had not been done. The drag results for the redesigned fuselage are listed in Table
138 Figure 15.3 Fuselage 2-D profile drag analysis in XFOIL Table 15-4 Fuselage drag C L Fuselage C D TAILBOOM DRAG The tailboom only produced skin friction drag as long as the tailboom was aligned with the airstream. The only time the tailboom wouldn t be aligned with the airstream would be during maneuvering, which didn t apply to this cruise drag analysis. The tailboom was behind the fuselage, so the boundary layer at the end of the fuselage was the beginning of the boundary layer for the tailboom. The boundary layer at the end of the fuselage was turbulent and very thick, which meant the skin friction drag for the tailboom was very low. This was because skin friction drag depended on the gradient of velocity at the wall, and a thin boundary layer had a more severe gradient than a thick boundary layer. It was difficult to predict just how thick the 123
139 boundary layer would be at the end of the fuselage. For the tailboom drag analysis, it was assumed that the boundary layer started over from zero thickness. This was a very conservative assumption that resulted in a much higher skin friction drag value than the tailboom would actually experience. The tailboom drag was calculated by treating it as a flat plate with the same surface area as the tailboom. This was a reasonable approximation since the tailboom was very long and its cross section changed very gradually over its length. The calculations also assumed the tailboom boundary layer was fully turbulent, which was a realistic assumption. The equation used to calculate the skin friction drag coefficient for a turbulent boundary layer was given by: (15.3) Even with the conservative assumption that the boundary layer started over at the tailboom, the analysis showed the tailboom contributed very little to the total aircraft drag (Table 15-5). Table 15-5 Tailboom drag C L Tailboom C D OTHER DRAG There were other sources of drag besides the profile and induced drag produced by the primary aircraft surfaces. For the Photon design, the following sources of other drag were recognized. The tail surfaces for the Photon design were actuated by servos with control arms exposed to the airstream. The fuselage required intake and exhaust vents to cool the motor and batteries. The intersection of the wing and the fuselage produced interference drag. Manufacturing differences could also cause the actual aircraft drag to be greater than calculated. All of these sources of drag were small and difficult to estimate. To account for them, the total aircraft drag coefficient was increased by This extra drag accounted for 3% of the total 124
140 airplane drag at the design cruise speed. This increment was the same for all lift coefficients (Table 15-6) since the value was arbitrary and it was not clear how the drag from these other sources would vary with flight speed. Table 15-6 Other source of drag C L Other C D TOTAL AIRCRAFT DRAG The total aircraft drag was the sum of all the individual surface drag estimations. The total drag results are listed in Table The Photon design cruised at a lift coefficient of 0.7, which will be explained in the next chapter. The total aircraft drag coefficient at this cruise condition was , which corresponded to a lift to drag ratio of This slightly exceeded the required lift to drag ratio of 22 necessary for perpetual solar endurance flight. Table 15-7 Total drag C L Wing Profile Wing Induced Hstab Vstab Fuselage Tailboom Other Total C D The drag polar for the Photon design is shown in Figure The plot ends at a lift coefficient of 0.2, since it was unlikely the Photon design would be able to fly fast enough to reduce the lift coefficient below 0.2. A lift coefficient of 1.0 was expected to be the stall speed for the Photon design. There was no standard drag polar equation to go with this drag polar, 125
141 since this drag polar included the effect of the Reynolds number changes on the zero lift drag (section 15.0). Figure 15.4 Photon drag polar Figure 15.5 provides a graphical breakdown of the cruise drag. The wing was responsible for 78% of the total drag, so it made sense to spend a lot of time on the wing design. Half of the wing drag was profile drag, and half was induced drag. The empennage surfaces only accounted for 7% of the total drag. The fuselage accounted for 11% of the total drag, which was more than expected considering how small the fuselage was compared to the wing. Most of the fuselage drag was skin friction drag, so the drag could be reduced by shrinking the fuselage to exactly fit the batteries, or moving the batteries into the wing and making the fuselage even smaller. The tailboom only accounted for 1% of the total drag. It made sense to design the tailboom based 126
142 solely on structural requirements since the drag was so small. The other sources of drag made up 3% of the total drag, which was intended to be a conservative estimate. Tailboom Fuselage 1% Vertical 11% Stabilizer 3% Horizontal Stabilizer 4% Wing Induced 39% Other 3% Wing Profile 39% Cruise C L = 0.7 Figure 15.5 Cruise drag breakdown The data from Table 15-7 is plotted as a bar chart in Figure The lift coefficient values were converted into aircraft velocity values to make it easier to interpret the effect of speed on the aircraft drag. As expected, the wing induced drag decreased dramatically as speed increased, since the induced drag was a function of C 2 L. The wing profile drag also decreased by about 50% between 8.0 m/s and 17.8 m/s. This showed how much the change in Reynolds number affected the drag of the Photon design. This was very significant for the power required curve, which is described in the next chapter. 127
143 Drag Coefficient Breakdowns at Different Speeds Other (cooling, interference, trim) Tailboom C D Velocity (m/s) Fuselage Vertical Stabilizer Horizontal Stabilizer Wing Induced Wing Profile Figure 15.6 Drag coefficient breakdowns for different velocities 128
144 16.0 POWER REQUIRED ANALYSIS The power required curve was constructed from the drag data from the previous chapter. The minimum point on the curve revealed the best cruise speed. The thrust power of the aircraft was simply the thrust multiplied by the velocity as shown in Eq. (16.1). The thrust and velocity terms could be expressed in different ways, which provided alternate forms of the power required equation Eqs. (16.2) and (16.3). The drag coefficient (C D ), the drag force (D), the lift to drag ratio (L/D), and the lift cubed to drag squared ratio (L 3 /D 2 ) appeared in the different power required equations. The behavior of these four parameters was investigated to see how they related to the power required. Traditional drag and power required curves assumed the parasitic drag was fixed. That assumption was not made for the Photon design since the parasitic drag varied significantly with speed because of the low Reynolds number operating conditions. Speed is expressed in units of miles per hour (mph) instead of meters per second (m/s) for convenience in this chapter. (16.1) (16.2) (16.3) 129
145 16.1 DRAG COEFFICIENT The first parameter that was investigated was the variation of the drag coefficient with velocity. The drag coefficient decreased asymptotically as velocity increased (Figure 16.1). Most other aircraft have a similar relationship of decreasing drag coefficient with increasing velocity, since induced drag decreases with speed. However, the plot for the Photon design was steeper than it would be for other aircraft. This was because the parasitic skin friction drag also decreased as speed increased due to the low Reynolds numbers the Photon operated in. The plot suggested flying faster would decrease drag, but this was an illusion. The drag coefficient alone was not helpful for finding the minimum power required cruise speed. Figure 16.1 C D plot for the design velocity range 130
146 16.2 DRAG FORCE The next parameter that was investigated was the drag force itself. Unlike the previous plot, the drag force plot matched intuition better, with the drag force maximum at the maximum velocity, and a low point a bit above the stall speed (Figure 16.2). The drag force was minimized at a lift coefficient of 0.7. It was interesting to note the drag force curve was very shallow around the design cruise speed. The drag force was essentially constant between 20 mph and 23 mph. This was a result of decreased induced drag and parasitic drag which offset the increase in flight speed. This was desirable since it suggested the power required would change more slowly around the design cruise speed. The drag force was a better indicator of the minimum power required cruise speed, but it was still off slightly, as the power required curve will show. Figure 16.2 Drag force plot for the design velocity range 131
147 16.3 L/D RATIO The next parameter was the lift to drag ratio. The lift to drag curve had the same shape as the drag force curve except that it was turned upside down (Figure 16.3). This was because in level flight, the lift force matched the weight of the aircraft, so lift remained constant. The lift to drag curve was simply an inverted plot of the drag force. This made the lift to drag curve no more useful than the drag force curve for finding the minimum power required. Figure 16.3 L/D ratio plot for the design velocity range 132
148 16.4 L 3 /D 2 RATIO The final parameter that was investigated was the L 3 /D 2 curve. Unlike the previous plots, this curve had a large peak just above the stall speed and rapidly dropped off as velocity increased (Figure 16.4). The power required curve on the next page will show the minimum power required did occur at the maximum L 3 /D 2 value, although the L 3 /D 2 curve was much steeper than the actual power required curve. This showed the L 3 /D 2 performance parameter was the best parameter to use to find the cruise speed for minimum power required. Figure 16.4 L 3 /D 2 ratio plot for the design velocity range 16.5 POWER REQUIRED The power required curve for the Photon design is shown in Figure The highly refined design of the Photon aircraft was reflected in this plot. The power required curve was very smooth and shallow, which meant the aircraft operated efficiently both at the design point 133
149 and at off design conditions. The design cruise speed corresponded to a lift coefficient of 0.7. This cruise speed was higher than the speed for minimum power required. The difference in power was small, and the minimum power required speed was very close to the stall speed, so a higher cruise speed was selected to avoid stalling the airplane. If the stall speed turned out to be lower than expected, it would be possible to fly slower to reduce the power required. The design cruise speed was 9.5 m/s (21.3 mph), and the aircraft required 20.8 watts of thrust power to fly at this speed. The thrust power value was the power output by the propulsion system and it did not take into account the efficiency of the propulsion system. When the propulsion system efficiency was included, the power required from the batteries was 37.8 watts. When the estimated power consumed by the electronics for the aircraft (radio, servos, data logger, etc.) was added, the total power drain from the batteries was about 40 watts. Figure 16.5 Thrust power required for the design velocity range 134
150 16.6 DESIGN EVALUATION If the aircraft had been a point design, the design process would have only focused on optimizing the aircraft performance at the intended cruise conditions. A point design would have used a wing airfoil with more camber so it could fly more slowly at a higher lift coefficient. However, the drag for the cambered airfoil would increase dramatically for lift coefficients both above and below the intended cruise lift coefficient, canceling out some of the favorable Reynolds number effects the Photon design benefited from. The high cambered airfoil would have generated a much larger pitching moment, which would have made the aircraft more difficult to trim. Heavier structures would also have been required to support the larger loads. The drag, trim, and structural requirements for the point design would have limited the aircraft to a much narrower speed range than the Photon design. The point design would have had lower power required at the design point, but higher power required at any off design conditions. This would have show up in the power required curve as a dip at the design point and a steep rise in power required everywhere else. The point design most likely would not have achieved perpetual solar endurance flight if it could not fly at the intended design conditions for the entire flight. The drawbacks of the point design were well understood because such a point design was considered early in the design process. Although the point design might have required slightly less power during cruise, it would have been less likely to successfully demonstrate perpetual solar endurance flight. The final Photon design was not a point design. The power required changed only slightly if the aircraft deviated from the design cruise speed. This allowed the Photon design to operate over a large range of conditions. The aircraft was both stable and easy to control over the entire range, and the structure was not stressed near any limits. The Photon design was not only a good design for perpetual solar endurance flight, but a good design overall. 135
151 17.0 FINAL ENERGY BALANCE The entire design analysis was completed and the power required was known, so the final energy balance diagrams were constructed. The first diagram was the energy balance on the day of the summer solstice. This was the best day for demonstrating perpetual solar endurance flight since the night was the shortest of the year. The energy balance assumed the aircraft remained in position over the location of Morgan Hill, California, which was at latitude. The latitude of the flight had a large effect on the excess solar energy available and the length of the night. A local latitude was used for the design process for simplicity. A real demonstration flight might take place at a different location for various regulatory or practical reasons, but would most likely try to stay close to the latitude of Morgan Hill, California. The energy balance diagram for the summer solstice is shown in Figure A 48 hour period was shown to emphasize this was a cycle that repeats. The 24 hour period used for the energy margin calculations was shown by the untinted region between 8:00 and 8:00 the next day. The energy balance would be the same for any 24 hour period, but this particular 24 hour period kept the battery drain area (dark red) as one continuous area. Figure 17.2 shows the energy margins for the summer solstice. There was 6.3% more solar energy available (557 W h) to charge the batteries than the capacity of the batteries (524 W h). This battery capacity was 8.4% more than the energy required if altitude was not used to store solar energy (484 W h). Even though Figure 17.1 showed how much energy could be saved by using altitude energy storage, the battery capacity was conservatively sized so that it did not depend on using altitude to store energy. Storing excess solar energy as altitude might not even be feasible if the altitude required would exceed limits imposed by regulations. If altitude storage would be feasible, the 136

152 battery capacity margin increased to 16%. This showed how beneficial altitude energy storage could be and there was plenty of extra battery capacity if altitude energy storage was employed. Figure 17.1 Energy balance diagram for Morgan Hill, California on June 21, % 8% 16% Figure 17.2 Energy margins for Morgan Hill, California on June 21,
153 The extra energy available on the summer solstice meant the Photon design could still demonstrate perpetual solar endurance on other days when the nights were longer. Figure 17.3 and Figure 17.4 show the energy balance diagram and energy margins for July 21. Altitude energy storage was considered again, but this time there was no unused solar energy to take advantage of it. The night was a little longer, so the battery margin decreased from 8.4% to 5.0%. Figure 17.3 Energy balance diagram for Morgan Hill, California on July 21,
154 0% 5% 5% Figure 17.4 Energy margins for Morgan Hill, California on July 21, 2013 July 21 was the last day of the year the Photon design could demonstrate perpetual solar endurance flight. July 21 was 30 days after the summer solstice and similar conditions existed 30 days before the summer solstice on May 22. The Photon design had a two month window from May 22, to July 21 where perpetual solar endurance flight was possible. 139
155 18.0 CONCLUSIONS The Photon solar airplane was successfully designed to achieve perpetual solar endurance flight and also satisfied FAI requirements for model airplane record attempts. Between May 22 nd and July 21 st 2013 at Morgan Hill, California there was enough solar energy available for the Photon design to fly all day and all night without landing. The Photon design only required 20.8 watts of thrust power (40 watts from the batteries) to keep the 5 kg aircraft flying. Although a successful design was created, the mission proved to be much more difficult to achieve than originally anticipated CRITICAL DESIGN PARAMETERS COMPARISON The feasibility analysis showed the Photon design required a very efficient propulsion system, a very lightweight airframe structure, and very low drag (section 4.2). The final design achieved the critical design values, as shown in Table However, the final design did not significantly exceed the requirements because they were so difficult to achieve. Exceeding the critical values would have provided a buffer and improved the chance of a successful mission. Since a buffer did not exist, detailed analysis was required to reduce the uncertainty inherent in the total propulsion system efficiency, airframe weight, and total drag values. This was why so much time was spent developing Matlab code to analyze the Photon design. When uncertainty could not be reduced, conservative assumptions were used. The careful analysis and conservative assumptions provided a high degree of confidence the Photon design met, but did not significantly exceed the critical design values. Table 18-1 Comparison of desired and achieved critical design parameters Critical Design Parameter Desired Achieved propulsion 55% 55% W airframe 1.5 kg 1.45 kg L/D
156 18.2 MISSION REQUIREMENTS COMPARISON Although the Photon design was capable of perpetual solar endurance flight, it did not meet all of the original mission requirements. Table 18-2 shows the original mission requirements and the expected performance of the final design. The stall speed requirement was slightly unmet, but this was not a serious problem because a conservative value for the stall speed was used. A more serious shortcoming of the final design was the climb rate. The climb rate was 38% lower than desired. This was a major limitation since the original climb rate requirement was low to begin with. The Photon design had very limited ability to climb out of sinking air. Sinking air that went all the way to the ground could force the Photon to land prematurely. The climb rate requirement was not satisfied because the propeller blades would stall when climb power was applied. The operating conditions for the Photon made it infeasible for the propeller design to provide both high cruise efficiency and extra thrust for climbing. This would be less of a problem for larger airplanes operating at higher Reynolds numbers. However, a high climb rate will always be challenging for perpetual solar endurance flight aircraft due to the limited excess energy available and the slow flight speeds. Table 18-2 Desired and achieved mission requirements comparison Mission Requirement Desired Achieved Met/Unmet Perpetual Solar Endurance 48 hours up to 2 months Exceeded Gross Weight 5 kg 5 kg Met Wing + Horizontal Stabilizer 1.5 m m 2 Met Stall Speed 0.83 x cruise speed 0.84 x cruise speed Slightly Unmet Cruise Speed 7.7 m/s 9.5 m/s Exceeded Climb Rate 1.5 m/s 0.93 m/s Unmet Battery Margin 10% 8.4% Unmet Solar Charging Margin 10% 6.3% Unmet The other mission requirements that were not satisfied were the battery and solar charging margins. The battery and solar charging margins were positive but less than desired. Perpetual solar endurance flight was still possible, but there was less extra energy than desired. 141
157 Any adverse conditions during flight or errors in estimating the energy required could result in mission failure. Larger margins would have been preferred, but even the 10% margin goals seemed too difficult to achieve. The margin goals may simply have been too optimistic. Given the constraints of the Photon design, perpetual solar endurance flight was possible, but it was very difficult to achieve with energy to spare MAJOR DESIGN ASSUMPTIONS The assumptions used to simplify the energy balance analysis in chapter 3.0 could ultimately determine the success or failure of the Photon design. The actual energy margins for a test flight could differ significantly from the analysis. If the actual margins were negative, the test flight would fail to achieve perpetual solar endurance flight. Some of the difference between the actual energy margins and the calculated margins might be attributable to miscalculations of the critical design parameter values (propulsion system efficiency, airframe weight, and total drag). However, since these values were calculated very carefully and conservative assumptions were used, any errors would most likely cause the energy margins to be larger than expected. If the energy margins for a test flight turned out to be negative, the cause would most likely be the assumptions used in the energy balance analysis. The major assumptions used for the Photon design were: The solar panels remained parallel to the ground at all times Clear sky with no clouds Power for cruise remained constant The effect of temperature on the solar cell efficiency was neglected None of these assumptions are likely to occur in reality, but they were made to simplify the energy balance analysis. If these assumptions were too optimistic, a flight test would fail to achieve perpetual solar endurance flight. The validity of these assumptions could be determined 142
158 in the future either by completing the complex energy balance analysis without the simplifying assumptions, or by using flight test data. The Photon design also assumed the solar panels could flex without breaking. If any solar panels cracked, perpetual solar endurance flight would probably not be possible. The solar panels had to bend to match the curvature of the upper surface of the wing. They also had to withstand the wing flex under various loads. The fragile solar panels were encapsulated in a protective film to allow the panels to bend slightly without breaking. However, it was difficult to calculate the loads on the panels under various wing flex conditions. It was also difficult to calculate what critical load would cause the panel to break, or the number of cycles before a fatigue fracture would occur. Since no solar panel flexibility calculations were performed, a conscious effort was made to reduce the stress on the solar panels. An airfoil with low upper surface curvature was selected and the wing was made extra stiff to reduce the amount it would flex. It was assumed the solar panels could handle the small amount of airfoil curvature and wing flex without breaking. If this assumption was incorrect, the Photon design would not be feasible as designed. For future solar airplane designs, an ability to calculate the amount the solar panels can flex without breaking might allow the wing structure to be designed lighter DESIGN IMPROVEMENTS Many changes and refinements had to be made to the Photon design before the design was capable of perpetual solar endurance flight. Once this was achieved, no further design iterations were made, even though additional design iterations would probably have improved the design. The Photon design was already very refined, so additional design iterations would have taken much longer and provided smaller improvements. A well rounded design, such as the Photon, performs well at both the design point and off-design conditions. Attempts to improve 143
159 the design may move the design toward a point design, sacrificing off-design performance for better design point performance. Despite the potential for design changes to make the Photon worse, there were probably some ways the Photon design could be improved. The Photon fuselage was larger than necessary so the batteries could be shifted to adjust the center of gravity location. Weight and drag could be reduced if the fuselage was redesigned to be smaller. The fuselage could even be dramatically smaller if some or all of the batteries could be moved inside the wing. However, reducing the size of the fuselage would only be prudent after the number of batteries and electronics had been finalized since they would be difficult to change in the smaller fuselage. The weight and balance would also have to be been verified to make sure the center of gravity was properly positioned. Another potential design improvement would be to optimize the airfoil shape along the entire wingspan. The modified AG34 airfoil was designed for a lower Reynolds number than the maximum Reynolds number that occurred at the wing root of the Photon design. Optimizing the airfoil shapes along the wingspan would increase the wing thickness near the root, which could allow the wing spar to be made lighter. Optimized airfoils could even reduce the wing profile drag slightly COMMENTS ON PERPETUAL SOLAR ENDURANCE FLIGHT The overall objective for the project was to explore the capabilities and limitations of a small airplane designed for perpetual solar endurance flight. The Photon design was thoroughly analyzed and its capabilities and limitation were well understood. Many characteristics of the Photon design can be generalized to any aircraft designed for perpetual solar endurance flight. Aircraft designed for perpetual solar endurance flight sacrifice a lot of performance to be able to fly for multiple days and nights. These aircraft are very energy and power limited, which 144
160 means they must cruise very slowly and they cannot climb very fast. They are also very susceptible to weather conditions. Strong headwinds may force the aircraft to move backwards over the ground. Gusty winds have the potential to break these lightweight aircraft apart in flight. Weather conditions can also block sunlight, which could force the aircraft to land. Due to these limitations, aircraft designed for perpetual solar endurance flight cannot be used the same way most aircraft are used today. Aircraft designed for perpetual solar endurance flight cannot be expected to hold altitude precisely due to their limited climb rate. A fixed altitude would be undesirable anyway since it would prevent these aircraft from taking advantage of naturally rising air or favorable winds at different altitudes. Most modern airplanes can overcome weather conditions to go where needed, but aircraft designed for perpetual solar endurance flight must operate more sailing ships. The weather has a large influence on the path they take and when they arrive at their destination. Careful planning is required and large detours may be necessary. Since aircraft capable of perpetual solar endurance flight depend on the sun, when and where they can fly depends on the local sunlight conditions. Perpetual solar endurance flight is much more difficult to achieve during winter when the nights are longer and less sunlight is available. So far, perpetual solar endurance flight has only been demonstrated during summertime. The amount of sunlight available also depends on the latitude. Latitudes near the Equator receive more sunlight and have less variation in the length of the night. Higher latitudes generally receive less sunlight and the sun angle is lower, which makes the sunlight more difficult to utilize. However, high latitudes have much shorter nights during the summer. Dramatic improvements in technology will be required before solar powered airplanes can fly for multiple days during the winter at high latitudes. 145
161 Most of the limitations of aircraft designed for perpetual solar endurance flight can be attributed to the limited energy density of the energy storage system. Only so much of an aircraft s mass can be devoted to energy storage (about 50% for the Photon design), so the energy density of the energy storage system limits how much energy can be stored. The large amount of energy storage required for night flight leaves very little mass available for payloads. This means a very large aircraft is required to carry a relatively small payload. Since the energy density of the energy storage system places so many limits on perpetual solar endurance flight, improving the energy density of energy storage systems will make the most difference in the capabilities of future aircraft. Better solar panels that are more efficient and lighter weight would help some, but the energy storage system is much more critical. Airplanes designed for perpetual solar endurance flight benefit in many ways from scaling up. A larger airplane operates at a higher Reynolds number, which reduces the skin friction drag. A larger airplane also flies faster and can carry a heavier payload. It is easier to avoid minimum gauge of material problems for a large airplane, so the structure could be more weight efficient. The efficiency of the propulsion system components is also higher for larger aircraft. If an aircraft is large enough, it can fly above normal commercial airliner traffic. High operating altitudes are especially appealing for solar powered aircraft because altitudes above the jet stream have calmer weather and clouds are less likely to form. All of the advantages for scaling up airplanes designed for perpetual solar endurance flight suggest that future designs could be some of the largest airplanes ever built. The Photon design shows that perpetual solar endurance flight is possible with current technology. Perpetual solar endurance flight will become even easier to achieve as technology continues to improve, especially as the energy density of energy storage systems increase. As 146
162 electronics continue to shrink in size and power consumption, smaller aircraft will be able to perform the missions that require perpetual solar endurance flight. The flying time of future aircraft may not be constrained by energy, but by reliability instead. Dramatic improvements in reliability will likely be required before an airplane can fly for an entire year or longer. There are currently few airplanes with the ability to fly all day and all night since perpetual solar endurance flight is a relatively new capability. Continued improvements in technology and the demand for aircraft to perform extreme endurance missions make it likely there will be more aircraft flying all day and all night in the future BATTERY ENERGY DENSITY CORRECTION During the final stages of reviewing this paper, more accurate specifications for the Panasonic NCR18650B batteries were found. The energy density for the batteries should have been 254 W h/kg instead of 265 W h/kg used in the report. The corrected battery energy density changed the results slightly. Instead of a 6.3% solar charging margin and an 8.4% battery capacity margin, the corrected margins would be 7.4% for the solar charging margin, and 7.3% for the battery capacity margin. The battery weight would be slightly higher, but still well within the weight margin of the design. 147
163 REFERENCES 1 AC Propulsion, AC Propulsion s Solar Electric Powered Solong UAV, URL: [cited 7 July 2007]. 2 Baldock, N. and Mokhtarzadeh-Dehghan, M.R., A Study of Solar-Powered, High-Altitude Unmanned Aerial Vehicles, Aircraft Engineering and Aerospace Technology: An International Journal, Vol. 78, No. 3, 2006, pp Bird, R.E., and Hulstrom, R.L., A Simplified Clear Sky Model for Direct and Diffuse Insolation on Horizontal Surfaces, Technical Report No. SERI/TR , Golden, CO: Solar Energy Research Institute, Boucher, R. J., History of Solar Flight, 20 th Joint Propulsion Conference, AIAA , Cincinnati, Ohio, USA, June Boucher, R. J., Sunrise: The World s First Solar-Powered Airplane, Journal of Aircraft, Vol. 22, No. 10, 1985, pp Brandt, S.A. and Gilliam, F.T., Design Analysis Methodology for Solar-Powered Aircraft, Journal of Aircraft, Vol. 32, No. 4, 1995, pp Capable Computing, MotoCalc Electric Flight Performance Prediction Software, URL: [cited 2 December 2012]. 8 Cessna Aircraft Company, Pilot s Operating Handbook: Skyhawk 1978 Model 172N, URL: [cited 29 November 2012]. 9 Colella, N.J. and Wenneker, G.S, Pathfinder: Developing a Solar Rechargeable Aircraft, Potentials, IEEE, Vol. 15, No. 1, 1996, pp Colozza, A.J., Convective Array Cooling for a Solar Powered Aircraft, NASA CR , Colozza, A.J., Effect of Power System Technology and Mission Requirements on High Altitude Long Endurance Aircraft, NASA CR , Drela, M., AVL, URL: [cited 14 November 2012]. 13 Drela, M., QPROP/QMIL, URL: [cited 14 November 2012]. 14 Drela, M., XFOIL, URL: [cited 14 November 2012]. 148
164 15 Duranti, S., Profili Software for Wing Airfoils Managing, Drawing and Analysis, URL: [cited 2 December 2012]. 16 Federal Aviation Administration, AC URL: media/advisory_circular/91-57.pdf [cited 19 January 2013]. 17 Fédération Aéronautique Internationale, FAI Sporting Code, Vol. ABR, Section 4A, 4B, 4C, 2013 ed., URL: [cited 19 January 2013]. 18 Gofman, E., Energy Density of Aviation Fuel, URL: EvelynGofman.shtml [cited 16 December 2012]. 19 Hall, D.W., Fortenbach, C.D., Dimiceli, E.V., and Parks, R.W., A Preliminary Study of Solar Powered Aircraft and Associated Power Trains, NASA CR-3699, Hall, D.W. and Hall, S.A., Structural Sizing of a Solar Powered Aircraft, NASA CR , Irving, F. G. and Morgan, D., The Feasibility of an Aircraft Propelled by Solar Energy, 2nd International Symposium on the Technology and Science of Low Speed and Motorless Flight, AIAA , Cambridge, MA, September Jackman, T., Charles River Radio Controllers - Mark Drela's Bubble Dancer 3m Sailplane, URL: 3m.htm [cited 29 November 2012]. 23 Jeti Model s.r.o., Spin Pro 22, URL: &id=224 [cited 1 December 2012]. 24 Klesh, A.T. and Kabamba, P.T., Solar-Powered Aircraft: Energy-Optimal Path Planning and Perpetual Endurance, Journal of Guidance, Control, and Dynamics, Vol. 32, No. 4, 2009, pp Leutenegger, S., Jabas, M., and Siegwart, R.Y., Solar Airplane Conceptual Design and Performance Estimation, Journal of Intelligent and Robotic Systems, Vol. 61, No. 4, 2011, pp Nickol, C.L., Guynn, M.D., Kohout, L.L., and Ozoroski, T.A., High Altitude Long Endurance UAV Analysis of Alternatives and Technology Requirements Development, NASA TP , Noth, A., Design of Solar Powered Airplanes for Continuous Flight, Ph.D. Dissertation, Autonomous Systems Lab, ETH Zürich, Switzerland,
165 28 Ma, D., Shiau, J., Su, Y., and Chen, Y., Optimal Level Turn of Solar-Powered Unmanned Aerial Vehicle Flying in Atmosphere, Journal of Guidance, Control, and Dynamics, Vol. 33, No. 5, 2010, pp MacCready, P. B., Lissaman, P.B.S., Morgan, W.R., and Burke, J.D., Sun-Powered Aircraft Designs, Journal of Aircraft, Vol. 20, No. 6, 1983, pp Meyer, J., du Plessis, J.A.F., Ellis, P., Clark, W., Design Considerations for a Low Altitude Long Endurance Solar Powered Unmanned Aerial Vehicle, 8 th IEEE AFRICON Conference, Windhoek, Namibia, September Model Motors s.r.o., AXI 2217/20 Gold Line, URL: [cited 1 December 2012]. 32 Model Motors s.r.o., Planetary Gearbox - VMGM, URL: index.php?page=106 [cited 1 December 2012]. 33 Morris, C.E.K., Parametric Study of Microwave-Powered High-Altitude Airplane Platforms Designed for Linear Flight, NASA TP-1918, Panasonic, NCR18650, URL: BA+3+ACA4001+NCR WW [cited 19 January 2013]. 35 Panasonic, NCR18650A, URL: BA+3+ACA4001+NCR18650A+7+WW [cited 19 January 2013]. 36 Panasonic, NCR18650B, URL: BA+4+ACA4001+NCR18650B+8+WW [cited 19 January 2013] Phillips, W.H., Some Design Considerations for Solar-Powered Aircraft, NASA TP-1675, 38 QinetiQ, QinetiQ s Zephyr solar powered unmanned aircraft soars to new world records, URL: [cited 22 November 2012]. 39 Rizzo E. and Frediani, A., A Model for Solar Powered Aircraft Preliminary Design, The Aeronautical Journal, Vol. 112, No. 1128, 2008, pp Romeo, G., Frulla, G., and Cestino, E., Design of a High-Altitude Long-Endurance Solar- Powered Unmanned Air Vehicle for Multi-Payload and Operations, Institution of Mechanical Engineers, Part G: Journal of Aerospace Engineering, Vol. 221, No. 2, 2007, pp
166 41 Romeo, G., Frulla, G., Cestino, E., and Corsino, G., Heliplat: Design, Aerodynamic, Structural Analysis of Long-Endurance Solar-Powered Stratospheric Platform, Journal of Aircraft, Vol. 41, No. 6, 2004, pp Roper, C., The Daedalus Project, URL: co.uk/html/daedalus.html [cited 29 November 2012]. 43 Shiau, J., Ma, D., and Chiu, C., Optimal Sizing and Cruise Speed Determination for a Solar-Powered Airplane, Journal of Aircraft, Vol. 47, No. 2, 2010, pp Solar Impulse, Solar Impulse, URL: [cited 22 November 2012]. 45 Spangelo, S.C., Gilbert, E.G., Klesh, A.T., Kabamba, P.T, and Girard, A.R., Periodic Energy-Optimal Path Planning for Solar-Powered Aircraft, Guidance Navigation and Control Conference, AIAA , Chicago, Illinois, August Sunpower Corporation, A-300 Solar Cell, URL: files/a-300%20data%20sheet.pdf [cited 29 November 2012]. 47 Tegeder, T., Development of an Efficient Solar Powered Unmanned Aerial Vehicle with an Onboard Solar Tracker, Master s project, Dept. of Mechanical Engineering, Brigham Young Univ., Timoshenko, S., Strength of Materials, Part I: Elementary Theory and Problems, 2 nd ed., D. Van Nostrand Company, Inc., New York, 1940, Chaps. 5, Whitfield, C.A., An Adaptive Dual-Optimal Path-Planning Technique for Unmanned Air Vehicles With Application to Solar-Regenerative High Altitude Long Endurance Flight, Ph.D. Dissertation, Dept. of Mechanical and Aerospace Engineering, Ohio State Univ., Wickenheiser, A.M. and Garcia, E., Conceptual Design Considerations for Microwave and Solar-Powered Fuel-Less Aircraft, Journal of Aircraft, Vol. 46, No. 2, 2009, pp Wilkins, G., Fourie, D., and Meyer, J., Critical Design Parameters for a Low Altitude Long Endurance Solar Powered UAV, 9 th IEEE AFRICON Conference, Nairobi, Kenya, September Youngblood, J.W. and Talay, T.A., Solar-Powered Airplane Design for Long-Endurance High-Altitude Flight, 2nd AIAA International Very Large Vehicles Conference, AIAA , Washington, DC, May
167 APPENDICES Appendix A: Solar Irradiation Data for Morgan Hill, California Bird model global radiation incident upon a horizontal surface (W/m 2 ) Time June 21, 2013 July 21, :30 AM :00 AM :30 AM :00 AM :30 AM :00 AM :30 AM :00 AM :30 AM :00 AM :30 AM :00 AM :30 AM :00 PM :30 PM :00 PM :30 PM :00 PM :30 PM :00 PM :30 PM :00 PM :30 PM :00 PM :30 PM :00 PM :30 PM :00 PM :30 PM :00 PM :30 PM
168 Appendix B: Weather Data for Morgan Hill, California in July 2012 Source: KCAMORGA13&graphspan=month&month=7&day=23&year=

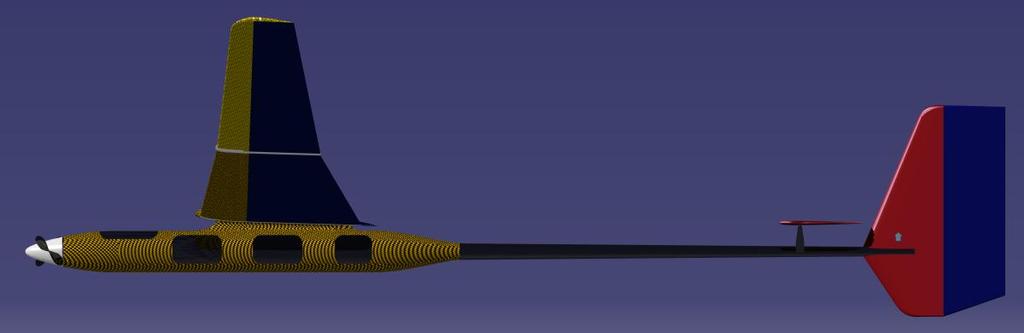
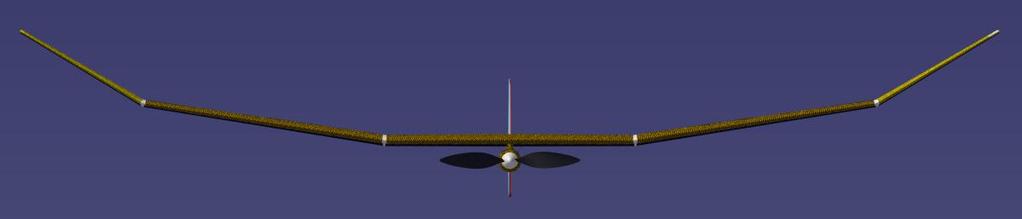
169 Appendix C: 3-View Renderings 154
Solar Glider. ENG460 Engineering Thesis Final Report. Ben Marshall,
 Solar Glider ENG460 Engineering Thesis Final Report Ben Marshall, 30769634 2012 A report submitted to the School of Engineering and Energy, Murdoch University in partial fulfilment of the requirements
Electric Flight Potential and Limitations
 Electric Flight Potential and Limitations Energy Efficient Aircraft Configurations, Technologies and Concepts of Operation, Sao José dos Campos, 19 21 November 2013 Dr. Martin Hepperle DLR Institute of
Solar Based Propulsion System UAV Conceptual Design ( * )
") Solar Based Propulsion System UAV Conceptual Design ( * ) Avi Ayele*, Ohad Gur, and Aviv Rosen* *Technion Israel Institute of Technology IAI Israel Aerospace Industries (*) Ayele A., Gur O., Rosen A.,
Solar Based Propulsion System UAV Conceptual Design ( * ) Avi Ayele*, Ohad Gur, and Aviv Rosen* *Technion Israel Institute of Technology IAI Israel Aerospace Industries (*) Ayele A., Gur O., Rosen A.,
Performance means how fast will it go? How fast will it climb? How quickly it will take-off and land? How far it will go?
 Performance Concepts Speaker: Randall L. Brookhiser Performance means how fast will it go? How fast will it climb? How quickly it will take-off and land? How far it will go? Let s start with the phase
Preface. Acknowledgments. List of Tables. Nomenclature: organizations. Nomenclature: acronyms. Nomenclature: main symbols. Nomenclature: Greek symbols
 Contents Preface Acknowledgments List of Tables Nomenclature: organizations Nomenclature: acronyms Nomenclature: main symbols Nomenclature: Greek symbols Nomenclature: subscripts/superscripts Supplements
A SOLAR POWERED UAV. 1 Introduction. 2 Requirements specification
 A SOLAR POWERED UAV Students: R. al Amrani, R.T.J.P.A. Cloosen, R.A.J.M. van den Eijnde, D. Jong, A.W.S. Kaas, B.T.A. Klaver, M. Klein Heerenbrink, L. van Midden, P.P. Vet, C.J. Voesenek Project tutor:
Appenidix E: Freewing MAE UAV analysis
 Appenidix E: Freewing MAE UAV analysis The vehicle summary is presented in the form of plots and descriptive text. Two alternative mission altitudes were analyzed and both meet the desired mission duration.
Jay Gundlach AIAA EDUCATION SERIES. Manassas, Virginia. Joseph A. Schetz, Editor-in-Chief. Blacksburg, Virginia. Aurora Flight Sciences
 Jay Gundlach Aurora Flight Sciences Manassas, Virginia AIAA EDUCATION SERIES Joseph A. Schetz, Editor-in-Chief Virginia Polytechnic Institute and State University Blacksburg, Virginia Published by the
The Airplane That Could!
 The Airplane That Could! Critical Design Review December 6 th, 2008 Haoyun Fu Suzanne Lessack Andrew McArthur Nicholas Rooney Jin Yan Yang Yang Agenda Criteria Preliminary Designs Down Selection Features
DESIGN AND DEVELOPMENT OF A MICRO AIR VEHICLE (µav) CONCEPT: PROJECT BIDULE
 CONCEPT: PROJECT BIDULE") DESIGN AND DEVELOPMENT OF A MICRO AIR VEHIE (µav) CONCEPT: PROJECT BIDULE Mr T. Spoerry, Dr K.C. Wong School of Aerospace, Mechanical and Mechatronic Engineering University of Sydney NSW 6 Abstract This
DESIGN AND DEVELOPMENT OF A MICRO AIR VEHIE (µav) CONCEPT: PROJECT BIDULE Mr T. Spoerry, Dr K.C. Wong School of Aerospace, Mechanical and Mechatronic Engineering University of Sydney NSW 6 Abstract This
AIRCRAFT DESIGN SUBSONIC JET TRANSPORT
 AIRCRAFT DESIGN SUBSONIC JET TRANSPORT Analyzed by: Jin Mok Professor: Dr. R.H. Liebeck Date: June 6, 2014 1 Abstract The purpose of this report is to design the results of a given specification and to
Reducing Landing Distance
 Reducing Landing Distance I've been wondering about thrust reversers, how many kinds are there and which are the most effective? I am having a debate as to whether airplane engines reverse, or does something
How to use the Multirotor Motor Performance Data Charts
 How to use the Multirotor Motor Performance Data Charts Here at Innov8tive Designs, we spend a lot of time testing all of the motors that we sell, and collect a large amount of data with a variety of propellers.
XIV.C. Flight Principles Engine Inoperative
 XIV.C. Flight Principles Engine Inoperative References: FAA-H-8083-3; POH/AFM Objectives The student should develop knowledge of the elements related to single engine operation. Key Elements Elements Schedule
AE 451 Aeronautical Engineering Design Final Examination. Instructor: Prof. Dr. Serkan ÖZGEN Date:
 Instructor: Prof. Dr. Serkan ÖZGEN Date: 11.01.2012 1. a) (8 pts) In what aspects an instantaneous turn performance is different from sustained turn? b) (8 pts) A low wing loading will always increase
The Deployable Gage Restraint Measurement System - Description and Operational Performance
 The Deployable Gage Restraint Measurement System - Description and Operational Performance GARY A. MARTIN ENSCO, INC 5400 PORT ROYAL ROAD SPRINGFIELD, VA 22151 703-321-4513 703-321-7619 (FAX) JEFFREY A.
Rocket Activity Advanced High- Power Paper Rockets
 Rocket Activity Advanced High- Power Paper Rockets Objective Design and construct advanced high-power paper rockets for specific flight missions. National Science Content Standards Unifying Concepts and
Development of an Efficient Solar Powered Unmanned Aerial Vehicle with an Onboard Solar Tracker
 Brigham Young University BYU ScholarsArchive All Theses and Dissertations 2007-03-10 Development of an Efficient Solar Powered Unmanned Aerial Vehicle with an Onboard Solar Tracker Troy Dixon Tegeder Brigham
Environmentally Focused Aircraft: Regional Aircraft Study
 Environmentally Focused Aircraft: Regional Aircraft Study Sid Banerjee Advanced Design Product Development Engineering, Aerospace Bombardier International Workshop on Aviation and Climate Change May 18-20,
Design Considerations for Stability: Civil Aircraft
 Design Considerations for Stability: Civil Aircraft From the discussion on aircraft behavior in a small disturbance, it is clear that both aircraft geometry and mass distribution are important in the design
High Speed, Low Weight Momentum/reaction Wheels. Larry Wilhide, Valley Forge Composite Tech, Inc. P.O. Box 344 Carlisle, PA (717)
") SSC99-XI-1 High Speed, Low Weight Momentum/reaction Wheels, Valley Forge Composite Tech, Inc. P.O. Box 344 Carlisle, PA 17013 (717) 776-3249 Louis Brothers, Valley Forge Composite Tech, Inc. P.O. Box 344
SSC99-XI-1 High Speed, Low Weight Momentum/reaction Wheels, Valley Forge Composite Tech, Inc. P.O. Box 344 Carlisle, PA 17013 (717) 776-3249 Louis Brothers, Valley Forge Composite Tech, Inc. P.O. Box 344
External Aerodynamics: Lift of airship created only by buoyancy which doesn t need lift generating surface like an airfoil or a wing
 5.1 AERODYNAMICS: The HAA aerodynamic regime could broadly be categorized into External and Internal Aerodynamics. The External Aerodynamics deals with the Shape of airship and the internal aerodynamics
NASA centers team up to tackle sonic boom 18 March 2014, by Frank Jennings, Jr.
 NASA centers team up to tackle sonic boom 18 March 2014, by Frank Jennings, Jr. This rendering shows the Lockheed Martin future supersonic advanced concept featuring two engines under the wings and one
The following slideshow and talk were presented at the Uber Elevate Summit on April 25 th, The text included here is an approximate transcript
 The following slideshow and talk were presented at the Uber Elevate Summit on April 25 th, 2017. The text included here is an approximate transcript of the speech given by Jay Carter, founder and CEO of
Conceptual Design of a Model Solar-Powered Unmanned Aerial Vehicle
 50th AIAA Aerospace Sciences Meeting including the New Horizons Forum and Aerospace Exposition 09-12 January 2012, Nashville, Tennessee AIAA 2012-0134 Conceptual Design of a Model Solar-Powered Unmanned
1.1 REMOTELY PILOTED AIRCRAFTS
 CHAPTER 1 1.1 REMOTELY PILOTED AIRCRAFTS Remotely Piloted aircrafts or RC Aircrafts are small model radiocontrolled airplanes that fly using electric motor, gas powered IC engines or small model jet engines.
Revisiting the Calculations of the Aerodynamic Lift Generated over the Fuselage of the Lockheed Constellation
 Eleventh LACCEI Latin American and Caribbean Conference for Engineering and Technology (LACCEI 2013) International Competition of Student Posters and Paper, August 14-16, 2013 Cancun, Mexico. Revisiting
Chapter 11: Flow over bodies. Lift and drag
 Chapter 11: Flow over bodies. Lift and drag Objectives Have an intuitive understanding of the various physical phenomena such as drag, friction and pressure drag, drag reduction, and lift. Calculate the
VoltAir All-electric Transport Concept Platform
 VoltAir All-electric Transport Concept Platform VoltAir All-electric propulsion system concepts for future air vehicle applications are being developed by EADS INNOVATION WORKS, the corporate research
M:2:I Milestone 2 Final Installation and Ground Test
 Iowa State University AerE 294X/AerE 494X Make to Innovate M:2:I Milestone 2 Final Installation and Ground Test Author(s): Angie Burke Christopher McGrory Mitchell Skatter Kathryn Spierings Ryan Story
AN ADVANCED COUNTER-ROTATING DISK WING AIRCRAFT CONCEPT Program Update. Presented to NIAC By Carl Grant November 9th, 1999
 AN ADVANCED COUNTER-ROTATING DISK WING AIRCRAFT CONCEPT Program Update Presented to NIAC By Carl Grant November 9th, 1999 DIVERSITECH, INC. Phone: (513) 772-4447 Fax: (513) 772-4476 email: carl.grant@diversitechinc.com
Powertrain Design for Hand- Launchable Long Endurance Unmanned Aerial Vehicles
 Powertrain Design for Hand- Launchable Long Endurance Unmanned Aerial Vehicles Stuart Boland Derek Keen 1 Justin Nelson Brian Taylor Nick Wagner Dr. Thomas Bradley 47 th AIAA/ASME/SAE/ASEE JPC Outline
Development of a Variable Stability, Modular UAV Airframe for Local Research Purposes
 Development of a Variable Stability, Modular UAV Airframe for Local Research Purposes John Monk Principal Engineer CSIR, South Africa 28 October 2008 Outline A Brief History of UAV Developments at the
ECO-CARGO AIRCRAFT. ISSN: International Journal of Science, Engineering and Technology Research (IJSETR) Volume 1, Issue 2, August 2012
 Volume 1, Issue 2, August 2012") ECO-CARGO AIRCRAFT Vikrant Goyal, Pankhuri Arora Abstract- The evolution in aircraft industry has brought to us many new aircraft designs. Each and every new design is a step towards a greener tomorrow.
ECO-CARGO AIRCRAFT Vikrant Goyal, Pankhuri Arora Abstract- The evolution in aircraft industry has brought to us many new aircraft designs. Each and every new design is a step towards a greener tomorrow.
Mars Surface Mobility Proposal
 Mars Surface Mobility Proposal Jeremy Chavez Ryan Green William Mullins Rachel Rodriguez ME 4370 Design I October 29, 2001 Background and Problem Statement In the 1960s, the United States was consumed
VAST AUAV (Variable AirSpeed Telescoping Additive Unmanned Air Vehicle)
") VAST AUAV (Variable AirSpeed Telescoping Additive Unmanned Air Vehicle) Michael Stern & Eli Cohen MIT Lincoln Laboratory RAPID 2013 June 11 th, 2013 This work is sponsored by the Air Force under Air Force
VAST AUAV (Variable AirSpeed Telescoping Additive Unmanned Air Vehicle) Michael Stern & Eli Cohen MIT Lincoln Laboratory RAPID 2013 June 11 th, 2013 This work is sponsored by the Air Force under Air Force
Preliminary Design of Solar Powered Unmanned Aerial Vehicle Sumit Jashnani a, Prashant Shaholia b, Ali Khamker c, Muhammad Ishfaq d, and Tarek Nada e
 Preliminary Design of Solar Powered Unmanned Aerial Vehicle Sumit Jashnani a, Prashant Shaholia b, Ali Khamker c, Muhammad Ishfaq d, and Tarek Nada e Emirates Aviation College, PO Box 53044, Dubai, UAE
Part II. HISTORICAL AND ENGINEERING ANALYSIS OF AIRSHIP PLAN-AND- DESIGN AND SERVICE DECISIONS
 CONTENTS MONOGRAPHER S FOREWORD DEFENITIONS, SYMBOLS, ABBREVIATIONS, AND INDICES Part I. LAWS AND RULES OF AEROSTATIC FLIGHT PRINCIPLE Chapter 1. AIRCRAFT FLIGHT PRINCIPLE 1.1 Flight Principle Classification
Flight Test Evaluation of C-130H Aircraft Performance with NP2000 Propellers
 Flight Test Evaluation of C-130H Aircraft Performance with NP2000 Propellers Lance Bays Lockheed Martin - C-130 Flight Sciences Telephone: (770) 494-8341 E-Mail: lance.bays@lmco.com Introduction Flight
Rotary Wing Micro Air Vehicle Endurance
 Rotary Wing Micro Air Vehicle Endurance Klaus-Peter Neitzke University of Applied Science Nordhausen, Nordhausen, Germany neitzke@fh-nordhausen.de Abstract One of the first questions to pilots of rotor
FLASHCARDS AIRCRAFT. Courtesy of the Air Safety Institute, a Division of the AOPA Foundation, and made possible by AOPA Services Corporation.
 AIRCRAFT FLASHCARDS Courtesy of the Air Safety Institute, a Division of the AOPA Foundation, and made possible by AOPA Services Corporation. Knowing your aircraft well is essential to safe flying. These
LEAD SCREWS 101 A BASIC GUIDE TO IMPLEMENTING A LEAD SCREW ASSEMBLY FOR ANY DESIGN
 LEAD SCREWS 101 A BASIC GUIDE TO IMPLEMENTING A LEAD SCREW ASSEMBLY FOR ANY DESIGN Released by: Keith Knight Kerk Products Division Haydon Kerk Motion Solutions Lead Screws 101: A Basic Guide to Implementing
Climber is 776B101101
 is Climber 776B101101 Introduction Product Introduction NE R/C 776B is a good-sized glider designed by Nine Eagles Company latest, whose wing span is up to 2008mm. You only need to assemble the aerofoil
10th Australian International Aerospace Congress
 AUSTRALIAN INTERNATIONAL AEROSPACE CONGRESS Paper presented at the 10th Australian International Aerospace Congress incorporating the 14th National Space Engineering Symposium 2003 29 July 1 August 2003
THE ANALYSIS OF WING PERFORMANCE FOR RECONNAISSANCE UAV ZULKIFLI BIN YUSOF UNIVERSITI MALAYSIA PAHANG
 THE ANALYSIS OF WING PERFORMANCE FOR RECONNAISSANCE UAV ZULKIFLI BIN YUSOF UNIVERSITI MALAYSIA PAHANG The Analysis of Wing Performance for Reconnaissance UAV ZULKIFLI BIN YUSOF Report submitted in partial
Electric Penguin s philosophy:
 UNMANNED PLATFORMS AND SUBSYSTEMS Datasheet v 1.1 Penguin BE Electric Unmanned Platform Up to 110 minutes of endurance 2 with 2.8 kg payload 23 liters of payload volume Quick replaceable battery cartridge
Propeller Blade Bearings for Aircraft Open Rotor Engine
 NTN TECHNICAL REVIEW No.84(2016) [ New Product ] Guillaume LEFORT* The Propeller Blade Bearings for Open Rotor Engine SAGE2 were developed by NTN-SNR in the frame of the Clean Sky aerospace programme.
AIAA Foundation Undergraduate Team Aircraft Design Competition. RFP: Cruise Missile Carrier
 AIAA Foundation Undergraduate Team Aircraft Design Competition RFP: Cruise Missile Carrier 1999/2000 AIAA FOUNDATION Undergraduate Team Aircraft Design Competition I. RULES 1. All groups of three to ten
Chapter 10 Parametric Studies
 Chapter 10 Parametric Studies 10.1. Introduction The emergence of the next-generation high-capacity commercial transports [51 and 52] provides an excellent opportunity to demonstrate the capability of
AIRCRAFT DESIGN MADE EASY. Basic Choices and Weights. By Chris Heintz
 AIRCRAFT DESIGN MADE EASY By Chris Heintz The following article, which is a first installement of a two-part article, describes a simple method for the preliminary design of an airplane of conventional
Flugzeugentwurf / Aircraft Design SS Part 35 points, 70 minutes, closed books. Prof. Dr.-Ing. Dieter Scholz, MSME. Date:
 DEPARTMENT FAHRZEUGTECHNIK UND FLUGZEUGBAU Flugzeugentwurf / Aircraft Design SS 2015 Duration of examination: 180 minutes Last Name: Matrikelnummer: First Name: Prof. Dr.-Ing. Dieter Scholz, MSME Date:
Team Introduction Competition Background Current Situation Project Goals Stakeholders Use Scenario Customer Needs Engineering Requirements
 Team Introduction Competition Background Current Situation Project Goals Stakeholders Use Scenario Customer Needs Engineering Requirements Constraints Project Plan Risk Analysis Questions Christopher Jones
Lockheed Martin. Team IDK Seung Soo Lee Ray Hernandez Chunyu PengHarshal Agarkar
 Lockheed Martin Team IDK Seung Soo Lee Ray Hernandez Chunyu PengHarshal Agarkar Abstract Lockheed Martin has developed several different kinds of unmanned aerial vehicles that undergo harsh forces when
Title Goes Here and Can Run Solar Photovoltaic up to 3 lines as shown here Systems as you see
 Title Goes Here and Can Run Solar Photovoltaic up to 3 lines as shown here Systems as you see CHAPTER 2 Outline the components of a solar photovoltaic system Describe the operation of a solar photovoltaic
Electric VTOL Aircraft
 Electric VTOL Aircraft Subscale Prototyping Overview Francesco Giannini fgiannini@aurora.aero 1 08 June 8 th, 2017 Contents Intro to Aurora Motivation & approach for the full-scale vehicle Technical challenges
Multirotor UAV propeller development using Mecaflux Heliciel
 Multirotor UAV propeller development using Mecaflux Heliciel Sale rates of multirotor unmanned aerial vehicles, for both private and commercial uses, are growing very rapidly these days. Even though there
Design, Fabrication and Testing of an Unmanned Aerial Vehicle Catapult Launcher
 ISBN 978-93-84422-40-0 Proceedings of 2015 International Conference on Computing Techniques and Mechanical Engineering (ICCTME 2015) Phuket, October 1-3, 2015, pp. 47-53 Design, Fabrication and Testing
Exploration 4: Rotorcraft Flight and Lift
 Exploration 4: Rotorcraft Flight and Lift Students use appropriate terminology to describe the various stages of flight and discover that the lift force changes with the amount of air moved by the rotor
SOLAR GRASS CUTTER VPMP POLYTECHNIC GANDHNAGAR
 2017-18 SOLAR GRASS CUTTER VPMP POLYTECHNIC GANDHNAGAR CERTIFICATE V.P.M.P. Polytechnic, Sector-15 Gandhinagar Date: This is to certify that dissertation entailed Solar Grass Cutter has been carried out
Design of a High Altitude Fixed Wing Mini UAV Aerodynamic Challenges
 Design of a High Altitude Fixed Wing Mini UAV Aerodynamic Challenges Hemant Sharma 1, C. S. Suraj 2, Roshan Antony 3, G. Ramesh 4, Sajeer Ahmed 5 and Prasobh Narayan 6 1, 2, 3, 4 CSIR National Aerospace
On-Demand Mobility Electric Propulsion Roadmap
 On-Demand Mobility Electric Propulsion Roadmap Mark Moore, ODM Senior Advisor NASA Langley Research Center EAA AirVenture, Oshkosh July 22, 2015 NASA Distributed Electric Propulsion Research Rapid, early
Chapter 7: Thermal Study of Transmission Gearbox
 Chapter 7: Thermal Study of Transmission Gearbox 7.1 Introduction The main objective of this chapter is to investigate the performance of automobile transmission gearbox under the influence of load, rotational
Cable Dragging Horizontal Takeoff Spacecraft Air Launch System
 Cable Dragging Horizontal Takeoff Spacecraft Air Launch System Author: Zhixian Lin December 31, 2017 i Contents Abstract...ii 1. Cable Dragging Horizontal Takeoff Spacecraft Air Launch System... 1 2. The
Aeroelasticity and Fuel Slosh!
 Aeroelasticity and Fuel Slosh! Robert Stengel, Aircraft Flight Dynamics! MAE 331, 2016 Learning Objectives Aerodynamic effects of bending and torsion Modifications to aerodynamic coefficients Dynamic coupling
Modeling, Structural & CFD Analysis and Optimization of UAV
 Modeling, Structural & CFD Analysis and Optimization of UAV Dr Lazaros Tsioraklidis Department of Unified Engineering InterFEA Engineering, Tantalou 7 Thessaloniki GREECE Next Generation tools for UAV
Design and Simulation of New Versions of Tube Launched UAV
 21st International Congress on Modelling and Simulation, Gold Coast, Australia, 29 Nov to 4 Dec 2015 www.mssanz.org.au/modsim2015 Design and Simulation of New Versions of Tube Launched UAV Y. Zhou and
Welcome to Aerospace Engineering
 Welcome to Aerospace Engineering DESIGN-CENTERED INTRODUCTION TO AEROSPACE ENGINEERING Notes 5 Topics 1. Course Organization 2. Today's Dreams in Various Speed Ranges 3. Designing a Flight Vehicle: Route
The Magic of Electric Flying or. Volts and Amps for Dummies By John Wheater
 The Magic of Electric Flying or Volts and Amps for Dummies By John Wheater IT SEEMS there are many who are confused with what goes where and why and what motor and prop should be used on what battery and
Martin J. L. Turner. Expedition Mars. Published in association with. Chichester, UK
 Martin J. L. Turner Expedition Mars Springer Published in association with Praxis Publishing Chichester, UK Contents Preface Acknowledgements List of illustrations, colour plates and tables xi xv xvii
Exploration 2: How Do Rotorcraft Fly?
 Exploration 2: How Do Rotorcraft Fly? Students choose a model and use it to explore rotorcraft flight. They use a fair test and conclude that a spinning rotor is required for a rotorcraft to fly. Main
UNCLASSIFIED FY 2017 OCO. FY 2017 Base
 Exhibit R-2, RDT&E Budget Item Justification: PB 2017 Air Force Date: February 2016 3600: Research, Development, Test & Evaluation, Air Force / BA 2: Applied Research COST ($ in Millions) Prior Years FY
White Paper. How Do I Know I Can Rely on It? The Business and Technical Cases for Solar-Recharged Video Surveillance Systems
 White Paper How Do I Know I Can Rely on It? The Business and Technical Cases for Solar-Recharged Video Surveillance Systems Introduction Remote cameras are a security professional s eyes at the edges of
Running head: GYROSCOPIC STABILIZATION VS. STABILIZATION FINS 1
 Running head: GYROSCOPIC STABILIZATION VS. STABILIZATION FINS 1 Gyroscopic Stabilization vs. Stabilization fins in Model Rocketry Donald S. Corp, Maccoy G. Merrell Waxahachie Global High School January
SAE Baja - Drivetrain
 SAE Baja - Drivetrain By Ricardo Inzunza, Brandon Janca, Ryan Worden Team 11 Engineering Analysis Document Submitted towards partial fulfillment of the requirements for Mechanical Engineering Design I
Design of 'Iris', a Small Autonomous Surveillance UAV
 Utah State University DigitalCommons@USU Mechanical and Aerospace Engineering Faculty Publications Mechanical and Aerospace Engineering 1-9-2006 Design of 'Iris', a Small Autonomous Surveillance UAV Jennifer
There are several technological options to fulfill the storage requirements. We cannot use capacitors because of their very poor energy density.
 ET3034TUx - 7.5.1 - Batteries 1 - Introduction Welcome back. In this block I shall discuss a vital component of not only PV systems but also renewable energy systems in general. As we discussed in the
Y. Lemmens, T. Benoit, J. de Boer, T. Olbrechts LMS, A Siemens Business. Real-time Mechanism and System Simulation To Support Flight Simulators
 Y. Lemmens, T. Benoit, J. de Boer, T. Olbrechts LMS, A Siemens Business Real-time Mechanism and System Simulation To Support Flight Simulators Smarter decisions, better products. Contents Introduction
AE 451 Aeronautical Engineering Design I Estimation of Critical Performance Parameters. Prof. Dr. Serkan Özgen Dept. Aerospace Engineering Fall 2015
 AE 451 Aeronautical Engineering Design I Estimation of Critical Performance Parameters Prof. Dr. Serkan Özgen Dept. Aerospace Engineering Fall 2015 Airfoil selection The airfoil effects the cruise speed,
INVESTIGATION OF ICING EFFECTS ON AERODYNAMIC CHARACTERISTICS OF AIRCRAFT AT TSAGI
 INVESTIGATION OF ICING EFFECTS ON AERODYNAMIC CHARACTERISTICS OF AIRCRAFT AT TSAGI Andreev G.T., Bogatyrev V.V. Central AeroHydrodynamic Institute (TsAGI) Abstract Investigation of icing effects on aerodynamic
PENGUIN B UAV PLATFORM
 UNMANNED PLATFORMS AND SUBSYSTEMS Datasheet v.0 PENGUIN B UAV PLATFORM Penguin B platform ready for payload and autopilot integration 0+ hour endurance Fuel injected engine option Up to 10 kg payload capacity
STRUCTURAL DESIGN AND ANALYSIS OF ELLIPTIC CYCLOCOPTER ROTOR BLADES
 16 TH INTERNATIONAL CONFERENCE ON COMPOSITE MATERIALS STRUCTURAL DESIGN AND ANALYSIS OF ELLIPTIC CYCLOCOPTER ROTOR BLADES In Seong Hwang 1, Seung Yong Min 1, Choong Hee Lee 1, Yun Han Lee 1 and Seung Jo
Section 2: Basic Aerobatics
 Section 2: Basic Aerobatics Airplane Considerations and Control Setup Primary to Aerobatic Airplane Transition Parallel Positioning B-34 Basic Aerobatics Introduction Aerobatics is unarguably the most
Aircraft Design Conceptual Design
 Université de Liège Département d Aérospatiale et de Mécanique Aircraft Design Conceptual Design Ludovic Noels Computational & Multiscale Mechanics of Materials CM3 http://www.ltas-cm3.ulg.ac.be/ Chemin
Wing Cuff Design for Cessna CJ1
 Wing Cuff Design for Cessna CJ1 AAE 415 Project Purdue University Saturday, December 10th, 2004 Brian Adams Kevin Clark Greg Davidson Phil Spindler Contents Background of Problem Literature Review Design
Remote Control Helicopter. Engineering Analysis Document
 Remote Control Helicopter By Abdul Aldulaimi, Travis Cole, David Cosio, Matt Finch, Jacob Ruechel, Randy Van Dusen Team 04 Engineering Analysis Document Submitted towards partial fulfillment of the requirements
AT-10 Electric/HF Hybrid VTOL UAS
 AT-10 Electric/HF Hybrid VTOL UAS Acuity Technologies Robert Clark bob@acuitytx.com Summary The AT-10 is a tactical size hybrid propulsion VTOL UAS with a nose camera mount and a large payload bay. Propulsion
Zinc-Air Batteries for UAVs and MAVs
 Zinc-Air Batteries for UAVs and MAVs Dr. Neal Naimer, Vice President R&D (speaker) Binyamin Koretz, Vice President Business Development Ronald Putt, Director of Technology Electric Fuel Corporation Auburn,
Design of a High Altitude Long Endurance Solar Powered UAV Solar Powered Aerial Communicator (SPACOM)
") Design of a High Altitude Long Endurance Solar Powered UAV Solar Powered Aerial Communicator (SPACOM) A project present to The Faculty of the Department of Aerospace Engineering San Jose State University
Design of a High Altitude Long Endurance Solar Powered UAV Solar Powered Aerial Communicator (SPACOM) A project present to The Faculty of the Department of Aerospace Engineering San Jose State University
Design of Ultralight Aircraft
 Design of Ultralight Aircraft Greece 2018 Main purpose of present study The purpose of this study is to design and develop a new aircraft that complies with the European ultra-light aircraft regulations
Technical Math 2 Lab 3: Garage Door Spring 2018
 Name: Name: Name: Name: As you may have determined the problem is a broken spring (clearly shown on the left in the picture below) which needs to be replaced. I. Garage Door Basics: Common residential
ITEMS INCLUDED. 2.4GHz Controller
 READ THESE INSTRUCTIONS BEFORE FLYING! ITEMS INCLUDED.4GHz Controller Flight Battery Charger SKY Cruiser LiPo Flight Battery AA Batteries AC Power Supply WARNINGS FOR YOUR SAFETY PLEASE READ AND UNDERSTAND
High aspect ratio for high endurance. Mechanical simplicity. Low empty weight. STOVL or STOL capability. And for the propulsion system:
 Idealized tilt-thrust (U) All of the UAV options that we've been able to analyze suffer from some deficiency. A diesel, fixed-wing UAV could possibly satisfy the range and endurance objectives, but integration
SCHOOL OF COMPUTING, ENGINEERING AND MATHEMATICS SEMESTER 2 EXAMINATIONS 2013/2014 ME110. Aircraft and Automotive Systems
 s SCHOOL OF COMPUTING, ENGINEERING AND MATHEMATICS SEMESTER 2 EXAMINATIONS 2013/2014 ME110 Aircraft and Automotive Systems Time allowed: TWO hours Answer TWO questions from THREE in Section A and TWO questions
COMPUTATIONAL ANALYSIS OF TWO DIMENSIONAL FLOWS ON A CONVERTIBLE CAR ROOF ABDULLAH B. MUHAMAD NAWI
 COMPUTATIONAL ANALYSIS OF TWO DIMENSIONAL FLOWS ON A CONVERTIBLE CAR ROOF ABDULLAH B. MUHAMAD NAWI Report submitted in partial of the requirements for the award of the degree of Bachelor of Mechanical
Solar Impulse, First Round-The-World Solar Flight. Ralph Paul Head of Flight Test and Dynamics Solar Impulse June 22, 2017
 Solar Impulse, First Round-The-World Solar Flight Ralph Paul Head of Flight Test and Dynamics Solar Impulse June 22, 2017 1 Key Takeaways 1. Why Solar Energy? Renewable, no fossil fuel or polluting emissions
Design of a Custom Vortex generator Optimization of Vehicle Drag and Lift Characteristics
 Design of a Custom Vortex generator Optimization of Vehicle Drag and Lift Characteristics Naveen. S 1, Vipin Prakkash 2, Sukanth Kannan 3 1, 2, 3 Senior Engineer, Sharda Motor Industries Limited R&D, Chennai,
Initial / Recurrent Ground Take-Home Self-Test: The Beechcraft 58 Baron Systems, Components and Procedures
 Initial / Recurrent Ground Take-Home Self-Test: The Beechcraft 58 Baron Systems, Components and Procedures Flight Express, Inc. This take-home self-test partially satisfies the recurrent ground training
The GHOST of a Chance for SmallSat s (GH2 Orbital Space Transfer) Vehicle
 Vehicle") The GHOST of a Chance for SmallSat s (GH2 Orbital Space Transfer) Vehicle Dr. Gerard (Jake) Szatkowski United launch Alliance Project Mngr. SmallSat Accommodations Bernard Kutter United launch Alliance
The GHOST of a Chance for SmallSat s (GH2 Orbital Space Transfer) Vehicle Dr. Gerard (Jake) Szatkowski United launch Alliance Project Mngr. SmallSat Accommodations Bernard Kutter United launch Alliance
Designing evtol for the Mission NDARC NASA Design and Analysis of Rotorcraft. Wayne Johnson From VTOL to evtol Workshop May 24, 2018
 Designing evtol for the Mission NDARC NASA Design and Analysis of Rotorcraft Wayne Johnson From VTOL to evtol Workshop May 24, 2018 1 Conceptual Design of evtol Aircraft Conceptual design Define aircraft
FLIGHT TEST RESULTS AT TRANSONIC REGION ON SUPERSONIC EXPERIMENTAL AIRPLANE (NEXST-1)
") 26 TH INTERNATIONAL CONGRESS OF THE AERONAUTICAL SCIENCES FLIGHT TEST RESULTS AT TRANSONIC REGION ON SUPERSONIC EXPERIMENTAL AIRPLANE (NEXST-1) Dong-Youn Kwak*, Hiroaki ISHIKAWA**, Kenji YOSHIDA* *Japan
26 TH INTERNATIONAL CONGRESS OF THE AERONAUTICAL SCIENCES FLIGHT TEST RESULTS AT TRANSONIC REGION ON SUPERSONIC EXPERIMENTAL AIRPLANE (NEXST-1) Dong-Youn Kwak*, Hiroaki ISHIKAWA**, Kenji YOSHIDA* *Japan