Economic Supply and Demand Analysis THE STATUS OF RETAIL DEVELOPMENT IN ROLLA & PHELPS COUNTY, MISSOURI. Prepared for the City of Rolla, Missouri
|
|
|
- Ashlie Gibbs
- 5 years ago
- Views:
Transcription
1 Economic Supply and Demand Analysis THE STATUS OF RETAIL DEVELOPMENT IN, MISSOURI Prepared for the City of Rolla, Missouri August 17, 2007 DEVELOPMENT STRATEGIES CONSULTANTS IN REAL ESTATE, COMMUNITY, AND ECONOMIC DEVELOPMENT / REAL ESTATE APPRAISAL 10 SOUTH BROADWAY SUITE 1500 ST. LOUIS, MISSOURI t f
2 DEVELOPMENT STRATEGIES CONSULTANTS IN REAL ESTATE, COMMUNITY, AND ECONOMIC DEVELOPMENT / REAL ESTATE APPRAISAL August 17, 2007 Mr. John Petersen Executive Vice President Rolla Community Development City Hall, 2 nd Floor 901 North Elm Street Rolla, Missouri Dear John: Development Strategies is pleased to submit the accompanying report on the status of and opportunities for retail development in the city of Rolla. Our research included a field survey of all retail establishments, an evaluation of the amount of demand for retail purchases from within Rolla and surrounding counties vs. the amount of sales actually taking place in Rolla, and a determination of the amount of sales that Rolla could capture, but is not, based on its relative convenience to shoppers in a seven-county region. Our findings show that Rolla is already a net benefactor from retail spending. The city generates about 40 percent more retail sales than the population of Rolla itself could afford. This means that the city is attracting much of the demand from surrounding areas as well as from travelers along I-44. This benefit is not evenly distributed across retail sectors, however; some sectors could perform much better (that is, capture more sales) in Rolla than they do now while others are presently close to achieving maximum potential. There are about 2.1 million square feet of retail kinds of space in Rolla at present. We conclude, however, that the city could support about one million additional square feet depending on how the city markets itself and how it locates its retail space. Many of the existing locations are no longer ideally suited in light of the preference of retailers to be on Interstate highways, if possible. Capturing more of Rolla s retail potential will almost certainly require better configurations of retail space at sites more visible and accessible from I-44. But that potential is substantial, both for increasing the sales of existing retailers and for attracting even more. Respectfully submitted on behalf of DEVELOPMENT STRATEGIES, INC. Robert M. Lewis Patrick Shortal Rebecca S. Lewis Jack Senneff Principal Field Analyst Research Analyst Graduate Intern Robert M. Lewis AICP, CEcD Larry E. Marks AIA, AICP Brad Beggs MAI Brad Eilerman 10 SOUTH BROADWAY SUITE 1500 ST. LOUIS, MISSOURI t f
3 Table of Contents EXECUTIVE SUMMARY AND CONCLUSIONS PROJECT OVERVIEW INVENTORY OF RETAIL ESTABLISHMENTS IN THE CITY OF ROLLA...6 Rolla Retail Zones Map RETAIL SALES TAKING PLACE IN ROLLA, PHELPS COUNTY, AND SURROUNDING COUNTIES RETAIL DEMAND GENERATED FROM ROLLA, PHELPS COUNTY, AND SURROUNDING COUNTIES BUYING POWER AND EXPENDITURES BY HOUSEHOLD INCOME...22 APPENDIX A: RETAIL OPPORTUNITY GAP ANALYSIS...27 APPENDIX B: LOCAL AND REGIONAL SALES AND EXPENDITURES...42 APPENDIX C: RESULTS OF FIELD SURVEY...52
4 EXECUTIVE SUMMARY AND CONCLUSIONS Rolla is the largest city in Phelps County and, as such, serves as the Population economic focal point of the county. Some 68% of Retail/Dining Sales all retail and restaurant Retail Sales sales taking place in Phelps County happen in Eating & Drinking Sales Rolla. Yet Rolla has just Retail Establishments 42.5% of the county s population. Rolla also Eating & Drinking Places captures 23.8% of retail sales in the seven county region including and surrounding Phelps County 1 while encompassing only 10.3% of that region s population. Clearly, the city of Rolla is the center of retail activity in south central Missouri. A field inventory of retail locations in Rolla showed that there are 334 establishments in retail locations in five distinct zones of the city. These encompass over 2.1 million square feet of floor area for an average of 6,400 square feet per business. The largest number of businesses is Downtown and in Zone the Highway 63 corridor south of the railroad. But Downtown s stores are relatively small at an average of 3,900 square feet while those in 63 South average 7,800 square feet. This area contains some very large stores; of course, much Rolla's Share of Phelps County: Retail, Dining, and Population 0% 10% 20% 30% 40% 50% 60% 70% 80% 90% 100% 42.5% 63.6% 60.5% 67.7% 80.5% 93.0% Count of Retail Establishments by Zone City of Rolla - June 2007 Zone Count Percent 63 North % 63 South % Downtown % East % West % Grand Total % Source: Field survey by Development Strategies Average Floor Area of Retail Establishments by Zone City of Rolla - June 2007 Average Square Feet Aggregate Square Feet Percent 63 North 9, , % 63 South 7, , % Downtown 3, , % East 4, , % West 7, , % Grand Total 6,400 2,129, % Source: Field survey by Development Strategies 1 1 Phelps, Crawford, Dent, Gasconade, Maries, Pulaski, and Texas counties. DEVELOPMENT STRATEGIES 1
5 like 63 North, the area has a Lowes Home Improvement which pushes the average store size there to 9,700 square feet. The relatively strong concentration of retail sales capture in Rolla yields several high location quotients 2 particularly in gasoline stations (attributable to its I-44 location), building material and hardware stores (Lowes and Meeks), and restaurants (again, highway location). There are also relative, but lesser, strengths in general merchandise stores (Wal-Mart, Kmart) and some miscellaneous store types (probably attributable to the clusters of small stores around Wal-Mart and Kmart). Retail Sales Location Quotients for City of Rolla Based on U.S.A. Percentages Dollars in Millions, 2007 Estimates Rolla City U.S.A. Rolla Location NAICS Industry Group Sales Percent Sales Percent Quotient 441 Motor Vehicle & Parts Dealers $ % $744, % Furniture & Home Furnishings $ % $105, % Electronics & Appliance $ % $93, % Bldg Materials, Garden & Supply $ % $133, % Food & Beverage Stores $ % $531, % Health & Personal Care $ % $217, % Gasoline Stations $ % $350, % Clothing & Clothing Accessories $ % $210, % Sporting Goods, Hobby, Book/Music $ % $83, % General Merchandise Stores $ % $501, % Miscellaneous Store Retailers $ % $96, % Food Services & Drinking Places $ % $426, % 1.56 Sources: ESRI and Development Strategies But there are several weak categories, especially in electronics stores, clothing stores, furniture stores, and food and beverage stores (groceries). It is quite likely that many shoppers are finding these kinds of goods in the general merchandise and other big box stores, but there is spending power in the region to potentially justify the attraction of more specialized stores in such categories. In fact, a simplified gravity model 3 prepared for this study suggests that Rolla could support around one million additional square feet of retail space if it can position and market itself to capture more of the household buying power that is currently leaking from the other counties in the region. There is a substantial amount of such leakage because most of the cities and counties in the area cannot support large 2 The percentage of sales in a category in Rolla divided by the percentage of sales in the same category for the whole U.S. A location quotient greater than 1.0 means that Rolla has a comparative advantage; less than 1.0 means that this sector could be made stronger. 3 Bigger cities and bigger retailers attract more than their share of shoppers, so they have stronger gravity than other places. Rolla has the strongest gravity in the region but is still not yet taking full advantage of it. DEVELOPMENT STRATEGIES 2
6 scale retail centers by themselves. Rolla already attracts a substantial amount of that leakage, but the proximity of shoppers to Rolla suggests that the city could attract even more. Most prominent among the opportunities that arise from the gravity model are substantial opportunities for more general merchandise stores and more supermarkets. The modeling shows that at least two stores in each of these categories could be supported in Rolla in addition to those that are already in place. The results of this model and the findings of the location quotient analysis combine to make a powerful case for attracting major retailers to Rolla which would reinforce the city s already strong position as the region s retailing center, and would likely solidify that position for many years to come. Finally, the research for this report reveals that the spending patterns of households in the Rolla area are not significantly different than those of the entire nation. Rolla tends to have a slightly higher percentage of lower income households and a slightly lower percentage of higher income households than the whole country, but these differences are not great and the aggregate buying power of all households in the Rolla region yields substantively the same patterns as all Americans. This finding can bolster economic development pitches to prospective retailers in order to demonstrate that, while a relatively small city, Rolla s retail demands are consistent with all Americans and, therefore, Rolla is an excellent market to consider for growth and expansion. DEVELOPMENT STRATEGIES 3
7 1.0 PROJECT OVERVIEW Rolla is the largest city in Phelps County and, as such, serves as the economic focal point of the county. Some 68% of all retail and restaurant sales taking place in Phelps County happen in Rolla. And Rolla is home to 65% of all such establishments in Phelps County. 4 Within these numbers, Rolla captures 64% of retail sales (excluding restaurants) made within the county and a whopping 93% of all restaurant and bar sales. Moreover, eight out of ten eating and Rolla's Share of Phelps County: Retail, Dining, and Population drinking places in Phelps 0% 10% 20% 30% 40% 50% 60% 70% 80% 90% 100% County are found in Rolla. Population 42.5% Retail/Dining Sales 67.7% Yet Rolla s population of Retail Sales 63.6% about 18,000 makes up just 42.5% of the county s Eating & Drinking Sales 93.0% population. 5 Clearly, Retail Establishments 60.5% Rolla serves not only its Eating & Drinking own shoppers and diners 80.5% Places but also attracts many patrons from other cities and counties to account for these differences. And Rolla appears also to be capturing the lion s share of overnight lodgers who may have business either in Rolla or elsewhere in the region. But a great deal of Rolla s retail, dining, and lodging establishments are quite old and many are in physical conditions that fail to meet the expectations of discerning shoppers and diners who, with high speed automobile travel, have increasing access to other cities where newer stores, restaurants, and hotels are being constructed. This is markedly so for the Fort Leonard Wood area with regard to hotels and restaurants, less than 30 minutes from Rolla. But even St. Clair, Missouri, to the east is beginning to attract Rolla shoppers or those who would otherwise shop in Rolla. There is serious concern in Rolla that the city may be losing its competitive edge and some of its economic leadership. Moreover, retailers, restaurateurs, and hoteliers of the early 21 st Century seek highly accessible and visible locations, typically at Interstate highway interchanges, on relatively flat, easily de estimates by ESRI population estimates from the U.S. Census Bureau, Department of Commerce. DEVELOPMENT STRATEGIES 4
8 veloped land. While Rolla is blessed with four Interstate interchanges, a quick field survey reveals that there are virtually no developable sites of large scale at these locations other than, to a limited degree, at the western-most interchange with Kingshighway and Martin Springs Drive. Most of Rolla s retail stores and centers are located deeper into the city less visible and less accessible than is today s norm. This puts a great challenge on Rolla to maintain or even increase its importance as the regional retail leader. This report addresses many of the market-based factors affecting the retail sector in Rolla, Phelps County, and the seven-county region that also includes Gasconade, Crawford, Dent, Texas, Pulaski, and Maries Counties. The purpose is to enable Rolla s public officials, business leaders, and residents to better understand the dynamics of retailing in the city and region in order to determine if and what changes might be pursued to improve and enhance the retail climate. The report reviews real estate location factors, physical conditions, economic demand and buying power generated by residents and businesses, the mix of retail and dining establishments compared to the spending habits of area residents, and the opportunities and challenges that Rolla and the region face. While Rolla is the largest city in the seven-county area, it still is not large when compared to, say, St. Louis or Jackson Counties, or even Greene County. Thus, there are naturally going to be fewer stores in Rolla than in the large urban areas of the state and there is also likely to be less diversity in the types of stores. This is also natural, but it is important to demonstrate where Rolla has particular strengths that it should build on and particular weaknesses that it may be too small to worry about. DEVELOPMENT STRATEGIES 5
9 2.0 INVENTORY OF RETAIL ESTABLISHMENTS IN THE CITY OF ROLLA Development Strategies conducted a windshield field survey of all retail areas and establishments in the city of Rolla during June The intent was to identify all retail stores and restaurants, their estimated floor area, and their apparent physical and economic condition. Recorded also were businesses located in what would normally be considered retail locations (e.g., within a shopping center) that might not technically be retail establishments. Many of these, however, are typically found in retail centers (e.g., tax preparation services or beauty salons) even though they are not strictly defined as retail by standard industry measures. Included also are all restaurants and drinking places which also are not strictly considered retail but, nevertheless, are found in retail locations and, unlike many other non-retailers, are subject to retail sales taxes. The spreadsheet results of this inventory are found in Appendix C of this report. Prior to the site visit and following the review of available planning documents, a land use map obtained from the City was divided into five zones based on apparent concentrations of retail, dining, and lodging establishments. West Zone, primarily the corridor defined by Kingshighway and Martin Springs Drive. East Zone, primarily defined by U.S. Highway 72. South U.S. 63 Zone, south of U.S. 72 North U.S. 63 Zone, north of U.S. 72 Downtown Rolla. The geographic segmentation was done in order to make the most efficient use of the time allotted for the field survey and for the later compilation and analysis of the data. These zones are depicted on the map on the following page. A street map of each area was prepared ahead of time along with a survey form with blanks for each business name, address, type of establishment, estimate of square feet of floor area, and notes regarding appearance and economic viability. On-line research prior to the site visit was able to provide the names and locations of approximately 30% of the Rolla s retail concerns; the remainder were determined by the field survey. The one day visit produced data and observations for over 300 retail establishments. DEVELOPMENT STRATEGIES 6

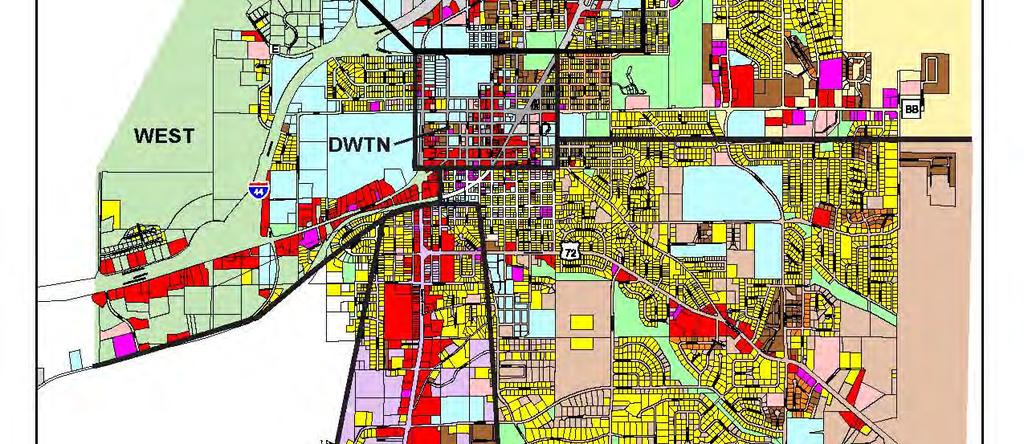

10 Rolla Retail Zones Map DEVELOPMENT STRATEGIES 7
11 At the completion of the survey, each establishment was assigned a code from the North American Industry Classification System (NAICS). The three-digit codes used for this inventory are shown to the right. 6 Formally, those that start with 44 and 45 are called retail trade in the NAICS definitions. These include, essentially, stores selling tangible merchandise for removal from the premises. Restaurants are coded 722 and are part of the economic sector known as accommodation and food services. The accommodations code is 721, which captures all of the hotels and motels in the Rolla inventory. Three-Digit NAICS Codes 323 Printing 441 Auto Vehicles and Parts 442 Furniture and Home Furnishings 443 Electronics and Appliances 444 Building Materials and Hardware 445 Food And Beverage Stores 446 Health And Personal Care Stores 447 Gas/Convenience 448 Clothing and Accessories 451 Sporting Goods, Hobby, Books, Music 452 General Merchandise 453 Miscellaneous Retail 492 Couriers and Messengers 522 Banking and Finance Services 532 Rental and Leasing Services 541 Professional and Technical Services 561 Locksmith 713 Amusement and Recreation 721 Lodging 722 Eating and Drinking Places 811 Repair and Maintenance 812 Health and Personal Care Stores Personal service and repair establishments, including those for, say, auto repair and dry cleaning, are in NAICS code 81 other services. Those in the three digit 811 and 812 subsectors are most often found in retail locations or are generally considered consumeroriented services that most people consider retail. Printing, by the way, which heads the list to the right, is technically considered a manufacturing process, or NAICS codes 31 to 33. Banking and related financial services (including such businesses as payday loans) are not formally considered retail but are, of course, found in retailing locations. The subsector professional and technical services includes such businesses as tax preparation, also something typically Count of Retail Establishments by Zone City of Rolla - June 2007 Zone Count Percent found in retail locations. 63 North % 63 South % Altogether, 334 establishments are included in the Downtown % Rolla inventory, as shown on the table to the right. East % Just over a quarter of these businesses are in the West % Grand Total % Downtown zone with an equal number in the Highway 63 South zone. One fifth are found in the West Source: Field survey by Development Strategies zone, just over one-tenth in the Highway 63 North zone, and the remainder in the East zone. 6 NAICS codes can be as long as six digits depending on the detail desired or surveyed. Such detail was not deemed necessary for this particular survey. They can also be as short as one digit which indicates the major economic sector of the business. DEVELOPMENT STRATEGIES 8
12 These percentages shift markedly, however, when comparing estimated square Average Floor Area of Retail Establishments by Zone City of Rolla - June 2007 feet of all 334 establishments. Altogether, these businesses encompass an Average Aggregate Zone Square Feet Square Feet Percent estimated 2,129,700 square feet of gross floor area for an overall average of about 63 North 63 South 9,700 7, , , % 32.7% 6,400 square feet per business. But because Downtown 3, , % East 4, , % of the big boxes found in the Highway 63 zones, the North zone has West Grand Total 7,400 6, ,900 2,129, % 100.0% 16.3% of all floor area compared to Source: Field survey by Development Strategies 11.7% of the businesses while the South zone has almost a third of all floor area (32.7%) compared to a quarter of the number of businesses (26.6%). Downtown retailers, on the other hand, have much smaller average store sizes so that they capture just 16.5% of all retail space compared to 26.6% of the number of businesses. Percent of Retail Establishments by Zone City of Rolla - June 2007 We st 20.7% 63 North 11.7% East 14.4% Downtown 26.6% 63 South 26.6% DEVELOPMENT STRATEGIES 9
13 Percent of Aggregate Square Feet of Retail Establishments by Zone City of Rolla - June 2007 We st 24.0% 63 North 16.3% East 10.5% Downtown 16.5% 63 South 32.7% There are also differences in the share of businesses and square feet based on the three-digit NAICS codes. As shown on the next page, for instance, eating and drinking places in Rolla make up almost a fifth (19.5%) of all establishments in the inventory, but they take up just 11.3% of all floor area. In other words, restaurants and bars tend to be relatively small compared to overall averages. In contrast, building materials and hardware stores account for 4.2% of all businesses but 7.9% of all floor area. These, of course, are dominated by such stores as Lowes and Meeks, relatively large stores just themselves. The average building materials and hardware store in Rolla has 12,100 square feet, 7 some 3.3 times larger than the average eating and drinking place with 3,700 square feet. The largest stores tend to be in the general merchandise category, dominated by Wal-Mart, J.C. Penney, and Kmart. GM stores average 33,250 square feet 8 while the next largest average is 15,350 square feet for groceries and supermarkets. The average for the entire inventory is 6,400 square feet. 7 Also includes such stores as Sherwin Williams paints and Rolla Farmers exchange, both of which are Downtown. 8 Also includes such stores as the Dollar General and the Salvation Army Thrift store. DEVELOPMENT STRATEGIES 10
14 Percent of Retail Establishments by Major Type City of Rolla - June 2007 Printing Auto Vehicles and Parts Furniture and Home Furnishings Electronics and Appliances Building Materials and Hardware Food And Beverage Stores Health And Personal Care Stores Gas/Convenience Clothing and Accessories Sporting Goods, Hobby, Books, Music General Merchandise Miscellaneous Retail Couriers and Messengers Banking and Finance Services Rental and Leasing Services Professional and Technical Services Locksmith Amusement and Recreation Lodging Eating and Drinking Places Repair and Maintenance 0% 2% 4% 6% 8% 10% 12% 14% 16% 18% 20% Percent of Square Feet of Retail Establishments by Major Type City of Rolla - June 2007 Printing Auto Vehicles and Parts Furniture and Home Furnishings Electronics and Appliances Building Materials and Hardware Food And Beverage Stores Health And Personal Care Stores Gas/Convenience Clothing and Accessories Sporting Goods, Hobby, Books, Music General Merchandise Miscellaneous Retail Couriers and Messengers Banking and Finance Services Rental and Leasing Services Professional and Technical Services Locksmith Amusement and Recreation Lodging Eating and Drinking Places Repair and Maintenance Health and Personal Care Stores 0% 2% 4% 6% 8% 10% 12% 14% 16% 18% 20% DEVELOPMENT STRATEGIES 11
15 3.0 RETAIL SALES TAKING PLACE IN ROLLA, PHELPS COUNTY, AND SURROUNDING COUNTIES The foregoing is an analysis of the inventory of retail kinds of space recorded from the field survey. But no information on actual business activity or demand can be determined from that survey. The next two sections of the report, therefore, rely substantively on data obtained from two commercial sources of such information, Claritas and ESRI, as well as from the U.S. Census Bureau, primarily the economic census of All are widely used in the retail market analysis business, though their specific databases vary so it is difficult to compare them; but relative numbers are generally consistent between databases, so they are all useful in making observations about the retail economy of Rolla and Phelps county. The following analyses, by the way, focus solely on the retail and dining/drinking sectors, not the more complex set of NAICS codes determined from the field inventory. Relying on the ESRI information for 2006, the city of Rolla generated $393.6 million in retail and dining sales in a total of 256 retail/dining establishments. 9 Phelps County as a whole generated sales of $581.6 million. Thus, Rolla accounted for two-thirds (67.7%) of all retailing in the county despite having 42.5% of the estimated 2006 population of the county. 10 Rolla is also the center of retailing for a seven county region: Phelps, Crawford, Dent, Gasconade, Maries, Pulaski, and Texas counties. Rolla s population makes up 10.3% of these seven counties, but Rolla captures 23.8% of all retail sales in the seven counties 21.8% non-dining and 40.2% of eating and drinking places. It is home to just 17.3% of all retail/dining establishments, however, so the city is capturing a higher share of sales than it is in actual supply of stores and restaurants. Indeed, the data support Rolla as a major stop for travelers along I-44 at meal times. Rolla has 19.4% of the restaurants in the seven-county region, but captures twice that amount 40.2% in restaurant sales. Still, as is discussed in greater detail later, Rolla may have some important retailing expansion opportunities. The following pie charts illustrate Rolla s percentage of retail sales by major subsector compared to those of the U.S. as a whole. 9 The inventory conducted by Development Strategies in June 2007 counted 221 such businesses: 156 classified as retail in NAICS codes 44 and 45 (ESRI says 190), plus 65 eating and drinking places in NAICS 722 (ESRI says 66). The differences between the field survey and ESRI s count can be explained in many ways including inaccuracies in coding by both firms, inconsistent geographic coding of some stores, and changes in the inventory between measurement periods. These are not serious issues, however, when the topic of this report is the relative status of the supply of and demand for retail establishments in Rolla. 10 Based on U.S. Census estimates for DEVELOPMENT STRATEGIES 12
16 Miscellaneous 3.5% Retail Sales by Sector in Rolla, 2007 Restaurants and Bars 19.0% Auto Sales and Parts 12.1% Furniture 2.3% Building/Hardware 6.5% Grocery 5.8% Electronics 1.3% General Merchandise 17.0% Personal Care 10.9% Sports, Books, Music 1.6% Apparel 1.4% Gas Stations 18.7% Retail Sales by Sector in U.S.A Miscellaneous 2.8% General Merchandise 14.3% Restaurants and Bars 12.2% Auto Sales and Parts 21.3% Furniture 3.0% Building/Hardware 3.8% Electronics 2.7% Sports, Books, Music 2.4% Apparel 6.0% Gas Stations 10.0% Personal Care 6.2% Grocery 15.2% DEVELOPMENT STRATEGIES 13
17 A first review shows that, for instance, Rolla has many more gas station sales than the national average (18.7% of all sales compared to 10.0%), reinforcing the importance of I-44 travelers to certain kinds of sales in Rolla. The same is true for restaurants and bars; Rolla does extraordinarily well compared to national averages. There are also above average shares for general merchandise stores and for building and hardware stores. Given Rolla s geographic prominence in its region, these latter two findings also are not all that surprising, especially when considering that general merchandise and building materials stores tend to be concentrated in big box or category killer establishments which rely on large hinterlands for market share. On the other hand, stores that cater to being more convenient to consumers, such as grocery stores, do not have the prominence in Rolla as the national averages. This is not to say that Rolla residents have lessthan-average access to such stores. It just means that Rolla commands a regional market for regional goods and services, but does not command a regional market for more convenience shopping. But this may not be universal for Rolla. Health and personal care stores, like drug stores, which tend to be located to be quite convenient to the population, have a higher percentage of sales in Rolla than in the country. It appears that Rolla is also a center for attracting this typically convenience patronage. This suggests a mixed message with regard to retailing in Rolla, but it also suggests that the market areas for, say, drug stores in surrounding cities and counties are too lightly populated to justify many such stores, so people opt, instead, for Rolla. Many of the convenience goods that patrons typically find in drugs stores, by the way, may be found in supermarkets, thus minimizing the need for other kinds of convenience stores. Another way to measure these comparisons is by use of location quotients, shown on the table below. A location quotient (LQ) measures the percentage of sales in each category in Rolla against the percentage for the entire country. Where Rolla has a comparative advantage over the national average, the LQ is greater than 1.0. Where it serves more of a local market and the percentages are reduced by the power of the regionally-scaled stores, the LQ is less than 1.0. In this case, Rolla has relative strengths in gas station sales (LQ = 1.86), building materials and hardware sales (LQ = 1.69), and personal care stores (1.75). On the other hand, there are relative weaknesses in electronics (0.47) and apparel stores (a very meek 0.24), suggesting opportunities for more such stores. Having said that, much of such demand is probably being satisfied in the big general merchandise stores rather than in individual electronics or clothing stores. DEVELOPMENT STRATEGIES 14
18 Retail Sales Location Quotients for City of Rolla Based on U.S.A. Percentages Dollars in Millions, 2007 Estimates Rolla City U.S.A. Rolla Location NAICS Industry Group Sales Percent Sales Percent Quotient 441 Motor Vehicle & Parts Dealers $ % $744, % Furniture & Home Furnishings $ % $105, % Electronics & Appliance $ % $93, % Bldg Materials, Garden & Supply $ % $133, % Food & Beverage Stores $ % $531, % Health & Personal Care $ % $217, % Gasoline Stations $ % $350, % Clothing & Clothing Accessories $ % $210, % Sporting Goods, Hobby, Book/Music $ % $83, % General Merchandise Stores $ % $501, % Miscellaneous Store Retailers $ % $96, % Food Services & Drinking Places $ % $426, % 1.56 Sources: ESRI and Development Strategies DEVELOPMENT STRATEGIES 15
19 4.0 RETAIL DEMAND GENERATED FROM ROLLA, PHELPS COUNTY, AND SURROUNDING COUNTIES As noted previously, Rolla s sales make up a significant portion of the region s total sales, highlighting its role as an economic focal point. The accompanying chart compares the annual retail sales for the city of Rolla against the annual retail sales of the rest of Phelps County and against those of the surrounding six counties. Appendix B contains detailed tables. Note that Pulaski County is a formidable competitor in many ways, as is Texas County and some components of the remainder of Phelps County (notably in gasoline and motor vehicle sales). But Rolla clearly has a disproportionate share of sales in almost every category. Retail Sales by Industry Sector in the Seven-County Region Source: ESRI, 2007 Food Services & Drinking Places Miscellaneous Store Retailers General Merchandise Stores Sporting Goods, Hobby, Book/Music Clothing & Clothing Accessories Gasoline Stations Health & Personal Care Food & Beverage Stores Bldg Materials, Garden & Supply Electronics & Appliance Furniture & Home Furnishings Motor Vehicle & Parts Dealers $400,000,000 $350,000,000 $300,000,000 $250,000,000 $200,000,000 $150,000,000 $100,000,000 $50,000,000 $0 Rolla City Phelps County Donut (less Rolla) Crawford County Dent County Texas County Gasconade County Maries County Pulaski County DEVELOPMENT STRATEGIES 16
20 But this disproportionality does not extend to the demand for retail purchases emanating from its own residents, as shown to the right. The demand generated by Rolla residents through their own purchasing power is proportional to the city s population. But Rolla generates more sales than its residents spend, so the city is attracting shoppers from elsewhere. Because of that, consumers leaving their home counties to shop in Rolla and other cities represent an opportunity for those other areas if they could attract their own patronage back to their counties. An area s retail opportunity gap is a measurement of the difference between the amount of sales an area captures and the amount it loses to surrounding areas. But this does not mean and hasn t meant that Rolla is at the future mercy of the region s other counties. Indeed, analyzing these gaps helps to show where Rolla might actually improve or reinforce its current market power. Retail Demand from Resident Population in the Seven-County Region Source: ESRI, 2007 Food Services & Drinking Places Miscellaneous Store Retailers General Merchandise Stores Sporting Goods, Hobby, Book/Music Clothing & Clothing Accessories Gasoline Stations Health & Personal Care Food & Beverage Stores Bldg Materials, Garden & Supply Electronics & Appliance Furniture & Home Furnishings Motor Vehicle & Parts Dealers $400,000,000 $350,000,000 $300,000,000 $250,000,000 $200,000,000 $150,000,000 $100,000,000 $50,000,000 $0 Rolla City Phelps County Donut (less Rolla) Crawford County Dent County Texas County Gasconade County Maries County Pulaski County DEVELOPMENT STRATEGIES 17
21 As discussed below, keep in mind that an opportunity gap can be expressed as either a negative number or a positive number. It is negative when the demand for retail sales generated by the local population is less than the supply or less than the actual sales generated. This is the case almost entirely for Rolla itself. On the face of it, Rolla enjoys a negative opportunity gap because it attracts more sales that it can support by itself. There is no additional gap to be exploited. Well, as is shown below, this is not necessarily the case. A positive opportunity gap means that demand exceeds supply. That is, local residents can buy more retail goods and services than are being generated in their county. Thus, on a net basis, they must be shopping outside their county to satisfy their demand. This means, in theory, that their own county might be able to re-attract their demand by providing more retail stores. Thus, it is a positive opportunity to grow. For instance, every area (the six full counties and the donut of Phelps County) except for Rolla maintains a positive opportunity gap for the electronics and appliance retail group, indicating that residents from surrounding areas are leaving their home counties to purchase electronic equipment; these lost consumers are often referred to as an area s retail leakage. Rolla s negative gap for this retail group suggests that at least some of these electronics consumers are traveling to Rolla to shop for these items, although a large portion are also choosing to travel elsewhere, as well. 11 Additionally, Rolla and each of the surrounding counties maintain negative opportunity gaps in gasoline sales, meaning that the amount that area locals spend on fuel outside their own counties is less than the amount people spend at area gasoline stations as they travel through the region. Rolla s opportunity gap for this industry is particularly large, reflecting the city s location along major transportation arteries. The city s restaurant industry, which also has a large opportunity gap, clearly benefits from these highway travelers as well. Finally, Rolla is the only area in the region maintaining a negative opportunity gap for all major NAICS codes, reflecting its position as a regional economic power. The following table summarizes the opportunity gaps of Rolla and the surrounding counties. 11 This is not to say, necessarily, that Rolla is attracting such sales as much as it might. Indeed, the location quotients suggest electronics as a relatively weak sector for sales in Rolla. This suggests that electronics customers are either traveling outside the region for many such purchases, or they are buying electronics at stores classified as something other than electronics such as Wal-Mart or Kmart which are general merchandise stores because they carry a wide range of categories. DEVELOPMENT STRATEGIES 18
22 Retail Opportunity Gaps in the Seven-County Region Counties of the Region Other Phelps Crawford Dent Texas Gasconade Maries Pulaski Rolla City Industry Summary (millions of dollars) Total Retail Trade and Food & Drink ($259.3) $112.4 $46.2 ($13.6) ($1.8) ($19.9) $29.8 ($119.8) Industry Group (millions of dollars) Motor Vehicle & Parts Dealers Furniture & Home Furnishings Stores Electronics & Appliance Stores Bldg Materials, Garden Equip. & Supply Stores Food & Beverage Stores Health & Personal Care Stores Gasoline Stations Clothing and Clothing Accessories Stores Sporting Goods, Hobby, Book, and Music Stores General Merchandise Stores Miscellaneous Store Retailers Food Services & Drinking Places ($17.6) ($1.7) $28.8 $15.3 ($1.0) $12.0 $8.0 ($4.2) ($5.2) $3.8 $1.8 ($1.0) ($1.2) ($0.9) $1.3 ($0.1) ($2.0) $1.0 $3.1 $0.4 $1.3 $1.5 $1.2 $2.6 ($21.3) $17.0 $1.6 ($1.0) $3.1 ($5.5) $2.2 $0.8 ($6.8) ($6.2) ($1.3) $2.7 $4.7 ($3.6) ($4.3) ($1.4) ($39.1) $34.6 ($0.1) ($3.3) $0.3 ($2.7) ($0.9) ($0.7) ($50.4) ($9.2) ($25.0) ($15.1) ($37.4) ($13.5) ($1.0) ($11.9) ($2.6) $1.8 $1.5 ($0.2) $2.2 $1.0 NA $0.0 ($4.3) $2.4 ($1.2) ($1.2) ($0.5) ($0.1) $0.0 ($1.4) ($42.0) $14.4 $25.4 ($0.2) $15.6 ($9.3) $16.8 ($12.0) ($11.3) $9.2 ($0.2) ($5.0) ($0.9) ($5.6) ($0.0) ($2.8) ($56.5) $45.4 $9.8 ($6.6) $13.0 $5.8 $6.1 ($16.3) Sources: ESRI and Development Strategies. Note: A negative retail opportunity gap indicates a surplus (consumers are being drawn from other ares); a positive gap indicates leakage (consumers are traveling to other areas). While this opportunity gap measurement demonstrates whether an area is attracting shoppers from outside areas or losing its own consumers to other areas, it does not indicate where a region s lost consumers actually go to meet their retail needs. To determine the percentage of these traveling consumers that Rolla might realistically capture, one must consider consumer proximity to Rolla, to other retail options available to them, and their spending habits. In short, this is a simplified version of the gravity model of urban development that is premised on consumers traveling the most convenient distance for retail goods and services. The analysis rests on the following basic assertions: Consumers will typically choose to travel to a location with a number of diverse retail options instead of a location with limited options. This enables them to shop for multiple items more conveniently than, say, taking multiple trips for some items that may, in fact, be more conveniently located in and of themselves. 2. When presented with multiple, relatively equal, retail options, consumers will usually choose the closest one. 3. When presented with multiple retail options of both similar scale and distance, consumers will make their choices based on their overall shopping experience, measured in part by the age, condition, and 12 Appendix A provides a detailed description of the calculations supporting these figures, which combine a detailed drive-time analysis, a regional population density study, a competing retail assessment, and an evaluation of the relative strength of each area s retail offerings. DEVELOPMENT STRATEGIES 19
23 accessibility of the stores, perceived or experienced quality of service, the attractiveness of the surrounding city, and the availability of other amenities near the retail establishments. Development Strategies prepared a simple model for making the above assumptions about the county populations surrounding Rolla. While a more detailed model might be developed, the following table indicates the amount of buying power leakage from each surrounding county that Rolla should be able to capture. Each county already leaks some of its buying power to other places one of the chief benefactors of that leakage is, of course, Rolla. For instance, based on the gravity analysis, Rolla should be able to capture 90% of the leakage from the rest of Phelps County (that is, the amount spent outside of the donut where Rolla is the hole). Likewise, Rolla should be able to capture 48% of the leakage from Crawford County. This is not to say that Rolla should be able to capture 48% of the buying power from Crawford County; but it should be able to capture 48% of the dollars that are not already captured within Crawford County. The table indicates the amount of total sales from these leakages that Rolla might capture if it can continue to upgrade and improve the locations and quality of its retail businesses. Cells showing zero dollars indicate line items where Rolla has no potential added advantage. Rolla's Actual Opportunity Gap by Area (Household and Business Purchases) Millions of Dollars Leakage Capture Percentage Industry Group Motor Vehicle & Parts Dealers Furniture & Home Furnishings Stores Electronics & Appliance Stores Bldg Materials, Garden Equip. & Supply Stor Food & Beverage Stores Health & Personal Care Stores Gasoline Stations Clothing and Clothing Accessories Stores Sporting Goods, Hobby, Book, and Music Sto General Merchandise Stores Miscellaneous Store Retailers Food Services & Drinking Places Phelps County Donut Crawford County Dent County Texas County Gasconade County Maries County Pulaski County Total Opportunity Gap 90% 48% 28% 18% 5% 81% 59% N/A $10.2 $19.6 $9.7 $6.5 $1.4 $18.9 $16.7 $82.9 $4.0 $1.3 $0.7 $0.9 $0.2 $2.0 $3.1 $12.2 $4.4 $2.6 $0.8 $0.7 $0.2 $1.0 $4.4 $14.1 $15.3 $3.1 $2.9 $2.9 $0.0 $9.9 $17.8 $52.0 $22.2 $15.2 $2.5 $4.6 $0.4 $7.2 $28.8 $80.9 $31.3 $5.0 $1.9 $1.5 $0.5 $5.1 $8.1 $53.4 $0.0 $0.0 $0.0 $0.0 $0.0 $1.2 $0.0 $1.2 $3.7 $6.0 $0.6 $1.9 $0.4 $0.0 $9.4 $22.0 $3.4 $2.6 $0.7 $0.9 $0.1 $1.7 $2.9 $12.3 $44.6 $16.2 $1.2 $5.6 $0.7 $14.7 $5.2 $88.3 $11.4 $3.6 $0.6 $0.8 $0.2 $2.4 $4.7 $23.6 $42.3 $7.3 $3.4 $3.0 $0.6 $7.1 $2.8 $66.5 TOTAL $192.8 $82.5 $24.9 $29.2 $4.8 $71.3 $104.0 $509.6 Source: ESRI (2007), Claritas (2007), Dollars & Cents, Regional Shopping Centers (2006) Note: A value of zero indicates that the county is not leaking retail sales for that area and, therefore, an opportunity does not exist for Rolla to capture sales from that area without changes to the city's current retail offerings. Rolla is already capturing some of these sales, as is apparent from measures such as the location quotients. Rolla captures more retail sales than its own buying power can support, so it must be attracting other people s spending, too. Thus, Development Strategies determined the potential net improvement that Rolla could capture from the regional counties after adjusting for dollars already captured. The next DEVELOPMENT STRATEGIES 20
24 table shows the estimated additional sales capturable in Rolla along with an estimate of the amount of square feet of retail space that would be required to support those added sales. Net Opportunity Gap: Capturable Additional Sales from Surrounding Counties Industry Group Motor Vehicle & Parts Dealers Furniture & Home Furnishings Stores Electronics & Appliance Stores Bldg Materials, Garden Equip. & Supply Stores Food & Beverage Stores Health & Personal Care Stores Gasoline Stations Clothing and Clothing Accessories Stores Sporting Goods, Hobby, Book, and Music Stores General Merchandise Stores Miscellaneous Store Retailers Food Services & Drinking Places TOTAL Net Opportunity Gap Source: ESRI (2007), Claritas (2007), Dollars & Cents, Regional Shopping Centers (2006) Sales per Square Foot Additional Retail Square Feet Possible $65.3 $ ,300 $7.0 $245 28,800 $12.1 $363 33,300 $30.7 $325 94,300 $74.1 $ ,200 $14.3 $354 40,300 ($49.2) $337 - $19.5 $388 50,200 $8.0 $311 25,800 $46.4 $ ,000 $12.2 $228 53,700 $9.9 $418 23,700 $250.2 $240 1,043,600 The overall total suggests that Rolla could support over 1,000,000 square feet of additional retail space, over and above the amount already in place if the city could maximize its capture rates from other counties. But more important than the total is to look at some of the individual industry groups. For instance, Rolla could theoretically support 263,000 additional square feet of auto dealers and parts stores. The latter are likely more feasible than the former because auto dealers require substantial amounts of flat land to display their vehicles. Rolla cannot likely create that much flat land, especially in a fiscal environment where sales taxes from vehicles do not accrue to the community where the sale is made. If reduced to just the auto parts stores, the added square feet become 14,400. There are, perhaps, two quite notable opportunities displayed on the above table: food stores and general merchandise stores. These opportunities suggest gaps of at least two added stores in each category depending on the ultimate size of stores that could be built and their locations. Clearly, Rolla can be a more powerful retail concentration for these kinds of stores that, by themselves, are able to anchor shopping centers that would lure establishments in the other categories. DEVELOPMENT STRATEGIES 21
25 5.0 BUYING POWER AND EXPENDITURES BY HOUSEHOLD INCOME This report demonstrates that Rolla area households spend far less than the amount of sales generated by retail and dining establishments in the city of Rolla, making the city a net regional economic magnet. Additionally, the above discussion shows that Rolla has the opportunity to expand these sales. While this analysis acts as a solid base, not all Distribution of Households by Annual Income 2007 Estimates households spend the same way or the same amounts or the same percentages of their incomes. The U.S. Department of Labor conducts a periodic Consumer Expenditure Survey (CEX) among Americans, and then publishes the information broken down by various demographic characteristics. Among these are spending patterns according to household income. Using that data, this section estimates the retail and dining expenditures for a Sources: U.S. Department of Labor Consumer Expenditure Survey, ESRI, and range of household incomes in Rolla itself. A key Development Strategies. finding is that Rolla s overall retail spending patterns are not significantly different, in aggregate, than the nation even though Rolla has a slightly larger proportion of households at the lower end of the income spectrum and lesser proportions in upper income ranges. Rolla City 7 Counties U.S.A. Less than $5, % 5.4% 3.8% $5,000 to $9, % 5.4% 5.5% $10,000 to $14, % 6.6% 7.2% $15,000 to $19, % 8.0% 6.4% $20,000 to $29, % 14.6% 12.5% $30,000 to $39, % 14.2% 11.9% $40,000 to $49, % 11.5% 9.8% $50,000 to $69, % 15.4% 14.4% $70,000 to $79, % 5.1% 5.7% $80,000 to $99, % 6.6% 8.1% $100,000 to $119, % 2.8% 5.2% $120,000 to $149, % 2.2% 4.0% $150,000 and more 3.6% 2.1% 5.5% 18% Distribution of Households by Annual Income: Rolla, 7-County Region, USA 16% 14% 12% 10% 8% 6% 4% 2% Rolla City 7 Counties U.S.A. 0% < $5,000 $5-$10,000 $10-$15,000 $15-$20,000 $20-$30,000 $30-$40,000 $40-$50,000 $50-$70,000 $70-$80,000 $80-$100,000 $100-$120,000 $120-$150,000 > $150,000 DEVELOPMENT STRATEGIES 22
26 Development Strategies Percent of Retail Spending by Category: determined the amount Rolla, 7 Counties, and USA of spending by each income group for a wide range of retail categories, as shown on the accompanying graph. Food at home Food away from home Alcoholic beverages Personal services Other household expenses Rolla City Laundry and cleaning supplies Combining these spending Other household products 7 Counties patterns reveals the proportions of retail Postage and stationery Household textiles U.S.A. Furniture spending that Rolla, the Floor coverings Seven-County region, and the U.S. as a whole spend in each category. Major appliances Misc. housewares Misc. household equipment Men and boys clothing As it turns out, there is not much variation. Women and girls clothing Children under 2 clothing Footwear For instance, Americans spend about 18.1% of their retail dollars on food at home, or purchases typically made at grocery stores. Rolla residents spend only a little more 18.7%. Meanwhile, Americans Other apparel products Gasoline and motor oil Vehicle maintenance Drugs Medical supplies Fees and admissions AV equipment and services Pets, toys, hobbies Other entertainment equipment Personal care Reading Tobacco products as a whole spend only a little more than Rolla residents on food away from home, or purchases made at restaurants. 0% 2% 4% 6% 8% 10% 12% 14% 16% 18% 20% These differences, however, are so small that they should not effect retail attraction and growth strategies in Rolla. Retailers who would be interested in the Rolla market including the buying power of the seven-county region are not likely to consider this market as so different from national averages that they would either shy away or would insist that they need a different kind of store or store management than is their norm. DEVELOPMENT STRATEGIES 23
27 Having said that, there are certainly differences in the proportions of spending by income group for each retail category, as shown to the right for the city of Rolla. Rolla residents as a whole spend 18.7% of their retail dollars on food at home, but the highest income households spend only 12.8% while the lowest spend 22.0%. This is not necessarily because wealthier people eat less; indeed, high income and low income households may eat much the same. But it takes a lower share of the higher income household s income to purchase the same amount of food. Thus, the table can be useful for understanding different spending patterns among different groups. The following pages contain similar tables for the entire seven-county region and for the U.S. as a whole for comparative purposes. Proportion of Retail Spending by Household Income Group in Retail Spending Categories- City of Rolla (2007 Estimates) $150,000 and more Total Rolla $120,000 to $149,999 $100,000 to $119,999 $80,000 to $99,999 $70,000 to $79,999 $50,000 to $69,999 $40,000 to $49,999 $30,000 to $39,999 $20,000 to $29,999 $15,000 to $19,999 $10,000 to $14,999 $5,000 to $9,999 Less than $5,000 Food at home 22.0% 25.8% 25.1% 22.1% 22.2% 18.6% 18.7% 19.0% 17.9% 17.0% 17.0% 15.4% 12.8% 18.7% Food away from home 15.1% 13.1% 12.6% 11.5% 12.5% 13.5% 14.3% 15.1% 14.9% 15.3% 15.2% 15.0% 15.2% 14.3% Alcoholic beverages 2.4% 2.3% 1.7% 2.1% 2.0% 2.4% 2.3% 2.4% 2.3% 2.4% 2.3% 2.1% 2.8% 2.3% Personal services 0.8% 0.8% 1.1% 0.9% 1.4% 1.2% 1.6% 1.5% 1.9% 2.6% 2.2% 1.8% 2.5% 1.7% Other household expenses 2.2% 1.9% 2.0% 2.7% 2.3% 2.4% 2.2% 2.4% 2.4% 2.6% 2.7% 2.9% 4.1% 2.6% Laundry and cleaning supplies 0.8% 1.1% 0.9% 1.0% 0.9% 0.8% 0.9% 0.8% 0.7% 0.7% 0.7% 0.6% 0.5% 0.8% Other household products 1.6% 1.6% 1.8% 2.3% 1.6% 1.7% 1.7% 1.8% 1.7% 1.6% 2.3% 1.9% 1.6% 1.7% Postage and stationery 0.8% 0.8% 0.9% 0.8% 0.9% 0.8% 0.9% 0.9% 0.8% 1.0% 0.9% 0.9% 0.7% 0.9% Household textiles 0.3% 0.4% 0.5% 0.8% 0.8% 0.8% 0.8% 0.8% 0.8% 0.8% 0.7% 0.5% 0.8% 0.7% Furniture 2.1% 1.5% 1.7% 2.5% 1.6% 2.3% 2.4% 2.0% 2.6% 2.7% 2.8% 3.9% 3.9% 2.5% Floor coverings 0.3% 0.2% 0.1% 0.3% 0.2% 0.1% 0.3% 0.3% 0.2% 0.3% 0.3% 0.4% 0.8% 0.3% Major appliances 0.7% 0.6% 1.1% 0.8% 1.1% 0.9% 1.1% 1.2% 1.1% 1.3% 1.6% 1.3% 1.8% 1.2% Small appliances, miscellaneous housewares 0.3% 0.5% 0.5% 0.8% 0.5% 0.5% 0.4% 0.5% 0.7% 0.7% 0.6% 0.6% 0.7% 0.6% Miscellaneous household equipment 4.9% 2.8% 2.4% 2.8% 3.0% 4.6% 4.2% 3.8% 3.9% 4.5% 5.2% 4.8% 6.0% 4.2% Men and boys clothing 3.2% 2.3% 2.4% 1.7% 2.0% 2.2% 2.5% 2.6% 2.0% 2.4% 2.6% 2.4% 2.8% 2.4% Women and girls clothing 4.3% 4.4% 4.2% 3.4% 3.9% 4.0% 3.4% 4.2% 3.7% 4.3% 4.2% 4.5% 4.7% 4.1% Children under 2 clothing 0.5% 0.4% 0.4% 0.6% 0.6% 0.6% 0.4% 0.4% 0.5% 0.5% 0.5% 0.4% 0.3% 0.5% Footwear 2.7% 2.3% 2.6% 1.7% 2.0% 2.3% 1.7% 1.8% 1.5% 1.5% 1.3% 1.5% 1.6% 1.8% Other apparel products and services 1.5% 1.3% 1.2% 1.1% 1.3% 1.3% 1.1% 1.2% 1.7% 1.3% 1.7% 2.0% 3.1% 1.5% Gasoline and motor oil 10.5% 9.8% 10.9% 11.7% 12.8% 12.7% 13.0% 12.4% 11.5% 11.7% 10.9% 9.6% 7.6% 11.4% Vehicle maintenance and repairs 3.2% 3.4% 3.4% 4.0% 4.1% 3.8% 3.7% 3.8% 4.4% 3.9% 3.7% 3.7% 3.0% 3.8% Drugs 2.6% 3.8% 5.0% 5.5% 4.5% 3.7% 3.5% 2.7% 2.4% 2.5% 2.0% 2.0% 1.6% 3.1% Medical supplies 0.6% 0.6% 0.5% 0.7% 0.7% 0.6% 0.6% 0.6% 0.6% 0.6% 0.7% 0.5% 0.5% 0.6% Entertainment fees and admissions 2.4% 1.7% 1.6% 1.7% 1.9% 2.3% 2.3% 2.6% 3.3% 3.5% 4.0% 3.9% 6.3% 3.0% Audio and visual equipment and services 5.0% 5.8% 5.5% 5.7% 5.2% 5.4% 5.2% 5.0% 4.8% 4.9% 4.5% 4.4% 4.5% 5.0% Pets, toys, hobbies, and playground equipment 1.7% 1.9% 1.9% 2.0% 2.1% 2.2% 2.6% 2.4% 2.2% 2.5% 2.6% 2.5% 2.2% 2.3% Other entertainment supplies and equipment 1.3% 1.8% 1.1% 1.9% 1.4% 2.0% 2.2% 2.6% 4.9% 2.0% 2.1% 5.9% 3.6% 2.5% Personal care products and services 2.8% 3.0% 3.2% 3.1% 3.0% 2.8% 3.1% 2.9% 2.9% 2.9% 3.0% 3.2% 3.0% 3.0% Reading 0.6% 0.5% 0.7% 0.8% 0.7% 0.7% 0.7% 0.7% 0.7% 0.7% 0.8% 0.7% 0.8% 0.7% Tobacco products and smoking supplies 2.9% 3.6% 3.0% 3.1% 2.9% 2.8% 2.3% 1.9% 1.2% 1.4% 1.1% 0.7% 0.5% 2.0% Total spent per year by income base $4,490,000 $3,863,000 $3,898,000 $5,005,000 $11,222,000 $13,122,000 $9,129,000 $16,630,000 $8,464,000 $14,028,000 $5,171,000 $4,971,000 $11,025,000 $111,017,000 Average spent per individual household $8,290 $7,130 $8,510 $9,610 $11,390 $14,110 $15,850 $19,270 $22,640 $25,010 $29,100 $33,470 $44,120 $15,990 Sources: U.S. Department of Labor Consumer Expenditure Survey, ESRI, and Development Strategies. DEVELOPMENT STRATEGIES 24
28 Proportion of Retail Spending by Household Income Group in Retail Spending Categories- Seven-County Region (2007 Estimates) Less than $5,000 $5,000 to $9,999 $10,000 to $14,999 $15,000 to $19,999 $20,000 to $29,999 $30,000 to $39,999 $40,000 to $49,999 $50,000 to $69,999 $70,000 to $79,999 $80,000 to $99,999 $100,000 to $119,999 $120,000 to $149,999 $150,000 and more Food at home 22.0% 25.8% 25.1% 22.1% 22.2% 18.6% 18.7% 19.0% 17.9% 17.0% 17.0% 15.4% 12.8% 18.9% Food away from home 15.1% 13.1% 12.6% 11.5% 12.5% 13.5% 14.3% 15.1% 14.9% 15.3% 15.2% 15.0% 15.2% 14.2% Alcoholic beverages 2.4% 2.3% 1.7% 2.1% 2.0% 2.4% 2.3% 2.4% 2.3% 2.4% 2.3% 2.1% 2.8% 2.3% Personal services 0.8% 0.8% 1.1% 0.9% 1.4% 1.2% 1.6% 1.5% 1.9% 2.6% 2.2% 1.8% 2.5% 1.6% Other household expenses 2.2% 1.9% 2.0% 2.7% 2.3% 2.4% 2.2% 2.4% 2.4% 2.6% 2.7% 2.9% 4.1% 2.5% Laundry and cleaning supplies 0.8% 1.1% 0.9% 1.0% 0.9% 0.8% 0.9% 0.8% 0.7% 0.7% 0.7% 0.6% 0.5% 0.8% Other household products 1.6% 1.6% 1.8% 2.3% 1.6% 1.7% 1.7% 1.8% 1.7% 1.6% 2.3% 1.9% 1.6% 1.7% Postage and stationery 0.8% 0.8% 0.9% 0.8% 0.9% 0.8% 0.9% 0.9% 0.8% 1.0% 0.9% 0.9% 0.7% 0.9% Household textiles 0.3% 0.4% 0.5% 0.8% 0.8% 0.8% 0.8% 0.8% 0.8% 0.8% 0.7% 0.5% 0.8% 0.7% Furniture 2.1% 1.5% 1.7% 2.5% 1.6% 2.3% 2.4% 2.0% 2.6% 2.7% 2.8% 3.9% 3.9% 2.4% Floor coverings 0.3% 0.2% 0.1% 0.3% 0.2% 0.1% 0.3% 0.3% 0.2% 0.3% 0.3% 0.4% 0.8% 0.3% Major appliances 0.7% 0.6% 1.1% 0.8% 1.1% 0.9% 1.1% 1.2% 1.1% 1.3% 1.6% 1.3% 1.8% 1.2% Small appliances, miscellaneous housewares 0.3% 0.5% 0.5% 0.8% 0.5% 0.5% 0.4% 0.5% 0.7% 0.7% 0.6% 0.6% 0.7% 0.6% Miscellaneous household equipment 4.9% 2.8% 2.4% 2.8% 3.0% 4.6% 4.2% 3.8% 3.9% 4.5% 5.2% 4.8% 6.0% 4.1% Men and boys clothing 3.2% 2.3% 2.4% 1.7% 2.0% 2.2% 2.5% 2.6% 2.0% 2.4% 2.6% 2.4% 2.8% 2.4% Women and girls clothing 4.3% 4.4% 4.2% 3.4% 3.9% 4.0% 3.4% 4.2% 3.7% 4.3% 4.2% 4.5% 4.7% 4.0% Children under 2 clothing 0.5% 0.4% 0.4% 0.6% 0.6% 0.6% 0.4% 0.4% 0.5% 0.5% 0.5% 0.4% 0.3% 0.5% Footwear Total Seven Counties 2.7% 2.3% 2.6% 1.7% 2.0% 2.3% 1.7% 1.8% 1.5% 1.5% 1.3% 1.5% 1.6% 1.8% Other apparel products and services 1.5% 1.3% 1.2% 1.1% 1.3% 1.3% 1.1% 1.2% 1.7% 1.3% 1.7% 2.0% 3.1% 1.4% Gasoline and motor oil 10.5% 9.8% 10.9% 11.7% 12.8% 12.7% 13.0% 12.4% 11.5% 11.7% 10.9% 9.6% 7.6% 11.7% Vehicle maintenance and repairs 3.2% 3.4% 3.4% 4.0% 4.1% 3.8% 3.7% 3.8% 4.4% 3.9% 3.7% 3.7% 3.0% 3.8% Drugs 2.6% 3.8% 5.0% 5.5% 4.5% 3.7% 3.5% 2.7% 2.4% 2.5% 2.0% 2.0% 1.6% 3.2% Medical supplies 0.6% 0.6% 0.5% 0.7% 0.7% 0.6% 0.6% 0.6% 0.6% 0.6% 0.7% 0.5% 0.5% 0.6% Entertainment fees and admissions 2.4% 1.7% 1.6% 1.7% 1.9% 2.3% 2.3% 2.6% 3.3% 3.5% 4.0% 3.9% 6.3% 2.8% Audio and visual equipment and services 5.0% 5.8% 5.5% 5.7% 5.2% 5.4% 5.2% 5.0% 4.8% 4.9% 4.5% 4.4% 4.5% 5.0% Pets, toys, hobbies, and playground equipment 1.7% 1.9% 1.9% 2.0% 2.1% 2.2% 2.6% 2.4% 2.2% 2.5% 2.6% 2.5% 2.2% 2.3% Other entertainment supplies and equipment 1.3% 1.8% 1.1% 1.9% 1.4% 2.0% 2.2% 2.6% 4.9% 2.0% 2.1% 5.9% 3.6% 2.5% Personal care products and services 2.8% 3.0% 3.2% 3.1% 3.0% 2.8% 3.1% 2.9% 2.9% 2.9% 3.0% 3.2% 3.0% 3.0% Reading 0.6% 0.5% 0.7% 0.8% 0.7% 0.7% 0.7% 0.7% 0.7% 0.7% 0.8% 0.7% 0.8% 0.7% Tobacco products and smoking supplies 2.9% 3.6% 3.0% 3.1% 2.9% 2.8% 2.3% 1.9% 1.2% 1.4% 1.1% 0.7% 0.5% 2.0% Average spent per household $8,290 $7,130 $8,510 $9,610 $11,390 $14,110 $15,850 $19,270 $22,640 $25,010 $29,100 $33,470 $44,120 $15,880 Sources: U.S. Department of Labor Consumer Expenditure Survey, ESRI, and Development Strategies. DEVELOPMENT STRATEGIES 25
29 Proportion of Retail Spending by Household Income Group in Retail Spending Categories- Seven-County Region (2007 Estimates) Less than $5,000 $5,000 to $9,999 $10,000 to $14,999 $15,000 to $19,999 $20,000 to $29,999 $30,000 to $39,999 $40,000 to $49,999 $50,000 to $69,999 $70,000 to $79,999 $80,000 to $99,999 $100,000 to $119,999 $120,000 to $149,999 $150,000 and more Total USA Food at home 22.0% 25.8% 25.1% 22.1% 22.2% 18.6% 18.7% 19.0% 17.9% 17.0% 17.0% 15.4% 12.8% 100.0% Food away from home 15.1% 13.1% 12.6% 11.5% 12.5% 13.5% 14.3% 15.1% 14.9% 15.3% 15.2% 15.0% 15.2% 0.0% Alcoholic beverages 2.4% 2.3% 1.7% 2.1% 2.0% 2.4% 2.3% 2.4% 2.3% 2.4% 2.3% 2.1% 2.8% 0.0% Personal services 0.8% 0.8% 1.1% 0.9% 1.4% 1.2% 1.6% 1.5% 1.9% 2.6% 2.2% 1.8% 2.5% 0.0% Other household expenses 2.2% 1.9% 2.0% 2.7% 2.3% 2.4% 2.2% 2.4% 2.4% 2.6% 2.7% 2.9% 4.1% 0.0% Laundry and cleaning supplies 0.8% 1.1% 0.9% 1.0% 0.9% 0.8% 0.9% 0.8% 0.7% 0.7% 0.7% 0.6% 0.5% 0.0% Other household products 1.6% 1.6% 1.8% 2.3% 1.6% 1.7% 1.7% 1.8% 1.7% 1.6% 2.3% 1.9% 1.6% 0.0% Postage and stationery 0.8% 0.8% 0.9% 0.8% 0.9% 0.8% 0.9% 0.9% 0.8% 1.0% 0.9% 0.9% 0.7% 0.0% Household textiles 0.3% 0.4% 0.5% 0.8% 0.8% 0.8% 0.8% 0.8% 0.8% 0.8% 0.7% 0.5% 0.8% 0.0% Furniture 2.1% 1.5% 1.7% 2.5% 1.6% 2.3% 2.4% 2.0% 2.6% 2.7% 2.8% 3.9% 3.9% 0.0% Floor coverings 0.3% 0.2% 0.1% 0.3% 0.2% 0.1% 0.3% 0.3% 0.2% 0.3% 0.3% 0.4% 0.8% 0.0% Major appliances 0.7% 0.6% 1.1% 0.8% 1.1% 0.9% 1.1% 1.2% 1.1% 1.3% 1.6% 1.3% 1.8% 0.0% Small appliances, miscellaneous housewares 0.3% 0.5% 0.5% 0.8% 0.5% 0.5% 0.4% 0.5% 0.7% 0.7% 0.6% 0.6% 0.7% 0.0% Miscellaneous household equipment 4.9% 2.8% 2.4% 2.8% 3.0% 4.6% 4.2% 3.8% 3.9% 4.5% 5.2% 4.8% 6.0% 0.0% Men and boys clothing 3.2% 2.3% 2.4% 1.7% 2.0% 2.2% 2.5% 2.6% 2.0% 2.4% 2.6% 2.4% 2.8% 0.0% Women and girls clothing 4.3% 4.4% 4.2% 3.4% 3.9% 4.0% 3.4% 4.2% 3.7% 4.3% 4.2% 4.5% 4.7% 0.0% Children under 2 clothing 0.5% 0.4% 0.4% 0.6% 0.6% 0.6% 0.4% 0.4% 0.5% 0.5% 0.5% 0.4% 0.3% 0.0% Footwear 2.7% 2.3% 2.6% 1.7% 2.0% 2.3% 1.7% 1.8% 1.5% 1.5% 1.3% 1.5% 1.6% 0.0% Other apparel products and services 1.5% 1.3% 1.2% 1.1% 1.3% 1.3% 1.1% 1.2% 1.7% 1.3% 1.7% 2.0% 3.1% 0.0% Gasoline and motor oil 10.5% 9.8% 10.9% 11.7% 12.8% 12.7% 13.0% 12.4% 11.5% 11.7% 10.9% 9.6% 7.6% 0.0% Vehicle maintenance and repairs 3.2% 3.4% 3.4% 4.0% 4.1% 3.8% 3.7% 3.8% 4.4% 3.9% 3.7% 3.7% 3.0% 0.0% Drugs 2.6% 3.8% 5.0% 5.5% 4.5% 3.7% 3.5% 2.7% 2.4% 2.5% 2.0% 2.0% 1.6% 0.0% Medical supplies 0.6% 0.6% 0.5% 0.7% 0.7% 0.6% 0.6% 0.6% 0.6% 0.6% 0.7% 0.5% 0.5% 0.0% Entertainment fees and admissions 2.4% 1.7% 1.6% 1.7% 1.9% 2.3% 2.3% 2.6% 3.3% 3.5% 4.0% 3.9% 6.3% 0.0% Audio and visual equipment and services 5.0% 5.8% 5.5% 5.7% 5.2% 5.4% 5.2% 5.0% 4.8% 4.9% 4.5% 4.4% 4.5% 0.0% Pets, toys, hobbies, and playground equipment 1.7% 1.9% 1.9% 2.0% 2.1% 2.2% 2.6% 2.4% 2.2% 2.5% 2.6% 2.5% 2.2% 0.0% Other entertainment supplies and equipment 1.3% 1.8% 1.1% 1.9% 1.4% 2.0% 2.2% 2.6% 4.9% 2.0% 2.1% 5.9% 3.6% 0.0% Personal care products and services 2.8% 3.0% 3.2% 3.1% 3.0% 2.8% 3.1% 2.9% 2.9% 2.9% 3.0% 3.2% 3.0% 0.0% Reading 0.6% 0.5% 0.7% 0.8% 0.7% 0.7% 0.7% 0.7% 0.7% 0.7% 0.8% 0.7% 0.8% 0.0% Tobacco products and smoking supplies 2.9% 3.6% 3.0% 3.1% 2.9% 2.8% 2.3% 1.9% 1.2% 1.4% 1.1% 0.7% 0.5% 0.0% Average spent per individual household $8,290 $7,130 $8,510 $9,610 $11,390 $14,110 $15,850 $19,270 $22,640 $25,010 $29,100 $33,470 $44,120 $381,685,480 Sources: U.S. Department of Labor Consumer Expenditure Survey, ESRI, and Development Strategies. DEVELOPMENT STRATEGIES 26
30 APPENDIX A: RETAIL OPPORTUNITY GAP ANALYSIS An area s retail opportunity gap is essentially a measure of the difference between the current retail supply and the current demand for retail in the area. The area s retail supply is an estimate of sales to consumers, while the demand is an estimate of the expected amount consumers will spend at retail establishments, often referred to as the area s retail sales and retail potential, respectively. When the difference between the area s demand and supply is negative, there is a surplus (i.e.: supply is greater than demand), indicating that the area is drawing in consumers from outside the market area. Conversely, when the opportunity gap is positive, a shortage exists (i.e.: demand is greater than supply), suggesting that the area s residents are traveling outside the market area to meet their retail needs. This situation is also described as a leakage of retail opportunity outside the retail area. Finally, for benchmarking purposes, market equilibrium is defined as the point at which supply and demand are equal for a given area. Rolla maintains a significant negative retail opportunity gap, indicating that the city is drawing in a substantial amount of consumers from outside its market area. Meanwhile, the surrounding areas within Phelps County have a positive retail gap, suggesting that consumers from these areas are going elsewhere to purchase goods and services. Additionally, two of the six counties surrounding Phelps County have positive gaps (leakage) and four maintain negative gaps (surplus), although opportunity gaps exist at the industry level in all counties. The critical measurement in determining Rolla s actual retail opportunity is an estimate of the percentage of regional leakage Rolla should capture. That is: of the consumers already traveling outside their home town or county to purchase goods and services, what percentage will travel to Rolla? As a first step in determining the consumers Rolla can attract from these areas, we have examined the retail gaps of each area by industry group, as defined by the North American Industry Classification System (NAICS). Using this system, we classified all retail businesses into 12 major groups with 25 total subgroups, which include both the Retail Trade and Food and Drink industry sectors. This step helps refine our study by allowing us to focus on specific industry groups in surrounding areas. The following chart summarizes the opportunity gap for each industry group for the seven-county area surrounding Rolla. Charts detailing the retail sales, retail potential, opportunity gap, and market equilibrium by industry for each county are included at the end of the section. DEVELOPMENT STRATEGIES A-27
31 Opportunity Gap by Area Rolla City Phelps County Donut (less Rolla) Crawford County Dent County Texas County Gasconade County Maries County Pulaski County Total Opportunity Gap Industry Summary Total Retail Trade and Food & Drink (NAICS 44-45, 722) ($259,265,798) $112,393,828 $46,202,090 ($13,576,688) ($1,782,516) ($19,870,146) $29,801,410 ($119,786,421) ($225,884,241) Total Retail Trade (NAICS 44-45) ($202,724,911) $66,979,831 $36,431,271 ($7,012,511) ($14,751,909) ($25,628,931) $23,734,050 ($103,529,943) ($226,503,053) Total Food & Drink (NAICS 722) ($56,540,887) $45,413,997 $9,770,819 ($6,564,177) $12,969,393 $5,758,785 $6,067,360 ($16,256,478) $618,812 Industry Group Motor Vehicle & Parts Dealers (NAICS 441) ($17,626,919) ($1,675,077) $28,832,417 $15,294,534 ($974,924) $11,965,142 $8,043,018 ($4,199,454) $39,658,737 Automobile Dealers (NAICS 4411) ($9,233,151) ($2,946,692) $28,689,924 $16,726,055 ($1,525,088) $11,764,009 $7,851,008 ($6,496,712) $44,829,353 Other Motor Vehicle Dealers (NAICS 4412) ($1,268,995) ($4,464,729) ($455,523) ($956,644) $1,111,915 $1,268,188 $0 $2,862,523 ($1,903,265) Auto Parts, Accessories, and Tire Stores (NAICS 4413) ($7,124,773) $5,736,344 $598,016 ($474,877) ($561,751) ($1,067,055) $192,010 ($565,265) ($3,267,351) Furniture & Home Furnishings Stores (NAICS 442) ($5,187,256) $3,754,662 $1,756,563 ($1,026,199) ($1,194,857) ($926,701) $1,320,177 ($108,781) ($1,612,392) Furniture Stores (NAICS 4421) ($4,453,457) $4,453,457 $661,626 ($1,114,690) $863,059 $735,113 $204,795 ($442,369) $907,534 Home Furnishings Stores (NAICS 4422) ($733,799) ($698,795) $1,094,937 $88,491 ($2,057,916) ($1,661,814) $1,115,382 $333,588 ($2,519,926) Electronics & Appliance Stores (NAICS 443/NAICS 4431) ($2,034,242) $988,436 $3,080,701 $437,942 $1,326,072 $1,518,667 $1,233,700 $2,595,134 $9,146,410 Bldg Materials, Garden Equip. & Supply Stores (NAICS 444) ($21,346,624) $17,028,786 $1,560,532 ($1,011,259) $3,054,419 ($5,503,194) $2,173,424 $836,807 ($3,207,109) Building Material and Supplies Dealers (NAICS 4441) ($21,259,972) $16,968,748 $1,536,767 ($991,486) $2,306,419 ($5,240,342) $2,152,697 $926,287 ($3,600,882) Lawn and Garden Equipment and Supplies Stores (NAICS 4442) ($86,652) $60,038 $23,765 ($19,773) $748,000 ($262,852) $20,727 ($89,480) $393,773 Food & Beverage Stores (NAICS 445) ($6,839,385) ($6,233,361) ($1,278,301) $2,749,733 $4,658,715 ($3,576,217) ($4,275,976) ($1,386,631) ($16,181,423) Grocery Stores (NAICS 4451) ($6,456,098) ($5,676,105) ($1,094,747) $3,192,351 $4,505,625 ($1,129,984) ($4,275,976) ($1,982,024) ($12,916,958) Specialty Food Stores (NAICS 4452) $50,200 ($145,483) $35,362 Not Available $33,714 ($2,240,354) Not Available ($17,450) ($2,284,011) Beer, Wine, and Liquor Stores (NAICS 4453) ($433,487) ($411,773) ($218,916) ($442,618) $119,376 ($205,879) Not Available $612,843 ($980,454) Health & Personal Care Stores (NAICS 446/NAICS 4461) ($39,120,031) $34,622,351 ($126,626) ($3,319,534) $260,876 ($2,671,940) ($880,482) ($705,809) ($11,941,195) Gasoline Stations (NAICS 447/NAICS 4471) ($50,448,553) ($9,241,021) ($24,973,187) ($15,102,766) ($37,449,500) ($13,457,942) ($957,313) ($11,879,348) ($163,509,630) Clothing and Clothing Accessories Stores (NAICS 448) ($2,554,195) $1,766,576 $1,538,420 ($190,765) $2,201,103 $1,040,209 Not Available $40,488 $3,841,836 Clothing Stores (NAICS 4481) ($1,218,564) $793,600 $1,076,882 ($190,765) $1,609,018 $856,397 Not Available ($303,914) $2,622,654 Shoe Stores (NAICS 4482) ($263,456) ($20,702) $425,893 Not Available $587,948 $285,891 Not Available $321,036 $1,336,610 Jewelry, Luggage, and Leather Goods Stores (NAICS 4483) ($1,072,175) $993,678 $35,645 Not Available $4,137 ($102,079) Not Available $23,366 ($117,428) Sporting Goods, Hobby, Book, and Music Stores (NAICS 451) ($4,324,383) $2,363,887 ($1,205,270) ($1,247,088) ($484,024) ($63,995) $463 ($1,391,354) ($6,351,764) Sporting Goods/Hobby/Musical Instrument Stores (NAICS 4511) ($1,661,053) $35,159 ($1,423,699) ($110,528) ($111,834) ($437,221) $63,378 ($1,030,864) ($4,676,662) Book, Periodical, and Music Stores (NAICS 4512) ($2,663,330) $2,328,728 $218,429 ($1,136,560) ($372,190) $373,226 ($62,915) ($360,490) ($1,675,102) General Merchandise Stores (NAICS 452) ($41,955,229) $14,437,997 $25,415,742 ($227,162) $15,582,613 ($9,274,650) $16,827,281 ($11,951,573) $8,855,019 Department Stores Excluding Leased Depts. (NAICS 4521) ($39,759,344) $35,183,212 $11,167,179 ($4,409,042) $10,288,867 ($4,025,540) $4,730,157 $8,956,738 $22,132,227 Other General Merchandise Stores (NAICS 4529) ($2,195,885) ($20,745,215) $14,248,563 $4,181,880 $5,293,746 ($5,249,110) $12,097,124 ($20,908,311) ($13,277,208) Miscellaneous Store Retailers (NAICS 453) ($11,340,116) $9,218,617 ($197,949) ($4,983,152) ($920,881) ($5,609,052) ($22,717) ($2,847,599) ($16,702,849) Florists (NAICS 4531) ($513,600) $286,455 $163,601 ($208,444) ($130,248) ($55,464) ($36,834) ($363,199) ($857,733) Office Supplies, Stationery, and Gift Stores (NAICS 4532) ($1,246,424) $1,101,610 $678,636 ($5,470) ($2,331) ($25,097) $294,641 $848,884 $1,644,449 Used Merchandise Stores (NAICS 4533) ($1,380,899) $1,179,057 $39,122 ($605,927) ($80,077) ($832,286) ($75,082) ($243,004) ($1,999,096) Other Miscellaneous Store Retailers (NAICS 4539) ($8,199,193) $6,651,495 ($1,079,308) ($4,163,311) ($708,225) ($4,696,205) ($205,442) ($3,090,280) ($15,490,469) Food Services & Drinking Places (NAICS 722) ($56,540,887) $45,413,997 $9,770,819 ($6,564,177) $12,969,393 $5,758,785 $6,067,360 ($16,256,478) $618,812 Full-Service Restaurants (NAICS 7221) ($42,642,970) $36,369,580 $4,798,106 ($5,544,485) $8,071,313 $7,023,896 $5,613,110 ($11,431,530) $2,257,020 Limited-Service Eating Places (NAICS 7222) ($11,453,433) $7,310,012 $3,955,548 ($435,737) $4,832,692 ($471,188) $382,694 $1,031,356 $5,151,944 Special Food Services (NAICS 7223) ($2,221,039) $2,113,917 $1,161,532 ($322,749) $24,667 ($233,865) $119,891 ($336,798) $305,556 Drinking Places - Alcoholic Beverages (NAICS 7224) ($223,445) ($379,512) ($144,367) ($261,206) $40,721 ($560,058) ($48,335) ($5,519,506) ($7,095,708) Source: ESRI (2007) Note: A negative Retail Opportunity Gap indicates a Surplus (consumers are being drawn from other areas); a positive Retail Opportunity Gap indicates Leakage (consumers are traveling to other areas). DEVELOPMENT STRATEGIES A-28
32 Next, we studied the retail options consumers have in each of the seven counties surrounding Rolla (Phelps, Crawford, Dent, Texas, Gasconade, Maries, and Pulaski County). That is, a county with a positive opportunity gap will most likely leak consumers in multiple directions, depending on the location of other retail options. The presence of a big box retailer in a city or town is a sound indicator that the city will contain a relatively broad array of retail options, as other types of retail stores traditionally cluster around the larger store. Consumers will typically choose to travel to a location with a number of retail options instead of a location with limited options. Therefore, we identified the locations of big box retailers, including Wal-Mart, Target, Kmart, Best Buy, Lowes, and Home Depot, in the seven counties surrounding Rolla and the additional 16 counties surrounding them. The following table lists the locations of these large retail outlets, with cities acting as regional magnets (indicated by the presence of at least three big box retailers in one city) shown in bold. Cities with Existing Big Box Retailers Location (City) Distance to Rolla Wal-Mart Target Kmart Best Buy Lowes Home Depot miles min Camdenton X Cuba X Eldon X Fulton X Houston X Jefferson City X X X Lebanon X X Mountain view X Mountain Grove X Osage Beach X X X Owensville X Potosi X Rolla 0 0 X X X Salem X St Robert X St Thomas X Sullivan X Union X Warrenton X Washington X X* X West Plains X *Washington Target location opened summer 2007 We then calculated the approximate percentage of consumers Rolla can reasonably expect to capture from the surrounding seven counties by evaluating the travel time to each of the competing retail options for each major population center within the county. For example, a consumer in Vienna, a town in central Maries County, has the option of traveling approximately 40 minutes northwest to Jefferson City or about DEVELOPMENT STRATEGIES A-29

33 30 minutes southeast to Rolla to access comparable shopping alternatives. We assert that the consumer will usually choose the shorter drive as long as the shopping experience and options in Rolla are at least as good as those in Jefferson City. In this case, therefore, Rolla would capture about 85 percent of the retail leakage from this town. As a step further, while consumers in Steelville, a town in central Crawford County, have the option of traveling 30 minutes to Rolla or 10 minutes to Cuba to meet their shopping needs, they will still choose Rolla at least half of the time, given Rolla s superior retail options (three big box centers) over Cuba (one big box store). Therefore, Rolla would capture 50 percent of the retail leakage from this town. The map on the following page shows the location of big box retailers in the area surrounding Rolla. Cities with one big box have shaded areas drawn around them denoting a 30-minute drive time, while those with three big box retailers have a 45 minute drive time area shown. Drive times from existing Big Box stores in south central Missouri. Source: ESRI. DEVELOPMENT STRATEGIES A-30
Nacogdoches Second Generation Restaurant Space 1208 N University Dr, Nacogdoches, TX 75961
 Nacogdoches Second Generation Restaurant Space 1208 N University Dr, Nacogdoches, TX 75961 Maxx Lovern William Roth Company 11551 Forest Central Dr.,Suite 110, Dallas, TX 75243 maxx.lovern@gmail.com (972)
Figure 1 Unleaded Gasoline Prices
 Policy Issues Just How Costly Is Gas? Summer 26 Introduction. Across the nation, the price at the pump has reached record highs. From unleaded to premium grade, prices have broken three dollars per gallon
FOR SALE. Prime Camp Bowie Retail Camp Bowie Blvd. W. Fort Worth, Texas Dick Myers
 9520 Camp Bowie Blvd. W. Fort Worth, Texas 76116 FOR SALE Prime Camp Bowie Retail FEATURES Location: 2 blocks west of Loop 820, west on Hwy. 80 Building Size: 6,900 SF (+/-) Land Size: 1.12 Acres (+/-)
Consumer Spending Patterns 2004 Report
 I-55 AND US HWY 64, MARION, AR, 0.00-3.00 Miles, Total Apparel: Total Apparel Women's Apparel Men's Apparel Girl's Apparel Boy's Apparel Infant's Apparel Footwear (excl. Infants) Other Apparel Prods/Services
NEWS RELEASE EMBARGOED UNTIL RELEASE AT 8:30 A.M. EDT, THURSDAY, MARCH 27, 2014
 NEWS RELEASE EMBARGOED UNTIL RELEASE AT 8:30 A.M. EDT, THURSDAY, MARCH 27, 2014 Lisa Mataloni: (202) 606-5304 (GDP) gdpniwd@bea.gov BEA 14-13 Kate Shoemaker: (202) 606-5564 (Profits) cpniwd@bea.gov GROSS
Consumer Spending Patterns
 CENTER OF TOWN, ROLLA, MO, 0.00-10.00 Miles, Total Apparel: Total Apparel 52,617 63,642 1,413 1,627 3,524 4,021 Women's Apparel 15,141 17,9 407 456 1,014 1,126 Men's Apparel 11,252 13,169 302 337 4 2 Girl's
Figure 1 Unleaded Gasoline Prices
 Policy Issues Just How Costly Is Gas? Summer 24 Introduction. Across the nation, the price at the pump has reached record highs. From unleaded to premium grade, prices have broken the two-dollar-per-gallon
Sigmon Commons 5225 Sigmon Rd, Wilmington, NC 28403
 Sigmon Commons 5225 Sigmon Rd, Wilmington, NC 28403 Matt Ray Ray Properties, Inc. 3684-C Henderson Drive,Jacksonville, NC 28546 matt@rayproperties.com (910) 388-6620 License: 266827 Sigmon Commons $1,991,000
Commercial Highway 27 Land Lake Hamilton Florida 3.5 AC +/- only $475, US HIGHWAY 27, Lake Hamilton, FL 33851
 Commercial Highway 27 Land Lake Hamilton Florida 3.5 AC +/- only $475,000 30650 US HIGHWAY 27, Lake Hamilton, FL 33851 Gary Gagnon GAGNON REAL ESTATE INVESTMENTS LLC 390 N ORANGE AVE,SUITE 2300, ORLANDO,
Available For Sale or Lease 4899 Wade Hampton Boulevard, Taylors, SC 29687
 Property Type: Daycare Center, Office, Studio or Training facility Price: Sale: $515,000.00 Lease: $3,600 per/mo. NNN Available For Sale or Lease 4899 Wade Hampton Boulevard, Taylors, SC 29687 Land Size:
EMBARGOED UNTIL RELEASE AT 8:30 A.M. EST, THURSDAY, JANUARY 30, 2014 GROSS DOMESTIC PRODUCT: FOURTH QUARTER AND ANNUAL 2013 (ADVANCE ESTIMATE)
") NEWS RELEASE EMBARGOED UNTIL RELEASE AT 8:30 A.M. EST, THURSDAY, JANUARY 30, 2014 BEA 14-03 Lisa Mataloni: (202) 606-5304 (GDP) gdpniwd@bea.gov Recorded message: (202) 606-5306 GROSS DOMESTIC PRODUCT:
NEWS RELEASE EMBARGOED UNTIL RELEASE AT 8:30 A.M. EST, THURSDAY, JANUARY 30, 2014 BEA 14-03 Lisa Mataloni: (202) 606-5304 (GDP) gdpniwd@bea.gov Recorded message: (202) 606-5306 GROSS DOMESTIC PRODUCT:
EMBARGOED UNTIL RELEASE AT 8:30 A.M. EST, WEDNESDAY, JANUARY 30, 2013 GROSS DOMESTIC PRODUCT: FOURTH QUARTER AND ANNUAL 2012 (ADVANCE ESTIMATE)
") NEWS RELEASE EMBARGOED UNTIL RELEASE AT 8:30 A.M. EST, WEDNESDAY, JANUARY 30, 2013 Lisa Mataloni: (202) 606-5304 (GDP) gdpniwd@bea.gov Recorded message: (202) 606-5306 BEA 13-02 GROSS DOMESTIC PRODUCT:
NEWS RELEASE EMBARGOED UNTIL RELEASE AT 8:30 A.M. EST, WEDNESDAY, JANUARY 30, 2013 Lisa Mataloni: (202) 606-5304 (GDP) gdpniwd@bea.gov Recorded message: (202) 606-5306 BEA 13-02 GROSS DOMESTIC PRODUCT:
EMBARGOED UNTIL RELEASE AT 8:30 A.M. EDT, THURSDAY, MAY 29, 2014
 NEWS RELEASE EMBARGOED UNTIL RELEASE AT 8:30 A.M. EDT, THURSDAY, MAY 29, 2014 Lisa Mataloni: (202) 606-5304 (GDP) gdpniwd@bea.gov BEA 14-21 Kate Shoemaker: (202) 606-5564 (Profits) cpniwd@bea.gov GROSS
EMBARGOED UNTIL RELEASE AT 8:30 A.M. EST, TUESDAY, DECEMBER 23, 2014
 NEWS RELEASE EMBARGOED UNTIL RELEASE AT 8:30 A.M. EST, TUESDAY, DECEMBER 23, 2014 Lisa Mataloni: (202) 606-5304 (GDP) gdpniwd@bea.gov BEA 14-65 Kate Shoemaker: (202) 606-5564 (Profits) cpniwd@bea.gov Jeannine
14138 SR 50-Clermont FL- Automobi
 14138 SR 50-Clermont FL- Automobi Presented by Coldwell Banker Commercial SRD Property Details This property has three components; First is the dealership with 54,000sf in four buildings is situated on
Image from:
 Mercer County 1. Background Information Mercer County was carved out of surrounding counties in 1838 and has a history dating back to the Revolutionary War. It has 13 municipalities covering 226 square
EMBARGOED UNTIL RELEASE AT 8:30 A.M. EST, FRIDAY, FEBRUARY 27, 2015
 NEWS RELEASE EMBARGOED UNTIL RELEASE AT 8:30 A.M. EST, FRIDAY, FEBRUARY 27, 2015 Lisa Mataloni: (202) 606-5304 (GDP) gdpniwd@bea.gov BEA 15-07 Jeannine Aversa: (202) 606-2649 (News Media) GROSS DOMESTIC
LEASE Cornelius Retail on Catawba
 Presented by G Brokerage Property Details Offering both retail and office spaces, these spaces are priced at $14 per square foot for office and $14 per square foot for retail. Options are available to
Demographics for 1745 Main St., West Warwick, RI 02893
 Demographics for 1745 Main St., West Warwick, RI 02893 Population 1-mi. 3-mi. 5-mi. 2012 Male Population 5,928 28,400 52,911 2012 Female Population 6,429 30,753 57,394 % 2012 Male Population 47.97% 48.01%
The Value of Travel-Time: Estimates of the Hourly Value of Time for Vehicles in Oregon 2007
 The Value of Travel-Time: Estimates of the Hourly Value of Time for Vehicles in Oregon 2007 Oregon Department of Transportation Long Range Planning Unit June 2008 For questions contact: Denise Whitney
Table 1. INCIDENCE RATES 1 BY INDUSTRY AND CASE TYPES
 from work, job transfer, ALL INDUSTRIES, INCLUDING STATE AND LOCAL GOVERNMENT 6 1,598.2 5.5 3.1 1.9 1.1 2.5 PRIVATE INDUSTRY 6 Goods Producing 6 1,382.6 5.1 2.9 1.7 1.2 2.2 267.4 6.5 3.7 2.1 1.6 2.8 Natural
51st & Thunderbird Shopping Center
 Presented by Wolf Realty Inc. Confidentiality Agreement Scot E. Hall wolfrealty@aol.com (602) 843-5200 License: Arizona, available upon request Wolf Realty Inc. 14021 N 51st Avenue Suite 114 Glendale,
Property Details. Forestbrook Shopping Center: Total Space Available: 23,039 S.F $5.00 NNN Cams:
 : For lease 24,000 SF currently, a YMCA. This location has been a gym since 1979 great opportunity for other fitness establishment to reopen much needed within the geographical area. Property Details Shopping
Statistical tables S 0. Money and banking. Capital market. National financial account. Public finance
 Statistical tables Money and banking Page S : Liabilities... 2 : Assets... 3 Corporation for Public Deposits: Liabilities... 4 Corporation for Public Deposits: Assets... 5 Banks: Liabilities... 6 7 Banks:
Downtown Vacant Property 000 Ward Street, Jacksonville, NC 28546
 Downtown Vacant Property 000 Ward Street, Jacksonville, NC 28546 Matt Ray Ray Properties, Inc. 3684-C Henderson Drive,Jacksonville, NC 28546 matt@rayproperties.com (910) 388-6620 License: 266827 Downtown
Funeral Home north of Clay Terrace 1621 Greyhound Pass, Carmel, IN 46032
 Funeral Home north of Clay Terrace 1621 Greyhound Pass, Carmel, IN 46032 gregg boyd GREGG BOYD, INC REALTORS & DEVELOPERS 865 West Carmel Drive,Suite 112, Carmel, IN 46032 gb@greggboyd.com (317) 843-1800
On The Border Cycle 2212 Spencer Hwy, Pasadena, TX 77504
 On The Border Cycle 2212 Spencer Hwy, Pasadena, TX 77504 Century Properties Century Properties 4504 Center St.,Deer Park, TX 77536 tim@timothygoss.com (832) 567-5853 License: 621929 On The Border Cycle
Furniture Row Retail building
 Presented by David Realty Partners Property Details For Lease or Sale. Plenty of excess land for parking, outdoor display /showroom or even additional building(s). Move in condition-neutral colors, better
EMBARGOED UNTIL RELEASE AT 8:30 A.M. EDT, FRIDAY, MARCH 25, 2016
 NEWS RELEASE EMBARGOED UNTIL RELEASE AT 8:30 A.M. EDT, FRIDAY, MARCH 25, 2016 GDP: Lisa Mataloni (202) 606-5304 gdpniwd@bea.gov Profits: Kate Pinard (202) 606-5564 cpniwd@bea.gov News Media: Jeannine Aversa
Space for Lease: 255 Riverside Drive
 Presented by Barnett Commercial Realty, Inc. Property Details 1465 SF Free-Standing Buildingideal for Medical, Retail or Professional Office Total Space Available: 1,465 SF Specific for Medical Use: Other:
EMBARGOED UNTIL RELEASE AT 8:30 A.M. EST, TUESDAY, DECEMBER 22, 2015
 NEWS RELEASE EMBARGOED UNTIL RELEASE AT 8:30 A.M. EST, TUESDAY, DECEMBER 22, 2015 GDP: Lisa Mataloni (202) 606-5304 gdpniwd@bea.gov Profits: Kate Pinard (202) 606-5564 cpniwd@bea.gov News Media: Jeannine
EMBARGOED UNTIL RELEASE AT 8:30 A.M. EST, FRIDAY, JANUARY 30, 2015 GROSS DOMESTIC PRODUCT: FOURTH QUARTER AND ANNUAL 2014 (ADVANCE ESTIMATE)
") NEWS RELEASE EMBARGOED UNTIL RELEASE AT 8:30 A.M. EST, FRIDAY, JANUARY 30, 2015 Lisa Mataloni: (202) 606-5304 (GDP) gdpniwd@bea.gov Jeannine Aversa: (202) 606-2649 (News Media) BEA 15-04 GROSS DOMESTIC
NEWS RELEASE EMBARGOED UNTIL RELEASE AT 8:30 A.M. EST, FRIDAY, JANUARY 30, 2015 Lisa Mataloni: (202) 606-5304 (GDP) gdpniwd@bea.gov Jeannine Aversa: (202) 606-2649 (News Media) BEA 15-04 GROSS DOMESTIC
EMBARGOED UNTIL RELEASE AT 8:30 A.M. EST, WEDNESDAY, JANUARY 31, 2007 GROSS DOMESTIC PRODUCT: FOURTH QUARTER 2006 (ADVANCE)
") NEWS RELEASE EMBARGOED UNTIL RELEASE AT 8:30 A.M. EST, WEDNESDAY, JANUARY 31, 2007 Virginia H. Mannering: (202) 606-5304 BEA 07-02 Recorded message: (202) 606-5306 GROSS DOMESTIC PRODUCT: FOURTH QUARTER
NEWS RELEASE EMBARGOED UNTIL RELEASE AT 8:30 A.M. EST, WEDNESDAY, JANUARY 31, 2007 Virginia H. Mannering: (202) 606-5304 BEA 07-02 Recorded message: (202) 606-5306 GROSS DOMESTIC PRODUCT: FOURTH QUARTER
Denver Car Share Program 2017 Program Summary
 Denver Car Share Program 2017 Program Summary Prepared for: Prepared by: Project Manager: Malinda Reese, PE Apex Design Reference No. P170271, Task Order #3 January 2018 Table of Contents 1. Introduction...
1800 W. YOSEMITE AVE. Presented by ARS Commercial W Yosemite Ave, Manteca, CA 95337
 Presented by ARS Commercial Property Details Practically turn key restaurant space on free standing lot! New Ansul hood, walk in freezer and sinks! Handicap improvements recently upgraded. Property is
HOUSING REPORT SOUTHEAST MICHIGAN 2ND QUARTER 2018
 SOUTHEAST MICHIGAN 2ND QUARTER 218 Southeast Michigan Curb Appeal for Added Value Curb appeal plays a significant role in getting your home ready to sell. Among Realtors, 94% have suggested that sellers
Dartmouth Towne Center 380 State Rd., North Dartmouth, MA 02747
 Dartmouth Towne Center 380 State Rd., North Dartmouth, MA 02747 Mark Sobel 1st US Realty P.O. Box 1261,Plymouth, MA 02362 msobel@1stusrealty.com (508) 280-4563 License: 9001978; 068555;0789804; 0018028
The Economic Contributions of the Japanese-Brand Automotive Industry to the Canadian. Economy,
 The Economic Contributions of the Japanese-Brand Automotive Industry to the Canadian Economy, 21-216 Prepared by: Greig Mordue, PhD & Brendan Sweeney, PhD Prepared for: JAMA Canada June 217 1 Executive
TABLE OF CONTENTS EXECUTIVE SUMMARY...1 INTRODUCTION...3 PROJECTED FUTURE GROWTH...3 ROADWAY IMPROVEMENT PROJECTS...4 POTENTIAL FUNDING SOURCES...
 Transportation Impact Fee Study September 2014 TABLE OF CONTENTS EXECUTIVE SUMMARY...1 INTRODUCTION...3 PROJECTED FUTURE GROWTH...3 ROADWAY IMPROVEMENT PROJECTS......4 POTENTIAL FUNDING SOURCES...7 PROPOSED
Summit Inn Hotel & Suites
 Presented by Sumit Dalwadi Property Details PLEASE DO NOT CONTACT PROPERTY DIRECTLY! 92 Unit Hotel for sale in the HOT college town of San Marcos! The property is fully equipped with a fitness center,
Statistical tables S 0. Money and banking. Capital market. National financial account. Public finance
 Statistical tables Money and banking Page S South African Reserve Bank: Liabilities... 2 South African Reserve Bank: Assets... 3 Corporation for Public Deposits: Liabilities... 4 Corporation for Public
Highway 24 Retail 2153 Lejeune Blvd, Jacksonville, NC 28546
 Highway 24 Retail 2153 Lejeune Blvd, Jacksonville, NC 28546 Matt Ray Ray Properties, Inc. 3684-C Henderson Drive,Jacksonville, NC 28546 matt@rayproperties.com (910) 388-6620 License: 266827 Highway 24
Airport Hangar at Concord Regional
 at Concord Regional Presented by G Brokerage Property Details Perfect opportunity to purchase an Airport Hangar in the growing Concord Regional Airport. The hangar building consists of 11,820 square feet
Boalsburg Tech Park Build-to-Suit. 176 Technology Drive, Boalsburg, PA 16827
 Property Details New Build-to-Suit opportunities in the Boalsburg Technology Park. Partnership and investment opportunities will be considered. The existing park will accommodate various building types
Downtown Lee s Summit Parking Study
 Downtown Lee s Summit Parking Study As part of the Downtown Lee s Summit Master Plan, a downtown parking and traffic study was completed by TranSystems Corporation in November 2003. The parking analysis
Churchill Farms Retail 4020 FM 1463, Fulshear, TX 77441
 Churchill Farms Retail 4020 FM 1463, Fulshear, TX 77441 Lee Patton Prestige Properties Texas 11525 S Fry Rd,Suite 106, Fulshear, TX 77441 lpatton@pattonprops.com (281) 960-9833 License: 600741 Churchill
170 Zerby Ave 170 Zerby Ave, Kingston, PA 18704
 170 Zerby Ave 170 Zerby Ave, Kingston, PA 18704 Joseph Leone Coldwell Banker 686 Dekalb Pike,Blue Bell, PA 19422 jfleone1@gmail.com (610) 551-5830 License: AB066230 170 Zerby Ave $135,000 Approx 4000 sf
REDEVELOPMENT OPPORTUNITY
 REDEVELOPMENT OPPORTUNITY Presented by Barnett Commercial Realty, Inc. Property Details Highly Visible Retail Centerlocated at the Five-Way Intersection of Memorial Boulevard (Highway 220Business), Church
Driver Personas. New Behavioral Clusters and Their Risk Implications. March 2018
 Driver Personas New Behavioral Clusters and Their Risk Implications March 2018 27 TABLE OF CONTENTS 1 2 5 7 8 10 16 18 19 21 Introduction Executive Summary Risky Personas vs. Average Auto Insurance Price
EMBARGOED UNTIL RELEASE AT 8:30 A.M. EDT, THURSDAY, AUGUST 27, 2015
 NEWS RELEASE EMBARGOED UNTIL RELEASE AT 8:30 A.M. EDT, THURSDAY, AUGUST 27, 2015 Lisa Mataloni: (202) 606-5304 (GDP) gdpniwd@bea.gov BEA 15-38 Kate Pinard: (202) 606-5564 (Profits) cpniwd@bea.gov Jeannine
JCP&L Verbatim Response to Middletown Township s Questions
 JCP&L Verbatim Response to Middletown Township s Questions Township officials sent 13 questions about the proposed Monmouth County Reliability Project to JCP&L on June 10 th. JCP&L provided direct responses
FORMER CADILLAC RANCH 2515 W 6TH, Lawrence, KS 66049
 FORMER CADILLAC RANCH 2515 W 6TH, Lawrence, KS 66049 Doug Brown McGrew Commercial 1501 Kasold Drive,Lawrence, KS 66047 dougbrown@askmcgrew.com (800) 530-5490 FORMER CADILLAC RANCH $795,000 This superb
GROSS DOMESTIC PRODUCT: FIRST QUARTER 2016 (THIRD ESTIMATE) CORPORATE PROFITS: FIRST QUARTER 2016 (REVISED ESTIMATE)
 CORPORATE PROFITS: FIRST QUARTER 2016 (REVISED ESTIMATE)") EMBARGOED UNTIL RELEASE AT 8:30 A.M. EDT, TUESDAY, JUNE 28, 2016 BEA 16-32 Technical: Lisa Mataloni (GDP) Kate Pinard (Corporate Profits) 301.278.9080 301.278.9417 gdpniwd@bea.gov cpniwd@bea.gov Media:
EMBARGOED UNTIL RELEASE AT 8:30 A.M. EDT, TUESDAY, JUNE 28, 2016 BEA 16-32 Technical: Lisa Mataloni (GDP) Kate Pinard (Corporate Profits) 301.278.9080 301.278.9417 gdpniwd@bea.gov cpniwd@bea.gov Media:
Space for Lease Starling Ave
 Presented by Barnett Commercial Realty, Inc. Property Details 2376 SF Office Space on.54 AC Lot Located in Central Martinsville, about 1/2mile from the heart of Historic Uptown Martinsville. Within close
River Trace Townhomes
 Presented by Commercial Partners Property Details Commercial Partners is offering to well qualified investors an opportunity to acquire a fee simple interest in the property known as River Trace Townhomes,
RETAIL LEASING OPPORTUNITY
 RETAIL LEASING OPPORTUNITY ROUTE 7 & ROUTE 123 TYSONS CORNER, VIRGINIA IMMEDIATE DELIVERY For more information, please contact: Michael Zacharia Lance L.J. Marine Senior Vice President Associate michael.zacharia@cbre.com
Gasoline/Convenience. Powerful Site Assessment Options for the Gas and Convenience Industry
 Type of Report Street Location Gasoline/Convenience North Las Vegas Blvd and Cheyenne Ave Las Vegas, NV October 27 City Location Date TABLE OF CONTENTS Description Table of Contents Page Number Executive
Bank Owned Subdivision 3166 Burgaw Highway, Jacksonville, NC 28540
 Bank Owned Subdivision 3166 Burgaw Highway, Jacksonville, NC 28540 Matt Ray Ray Properties, Inc. 3684-C Henderson Drive,Jacksonville, NC 28546 matt@rayproperties.com (910) 388-6620 License: 266827 Bank
19310 STONE OAK PARKWAY OFFICE BUILDING San Antonio, Texas
 19310 STONE OAK PARKWAY OFFICE BUILDING San Antonio, Texas DRAKE COMMERCIAL GROUP DEBORAH BAUER 19310 STONE OAK PKWY, STE. 201 SAN ANTONIO, TEXAS 78258 T: 210.402.6363 F: 210.402.6767 www.drakecommercial.com
443 Liberty Drive 443 Liberty Dr, Jacksonville, NC 28546
 443 Liberty Drive 443 Liberty Dr, Jacksonville, NC 28546 Matt Ray Ray Properties, Inc. 3684-C Henderson Drive,Jacksonville, NC 28546 matt@rayproperties.com (910) 388-6620 License: 266827 443 Liberty Drive
Gross Domestic Product: Third Quarter 2016 (Advance Estimate)
") EMBARGOED UNTIL RELEASE AT 8:30 A.M. EDT, FRIDAY, OCTOBER 28, 2016 BEA 16-57 Technical: Lisa Mataloni (GDP) (301) 278-9083 gdpniwd@bea.gov Media: Jeannine Aversa (301) 278-9003 Jeannine.Aversa@bea.gov
EMBARGOED UNTIL RELEASE AT 8:30 A.M. EDT, FRIDAY, OCTOBER 28, 2016 BEA 16-57 Technical: Lisa Mataloni (GDP) (301) 278-9083 gdpniwd@bea.gov Media: Jeannine Aversa (301) 278-9003 Jeannine.Aversa@bea.gov
Luxury Through the Eyes of the Affluent January 2015
 Luxury Through the Eyes of the Affluent January 2015 Complimentary Copy: Not to be used for any marketing or sales purposes without the express written permission of the copyright holder. Introduction
Gross Domestic Product: Second Quarter 2016 (Second Estimate) Corporate Profits: Second Quarter 2016 (Preliminary Estimate)
 Corporate Profits: Second Quarter 2016 (Preliminary Estimate)") EMBARGOED UNTIL RELEASE AT 8:30 A.M. EDT, FRIDAY, AUGUST 26, 2016 BEA 16-44 Technical: Lisa Mataloni (GDP) (301) 278-9080 gdpniwd@bea.gov Kate Pinard (Corporate Profits) (301) 278-9417 cpniwd@bea.gov Media:
EMBARGOED UNTIL RELEASE AT 8:30 A.M. EDT, FRIDAY, AUGUST 26, 2016 BEA 16-44 Technical: Lisa Mataloni (GDP) (301) 278-9080 gdpniwd@bea.gov Kate Pinard (Corporate Profits) (301) 278-9417 cpniwd@bea.gov Media:
CITY OF VANCOUVER ADMINISTRATIVE REPORT
 Supports Item No. 1 T&T Committee Agenda May 13, 2008 CITY OF VANCOUVER ADMINISTRATIVE REPORT Report Date: April 29, 2008 Author: Don Klimchuk Phone No.: 604.873.7345 RTS No.: 07283 VanRIMS No.: 13-1400-10
PREFACE. ... John Steytler STATISTICIAN - GENERAL NAMIBIA CONSUMER PRICE INDEX BULLETIN NOVEMBER
 PREFACE The Namibia Consumer Price Index (CPI) includes all Namibian private households living in urban and rural areas and is compiled by comparing the prices of the goods and services with the prices
87 ACRES PRIME COMMERCIAL IN NORTH GA HWY YUKON/MADDOX RD, East Ellijay, GA 30539
 87 ACRES PRIME COMMERCIAL IN NORTH GA HWY 515 @ YUKON/MADDOX RD, East Ellijay, GA 30539 Dicksie King REAL ESTATE GRAND, LLC www.realestategrand.com,, land@commerciallandsale.com (770) 434-7073 License:
Modern Industrial Bar and Restaura
 Modern Industrial Bar and Restaura Presented by Restaurant Sales Group Confidentiality Agreement David Walis restaurantsalesteam@gmail.co m (305) 450-3077 License: Broker Restaurant Sales Group 14 NE First
Money and banking. Flow of funds for the first quarter
 Statistical tables Money and banking Page S South African Reserve Bank: Liabilities... 2 South African Reserve Bank: Assets... 3 Corporation for Public Deposits: Liabilities... 4 Corporation for Public
Gross Domestic Product: Third Quarter 2016 (Third Estimate) Corporate Profits: Third Quarter 2016 (Revised Estimate)
 Corporate Profits: Third Quarter 2016 (Revised Estimate)") EMBARGOED UNTIL RELEASE AT 8:30 A.M. EST, THURSDAY, DECEMBER 22, 2016 BEA 16-71 Technical: Lisa Mataloni (GDP) (301) 278-9083 gdpniwd@bea.gov Kate Pinard (Corporate Profits) (301) 278-9417 cpniwd@bea.gov
EMBARGOED UNTIL RELEASE AT 8:30 A.M. EST, THURSDAY, DECEMBER 22, 2016 BEA 16-71 Technical: Lisa Mataloni (GDP) (301) 278-9083 gdpniwd@bea.gov Kate Pinard (Corporate Profits) (301) 278-9417 cpniwd@bea.gov
Burton Industrial Park 3983 Richlands Highway, Jacksonville, NC 28540
 Burton Industrial Park 3983 Richlands Highway, Jacksonville, NC 28540 Matt Ray Ray Properties, Inc. 3684-C Henderson Drive,Jacksonville, NC 28546 matt@rayproperties.com (910) 388-6620 License: 266827 Burton
Decisions, Decisions: What Drives Shopping Choices for Vehicle Re-Purchasers?
 16_Q4_178 Decisions, Decisions: What Drives Shopping Choices for Vehicle Re-Purchasers? Since 2010, the Autotrader Sourcing program has been conducting an annual survey of consumers who bought vehicles
Office Bldg. Class "A" Suites- N. Fro
 Office Bldg. Class "A" Suites- N. Fro Presented by Realty Management Associates, LLC Property Details Harrisburg-Class A Office Building. Three story building with covered private parking on first floor.
MONRO MUFFLER BRAKE, INC. PROVIDES FOURTH QUARTER AND FISCAL 2017 FINANCIAL RESULTS
 CONTACT: John Van Heel Chief Executive Officer (585) 647-6400 Robert Gross Executive Chairman (585) 647-6400 FOR IMMEDIATE RELEASE Brian D Ambrosia Senior Vice President Finance Chief Financial Officer
US 81 Bypass of Chickasha Environmental Assessment Public Meeting
 US 81 Bypass of Chickasha Environmental Assessment Public Meeting March 14, 2013 Introductions ODOT FHWA SAIC Meeting Purpose Present need for bypass Provide responses to 10/04/11 public meeting comments
Fully Renovated Travelodge 65 units
 Fully Renovated Travelodge 65 units Presented by Sooner Realty Properties Confidentiality Agreement Kamlesh Aggarwal, CCIM kamlesh912@gmail.com (918) 260-5286 License: 080557 Sooner Realty Properties 2709
Real GDP: Percent change from preceding quarter
 EMBARGOED UNTIL RELEASE AT 8:30 A.M. EST, WEDNESDAY, FEBRUARY 28, 2018 BEA 18-08 Technical: Lisa Mataloni (GDP) (301) 278-9083 gdpniwd@bea.gov Media: Jeannine Aversa (301) 278-9003 Jeannine.Aversa@bea.gov
Property details Harrison st. batesville, ar ROPERTY SUMMARY
 FOR SALE 10 Commercial Rental Units Superior location on central commercial district of Batesville Daily traffic count of >22,000 vehicles Within 1 mile of Batesville Community Center/Aquatic Park, Wal-Mart,
Real GDP: Percent change from preceding quarter
 EMBARGOED UNTIL RELEASE AT 8:30 A.M. EDT, THURSDAY, SEPTEMBER 28, 2017 BEA 17-51 Technical: Lisa Mataloni (GDP) (301) 278-9083 gdpniwd@bea.gov Kate Pinard (Corporate Profits) (301) 278-9417 cpniwd@bea.gov
4.2 Acres Commercial Land Stone Oak Parkway San Antonio, Texas
 4.2 Acres Commercial Land Stone Oak Parkway San Antonio, Texas DRAKE COMMERCIAL GROUP DEBORAH BAUER TRAVIS BAUER 4630 N LOOP 1604 W, SUITE 510 SAN ANTONIO, TEXAS 78249 T: 210.402.6363 F: 210.402.6767 www.drakecommercial.com
Subarea Study. Manning Avenue (CSAH 15) Corridor Management and Safety Improvement Project. Final Version 1. Washington County.
 Corridor Management and Safety Improvement Project. Final Version 1. Washington County.") Subarea Study Manning Avenue (CSAH 15) Corridor Management and Safety Improvement Project Final Version 1 Washington County June 12, 214 SRF No. 138141 Table of Contents Introduction... 1 Forecast Methodology
Subarea Study Manning Avenue (CSAH 15) Corridor Management and Safety Improvement Project Final Version 1 Washington County June 12, 214 SRF No. 138141 Table of Contents Introduction... 1 Forecast Methodology
Green Line LRT: Beltline Segment Update April 19, 2017
 Green Line LRT: Beltline Segment Update April 19, 2017 Quick Facts On April 11, 2017, City Council approved Administration s recommendation for the Green Line to be underground in the Beltline from 2 Street
Gross Domestic Product: First Quarter 2017 (Advance Estimate)
") EMBARGOED UNTIL RELEASE AT 8:30 A.M. EDT, FRIDAY, APRIL 28, 2017 BEA 17-19 Technical: Lisa Mataloni (301) 278-9083 gdpniwd@bea.gov Media: Jeannine Aversa (301) 278-9003 Jeannine.Aversa@bea.gov Gross Domestic
EMBARGOED UNTIL RELEASE AT 8:30 A.M. EDT, FRIDAY, APRIL 28, 2017 BEA 17-19 Technical: Lisa Mataloni (301) 278-9083 gdpniwd@bea.gov Media: Jeannine Aversa (301) 278-9003 Jeannine.Aversa@bea.gov Gross Domestic
Edmiston Property 705 Gaither Road, Statesville, NC 28625
 Edmiston Property 705 Gaither Road, Statesville, NC 28625 Frank Harmon Equity Commercial Properties 114 Morlake Drive,Suite 102, Mooresville, NC 28117 fharmon@equitycp.com (704) 677-5320 License: 45082
City of Meridian - Limited Parking Supply and Demand Analysis
 City of Meridian - Limited Parking Supply and Demand Analysis Prepared for: City of Meridian, Idaho Planning and Zoning 660 East Watertower, Ste. 202 Meridian, ID 83642 Prepared by: Carl Walker, Inc. 4
BMW Group Investor Relations.
 Capital Markets Day China 2010 Beijing September 16, 2010 - Please check against delivery - Statement by Dr. Friedrich Eichiner Member of the Board of Management of BMW AG, Finance Capital Markets Day
GRID CONSTRAINT: OPTIONS FOR PROJECT DEVELOPMENT
 GRID CONSTRAINT: OPTIONS FOR PROJECT DEVELOPMENT 2 What s the Problem? Constrained grid is an issue that impacts many new renewables developments. A quick look at the distribution heat maps published by
How to Create Exponential Decline in Car Use in Australian Cities. By Peter Newman, Jeff Kenworthy and Gary Glazebrook.
 How to Create Exponential Decline in Car Use in Australian Cities By Peter Newman, Jeff Kenworthy and Gary Glazebrook. Curtin University and University of Technology Sydney. Car dependent cities like those
Annual Report on National Accounts for 2015 (Benchmark Year Revision of 2011) Summary (Flow Accounts)
 Summary (Flow Accounts)") Annual Report on National Accounts for 2015 (Benchmark Year Revision of 2011) Summary (Flow Accounts) I. Overview of Benchmark Year Revision of 2011 P 2 II. Expenditure Series P 3 III. Income Series P
Annual Report on National Accounts for 2015 (Benchmark Year Revision of 2011) Summary (Flow Accounts) I. Overview of Benchmark Year Revision of 2011 P 2 II. Expenditure Series P 3 III. Income Series P
2011 Economic Impact Report
 2011 Economic Impact Report The Economic Impact of Franchised New Car Dealerships on the Colorado Economy Sponsored by: DIRECTOR S MESSAGE & BACKGROUND INTRODUCTION President s Message Tim Jackson President
Detox/AFL/Rehab Facility 500 S Holly Ave, Sanford, FL 32771
 Detox/AFL/Rehab Facility 500 S Holly Ave, Sanford, FL 32771 David Small Weichert Realtors Hallmark Properties 915 Middle River Dr Suite 301,Fort Lauderdale, FL 33304 dsmall123@gmail.com (954) 598-3272
TORONTO TRANSIT COMMISSION REPORT NO.
 Revised: March/13 TORONTO TRANSIT COMMISSION REPORT NO. MEETING DATE: March 26, 2014 SUBJECT: COMMUNITY BUS SERVICES ACTION ITEM RECOMMENDATION It is recommended that the Board not approve any routing
SOCIO-ECONOMIC and LAND USE DATA
 SOCIO-ECONOMIC and LAND USE DATA FUTURE CONDITIONS January CHATHAM URBAN TRANSPORTATION STUDY - 1 - Table of Contents Introduction 3 TAZ - Municipality - Map Index...8 2005 Socio-economic and Land Use
Net Metering in Missouri
 Net Metering in Missouri Make A Good Policy Great (AGAIN) Executive Summary More and more Americans every year are able to produce their own electricity. As the cost of solar continues to plummet, homeowners
DRIVER SPEED COMPLIANCE WITHIN SCHOOL ZONES AND EFFECTS OF 40 PAINTED SPEED LIMIT ON DRIVER SPEED BEHAVIOURS Tony Radalj Main Roads Western Australia
 DRIVER SPEED COMPLIANCE WITHIN SCHOOL ZONES AND EFFECTS OF 4 PAINTED SPEED LIMIT ON DRIVER SPEED BEHAVIOURS Tony Radalj Main Roads Western Australia ABSTRACT Two speed surveys were conducted on nineteen
Gross Domestic Product: Fourth Quarter and Annual 2016 (Second Estimate)
") EMBARGOED UNTIL RELEASE AT 8:30 A.M. EST, TUESDAY, FEBRUARY 28, 2017 BEA 17-07 Technical: Lisa Mataloni (GDP) (301) 278-9083 gdpniwd@bea.gov Media: Jeannine Aversa (301) 278-9003 Jeannine.Aversa@bea.gov
EMBARGOED UNTIL RELEASE AT 8:30 A.M. EST, TUESDAY, FEBRUARY 28, 2017 BEA 17-07 Technical: Lisa Mataloni (GDP) (301) 278-9083 gdpniwd@bea.gov Media: Jeannine Aversa (301) 278-9003 Jeannine.Aversa@bea.gov
Saint Paul s Off-Street Parking Revisions. Hilary Holmes City Planner
 Saint Paul s Off-Street Parking Revisions Hilary Holmes City Planner Today: Citywide off-street parking revisions 2009 Bar & restaurant revisions 2012 Establishing maximums Other off-street reductions
2.445 Acres Commercial Shaenfield Road San Antonio, Texas
 2.445 Acres Commercial 11070 Shaenfield Road San Antonio, Texas DRAKE COMMERCIAL GROUP DEBORAH BAUER TRAVIS BAUER 19310 STONE OAK PKWY, STE. 201 SAN ANTONIO, TEXAS 78258 T: 210.402.6363 F: 210.402.6767
Landmark Asset Services, Inc. 406 E. Fourth St., Winston-Salem, NC Phone (336) Fax (336)
 Fax (336)") Landmark Asset Services, Inc. 406 E. Fourth St., Winston-Salem, NC 27101 www.landmarkdevelopment.biz Phone (336) 722-9871 Fax (336) 722-3603 Scott Farmer Director of Rental Programs North Carolina Housing
Landmark Asset Services, Inc. 406 E. Fourth St., Winston-Salem, NC 27101 www.landmarkdevelopment.biz Phone (336) 722-9871 Fax (336) 722-3603 Scott Farmer Director of Rental Programs North Carolina Housing
CHARGING AHEAD: UNDERSTANDING THE ELECTRIC-VEHICLE INFRASTRUCTURE CHALLENGE
 Hauke Engel, Russell Hensley, Stefan Knupfer, Shivika Sahdev CHARGING AHEAD: UNDERSTANDING THE ELECTRIC-VEHICLE INFRASTRUCTURE CHALLENGE August 08 Access to efficient charging could become a roadblock
Mobility Fee Applications from Research Design
 PLANNING AND DEVELOPMENT D E P A R T M E N T Mobility Fee Applications from 2014-2016 Research Design The focus of this study is Mobility Fee applications submitted during the years between 2014 and 2016,