Danish Shipping. Facts and Figures. June 2017
|
|
|
- Peregrine Wells
- 5 years ago
- Views:
Transcription

1 Danish Shipping Facts and Figures June 217
2 2
3 Table of Contents 1. Danish Shipping 4 The Danish Merchant Fleet 4 Danish Shipping Exports 6 Employment 8 2. Global Merchant Fleet 1 Top Ten Operator Nations 1 Global Merchant Fleet by Regions 12 Flag States World Trade 14 Global Seaborne Trade 14 Global Trade Volumes 16 Global View: Container 18 Global View: Product Tankers 2 Global View: Crude Tankers 22 Global View: Dry Bulk Ship Building and Recycling 26 Top Ten Newbuilding Countries 26 Recycled vessels 28 Ship Building Countries 29 3
4 Danish Shipping 18, The Danish merchant fleet has increased slightly with 22 vessels since October 216. The combined gross tonnage has, however, reached a plateau. Container vessels represent the largest share in gross tonnage, though tankers and offshore vessels have the largest amount of vessels. The slow growth in world trade has marked the shipping industry resulting in overcapacity, leaving a large number of vessels to be recycled. The industry saw a massive jump in capacity in both gross tonnage as well as vessels in 214. Growth has since slowed, and the gross tonnage has hovered around 15.5 million. As of 1 April 217, there were 683 merchant vessels flying the Danish flag. Container vessels make up more than 1 million of the gross tonne registered in Denmark. Tankers and offshore vessels make up the two largest groups, but the tonnage is limited due to the lesser dimensions in offshore and the specialisation in product tank by Danish companies. Dry bulk continues to fade in the Danish registers as operational expenses are higher than in other countries. GT (Million) 16, 14, 12, 1, 8, 6, 12,, 45 GT 1,, 8,, 6,, 4,, No. of vessels 4, 2, 2,, Container Tankers Offshore and specialized vessels Dry bulk January GT No. of vessels 4
5 No. of vessels Apr 217 GT (Million) No. of vessels 5
6 Danish Shipping Exports 25 2 Billion DKK Source: Statistics Denmark Shipping is the biggest exporting industry Historically, Danish shipping accounts for about 2 pct. of total Danish exports, making it by far the biggest exporting industry in Denmark. After peaking at 26 billion DKK in 214, exports fell slightly in 215 and plummeted by almost 18 pct. year-on-year in 216, due to a global drop in freight prices. Shipping s share of exports thus declined to about 16 pct. This was the steepest drop in shipping exports since the financial crisis and the lowest yearly export figure, excluding 29, since 26. Danish Shipping Exports 216/ Exports on the rise The fourth quarter of 216 presented more encouraging numbers for Danish shipping exports. The rise in exports has continued in the first quarter of 217, which saw a strong increase in shipping exports, suggesting that the drop in exports was more of a one-year event rather than a permanent move. Even with that increase, Danish Shipping does not expect a return to levels of exports in 217, since global headwinds are still strong despite the recent improvement in advanced economies. Billion DKK Q1 216Q2 216Q3 216Q4 217Q1 6

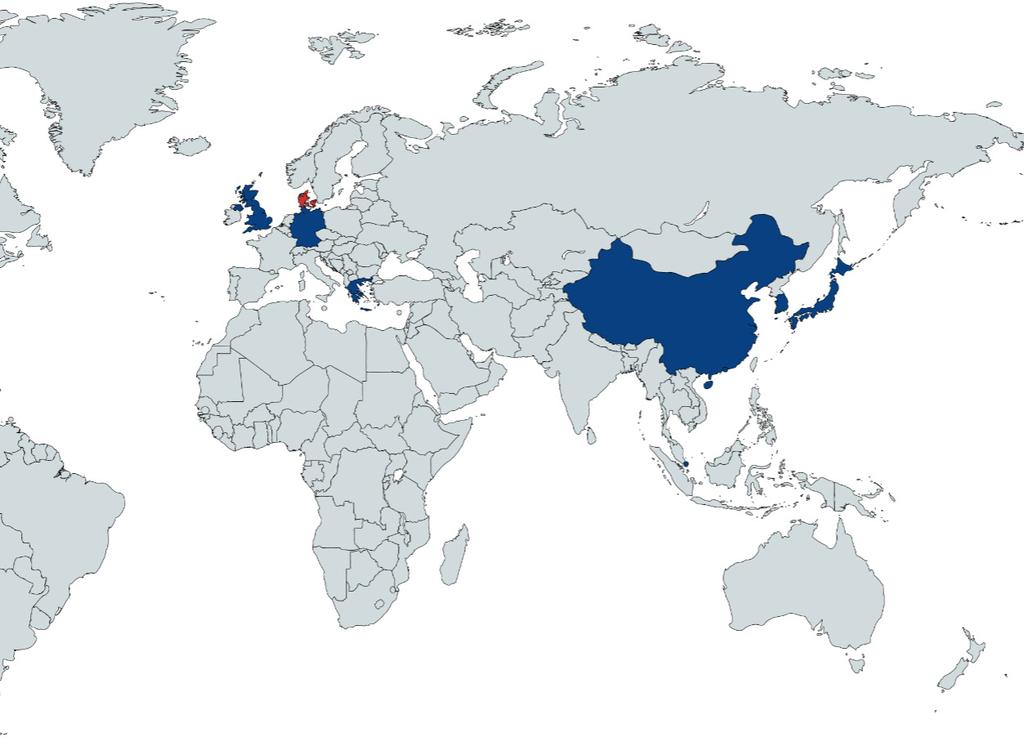
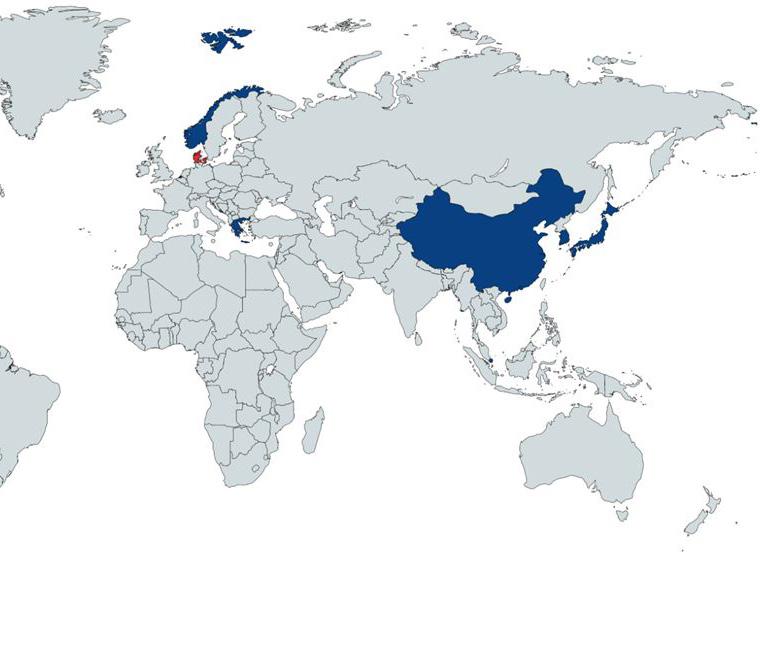
7 Shipping exports increasing outside of Europe More than two thirds of Danish shipping exports take place without calling European ports. This underlines the fact that shipping is the most globalised industry in Denmark. Shipping has a large share of exports in Asia, whereas Europe s share of the industry s exports is less compared to exports of goods, as showed in the figure to the right. Asia is expected to grow significantly in the coming years, with India and Indonesia set to more than double their GDP by 23, according to IMF. Asia already has the largest share of Danish shipping companies export markets, as shown on the map below. Growth in this region has a positive effect on Danish shipping, job creation in Denmark and GDP. Africa, the Middle East and South America also expect future growth in exports. Danish shipping companies are already operating in these regions, and will be ready to accomodate future growth. Danish Exports 8% 7% 6% 5% 4% 3% 2% 1% % Europe Asia North Middle South Africa Oceania America East America GDP growth* 3,% 6,7% 3,% -2,3% -1,% 3,5% 4,% *Estimates according to IMF Shipping Source: Danish Shipping, Statistics Denmark, IMF Exports in general 8% 7% 6% 5% 4% 3% 2% 1% % Danish Shipping Companies Export Markets 7
8 Employment 25, 2, 5,935 6,112 5,736 6,237 15, 6,689 6,25 7,316 6,499 Land-based employment in Denmark Other nationalities seafarers 1, 2,638 3,211 2,662 2,646 EU seafarers Danish seafarers 5, 7,786 7,648 7,783 7, Decline in international seafarers The shipping industry has been challenged by the slow growth in world trade. The slow economy has had negative consequenses to a lot of Danish shipping companies, who have adapted by taking vessels out of service and, as a consequence, decreasing the number of seafarers emloyed. International seafarers outside the EU have been hit the hardest in this process, whereas seafarers from Denmark and the EU was only marginally hit Danish shipping employment decreased by approximately 4 jobs from 216 to 217, breaking the upward trend in employment. However, the slump in exports - a decline by 17.6 pct. in should be taken into consideration. Land-based employment rose from 5,736 to 6,237 persons, but was offset by a decline of more than 8 seafarers from mainly outside the EU. What is Blue Denmark? The maritime cluster includes all maritime companies and operations in Denmark, including shipping companies. The cluster is referred to as Blue Denmark. It accounts for approximately 25 pct. of total Danish exports. 8
9 Blue Denmark employs 1, persons The Danish maritime cluster, Blue Denmark, employs 1, persons. More than half are directly employed (6,), while the rest are employed indirectly, as their jobs are in other sectors than shipping, but heavily dependent on shipping, as shown in the figure on the right. Ship building and offshore oil and gas combine a total of 11 pct. of employment in Blue Denmark, whereas shipping accounts for 2 pct. Equipment manufacturers and other maritime industries make up the bulk of employees in the Danish maritime cluster. Employment in Blue Denmark 4, 3, 2, 1, 4% 3% 2% 1% % Blue Denmark pays more tax Employees in Blue Denmark have a considerably higher income than the average Danish person, as shown in the figure below. Maritime employees pay almost one third more in taxes than non-blue Denmark employees (DKK 126, vs. DKK 166, per year). Direct employment Share of Blue Denmark % Indirect employment Salaries and Tax Payment from Employees in Blue Denmark 9, 35, 8, 3, 7, Income 6, 5, 4, 25, 2, 15, Tax payment 3, 1, 2, 1, 5, Oil and Gas Ship Building Shipping Equipment Other Maritime Industry Blue Denmark, avg. Denmark, avg. Avg. Income Tax Payment 9

10 Global Merchant Fleet Greece stays on top as the largest operator nation in the world, while Denmark is set to move from number eight to seven in 217. EU as a maritime super power is losing ground, while Asia in particular has expanded its share of global tonnage registered. The individual country rankings of top ten operator nations based on tonnage have not changed much in the past couple of years, with the exception of the USA overtaking Germany for fifth place. A shakeup seems to be on the horizon. South Korea is rapidly losing tonnage as a result of the enduring overcapacity problems in shipping. This has been exemplified by Hanjin Shipping, who prior to their banktrupcy in early 217, was ranked as the 11 th largest operator with almost 8.4 million gross tonnes. With South Korea losing tonnage, Denmark looks poised to reclaim seventh place in these rankings at some point in 217. Singapore and China are expanding their operated fleets at a very fast pace these years. The expansion is closing the gap to the stagnant Japanese merchant fleet at an unprecedented rate, and China will soon hit 1 million gross tonnes. Europe is losing market share, while the rest of the world is gaining. European countries are losing their share of tonnage, all the while Asia continues its increase and have three countries - Japan, China and Singapore - within the top five operator nations. TOP TEN OPERATOR NATIONS (GT) 1. Greece 151,38, Japan 126,497, China 99,76, Singapore 94,78, USA 67,383, Germany 64,87, South Korea 58,33, Denmark 57,38,7 9. UK 5,544, Hong Kong 46,985,797 1
11 11
12 The Global Merchant Fleet by Regions % 9% 12% 2% 35% 2% 35% 49% erest of the world easia enorth America eopen registries eeu 1% 17% Maritime super powers are changing The maritime super powers are changing fast. The EU has lost ground since 27. As of May 217, the EU has just 12 pct. of the global fleet registered, which is a decline of eight pct. in the past 1 years. The same applies to the USA and Canada, who have lost half their global share. Instead, markets in open registries (limited to Panama, Liberia, Bermuda and the Bahamas for data availability reasons) are on a continual rise. However, the real growth in shipping comes from the rest of the world, which has expanded its share of global tonnage from 9 to 35 pct. in 1 years. This is primarily due to the rise of the Marshall Islands, but also the Isle of Man and Norway have seen substantial growth. Maersk still in the top MSC is the largest global tonnage operator with Maersk Line second. Maersk Line does however own MCC, Safmarine and Mercosul, which do not count as Maersk Line in these rankings. The top 1 has remained somewhat constant since November 216, with the exception of COSCO Shipping Lines that has pushed Hyundai Merchant Marine out of the top ten. Top Ten Operators Operated GT 35,, 3,, 25,, 2,, 15,, 1,, 5,, Source: IHS Markit Seaweb Note: The group representing open registries do not contain the same countries, as the 27 data has a broader definition of open registries. Also note, that the Marshall Islands do not fall into the open registries category, and thus contributes a very significant part of rest of world. 12
13 Flying the flag Denmark maintains a fifth place on the ranking of EU flag states, but improvement to number four seems likely over the next six months. Portugal continues its rapid expansion via the Madeira register, whereas the European merchant fleet development in broader terms is somewhat stagnant compared to other regions. Panama and Liberia declining Even as the number of vessels flying the Danish flag have increased since November 216, the tonnage remains almost the same. The two top flag states, Panama and Liberia, both saw the registered tonnage decline over the past six months. The decline in tonnage seems to have been absorbed by the Marshall Islands and Hong Kong, whilst China also saw their merchant fleet grow by more than eight pct. EU-FLAGGED MERCHANT FLEET (GT) Malta 68,18,763 Greece 41,841,966 Cyprus 22,23,39 Italy 15,87,986 Denmark 15,61,764 United Kingdom 14,879,839 Portugal 12,522,49 Germany 9,75,88 Netherlands 7,92,612 France 6,155,699 Belgium 5,384,928 Spain 2,444,439 Sweden 2,246,81 Luxembourg 1,926,19 Finland 1,75,32 Croatia 1,327,24 Estonia 4,65 Lithuania 287,953 Ireland 26,226 Latvia 13,35 Bulgaria 125,626 Poland 87,448 Romania 4,423 Slovenia 2,256 Top Ten Flag States and Denmark GT 25,, 2,, 15,, 1,, 5,, 9, 8, 7, 6, 5, 4, 3, 2, 1, No. of vessels Panama Liberia Marshall Islands Hong Kong Singapore Malta Bahamas China Greece Japan Denmark Ranking Source: IHS Markit Seaweb GT No. of vessels 13
14 World Trade 12, Global trade is on a different growth path than before the financial crisis. Though world trade is still on the rise, the rate of increase has slowed, and the growth in GDP has surpassed the growth in world trade. 1, 8, World trade is on the rise, and continues to grow steadily, though not at the same rate as before the financial crisis. In 2 and onwards the average annual rate of increase was 3.3 pct., with the 2-28 period averaging 7.4 pct. per year, but since 211 it has slowed down to a 2.6 pct. growth, as shown in the figure on the opposite page. Growth in GDP has now surpassed the growth in world trade, as shown in the figure below. This trend seems to continue. The change is not merely a result of the new realities facing the global economy in the wake of the financial crisis. It proves that globalisation is failing to integrate the new, rapidly growing economies into the global trade system. With economic super powers such as the USA, the EU and China dominating global trade, finance and manufacturing, there are big hurdles for lower tier economies in e.g. India, Nigeria and Indonesia to overcome, in order to become fully integrated into the global economy. Million tonnes 6, 4, Growth in GDP and World Trade in Annual Percentage , GDP Source: IMF World Economic Outlook Database, October 216 Trade Volume Source: Clarksons Research Services 14
15 Annual percentage change World Seaborne Trade Change in Seaborne Trade (rhs) 15
16 Global Trade Volumes 12 1 Index (21 = 1) Source: CPB World Trade Monitor Global trade volumes continues to grow Global trade was growing fast for most of the 2s, in large part due to China s accession into the WTO in 22. The green arrow in the figure above indicates the tendency of trade growth leading up to the financial crisis with a very rapid growth. Post-29 trade growth, represented by the red arrow, is not as steep. The global fleet s growth has continued on assumptions based on the old paradigm of rapid expansion, in spite of the fact that global trade today is on a very different growth path. Trade continues to grow, albeit not quite as fast as global shipping capacity. This leaves the door open for a controlled rebalancing of the merchant fleet. That window of opportunity will shut quickly if trade volumes start to decline. Oil prices had no effect on global trade When comparing trade volumes to trade value, as shown in the figure on the right, there is a divergence beginning in 214, which coincides with the oil price plummeting to $25/barrel. This deflationary pressure should in theory have boosted global trade, but the volumes did not budge from its trend, despite a surge in oil transportation demand and lower cost of transportation. Global Trade Value and Volume Index (21 = 1) Volumes Value (USD) Source: CPB World Trade Monitor

17 Shipping markets remain subdued Shipping markets in general remain subdued. This is especially clear when looking at average daily earnings in a historical perspective in the ClarkSea Index below, where it is obvious that rather than aiming for the post financial crisis highs, shipping should instead view the current levels as an old, new normal. Even when looking at more recent history, we see that earnings are close to an all-time low, with the overall trajectory of the past seven years being slightly negative. It appears that the global shipping markets have bottomed out in the second half of 216, and a gradual improvement has been observed since. WHAT IS CLARKSEA INDEX? The ClarkSea Index is a broad index across different shipping segments. It measures average daily earning in US dollars in tankers, dry bulk and container, and is widely regarded as the best measure for the current state of the shipping markets. ClarkSea Index 6, 5, 4, USD/day 3, 2, 1, Source: Clarksons Research Services 17
18 Global View: Container 2 1, 18 9, 16 8, 14 7, Million TEU , 5, 4, 3, Billion tonne-miles 4 2, 2 1, Million TEU Bn. tonne-miles (rhs) Billion tonne-miles Source: Clarksons Research Services 216 challenged container shipping Global container trade continues to increase at a steady pace with three to four pct. year-overyear in 216. This is an increase from 2.2 pct. in 215. Despite decent growth rates, 216 proved challenging to container shipping, mainly due to constant overcapacity, especially in the post-panamax segment. Total TEU capacity increased by 8.1 pct. in 216, following a 6.5 pct. increase the year before. Average container earnings recovering As such, the average daily earnings for containerships declined throughout 216, but have recovered slightly in 217. There are, however, still a large number of vessels projected to enter the market over the coming years, as shown in the figure on page 19. Vessels on order totals 14.3 pct. of the existing fleet as of 1 April 217. As larger containerships are replaced by mega ships on the transcontinental routes, they will increasingly be used on regional trades. This cascading of containerships can adversely affect regional and feeder shipping as old tonnage becomes obsolete, and new capacity increases fast these years. USD/day WHAT IS A TONNE-MILE? Tonne-mile is a measure that describes the quantity of goods being moved, as well as the distance moved. This is a better measure of transportation demand than just quantity, as lower quantities being moved further can still lead to higher capacity utilisation. Container Earnings 16, 14, 12, 1, 8, 6, 4, 2, Source: Clarksons Research Services 18

19 Container Fleet Additions 35, 6 3, 5 25, 4 TEU 2, 15, 3 No. of vessels 1, 2 5, TEU No. of vessels Source: IHS Markit Seaweb 19
20 Global View: Product Tankers 1,2 24 1, 22 2 Million tonnes Billion tonne-miles Million tonnes Mbpd (rhs) Billion tonne-miles 25 pct. increase in oil product trade The global rise of motorised combustion engine vehicles increases fuel consumption leading to a 25 pct. increase in oil products trade over the last 1 years. Since 214, where the oil products trade seemed to reach a plateau, lower oil prices sent oil products consumption into a higher gear. What is a tonne-mille WHAT IS A PRODUCT TANKER? Tonne-mile is a measure that describes not only the quantity of goods being moved, but also the distance that Product goods tankers are being range moved. in size This from is 5, a better to 8, measure DWT. of world They transport seaborne refined transportation oil products, demand such than as gasoline, just jet quantity, fuel, naphtha as lower and diesel quantities oil, from being refineries moved further to points can near still consuming lead to higher markets. capacity utilisation. Product tanker earnings Energy efficient transportation on the rise 1.5 billion barrels of oil per year is related to the aviation industry s consumption. Aviation is expected to continue growing in the future, but the industry has agreed to cut emissions, which will serve as a cap on fuel consumption in aviation. The shipping industry has already decreased its share of global CO2-emission, and has now started ordering LNG-fuelled vessels, as well as dual-fuel ferries, alternating between electricity and bunkers. While the short and medium term outlook is very stable, the long term outlook has turned negative. USD/day 3, 25, 2, 15, 1, 5, 21-Jan 211-Jan 212-Jan 213-Jan 214-Jan 215-Jan 216-Jan 217-Jan Source: Clarksons Research Services 2

21 Product tanker fleet additions 1,2, 8 1,, 7 6 GT 8, 6, 5 4 No. of vessels 4, 3 2 2, GT No. of vessels (rhs) 21
22 Global View: Crude Tankers 12, 4 1, Billion tonne-miles 8, 6, 4, Million barrels per day 34 2, Billion tonne-miles Million barrels per day Global crude oil demand to peak in 23 Seaborne transportation of crude oil surged from a multi-year low in 214 to a record high in 216 due to low oil prices. The increased volumes failed to correspond into a surge in VLCC average daily rates, as shown in the figure on the right. Instead, the average daily rates fell from $7,/day in January 216 to $25,/ day. The failure to exchange increased activity into increased earnings was due to the fact that 26 new crude oil tankers have entered the market since January 216 (as shown in the figure on the opposite page), whereas only 22 crude oil tankers have been recycled in the same period. There are 222 crude oil tankers projected to enter the global tanker fleet in 217, and another 153 vessels planned for 218. Crude oil demand to peak in 23 Investors and shipping companies used to purchase new tonnage with an estimated lifespan of at least 25 years. With the global de-carbonisation agenda set in motion at the COP21 in Paris in 215, global crude oil demand will peak around 23 according to a 216 McKinsey study, thus offering investment viability substantially. USD/day WHAT IS CRUDE TANKERS? Crude tankers transport unrefined crude oil from extraction sites to refineries. They range in size from 55, DWT up to around 32, DWT. Crude Tankers Earnings 12, 1, 8, 6, 4, 2, Source: Clarksons Research Services 22
 23 No.")
23 Crude Oil Tanker Fleet Additions 4,5, 5 4,, ,5, 35 3,, GT 25 2,, 2 1,5, 15 1,, 1 5, GT 219 No. of vessels (rhs) 23 No. of vessels 3 2,5,
24 Global View: Dry Bulk 5, 4,5 4, 3,5 Million tonnes 3, 2,5 2, 1,5 1, Iron Ore Coking Coal Steam Coal Bauxit/Alumina Phostphate Rock Minor Bulk Dry bulk trade has stagnated The seaborne dry bulk trade has stagnated the past three years, as Chinese demand for steam coal fell from 25 million tonnes in 213 to just 128 million tonnes in 215, with a slight recovery in 216. The transition from a coal powered grid to a more sustainable energy mix in China is the key driver for the stagnating dry bulk trade. Iron ore continues to increase its volumes, as the rapid expansion of the chinese economy increases demand for steel. China accounts for about 35 pct. of global dry bulk imports. WHAT IS THE BALTIC DRY INDEX? The Baltic Dry Index is an average of time charter rates in four dry bulk segments: capesize, panamax, handymax and handysize. As such, the BDI can be considered as an indicator for future economic activity. The BDI was indexed at 1, at its introduction in January Baltic Dry Index 12, All time low freight rates Dry bulk has seen its worst sustained period of low freight rates since the 198s. During the financial crisis there were three consecutive months of sub-1, readings in the Baltic Dry Index (BDI). Dry bulk now hovers around the 1,-mark which, though a great improvement from a historical low of 37 in February 216, is still a very weak market. Recovery in the dry bulk market is not likely in the near future with more vessels still being build on expectations of better times ahead. 1, 8, 6, 4, 2,

25 Dry Bulk Additions 8,, 16 7,, 14 6,, 12 GT 5,, 4,, 1 8 No. of vessels 3,, 6 2,, 4 1,, GT No. of vessels 25

26 Ship Building and Recycling Denmark is still amongst the top ten newbuilding countries in the world, but poor market conditions have caused a gradual decline in newbuildings to the Danish fleet. Danish owned newbuildings have gradually declined over the last few years. The April 217 figures were no exception to this trend. The numbers reflect poor market conditions across different segments, as well as deteriorating outlook in product tank. Although the newbuilding prices are low, the number of vessels and the tonnage remains low. The newbuilding programme still adds up to around 41.5 billion DKK. The top ten newbuilding countries - defined as the ten countries whose shipping companies have the largest stock of newbuildings in their pipelines based on gross tonnage - make up around 4 pct. of new vessels on order as of 1 April 217. Measured in tonnage they make up 57 pct. of gross tonnage. Denmark orders larger vessels Denmark ranks sixth on this list despite the relative low number of vessels, which in turn means that the vessels that are on order are larger and typically, more expensive - than for most other countries. It is important to note, that shipping companies often order ships to an array of flags, which is why the number of newbuildings cannot be used as a measure for flag growth in the future. TOP TEN NEWBUILDING OPERATOR COUNTRIES NATIONS (GT) (GT) 1. China Greece 151,38,943 24,514,28 2. Japan 126,497,945 16,52, Greece China 99,76,771 13,144, Bermuda Singapore 94,78,858 6,317, USA USA 67,383,914 6,185, Denmark Germany 64,87,298 5,717, Singapore South Korea 58,33,913 4,657, Norway Denmark 57,38,7 4,657, South UK Korea 5,544,294 4,523,76 Hong 1. Hong Kong Kong 46,985,797 4,395,267 26
27 27
28 Ship Recycling 4,, 14 3,5, 12 3,, 1 GT 2,5, 2,, 1,5, 8 6 No. of vessels 1,, 4 5, 2 GT No. of vessels Age of vessels decreasing Recycling remains at a relatively low level, although 216 had a positive start. The average recycling age has dropped significantly in recent years, where we have witnessed recycling of an only seven-year-old container ship. Vessels usually have an expected service of 25 years, but overcapacity and inefficient tonnage have forced shipping companies to cut losses and recycle younger tonnage than ever before. Dry bulk marked by tough market conditions Dry bulk shipping has seen an increase in recycling in 215 and 216 due to the difficult market for conditions. Dry bulk freight rates bottomed out in 216, but had a marginal improvement in 217. This in turn led shipping companies to hold on to their vessels, trying to maximise their earnings. The average age for dry bulkers being recycled has gone down from 33.5 years in 27 to just 23.3 years in 217. The dynamic between a younger dry bulk fleet, small increases in earnings and a steady influx of new tonnage has most likely postponed market equilibrium for some time. DWT Dry Bulk Recycling 6,, 5,, 4,, 3,, 2,, 1,, 214-Jun 214-Dec 215-Jun 215-Dec 216-Jun 216-Dec DWT No. of vessels No. of vessels Source: Clarksons Research Services 28

29 Ship Building Countries Asia in top of ship bulding countries The three top ship building nations are as always China, South Korea and Japan making up the bulk of total orders. This is unlikely to change in the near future, as both China and South Korea heavily subsidises the shipbuilding industry. Meanwhile, Japanese shipbuilders have been buoyed by their superior quality and weak yen compared to the US dollar. echina esouth Korea ejapan ephilippines eitaly erest of the world 22% 3% 2% 9% 25% 39% 29
30 3
31 31
32
Danish Shipping. Facts and Figures. June 2017
 Danish Shipping Facts and Figures June 217 2 Table of Contents 1. Danish Shipping 4 The Danish Merchant Fleet 4 Danish Shipping Exports 6 Employment 8 2. Global Merchant Fleet 1 Top Ten Operator Nations
MALAYSIAN BULK CARRIERS BERHAD ( W)
") www.maybulk.com.my MALAYSIAN BULK CARRIERS BERHAD (175953-W) Contents t Commercial highlights Page 3 MBC Fleet composition 4 Shipping Revenue Composition and Operating Profit 5 MBC Fleet TCE rates 6 Fleet
www.maybulk.com.my MALAYSIAN BULK CARRIERS BERHAD (175953-W) Contents t Commercial highlights Page 3 MBC Fleet composition 4 Shipping Revenue Composition and Operating Profit 5 MBC Fleet TCE rates 6 Fleet
Recent Developments in International Seaborne Trade and Maritime Transport
 Recent Developments in International Seaborne Trade and Maritime Transport IFSPA, Hong Kong, 3-5 June 2013 Dr. Vincent F. Valentine Officer-in-Charge, Transport Section Division on Technology and Logistics
BREXIT AND THE AUTO INDUSTRY: FACTS AND FIGURES
 BREXIT AND THE AUTO INDUSTRY: FACTS AND FIGURES GLOBAL TRADE European Union EU vehicle imports: Total value: 45,693 million Quantity: 3,395,419 units EU vehicle exports: Total value: 135,398 million Quantity:
NEW COMMERCIAL VEHICLE REGISTRATIONS EUROPEAN UNION 1. November 2018
 PRESS EMBARGO: NEW COMMERCIAL VEHICLE REGISTRATIONS EUROPEAN UNION 1 November 2018 Commercial vehicle registrations: +3.8% 11 months into 2018; +2.7% in November Total new commercial vehicles In November
NEW COMMERCIAL VEHICLE REGISTRATIONS EUROPEAN UNION 1. April 2017
 PRESS EMBARGO: NEW COMMERCIAL VEHICLE REGISTRATIONS EUROPEAN UNION 1 April 2017 Next press release: Friday 23 June 2017 1 Data for Malta unavailable Page 1 of 7 Commercial vehicle registrations: +3.8%
NEW COMMERCIAL VEHICLE REGISTRATIONS EUROPEAN UNION 1. October 2016
 PRESS EMBARGO: NEW COMMERCIAL VEHICLE REGISTRATIONS EUROPEAN UNION 1 October 2016 Next press release: Thursday 22 December 2016 1 Data for Malta unavailable Page 1 of 7 Commercial vehicle registrations:
Shipbuilding Statistics APRIL, 2017
 Shipbuilding Statistics APRIL, 2017 Contents: Shipbuilding Statistics (APRIL, 2017) 1. World New Orders... 1 2. World Completions... 2 3. World Orderbook at Year-End... 3 4. World Merchant Fleets by Ship
NEW COMMERCIAL VEHICLE REGISTRATIONS EUROPEAN UNION 1 February 2018
 PRESS EMBARGO: NEW COMMERCIAL VEHICLE REGISTRATIONS EUROPEAN UNION 1 February 2018 Next press release: Tuesday 24 April 2018 1 Malta not available Page 1 of 7 Commercial vehicle registrations: +6.5% first
1. INTERNATIONAL OVERVIEW. 1.0 Area and population. population (1,000) area
 area") 1.0 Area and population area population (1,000) km 2 2000 2010 2018 1 inhabitants per km 2 Belgium 30,530 10,251 10,920 11,443 375 Germany 357,380 82,212 81,777 82,952 232 Estonia 45,230 1,397 1,331 1,315
1.0 Area and population area population (1,000) km 2 2000 2010 2018 1 inhabitants per km 2 Belgium 30,530 10,251 10,920 11,443 375 Germany 357,380 82,212 81,777 82,952 232 Estonia 45,230 1,397 1,331 1,315
BREXIT AND THE AUTO INDUSTRY: FACTS AND FIGURES
 BREXIT AND THE AUTO INDUSTRY: FACTS AND FIGURES GLOBAL TRADE European Union EU vehicle imports: Total value: 48,019 million Quantity: 3,640,975 units EU vehicle exports: Total value: 138,536 million Quantity:
Shipbuilding Statistics SEPTEMBER, 2018
 Shipbuilding Statistics SEPTEMBER, 2018 Contents: Shipbuilding Statistics (SEPTEMBER, 2018) 1. World New Orders... 1 2. World Completions... 2 3. World Orderbook at Year-End... 3 4. World Merchant Fleets
Global Oil&Gas Tanker Outlook
 MARSEILLE MARITIME 28 Global Oil&Gas Tanker Outlook ( and just a few words on containerships) Ralph Leszczynski Marseille, 16 September 28 banchero costa research www.bancosta.it - research@bancosta.it
International Economic Outlook Impact on Global Shipping. International Propeller Club Convention Tampa, FL
 International Economic Outlook Impact on Global Shipping International Propeller Club Convention Tampa, FL Captain John W. Murray October 7, 2010 Hapag-Lloyd The Company Headquarters in Hamburg, Germany
Inbound Tourism Trends Quarterly Q Issue 20 January 2017
 Inbound Tourism Trends Quarterly Q3 216 Issue 2 January 217 1 Contents 1. About this data 2. Global Context: Global view, Economic outlook and Exchange rate 3. Inbound Volume and Value 4. Journey Purpose,
BP Statistical Review of World Energy June 2017
 BP Statistical Review of World Energy June 217 Primary energy 8 Consumption 8 Consumption by fuel 9 66 th edition Primary energy Consumption* Growth rate per annum Million tonnes oil equivalent 26 27 28
World Geographic Shares
 World Geographic Shares North America South America Europe Africa Asia Australia/ Oceania 18% 13% 7% 22% 33% 6% World Population Shares North America South America Europe Africa Asia Australia/ Oceania
Autumn 2015 Economic Forecast: Moderate recovery despite challenges
 European Commission - Press release Autumn 2015 Economic Forecast: Moderate recovery despite challenges Brussels, 5 November 2015 The economic recovery in the euro area and the European Union as a whole
NEW PASSENGER CAR REGISTRATIONS BY ALTERNATIVE FUEL TYPE IN THE EUROPEAN UNION 1 Quarter
 PRESS EMBARGO: NEW PASSENGER CAR REGISTRATIONS BY ALTERNATIVE FUEL TYPE IN THE EUROPEAN UNION 1 Quarter 3 2017 Alternative fuel vehicle registrations: +51.4% in third quarter of 2017 In the third quarter
NEW COMMERCIAL VEHICLE REGISTRATIONS EUROPEAN UNION 1. December 2018
 PRESS EMBARGO: NEW COMMERCIAL VEHICLE REGISTRATIONS EUROPEAN UNION 1 December 2018 Commercial vehicle registrations: +3.2% in 2018; 4.0% in December Total new commercial vehicles In December 2018, commercial
AUSTRIA. Table 1. FDI flows in the host economy, by geographical origin. (Millions of US dollars)
") Table 1. FDI flows in the host economy, by geographical origin World 5 690 138 6 195 3 184 10 784 7 933 31 154 6 858 9 303 840 10 618 5 760 Developed economies 5 740 13 5 341 2 689 10 137 6 291 29 721
Table 1. FDI flows in the host economy, by geographical origin World 5 690 138 6 195 3 184 10 784 7 933 31 154 6 858 9 303 840 10 618 5 760 Developed economies 5 740 13 5 341 2 689 10 137 6 291 29 721
NEW COMMERCIAL VEHICLE REGISTRATIONS EUROPEAN UNION* September 2014
 PRESS EMBARGO: 8.00 A.M. (7.00 A.M GMT), October 28, 2014 NEW COMMERCIAL VEHICLE REGISTRATIONS EUROPEAN UNION* September 2014 Next Press Release: November 27, 2014 *Data for Malta unavailable Page 1 of
Economic and Market Report. EU Automotive Industry Quarter
 Economic and Market Report EU Automotive Industry Quarter 2 2017 September 2017 CONTENTS Passenger cars... 2 Registrations... 2 World... 2 The European Union... 4 Passenger car registrations by fuel type...
QUARTERLY REVIEW OF BUSINESS CONDITIONS: NEW MOTOR VEHICLE MANUFACTURING INDUSTRY / AUTOMOTIVE SECTOR: 4 TH QUARTER 2017
 NATIONAL ASSOCIATION OF AUTOMOBILE MANUFACTURERS OF SOUTH AFRICA GROUND FLOOR, BUILDING F ALENTI OFFICE PARK 457 WITHERITE STREET, THE WILLOWS, X82 PRETORIA PO BOX 74166, LYNNWOOD RIDGE. 0040 TELEPHONE:
Table B1. Advanced Economies: Unemployment, Employment, and Real per Capita GDP (Percent)
") Statistical Appendix Table B1. Advanced Economies: Unemployment, Employment, and Real per Capita GDP (Percent) Unemployment Rate 2 Averages 1 1993 2002 2003 12 Advanced Economies 6.8 6.9 6.7 6.5 6.3 5.8
Statistical Appendix Table B1. Advanced Economies: Unemployment, Employment, and Real per Capita GDP (Percent) Unemployment Rate 2 Averages 1 1993 2002 2003 12 Advanced Economies 6.8 6.9 6.7 6.5 6.3 5.8
Global Monthly February 2018
 Global Monthly February 18 3 1-year Treasury yields 1-year breakeven inflation rate 1 1 15 16 17 18 February 18 5 3 Global GDP growth Composite PMI (RHS) Index 56 5 5 1 5 1 13 1 15 16 17 18 3..5. 1.5 1.
Economic and Market Report. EU Automobile Industry
 Economic and Market Report EU Automobile Industry September 2015 Q2 2015 CONTENTS EU Economic Outlook... 2 Passenger cars... 4 Registrations... 4 World... 4 The European Union... 6 Production... 8 World...
Energy Challenges and Costs for Transport & Mobility. 13th EU Hitachi Science and Technology Forum: Transport and Mobility towards 2050
 Energy Challenges and Costs for Transport & Mobility 13th EU Hitachi Science and Technology Forum: Transport and Mobility towards 25 Dr. Lewis Fulton Head, Energy Policy and Technology, IEA www.iea.org
ACEA Report. Vehicles in use Europe 2018
 ACEA Report Vehicles in use Europe 2018 TABLE OF CONTENTS Summary... 2 Vehicles in use in Europe... 3 Passenger cars... 3 Light commercial vehicles... 4 Medium and heavy commercial vehicles... 5 Buses...
ANNUAL STATISTICAL SUPPLEMENT
 ANNUAL STATISTICAL SUPPLEMENT with 2016 data 2017 Edition This Statistical Supplement has been prepared to provide a longer historical perspective for the oil demand, supply, trade, stocks, prices and
Emerging Trends in Petroleum Markets
 Emerging Trends in Petroleum Markets For Defense Logistics Agency, Worldwide Energy Conference Washington, D.C. By T. Mason Hamilton, Petroleum Markets Analyst U.S. Energy Information Administration Independent
Inbound Tourism Trends Quarterly Quarter Issue 24 January 2018
 Inbound Tourism Trends Quarterly Quarter 3 217 Issue 24 January 218 1 Contents 1. About this data 2. Global Context: Global view, Economic outlook and Exchange rate 3. Inbound Volume and Value (Journey
NEW PASSENGER CAR REGISTRATIONS BY FUEL TYPE IN THE EUROPEAN UNION 1
 PRESS EMBARGO: NEW PASSENGER CAR REGISTRATIONS BY FUEL TYPE IN THE EUROPEAN UNION 1 Quarter 3 2018 Fuel types of new cars: diesel 18.2%, petrol +15.2%, electric +30.0% in third quarter of 2018 In the third
Sectoral Profile - Services
 Sectoral Profile - Services Energy consumption Changes in energy consumption and value added in services Since 2008 strong contraction of total energy consumption (-0.3%/year) although electricity consumption
NEW PASSENGER CAR REGISTRATIONS EUROPEAN UNION *
 PRESS EMBARGO: 8.00 AM (7.00 AM GMT), 17 November 2015 NEW PASSENGER CAR REGISTRATIONS EUROPEAN UNION * Passenger car registrations: +8.2% over ten months; +2.9% in In 2015, the EU passenger car market
Martin Stopford President, Clarkson Research
 9//5 Current and past policies for expanding maintaining or reducing shipbuilding capacity: OECD Working Party No 6 9 th November 5 Martin Stopford President, Clarkson Research Martin Stopford, Clarkson
Recent Developments in EU Refining and in the Supply and Trade of Petroleum Products
 Recent Developments in EU Refining and in the Supply and Trade of Petroleum Products Second Meeting of the EU Refining Forum Brussels, 27 November 2013 Toril Bosoni, International Energy Agency OECD/IEA
About Czarnikow. The Premier Provider of Sugar Market Services. Czarnikow has been in the sugar business since 1861
 About Czarnikow The Premier Provider of Sugar Market Services Czarnikow has been in the sugar business since 1861 Czarnikow is the leading professional services company in the sugar market Czarnikow has
ACEA Report. Vehicles in use Europe 2017
 ACEA Report Vehicles in use Europe 2017 TABLE OF CONTENTS Summary... 2 Vehicles in use in Europe... 3 Passenger cars... 3 Light commercial vehicles... 4 Medium and heavy commercial vehicles... 5 Buses...
BUSINESS OVERVIEW FEBRUARY
 BUSINESS OVERVIEW FEBRUARY 2018 Except for historical information, the statements made in this presentation constitute forward looking statements. These include statements regarding the intent, belief
Delivery Statistics. Second quarter 2015 EUROPEAN PULP AND PAPER INDUSTRY
 Second quarter EUROPEAN PULP AND PAPER INDUSTRY INTRODUCTION 2 nd Quarter, Paper and board deliveries by CEPI countries were 45.9 million tonnes in the first half of, a small tonnage decrease on the same
exports of goods annual change (%)
") 12.0 Austria s foreign trade 2015 by world region imports of goods 2015 exports of goods 2015 region 1 1 share (%) share (%) Europe 106,984 80.4 104,032 79.1 EU 93,686 70.4 90,841 69.1 EFTA 8,020 6.0 8,098
12.0 Austria s foreign trade 2015 by world region imports of goods 2015 exports of goods 2015 region 1 1 share (%) share (%) Europe 106,984 80.4 104,032 79.1 EU 93,686 70.4 90,841 69.1 EFTA 8,020 6.0 8,098
exports of goods annual change (%)
") 12.0 Austria s foreign trade 2016 by world region imports of goods 2016 exports of goods 2016 region 1 1 share (%) share (%) Europe 110,067 81.2 104,271 79.5 EU 96,801 71.4 91,112 69.4 EFTA 7,718 5.7 8,132
12.0 Austria s foreign trade 2016 by world region imports of goods 2016 exports of goods 2016 region 1 1 share (%) share (%) Europe 110,067 81.2 104,271 79.5 EU 96,801 71.4 91,112 69.4 EFTA 7,718 5.7 8,132
Improved timeliness of employment data
 2007Q1 2007Q2 2007Q3 2007Q4 2008Q1 2008Q2 2008Q3 2008Q4 2009Q1 2009Q2 2009Q3 2009Q4 2010Q1 2010Q2 2010Q3 2010Q4 2011Q1 2011Q2 2011Q3 2011Q4 2012Q1 2012Q2 2012Q3 2012Q4 2013Q1 2013Q2 2013Q3 2013Q4 2014Q1
REVIEW OF MARITIME TRANSPORT 2013
 UNITED NATIONS CONFERENCE ON TRADE AND DEVELOPMENT REVIEW OF MARITIME TRANSPORT 2013 Report by the UNCTAD secretariat Annex III UNITED NATIONS New York and Geneva, 2013 STATISTICAL ANNEX 173 True nationality
PRESS RELEASE 9:30 GMT, 30 th July 2018 London, UK
 PRESS RELEASE 9:30 GMT, 30 th July 2018 London, UK EUROPEAN CAR MARKET REGISTERS BEST H1 PERFORMANCE OF THE CENTURY, AS SUVS CONTINUE TO DRIVE GROWTH 8.66 million cars were registered between January and
OECD unemployment rate stable at 5.5% in January 2018
 OECD unemployment rate stable at.% in January 2018 The OECD unemployment rate was stable at.% in January 2018. Across the OECD area, 34. million people were unemployed, 1.9 million more than in April 2008.
Marine Money Japan Ship Finance Forum
 Marine Money Japan Ship Finance Forum Current Situation in Shipbuilding -World and Japan- Masashi Terakado The Shipbuilders Association of Japan May 12th, 2016 Contents 1. Current Situation and Projection
OECD unemployment rate stable at 5.4% in March 2018
 OECD unemployment rate stable at.4% in March 2018 The OECD unemployment rate remained stable at.4% in March 2018. Across the OECD area, 34 million people were unemployed, 1.4 million more than in April
PRESS RELEASE 10:00 GMT, 21 st March 2016 London, UK
 PRESS RELEASE 10:00 GMT, 21 st March 2016 London, UK EUROPEAN NEW CAR REGISTRATIONS BUOYED BY SUVs DURING FEBRUARY 2016 Records showed bumper sales during February, with 1.09 million units sold a 13.8%
Primary energy. 8 Consumption 9 Consumption by fuel. 67 th edition
 Primary energy 8 Consumption 9 Consumption by fuel 67 th edition Primary energy Consumption* Growth rate per annum Million tonnes oil equivalent 27 28 29 2 211 212 213 214 215 216 217 217 26-16 Share 217
TRADE WATCH * 4 th Quarter 2010 To see the note and data updates visit:
 Public Disclosure Authorized Public Disclosure Authorized Public Disclosure Authorized Public Disclosure Authorized TRADEWATCH * 4 th Quarter21 Toseethenoteanddataupdatesvisit: http://www.worldbank.org/research/trade/
SWITZERLAND October 2011
 UNITED NATIONS CONFERENCE ON TRADE AND DEVELOPMENT INVESTMENT COUNTRY PROFILES SWITZERLAND October 2011 i NOTE The Division on Investment and Enterprise of UNCTAD is a global centre of excellence, dealing
Aging of the light vehicle fleet May 2011
 Aging of the light vehicle fleet May 211 1 The Scope At an average age of 12.7 years in 21, New Zealand has one of the oldest light vehicle fleets in the developed world. This report looks at some of the
Coal. 36 Reserves and prices 38 Production and consumption. 67 th edition
 Coal 36 Reserves and prices 38 Production and consumption 67 th edition Total proved reserves at end 217 Million tonnes Anthracite and bituminous Subbituminous and lignite US 228 3116 25916 24.2% 357 Canada
Annex IV. True nationality of the 20 largest fleets by flag of registration, as at 1 January 2011 a
 194 Annex IV. True nationality of the 20 largest fleets by flag of registration, as at 1 January 2011 a Antigua and Barbuda Bahamas China Belgium 0 0-9 122 0.2 1 59 0.1 Bermuda 0 0-17 1 907 2.8 0 0 - Brazil
Company Overview. Fleet Profile. Key Facts
 STIFEL Conference Presentation February 12, 2019 Company Overview Scorpio Bulkers Inc. ( Scorpio or the Company ) owns or finance leases 56 mid-size dry bulk Eco vessels with an average age of 3.0 years
Passenger cars in the EU
 Passenger cars in the EU Statistics Explained Data extracted in April 2018 Planned article update: April 2019 This article describes developments in passenger car stocks and new registrations in the European
Thermal Coal Market Presentation to UNECE Ad Hoc Group of Experts on Coal in Sustainable Development December 7, 2004
 Thermal Coal Market Presentation to UNECE Ad Hoc Group of Experts on Coal in Sustainable Development December 7, 2004 Barlow Jonker Pty Ltd Commercial in Confidence 1 Presentation Outline 1. Barlow Jonker
February 2014 Euro area unemployment rate at 11.9% EU28 at 10.6%
 STAT/14/52 1 April 2014 February 2014 Euro area unemployment rate at 11.9% EU28 at 10.6% The euro area 1 (EA18) seasonally-adjusted 2 unemployment rate 3 was 11.9% in February 2014, stable since October
India & Asia. Steel Scrap Industry BY: VED PRAKASH GEMINI CORPORATION N. V., BELGIUM
 India & Asia Steel Scrap Industry BY: VED PRAKASH GEMINI CORPORATION N. V., BELGIUM 1 GEMINI CORPORATION N. V. Steel, Recyclable Plastics, Rubber and Engineered Wood Panels 2 Content How competitive are
Evolving Global Oil Trade Flows. IEA-IEF-OPEC Joint Meeting Vienna, March 2018
 Evolving Global Oil Trade Flows IEA-IEF-OPEC Joint Meeting Vienna, March 2018 SHIFTING FLOWS: WHAT HAS THIS MEANT IN PRACTICE? US/Europe crude imports & exports Saudi crude to Poland Chinese teapots importing
P r e s s R e l e a s e. June 2007
 PRESS EMBARGO FOR ALL DATA: 26 July 27, 8. A.M. (6. A.M. GMT) P r e s s NEW COMMERCIAL VEHICLE REGISTRATIONS June 27 European Union + EFTA Countries LCVs up to 3.5t Heavy Trucks over 16t 25, 3, 2, 15,
I. World trade in Overview
 I. World trade in - Overview Table I.1 Growth in the volume of world merchandise exports and production, 2-5 (Annual percentage change) 2-5 23 24 World merchandise exports 4.5 5. 9.5 6. Agricultural products
Global Downstream Petroleum Outlook
 Global Downstream Petroleum Outlook Claude Mandil Executive Director International Energy Agency 3 rd OPEC International Seminar Vienna, 12 September 26 Spare Refinery Capacity Has Tightened 9 1% 85 95%
QUARTERLY REVIEW OF BUSINESS CONDITIONS: NEW MOTOR VEHICLE MANUFACTURING INDUSTRY / AUTOMOTIVE SECTOR: 2 ND QUARTER 2017
 NATIONAL ASSOCIATION OF AUTOMOBILE MANUFACTURERS OF SOUTH AFRICA GROUND FLOOR, BUILDING F ALENTI OFFICE PARK 457 WITHERITE ROAD, THE WILLOWS, X82 PRETORIA PO BOX 40611, ARCADIA 0007 TELEPHONE: (012) 807-0152
Economic and Market Report. EU Automotive Industry Quarter
 Economic and Market Report EU Automotive Industry Quarter 3 2017 December 2017 CONTENTS EU economic outlook... 2 Passenger cars... 4 Registrations... 4 World... 4 The European Union... 6 Passenger car
42/ March GDP growth in the euro area and EU28. GDP growth rates % change over the previous quarter, based on seasonally adjusted data
 2007Q1 2007Q2 2007Q3 2007Q4 2008Q1 2008Q2 2008Q3 2008Q4 2009Q1 2009Q2 2009Q3 2009Q4 2010Q1 2010Q2 2010Q3 2010Q4 2011Q1 2011Q2 2011Q3 2011Q4 2012Q1 2012Q2 2012Q3 2012Q4 2013Q1 2013Q2 2013Q3 2013Q4 2014Q1
Signs of recovery in the Russian construction market
 Milena Bernardi - m.bernardi@tiledizioni.it Signs of recovery in the Russian construction market Fig. 1 - Construction output in Russia (y-o-y % change) Despite a slowdown with respect to the period April-
STATISTICAL ANNEX NOTE ON QUARTERLY PROJECTIONS
 OECD Economic Outlook, Volume 2017 Issue 1 OECD 2017 This annex contains data on key economic series which provide a background to the recent economic developments in the OECD area described in the main
DOWNSTREAM PETROLEUM 2017 DOWNSTREAM PETROLEUM
 DOWNSTREAM PETROLEUM International and Asian Refining The global refining industry is fundamentally changing as emerging and maturing trends re-shape the global supply and demand patterns for crude oil
Economic & Steel Market Development in Japan
 1 Economic & Steel Market Development in Japan 68 th OECD Steel Committee Paris May 6-7, 2010 The Japan Iron & Steel Federation 2 Macro-economic overview Steel Supply and Demand v v v Steel Production
Natural gas. 26 Reserves 28 Production and consumption 33 Prices 34 Trade movements. 67 th edition
 Natural gas 26 Reserves 28 Production and consumption 33 Prices 34 Trade movements 67 th edition Natural gas Total proved reserves At end 1997 At end 2007 At end 2016 At end Trillion Trillion Trillion
Total credit to the non-financial sector (core debt), % of GDP Table F1.1
, % of GDP Table F1.1") Total credit to the non-financial sector (core debt), % of GDP Table F1.1 2012 2013 2014 2015 2016 Q2 16 Q3 16 Q4 16 Q1 17 Q2 17 Argentina 62.6 66.4 64.6 75.5 75.3 81.7 80.1 75.3 71.6 72.7 Australia 208.0
Total credit to the non-financial sector (core debt), % of GDP Table F1.1 2012 2013 2014 2015 2016 Q2 16 Q3 16 Q4 16 Q1 17 Q2 17 Argentina 62.6 66.4 64.6 75.5 75.3 81.7 80.1 75.3 71.6 72.7 Australia 208.0
Recent Developments in EU Refining and in the Supply and Trade of Petroleum Products
 Recent Developments in EU Refining and in the Supply and Trade of Petroleum Products Third Meeting of the EU Refining Forum Brussels, 22 May 2014 Toril Bosoni, International Energy Agency OECD/IEA 2014
Monetary and Economic Department. Detailed tables on preliminary locational and consolidated banking statistics at end-june 2012
 Monetary and Economic Department Detailed tables on preliminary locational and consolidated banking statistics at end-june 2012 October 2012 Queries concerning this release should be addressed to statistics@bis.org.
NEW PASSENGER CAR REGISTRATIONS EUROPEAN UNION 1
 PRESS EMBARGO: 8.00 AM (6.00 AM GMT), 19 September 2018 NEW PASSENGER CAR REGISTRATIONS EUROPEAN UNION 1 Passenger car registrations: +6.1% eight months into 2018; +10.5% in July and +31.2% in August In
NEW PASSENGER CAR REGISTRATIONS BY ALTERNATIVE FUEL TYPE IN THE EUROPEAN UNION 1 Quarter
 PRESS EMBARGO: NEW PASSENGER CAR REGISTRATIONS BY ALTERNATIVE FUEL TYPE IN THE EUROPEAN UNION 1 Quarter 2 2016 Alternative fuel vehicle registrations: +0.6% in second quarter of 2016 In the second quarter
A perspective on the refining industry. Platts European Refining Summit Brussels, 29 September2016 Kristine Petrosyan, International Energy Agency
 A perspective on the refining industry Platts European Refining Summit Brussels, 29 September2016 Kristine Petrosyan, International Energy Agency OECD/IEA 2016 mb/d European refiners: busy 2015 OECD Europe
December 2011 compared with November 2011 Industrial producer prices down by 0.2% in both euro area and EU27
 18/2012-2 February 2012 December 2011 compared with November 2011 Industrial producer prices down by 0.2% in both euro area and EU27 In December 2011, compared with November 2011, the industrial producer
World real merchandise trade grows faster than output
 I. I. world trade developments 8 Merchandise trade and GDP World real merchandise trade grows faster than output In 2006, the volume of world merchandise trade grew by 8 per cent while world gross domestic
Market observation for European inland navigation Report on the state of the economy 2 - October 2010 (Source : CCNR Secretariat 5 th October 2010)
") CENTRAL COMMISSION FOR NAVIGATION ON THE RHINE Market observation for European inland navigation Report on the state of the economy 2 - October 2010 (Source : CCNR Secretariat 5 th October 2010) Inland
CENTRAL COMMISSION FOR NAVIGATION ON THE RHINE Market observation for European inland navigation Report on the state of the economy 2 - October 2010 (Source : CCNR Secretariat 5 th October 2010) Inland
U.S. Rail Crude Oil Traffic
 U.S. Rail Crude Oil Traffic Association of American Railroads May 217 Summary U.S. crude oil production has risen sharply in recent years, with much of the increased output moving by rail. In 28, U.S.
Analyses. May HolidayEuro Summer Purchasing Power of the Euro Abroad. Bank Austria Economics & Market Analysis Austria
 Bank Austria Economics & Market Analysis Austria Analyses HolidayEuro Summer 2011 Purchasing Power of the Euro Abroad May 2011 http://economicresearch.bankaustria.at Overview Holiday uro in summer 2011
NEW PASSENGER CAR REGISTRATIONS BY ALTERNATIVE FUEL TYPE IN THE EUROPEAN UNION 1 Quarter
 PRESS EMBARGO: NEW PASSENGER CAR REGISTRATIONS BY ALTERNATIVE FUEL TYPE IN THE EUROPEAN UNION 1 Quarter 2 2017 Alternative fuel vehicle registrations: +38.0% in second quarter of 2017 In the second quarter
Alfen acquires Elkamo in Finland A platform for expansion in the Nordics
 Alfen acquires Elkamo in Finland A platform for expansion in the Nordics 2 July 2018 Disclaimer This communication may include forward-looking statements. All statements other than statements of historical
OECD unemployment rate stable at 5.3% in July 2018
 OECD unemployment rate stable at.3% in July 208 The OECD unemployment rate was stable at.3% in July 208. Across the OECD, 33. million people were unemployed,.7 million less than the peak in January 203
September 2011 compared with August 2011 Industrial producer prices up by 0.3% in euro area Up by 0.4% in EU27
 161/2011-4 November 2011 September 2011 compared with August 2011 Industrial producer prices up by 0.3% in euro area Up by 0.4% in EU27 In September 2011 compared with August 2011, the industrial producer
Euro area unemployment rate at 10.5%
 3/2016-7 January 2016 November 2015 Euro area unemployment rate at 10.5% EU28 at 9.1% The euro area (EA19) seasonally-adjusted unemployment rate was 10.5% in November 2015, down from 10.6% in October 2015,
OECD unemployment rate falls to 6.0% in March 2017
 OECD unemployment rate falls to 6.0% in March 017 The OECD unemployment rate for the population as a whole fell by 0.1 percentage point, to 6.0%, in March 017. Across the OECD area, 37.5 million people
ANNUAL STATISTICAL SUPPLEMENT
 ANNUAL STATISTICAL SUPPLEMENT with 2008 data 2009 Edition This Statistical Supplement has been prepared to provide a longer historical perspective for the oil demand, supply, trade, stocks, prices and
DRY BULK FREIGHT MARKET OUTLOOK MJUNCTION INDIAN STEEL MARKETS CONFERENCE
 DRY BULK FREIGHT MARKET OUTLOOK MJUNCTION INDIAN STEEL MARKETS CONFERENCE JUNE 2018 PRESENTATION STRUCTURE where are we in the dry bulk freight market cycle? current freight rates in perspective fundamental
International Coal Markets
 International Coal Markets www.coalimp.org.uk Nigel Yaxley Managing Director, CoalImp 26 th November 28 International Coal Markets World supply and demand Seaborne trade Reserves and resources International
Unlawful distribution of this report is prohibited. IFCHOR Group Research
 Unlawful distribution of this report is prohibited IFCHOR Group Research Marine Money Geneva Forum - 29 th June 2016 DRY BULK SUPPLY OVERVIEW Capacity Surplus... Yearly net fleet change..... FUNDAMENTALS
QUARTERLY REVIEW OF BUSINESS CONDITIONS: MOTOR VEHICLE MANUFACTURING INDUSTRY / AUTOMOTIVE SECTOR: 4 TH QUARTER 2016
 NATIONAL ASSOCIATION OF AUTOMOBILE MANUFACTURERS OF SOUTH AFRICA GROUND FLOOR, BUILDING F ALENTI OFFICE PARK 457 WITHERITE ROAD, THE WILLOWS, X82 PRETORIA PO BOX 40611, ARCADIA 0007 TELEPHONE: (012) 807-0152
Respect for customers, partners and staff. Service: another name for the respect that a company owes its customers, partners and staff.
 Respect for customers, partners and staff Service: another name for the respect that a company owes its customers, partners and staff. Vehicle glass KEY FIGURES (in EUR million) 2004 2003 % change Total
Global Coal and Coke Flows, 2008
 Global Coal and Coke Flows, 2008 Phil Fisher Pet Coke Consulting Argus Petroleum Coke Summit September 17-18, 2009 Houston, TX Global Coal and Coke Flows What we will see: 1 How much steam coal is produced/
May 2014 Euro area unemployment rate at 11.6% EU28 at 10.3%
 STAT/14/103-1 July 2014 May 2014 Euro area unemployment rate at 11.6% EU28 at 10.3% The euro area 1 (EA18) seasonally-adjusted 2 unemployment rate 3 was 11.6% in May 2014, stable compared with April 2014
NEW ALTERNATIVE FUEL VEHICLE REGISTRATIONS IN THE EUROPEAN UNION 1 Q2 2015
 NEW ALTERNATIVE FUEL VEHICLE REGISTRATIONS IN THE Q2 2015 New alternative fuel vehicle (AFV) registrations in the EU by engine type Q2 2014 Q2 2015 Thousand units 70 60 50 40 30 20 10 0 EVs HEVs AFVs other
Future Trends in the Global Bunker Market
 Future Trends in the Global Bunker Market Will Bathurst, Senior Analyst SSY Consultancy & Research Bunker Asia Forum Singapore, 7th Whilst care and attention has been taken to ensure that the information