REPUBLIC OF LIBERIA LIBERIA CORE WELFARE INDICATORS QUESTIONNAIRE (CWIQ) SURVEY 2010 STATISTICAL ABSTRACT
|
|
|
- Reynard Thomas
- 5 years ago
- Views:
Transcription
 Statistics House 9th Street, Sinkor P.O.")
1 REPUBLIC OF LIBERIA LIBERIA CORE WELFARE INDICATORS QUESTIONNAIRE (CWIQ) SURVEY 2010 STATISTICAL ABSTRACT Liberia Institute of Statistics & Geo-Information Services Statistics (LISGIS) Statistics House 9th Street, Sinkor P.O. Box 629 Monrovia, Liberia
2
3 COPYRIGHT RESERVED Extracts may be published if source is duly acknowledged. Additional information on the CWIQ survey can be obtained from the Director-General, Liberia Institute of Statistics & Geo-Information Services Statistics (LISGIS), Statistics House, 9th Street, Sinkor, P. O. Box 629, Monrovia, Liberia. Tel.: / Website:
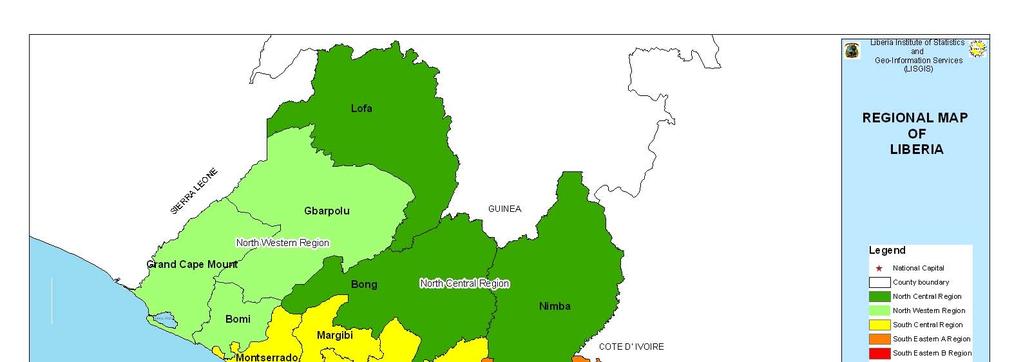
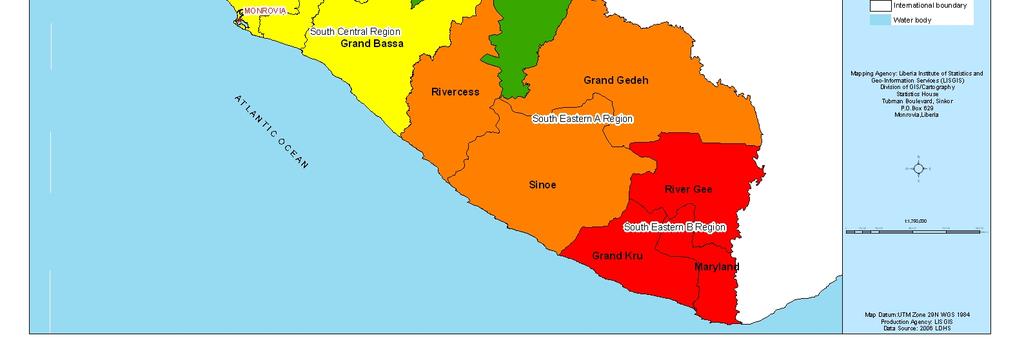
4 ADMINISTRATIVE MAP OF LIBERIA
5 Page Preface 6 Acknowledgements 7 Definition of Concepts 8 Special Notes Concerning Survey 10 INTRODUCTION 11 SAMPLE SIZE Table 1.1 Sample Size for the Liberia Core Welfare Indicator Questionnaire (CWIQ) Survey DEMOGRAPHIC CHARACTERISTICS Table of Contents Table 2.1 Percentage Distribution of Population by Sex 16 Table 2.2 Percentage Distribution of Households by Household Composition (size) 16 Table 2.3 Percentage Distribution of Population Structure by Broad Age-groups 17 Table 2.4 Percentage Distribuition of Household Members Relationship to Head 17 Table 2.5 Percentage Distribution of Population by Sex, Broad Age-groups and Area of Residence 18 Table 2.6 Percentage Distribution of Population (population pyramid) by Sex, Broad Age-groups and 19 Area of Residence Table 2.7 Percentage Distribution of Population (10+ years) by Marital Status 20 Table 2.8 Percentage Distribution of Children (0-17 years) by Orphaned and Father Living at Home 20 Table 2.9 Percentage Distribution of Children (0-17 years) by Orphaned and Mother Living at Home 21 Table 2.10 Percentage Distribution of Children (0-17 years) by Orphanedhood 21 Table 2.11 Pecentage Distribution of Population (10+ years) who Contribute to Household Income by Sex, 22 Area of Residence and Broad Age-groups Table 2.12 Distribution of Population (10+ years) who Contribute to Household Income by Relationship to 23 Head Table 2.13 Percentage Distribution of Population (Liberians) by Religious Affiliation 23 Table 2.14 Distribution of Population by Nationality and by Gender 24 LITERACY AND EDUCATION Table 3.1 Percentage Distribution of Adult (15+ years) Literacy Levels by Sex 24 Table 3.2 Percentage Distribution of Youth (15-24 years) Literacy Levels by Sex 24 Table 3.3 Percentage Distribution of Adult (15+ years) Literacy Levels by Area of Residence, Sex and 25 Broad Age-groups Table 3.4 Percentage Distribution of Youth (15-24 years) Literacy Levels by Area of Residence, Sex and 26 Single Ages Table 3.5 Percentage Distribution Population (6+ years) who Ever Attended School by Sex 27 Table 3.6 Percentage Distribution of Population (6+ years) who Ever Attended School by Sex, Area of 28 Residence and Broad Age-group Table 3.7 Percentage Distribution of Children (6-17 years) who Have Never Attended School by Sex 29 Table 3.8 Percentage of Children (6-17 years) who Ever Attended School but Not Currently Attending 29 School Table 3.9 Percentage Distribution of Male Population (6+ years) by Highest Level of Education 30 Completed Table 3.10 Percentage Distribution of Female Population (6+ years) by Highest Level of Education 31 Completed Table 3.11 Percentage Distribution Population (6+ years) by Highest Level of Education Completed 31 Table 3.12 Percentage Distribution of Population (6+ years) by Highest Level of Education Completed, Sex and Broad Age-group 32 1
6 Table 3.13 Gross Enrolment Rates by Type of School and Sex 33 Table 3.14 Net Enrolment rates by Type of School and Sex 34 Table 3.15 Gross Enrolment rates for Junior and Senior Secondary by Sex 35 Table 3.16 Net Enrolment rates for Junior and Senior Secondary by Sex 36 Table 3.17 Percentage Distribution of Children Currently in School by Type of School and Access to 37 School Within 5Km Table 3.19 Percentage Distribution of Children Currently in School by Who Runs and Manages the School 37 Table 3.19 Percentage Distribution of Children Currently in School by Level of Education, Who Runs the 38 School Table 3.20 Percentage Distribution of Satisfaction Levels for Children Currently at School by Level of 39 Education Table 3.21 Percentage Distribution of Students Currently Enrolled in School with Reasons for 40 Dissatisfaction Table 3.22 Percentage Distribution of Students Currently Enrolled in Primary School by Difficulty in 41 Satisfying the School Fees Needs Table 3.23 Percentage Distribution of Students Currently Enrolled in Secondary School by Difficulty in 41 Satisfying the School Fees Needs Table 3.24 Percentage Distribution of Population (15+ years) by Most Important Source of Information 42 Table 3.25 Percentage Distribution of Male Population (15+ years) by Most Important Source of 43 Information Table 3.26 Percentage Distribution of Female Population (15+ years) by Most Important Source of 43 Information Table 3.27 Percentage Distribution by Broad Age-groups and Most Important Source of Information 44 HEALTH Table 4.1 Percentage Distribution of Population by Disability Status, Type of Disability, Severity of 45 Disability Table 4.2 Percentage of Women (12-49 years) who had a Live Birth Last 12 months and Received Prenatal 46 and Post-natal Care Table 4.3 Percentage of Women (12-49 years) who had a Live Birth last 12 months, Pre-natal and Postnatal 47 Care by Age-group and Area of Residence Table 4.4 Percentage Distribution of Population by Incidence of Sickness (Need) in the last Four Weeks 48 Table 4.5 Percentage Distribution of Population Sick or Injured by Type of Illness, Region, Sex and 49 Broad Age-groups Table 4.6 Percentage Distribution of Population Sick or Injured by Type of Illness, Region, Sex and 50 Broad Age-groups Table 4.7 Percentage Distribution of Population Who Consulted a Health Practitioner (Use) by Sex 51 Table 4.8 Percentage Distribution of Population Who Were Sick by Type of Health Practitioner Consulted 52 (Use) Table 4.9 Percentage Distribution of Population Sick Who Consulted a Health Practitioner and 53 Satisfaction with Medical Services Table 4.10 Percentage Distribution of Population Sick Who Consulted a Health Practitioner by Access to a 53 Health facility within 5Km Table 4.11 Percentage of Sick Persons who Consulted a Health Provider and Were Not Satisfied, and 54 Reasons for Dissatisfaction Table 4.12 Percentage of Persons who did not Consult a Health Provider When Sick and Reasons for Not Consulting 55 HOUSEHOLD HEAD CHARACTERISTICS Table 5.1 Percentage Distribution of Household Heads by Sex 56 Table 5.2 Percentage Distribution of Household Heads by Sex, Area of Residence and Broad Age- Groups 57 2
7 Table 5.3 Percentage Distribution of Household Heads by Sex (Population pyramid), Area of Residence 58 and Broad Age-groups Table 5.4 Percentage Distribution of Household Heads by Marital Status 59 Table 5.5 Percentage Distribution of Male Household Heads by Marital Status 60 Table 5.6 Percentage Distribution of Female Household Heads by Marital Status 60 Table 5.7 Percentage Distribution of Household Heads who have Ever Attended School by Sex 61 Table 5.8 Percentage Distribution of Literacy Levels of Household Heads by Sex 61 Table 5.9 Percentage Distribution of Literacy Levels of Household Heads by Sex, Area of Residence and 62 Broad Age-groups Table 5.10 Percentage Distribution of Highest Education Level Completed of Household Heads 63 Table 5.11 Percentage Distribution of Highest Education Level Completed of Male Household Heads 64 Table 5.12 Percentage Distribution of Highest Education Level Completed of Female Household Heads 64 Table 5.13 Percentage Distribution of Highest Education Level Completed of Household Heads by Agegroup 65 and Gender Table 5.14 Percentage Distribution of Highest Education Level Completed of Household Heads for Rural 66 Area by Sex and Age-group Table 5.15 Percentage Distribution of Highest Education Level Completed of Household Heads for Urban Area by Sex and Age-group 67 HOUSEHOLD AMENITIES AND ASSETS Table 6.1 Percentage Distribution of Households by Housing Tenure 68 Table 6.2 Percentage Distribution of Households by Type of Documents to Prove Occupancy 68 Table 6.3 Percentage Distribution of Households At Risk of Being Forced to leave Household and/or 69 Land Table 6.4 Percentage Distribution of Households At Risk of Being Forced by Type of Documents 69 Table 6.5 Percentage Distribution of Households At Risk of Being Forced by Home Ownership 70 Table 6.6 Percentage Distribution of Households by Type of Housing Unit 70 Table 6.7 Percentage Distribution of Households by Number of Rooms 71 Table 6.8 Percentage Distribution of Households by Main Material Used for Wall Construction of the 71 House Table 6.9 Percentage Distribution of Households by Main Material Used for Roof Construction of the 72 House Table 6.10 Percentage Distribution of Households by Main Material Used for Floor Construction of the 72 House Table 6.11 Percentage Distribution of Households by Improved Water Source, Main Source of Drinking 73 Water Table 6.12 Percentage Distribution of Households by Safe Sanitation, Main Type of Toilet 74 Table 6.13 Percentage Distribution of Households by Non-wood Fuel Use and Main Source of Fuel for 75 Cooking Table 6.14 Percentage Distribution of Households by Main Source of Fuel for Lighting 75 Table 6.15 Percentage Distribution of Households by Improved Garbage Disposal, Type of Main Garbage 76 Disposal Table 6.16 Percentage Distribution of Households by Land Size Owned (ha) 77 Table 6.17 Percentage Distribution of Households by Land Size Compared to One year ago 77 Table 6.18 Percentage Distribution of Households by Land Used that does Not Own by Use 78 Table 6.19 Percentage Distribution of Households by Land Size (ha) for Land Used and Not Owned 79 Table 6.20 Percentage Distribution of Households by Land Used but Not Owned Compared to One year 79 ago Table 6.21 Percentage Distribution of Households Using Agricultural Inputs 80 Table 6.22 Percentage Distribution of Households by Main Source of Agricultural Inputs 80 Table 6.23 Percentage Distribution of Households by Number of Sheep Owned 81 3
8 Table 6.24 Percentage Distribution of Households by Sheep Owned Compared to One year ago 81 Table 6.25 Percentage Distribution of Households by Number of Goats Owned 82 Table 6.26 Percentage Distribution of Households by Goats Owned Compared to One year ago 82 Table 6.27 Percentage Distribution of Households Owning Certain Assets 83 ACCESS TO SOCIAL AMENITIES Table 7.1 Percentage Distribution of Population By Access and Distance to Nearest Primary School 84 Table 7.2 Percentage Distribution of Population By Access and Distance to Nearest Secondary School 84 Table 7.3 Percentage Distribution of Population By Access and Distance to Nearest Health Clinic 85 Table 7.4 Percentage Distribution of Population By Access to Supply of Safe Drinking Water, Distance to 85 Table 7.5 Percentage of Distribution Population By Access and Distance to Nearest Police station 86 Table 7.6 Percentage Distribution of Population By Access and Distance to Nearest Court 86 Table 7.7 Percentage Distribution of Population By Access and Distance to Nearest Food Market 87 Table 7.8 Percentage Distribution of Population By Access and Distance to Nearest Public Transport 87 Table 7.9 Percentage Distribution of Population By Access and Distance to Nearest All Season Road 88 Table 7.10 Percentage Distribution of Population By Access and Distance to Nearest Any Road 88 HOUSEHOLD PERCEPTIONS OF WELL-BEING Table 8.1 Percentage Distribution of Households by Difficulty in Satisfying the Food Needs 89 Table 8.2 Percentage Distribution of Households by Difficulty in Satisfying the School Fees Needs 89 Table 8.3 Percentage Distribution of Households by Difficulty in Satisfying the Health Bills Needs 90 Table 8.4 Percentage Distribution of Households by Difficulty in Satisfying the House Rent Needs 90 Table 8.5 Percentage Distribution of Households by Difficulty in Satisfying the Utility Bills Needs 91 Table 8.6 Percentage Distribution of Households by Perception of the Economic Situation of Community 91 Compared to One Year Ago Table 8.7 Percentage Distribution of Households by Perception of Wellbeing based on Income 92 Table 8.8 Percentage Distribution of Households by Perceived Poverty Status 92 Table 8.9 Percentage Distribution of Household's Financial Situation and average monthly Liberian $ 93 Table 8.10 Percentage Distribution of Household Income and Household Living Standard 93 Table 8.11 Percentage Distribution of Households by Membership of an Association 94 Table 8.12 Percentage Distribution of Sources of Assistance to Households in Times of Finanancial 94 Difficulty Table 8.13 Percentage Distribution of Households by Most important measure Government should take to Improve Household Living Standard 95 DISPLACEMENT AND FOOD AID Table 9.1 Percentage Distribution of Households Displaced and Returned to Place of Origin 96 Table 9.2 Percentage Distribution of Households Displaced by Main Reasons for Not Returning 96 Table 9.3 Percentage Distribution of Households by Food Situation 97 Table 9.4 Percentage Distribution of Households Who Received Food Aid and Type of Program 98 Table 9.5 Percentage Distribution of Households by Type of Assistance (Money Allowance/Loans) 99 received Last 12 months Table 9.6 Percentage Distribution of Households by Type of Assistance (Education school materials) 100 received Last 12 months Table 9.7 Percentage Distribution of Households by Type of Assistance (Medical services) received Last months Table 9.8 Percentage Distribution of Households by Type of Assistance (Construction/Building materials) 102 received Last 12 months Table 9.9 Percentage Distribution of Households by Type of Assistance (Water and/or Sanitation) 103 4
9 Table 9.10 Percentage Distribution of Households by Type of Assistance (Agricultural assistance) 104 received Last 12 months Table 9.11 Percentage Distribution of Households by Type of Community Support Assistance 105 KEY TABLES COMPARING 2007 and 2010 Table 10.1 Percentage Distribution of Population by Sex, 2007 and Table 10.2 Percentage Distribution of Population Structure by Broad Age-groups, 2007 and Table 10.3 Percentage Distribution of Household Heads by Sex, 2007 and Table 10.4 Percentage Distribution of Adult (15+ years) Literacy Levels by Sex, 2007 and Table 10.5 Percentage Distribution of Youth (15-24 years) Literacy Levels by Sex, 2007 and Table 10.6 Percentage Distribution Population (6+ years) who Ever Attended School by Sex, 2007 and Table 10.7 Percentage Distribution of Children (6-17 years) who Have Never Attended School by Sex, and 2010 Table 10.8 Percentage Distribution Population (6+ years) by Highest Level of Education Completed, and 2010 Table 10.9 Gross Enrolment Rates by Type of School and Sex, 2007 and Table Net Enrolment Rates by Type of School and Sex, 2007 and Table Gross Junior and Senior Secondary School Enrolment Rates and Sex, 2007 and Table Net Junior and Senior Secondary School Enrolment Rates and Sex, 2007 and Table Percentage of Women (12-49 years) who had a Live Birth last 12 months, Pre-natal and Postnatal 118 Care by Age-group and Area of Residence, 2007 and 2010 Table Percentage Distribution of Population Who Consulted a Health Practitioner (Use) by Sex, and 2010 Table Percentage Distribution of Population Sick Who Consulted a Health Practitioner and 119 Satisfaction with Medical Services, 2007 and 2010 Table Percentage Distribution of Households by Housing Tenure, 2007 and Table Percentage Distribution of Households by Type of Documents to Prove Occupancy, 2007 and Table Percentage Distribution of Households by Improved Water Source, Main Source of Drinking 122 Water, 2007 and 2010 Table Percentage Distribution of Households by Safe Sanitation, Main Type of Toilet, 2007 and Table Percentage Distribution of Households by Non-wood Fuel Use and Main Source of Fuel for 124 Cooking, 2007 and 2010 Table Percentage Distribution of Households by Main Source of Fuel for Lighting, 2007 and Table Percentage Distribution of Households by Land Size Owned (ha), 2007 and Table Percentage Distribution of Households by Difficulty in Satisfying the Food Needs, 2007 and Table Percentage Distribution of Households by Difficulty in Satisfying the Health Bills Needs, and 2010 Table Percentage Distribution of Households by Perceived Poverty Status, 2007 and Table Percentage Distribution of Household's Financial Situation and average monthly Liberian $ 130 needed to satisfy basic needs, 2007 and
10 Preface Two CWIQ surveys have been undertaken in Liberia and The first survey conducted in 2007 gave regional-based estimates and indicators. In 2010 however, Liberia Institute of Statistics & Geo- Information Services Statistics (LISGIS) conducted the first county-based Core Welfare Indicators Questionnaire Survey (CWIQ). This is the first nationally representative survey where county-level estimates have been derived. The surveys have been used to assess the social and economic situation in the country and have led to more informed and focused debate on how welfare and vulnerability challenges may be tackled. This survey is rich with information on topics such as, literacy and education, employment, household assets and amenities, access, use and satisfaction with basic facilities, vulnerability, subjective well-being, indirect measures of poverty using non-moneymetric measurement and others. It is important that Government and the development partners strive to expand the economic opportunities for the less privileged and reduce their vulnerability. It is our hope that information in this report will contribute significantly to the development process and form the basis of identifying designing and refocusing welfare intervention strategies and programmes in the country. Other publications on the 2010 Core Welfare Indicators Questionnaire Survey (CWIQ) include, main report, a fact-sheet, and a CD-ROM with the database and publications. On behalf of the Government of Liberia, the Liberia Institute of Statistics and Geo-Information Services would like to thank Government of Liberia, the UNDP, FAO and the ILO for their financial support in conducting the first county-based CWIQ survey, and the World Bank for technical assistance in processing, analyzing and publishing this abstract. October 2012 Dr. T. Edward Liberty Government Statistician Liberia Institute of Statistics & Geo-Information Services Statistics 6
11 Acknowledgements This Core Welfare Indicator Questionnaire (CWIQ) Statistical Abstract has been authored and prepared by a team of officers from the Liberia Institute of Statistics & Geo-Information Services Statistics. The team was led by Mr. Richard Nguafan under the guidance of the Director General Dr. T. Edward Liberty. The authors would like to acknowledge particularly the contributions of various people and institutions, who reviewed and gave comments that led to the improvement of the final statistical abstract. Special thanks go to the UNDP and the World Bank for their support in validating the data to be used for the analysis. We express gratitude to Ms. Rose Mungai, of the World Bank, for her immeasurable contribution from the inception of data cleaning unto the writing of the final report. We extend profound thanks to the dedicated survey staff for their invaluable contribution and perseverance in ensuring the completion of the survey and this report. Finally, we acknowledge the many others who encouraged us and the cooperation of all survey respondents in making the 2010 Core Welfare Indicator Questionnaire (CWIQ) a reality. 7
12 Definition of Concepts Region: There are five administrative regions in Liberia. County: Liberia changed from the local authorities system of administration to the county assembly in 19XX. The country is demarcated into 16 counties out of the existing XX districts. The boundaries of the districts conform to the boundaries of the counties and regional boundaries. County is the lower-level divisions from regions. Urban/Rural: The rural/urban classification of localities is population based, with a population size of X,XXX or more being urban and less than X,XXX being rural, as used in earlier census. DEMOGRAPHIC CHARACTERISTICS Population defined here is not the CENSUS definition (de facto count). Population referred here are only persons living in households and excludes persons in Institutions, streets, etc. EDUCATION AND LITERACY Adult Literacy is defined for persons age 15 years and above who can read and write in any language. Youth Literacy is defined for persons age 15 to 24 years who can read and write in any language. Primary school estimates are defined for children aged 6 to 11 years. Access is defined as children currently in primary schools withint 5Km of a primary school. Enrollment (net) is defined for children currently in primary school (P1 to P6) of primary school age (6-11 years). Enrollment (gross) is defined for children currently in primary school (P1 to P6) of all ages. Satisfaction is defined for children of all ages currently in primary school who cited no problems with school. Secondary school estimates are defined for children aged 12 to 17 years. Access is defined for children currently in secondary school in households less than 5km from a secondary school. Enrollment (net) is defined for children currently in secondary school (S7 to S9, SH10 to SH12) of secondary school age (12-17 years). Enrollment (gross) is defined for children currently in secondary school (S7 to S9 and SH10 to SH12) of all ages. Satisfaction is defined for children of all ages currently in secondary school who cited no problems with school. Tertiary school estimates are defined for children aged 18 to 24 years. Enrollment (net) is defined for children currently in University, Vocational, Technical training and Technical of school age (18-24 years). Enrollment (gross) is defined for children currently in University, Vocational, Technical training and Technical of all ages. Overall Enrollment (net) is defined for children currently in school of school age (6-24 years). Overall Enrollment (gross) is defined for children currently in school of all ages. HEALTH Access is defined for persons less than 5km from a health facility. Need is defined for persons sick or injured in the four-week period preceding the survey. Use is defined for persons who consulted a health practitioner in the four-week period preceding the survey. Satisfaction is defined for persons who consulted a health practitioner in the four week period preceding the survey who cited no problems. 8
13 HOUSEHOLD HEAD CHARACTERISTICS Household Head: Is defined as the person in the household recognized as the head by other household members. This is generally the person responsible for the upkeep and maintenance of the household. In his/her absence, the person who takes charge of the household is considered a "temporary head". All household relationships are defined with reference to the head or temporary head. HOUSEHOLD AMENITIES AND ASSETS Improved water sources is defined as having piped water in the dwelling, public outdoor tap, and protected well. Improved sanitation is defined for households using a flush toilet (sewer or septic tank), covered pit latrine, Ventilated covered pit latrine (VIP). Improved means of waste disposal is defined for households that have their refuse collected or use a public dump. Non-wood fuel for cooking is the use of any fuel other than firewood and charcoal for cooking. ACCESS TO AMENITIES Access is having the nearest specified facility, i.e. primary school, secondary school, health facility, water source, telecommunication facility, public transport and food market, within 5km from the household. HOUSEHOLD PERCEPTIONS OF WELL-BEING Difficulty meeting food needs is defined for households that reported difficulty meeting food needs often or always. Household economic situation compared to one year ago: Worse is defined for households that replied much worse now or a little worse now; better is defined for households that replied a little better now or much better now. 9
14 Special Notes Concerning Survey All tables are by region and county unless otherwise specified in the title. Tables refer to 2010 survey unless specified. All percentages are weighted (grossed up) unless otherwise stated. To obtain national estimates, the sample figures had to be grossed up by the appropriate factor (weighting co-efficient). Because of the effects of rounding, percentages may not always add exactly to 100. For the same reasons estimated numbers may not add exactly to the estimated totals shown in the table. 0.0 means negligible " " or ".." means nil. Percentages add up to 100 unless otherwise stated. 24 Households members did not state their sex. Therefore, a total done reflecting sex may show slightly different results when compared to the aggregate where sex is not applied 23 (14 missing and 9 coded as 99) household members did not report ages. Therefore, a total done reflecting age may show slightly different results when compared ti the aggregate where age is not applied Missing information is not imputed. 10
15 Introduction Background However, it was recognized, that not all groups of the society had the same capacity and access to opportunities to deal with the effects of the adjustment process. Poverty is identified as one major factor why many people have little or no access to the basic amenities that are made available as a result of the interventions in the economy. Therefore, more reliable and timely statistical indicators were needed for monitoring poverty and the effects of various development policies, programmes and projects on living standards of the people. Such indicators were not only needed at the national level but at disaggregated levels and for various population sub-groups, especially given the recognition that district-level indicators are crucial for monitoring and evaluating poverty reduction efforts at the lower level. Objective of the Survey The main objectives were: - To provide simple indicators for monitoring poverty and the effects of development policies and programme on the welfare of Liberians. To provide reliable data on a timely basis for monitoring changes in the welfare status of households and various sub-groups of the population at the district level. To ensure rapid data capture, processing, tabulation and analysis. To ensure optimal precision by the use of as large a sample as is feasible given national statistical resource constraints and the need for rapid results in generating district-level indicators. To eliminate data entry bottlenecks through the use of scanning technique with Optical Character Recognition (OCR). Sample Design An updated list of Enumeration Areas is maintained at the LISGIS, with urban and rural demarcation for each county. Greater Monrovia, was separated from the rest of Montserrado County due to its peculiar socio-demographic characteristics. Enumeration areas were selected separately from the urban and rural listings for each county. At the first stage, the required number of EAs was selected in each stratum with probability proportional to size (PPS), where the measure of size is the number of households listed in the census. At the second stage, a fixed number of households (12) were taken by systematic sampling within each EA that was picked at the first stage. While the overall number of EAs has increased by just over 50 percent, there is a marked contrast in what has happened to urban and rural EAs: the number of urban EAs has almost trebled, while the number of rural EAs has increased by less than 10 percent. This increase in urban EAs is due mainly to two factors: first, the movement of people from rural to urban areas; and secondly, a change in the designation of what counts as an urban area. In the 1984 Census, urban areas in each county consisted mainly of the county capitals. For the 2008 Census, a much broader definition was used, with all settlements of 2000 or more persons being counted as urban. The ratio of urban to rural EAs has thus changed from 25:75 in 1984 to 46:54 in
16 It is also clear from the table that the trends have not been consistent across all counties. Only one county (Sinoe) saw a drop in the number of urban EAs it contains, whereas several other counties saw massive increases in the number of urban EAs. Survey Instruments The Core Welfare Indicators Questionnaire (CWIQ) 2010 adopted a house-based questionnaire which consists of four (4) double-sided pages. To ensure concise responses for the interviews, pre-coded multiple-choice response questions were used. The questionnaire was designed based on eleven (11) distinct modules. These include:- Background characteristics of household members Education Health Employment Household Assets Household Amenities Poverty Predictors (based on expenditure on key basic items) Child Anthropometry Subjective Well-being Violence, Crime and Safety Communication 12
17 Field Organization Training Field staff The training of interviewers was guided by an interviewer s manual. This involved comprehensive and systematic explanations on: the structure and content of the survey questionnaire; basic concepts and definitions to be applied in the execution of the Core Welfare Indicator Questionnaire (CWIQ) survey data collection exercise; interactive discussions; simulated field trials; mock interviews and how to shade a bubble or print (write) numbers in the scannable CWIQ questionnaire. Participants were also trained in the techniques to be used in weighing and measuring children. Scanning Officers/assistants The scanning officers and assistants received additional training on the use of scanners to capture the field returns and to use the Core Welfare Indicator Questionnaire (CWIQ) application for data processing. The officers were taken through the process of developing the scannable questionnaire, data scanning, editing, validation, dismantling and reassembling the scanner, replacement of expendable parts and daily routine maintenance of the scanning equipment. The assistants were trained further on the preparation and scanning of questionnaires from the field as well as archiving of the scanned questionnaires to facilitate easy retrieval. Fieldwork The data collection exercise for the main survey commenced on 10th February and ended on 22nd April Sixty-one teams were involved in the fieldwork which comprised a team of one supervisor, three interviewers and one driver. In addition, there were two standby supervisors and six interviewers. As a quality control measure and also boost the morale of the field staff, both scheduled and unannounced extended/extensive field trips were made by the senior project management personnel to check on the logistics, quality and progress of work. Data Capture and Processing The survey methodology used a technique of optical character reading that permitted fast processing of data and timely release of results. High-speed scanners and a software known as Teleform were used to automate the entire process of questionnaire design, collection, evaluation, validating and storage of the data. Scanning of the CWIQ field returns extended beyond the planned 12-week duration due to, the following reasons: - The two industrial scanners that had been rehabilitated for the CWIQ data capture could not be utilized due to initial difficulties experienced in calibrating the equipment. As a result, the entire scanning of the field returns had to rely on two desktop high speed scanners that had been used for the CWIQ training workshops. However, the performance of one of the scanners reduced drastically as a result of excessive workload of approximately 12 hours of scanning each day. It had to be removed from the scanning operations after the 12th week and having to rely on one scanner for the rest of the data capture. Finally data capture and processing was completed by the end of June 2003 and a clean CWIQ data set was ready for tabulation and analysis. 13
18 The data capture and processing of the CWIQ survey data used the following software: - (a) Teleform Automated data capture system with three modules DESIGNER: This is used in designing the CWIQ questionnaire as well as setting export routines. For converting the questionnaires to electronic images and subsequently evaluating the images. The data evaluated okay are subsequently sent to the target database or system for further processing. VERIFIER: Used to manually correct or confirm characters or digits that the reader could not interpret or recognized. It was also used to commit batches that have been evaluated as okay. (b) Microsoft Access CWIQ has three databases all designed in Microsoft Access: CWIQTem.mdb - Temporarily stores the data once it is exported from Teleform. RawData.mdb - Used as a work database where the data is cleaned or validated. Data.mdb - The main database used to generate tables. (c) Microsoft Excel Used to prepare the final output tables for the CWIQ report. (d) CWIQ Application The main programme used for data processing. It was developed in Microsoft Access with Visual Basic applications. The CWIQ application has three phases: - Conversion/transfer of Teleform data to the temporary database. Data validation and error correction. Tabulation The questionnaires were processed in batches with questionnaires from each Enumeration Area (EA) being considered as a single batch. This made it easier to manage the image and also allow the operator to capture all the necessary information about an EA. Editing took three different forms:- Manual editing was carried out to ensure that the reference number which was composed of the EA number, Household number and Questionnaire number, was correct and that it was printed out on all pages on the set of questionnaire. On-line editing with Teleform application. Mandatory fields that the scanner could not read or accept were held on the screen for verification and correction by the data capture assistant. Automatic correction was done for some selected fields by the CWIQ application based on some validation rules within the system. 14
19 Table 1.1 Sample Size for the Liberia Core Welfare Indicator Questionnaire (CWIQ) Survey 2010 No. of Clusters No. of Households Number of Respondents Urban Rural Total Urban Rural Total Urban Rural Total LIBERIA ,901 3,089 5,990 14,862 15,920 30,782 Greater Monrovia , ,962 North Central ,082 2,475 3,223 5,698 Bong ,357 2,039 Lofa ,730 Nimba ,929 North Western ,027 1,758 3,173 4,931 Bomi ,205 1,824 Grand Cape Mount ,088 1,862 Gharpolu ,245 South Central ,103 2,500 3,059 5,559 Grand Bassa ,367 Margribi ,090 1,812 Montserrado ,153 1,227 2,380 South Eastern A ,080 2,675 2,932 5,607 Grand Gedeh , ,959 Rivercess ,344 1,552 Sinoe ,087 1,009 2,096 South Eastern B ,086 2,492 3,533 6,025 Grand Kru ,242 1,922 Maryland , ,017 River Gee ,427 2,086 15
20 Table 2.1 Percentage Distribution of Population by Sex Male Female N N Percent N Percent Sex ratio (males to females) LIBERIA 3,693,135 1,819, ,873, Rural 2,005,021 1,003, ,001, Urban 1,688, , , Greater Monrovia 1,005, , , North Central 1,127, , , Bong 378, , , Lofa 284, , , Nimba 464, , , North Western 323, , , Bomi 105,550 54, , Grand Cape Mount 129,275 64, , Gharpolu 88,395 47, , South Central 652, , , Grand Bassa 238, , , Margribi 225, , , Montserrado 187,686 91, , South Eastern A 310, , , Grand Gedeh 126,332 65, , Rivercess 77,298 39, , Sinoe 106,744 52, , South Eastern B 274, , , Grand Kru 60,018 30, , Maryland 137,217 68, , River Gee 76,780 40, , Table 2.2 Percentage Distribution of Households by Household Composition (size) N persons persons persons persons Mean Household Size LIBERIA 741, Rural 402, Urban 339, Greater Monrovia 208, North Central 219, Bong 70, Lofa 60, Nimba 89, North Western 68, Bomi 21, Grand Cape Mount 25, Gharpolu 21, South Central 134, Grand Bassa 55, Margribi 46, Montserrado 32, South Eastern A 60, Grand Gedeh 27, Rivercess 15, Sinoe 18, South Eastern B 50, Grand Kru 9, Maryland 27, River Gee 13,
21 Table 2.3 Percentage Distribution of Population Structure by Broad Age-groups 0-14 years years 65+ years N Percent N Percent N Percent LIBERIA 3,693,916 1,568, ,013, , Rural 2,004, , ,050, , Urban 1,689, , , , Greater Monrovia 1,005, , , , North Central 1,128, , , , Bong 379, , , , Lofa 284, , , , Nimba 464, , , , North Western 323, , , , Bomi 105,515 49, , , Grand Cape Mount 129,166 54, , , Gharpolu 88,542 36, , , South Central 652, , , , Grand Bassa 239, , , , Margribi 226, , , , Montserrado 187,432 85, , , South Eastern A 310, , , , Grand Gedeh 126,163 56, , , Rivercess 77,243 37, , , Sinoe 106,713 51, , , South Eastern B 273, , , , Grand Kru 59,885 26, , , Maryland 137,281 60, , , River Gee 76,715 35, , , members did not specify age. N Table 2.4 Percentage Distribuition of Household Members Relationship to Head Agedependency ratio N Head Spouse Child Parent Sibling Other relative Not related LIBERIA 3,684, Rural 2,000, Urban 1,684, Greater Monrovia 1,002, North Central 1,124, Bong 378, Lofa 281, Nimba 463, North Western 322, Bomi 105, Grand Cape Mount 129, Gharpolu 88, South Central 652, Grand Bassa 239, Margribi 225, Montserrado 187, South Eastern A 309, Grand Gedeh 126, Rivercess 76, Sinoe 106, South Eastern B 273, Grand Kru 59, Maryland 137, River Gee 76,
22 Table 2.5 Percentage Distribution of Population by Sex, Broad Age-groups and Area of Residence Male Female N N Percent N Percent LIBERIA Total 3,690,936 1,818, ,872, Less than 4 years 568, , , years 534, , , years 463, , , years 368, , , years 310, , , years 281, , , years 252, , , years 234, , , years 190,484 92, , years 149,088 84, , years 100,437 57, , years 74,734 39, , years 49,926 25, , years and over 111,542 62, , RURAL Total 2,003,546 1,002, ,000, Less than 4 years 339, , , years 303, , , years 242, , , years 185,212 94, , years 153,161 70, , years 149,434 62, , years 126,104 56, , years 125,877 55, , years 100,731 48, , years 85,629 48, , years 53,247 30, , years 39,314 21, , years 31,229 15, , years and over 67,522 38, , URBAN Total 1,687, , , Less than 4 years 228, , , years 230, , , years 220, , , years 183,452 84, , years 157,484 74, , years 132,293 59, , years 126,122 57, , years 108,910 52, , years 89,753 44, , years 63,459 36, , years 47,190 27, , years 35,421 18, , years 18,697 10, , years and over 44,020 24, , members did not specify age. 18
23 Table 2.6 Percentage Distribution of Population (population pyramid) by Sex, Broad Age-groups and Area of Residence Total Male Female N Percent N Percent N Percent LIBERIA Total 3,690, ,818, ,872, Less than 4 years 568, , , years 534, , , years 463, , , years 368, , , years 310, , , years 281, , , years 252, , , years 234, , , years 190, , , years 149, , , years 100, , , years 74, , , years 49, , , years and over 111, , , RURAL Total 2,003, ,002, ,000, Less than 4 years 339, , , years 303, , , years 242, , , years 185, , , years 153, , , years 149, , , years 126, , , years 125, , , years 100, , , years 85, , , years 53, , , years 39, , , years 31, , , years and over 67, , , URBAN Total 1,687, , , Less than 4 228, , , years 230, , , years 220, , , years 183, , , years 157, , , years 132, , , years 126, , , years 108, , , years 89, , , years 63, , , years 47, , , years 35, , , years 18, , , years and over 44, , , members did not specify age. 19
24 Table 2.7 Percentage Distribution of Population (10+ years) by Marital Status Married N Never married monogamous Married polygamous Living together Divorced/ separated Widowed LIBERIA 2,559, Rural 1,345, Urban 1,214, Greater Monrovia 750, North Central 761, Bong 246, Lofa 195, Nimba 319, North Western 216, Bomi 68, Grand Cape Mount 87, Gharpolu 60, South Central 444, Grand Bassa 162, Margribi 157, Montserrado 124, South Eastern A 201, Grand Gedeh 83, Rivercess 47, Sinoe 70, South Eastern B 184, Grand Kru 39, Maryland 94, River Gee 50, Table 2.8 Percentage Distribution of Children (0-17 years) by Orphaned and Father Living at Home Father alive Father living in household N Yes No Don't know N Yes No LIBERIA 1,771, ,659, Rural 984, , Urban 787, , Greater Monrovia 449, , North Central 536, , Bong 179, , Lofa 129, , Nimba 227, , North Western 153, , Bomi 54, , Grand Cape Mount 59, , Gharpolu 39, , South Central 330, , Grand Bassa 118, , Margribi 115, , Montserrado 96, , South Eastern A 160, , Grand Gedeh 62, , Rivercess 40, , Sinoe 57, , South Eastern B 141, , Grand Kru 30, , Maryland 70, , River Gee 40, ,
25 Table 2.9 Percentage Distribution of Children (0-17 years) by Orphaned and Mother Living at Home Mother alive Mother living in household N Yes No Don't know N Yes No LIBERIA 1,753, ,693, Rural 975, , Urban 777, , Greater Monrovia 444, , North Central 528, , Bong 177, , Lofa 127, , Nimba 223, , North Western 151, , Bomi 54, , Grand Cape Mount 60, , Gharpolu 37, , South Central 327, , Grand Bassa 116, , Margribi 115, , Montserrado 96, , South Eastern A 159, , Grand Gedeh 62, , Rivercess 39, , Sinoe 57, , South Eastern B 141, , Grand Kru 30, , Maryland 70, , River Gee 40, , Table 2.10 Percentage Distribution of Children (0-17 years) by Orphanedhood Father dead Mother dead Parents living or dead N Yes N Yes N Both living Both dead Either dead LIBERIA 1,771, ,753, ,749, Rural 984, , , Urban 787, , , Greater Monrovia 449, , , North Central 536, , , Bong 179, , , Lofa 129, , , Nimba 227, , , North Western 153, , , Bomi 54, , , Grand Cape Mount 59, , , Gharpolu 39, , , South Central 330, , , Grand Bassa 118, , , Margribi 115, , , Montserrado 96, , , South Eastern A 160, , , Grand Gedeh 62, , , Rivercess 40, , , Sinoe 57, , , South Eastern B 141, , , Grand Kru 30, , , Maryland 70, , , River Gee 40, , ,
Who has trouble reporting prior day events?
 Vol. 10, Issue 1, 2017 Who has trouble reporting prior day events? Tim Triplett 1, Rob Santos 2, Brian Tefft 3 Survey Practice 10.29115/SP-2017-0003 Jan 01, 2017 Tags: missing data, recall data, measurement
Passenger seat belt use in Durham Region
 Facts on Passenger seat belt use in Durham Region June 2017 Highlights In 2013/2014, 85 per cent of Durham Region residents 12 and older always wore their seat belt when riding as a passenger in a car,
American Driving Survey,
 RESEARCH BRIEF American Driving Survey, 2015 2016 This Research Brief provides highlights from the AAA Foundation for Traffic Safety s 2016 American Driving Survey, which quantifies the daily driving patterns
GREENE COUNTY SCHOOLS ENROLLMENT PROJECTIONS REPORT APRIL 12, 2017
 APRIL 12, 2017 PREPARED FOR: Greene County Schools 910 West Summer Street Greeneville, TN 37743 T 423-639-4194 PREPARED BY: Cooperative Strategies 3325 Hilliard Rome Road Hilliard, OH 43026 T 614.798.8828
Missouri Seat Belt Usage Survey for 2017
 Missouri Seat Belt Usage Survey for 2017 Conducted for the Highway Safety & Traffic Division of the Missouri Department of Transportation by The Missouri Safety Center University of Central Missouri Final
WORTHINGTON SCHOOLS ENROLLMENT PROJECTIONS REPORT JANUARY 25, 2019
 JANUARY 25, 2019 PREPARED FOR: Worthington Schools 200 E. Wilson Bridge Rd. Worthington, OH 43085 T 614.450.6000 PREPARED BY: Cooperative Strategies 3325 Hilliard Rome Road Hilliard, OH 43026 T 614.798.8828
Total Surface Area DEVELOPING MEMBER ECONOMY. ( 000 km 2 ) (million) (%)
 (million) (%)") BASIC 2016 STATISTICS Economic Research and Regional Cooperation Department Development Economics and Indicators Division Land Population National Accounts Prices Money Balance of Payments Reserves External
BASIC 2016 STATISTICS Economic Research and Regional Cooperation Department Development Economics and Indicators Division Land Population National Accounts Prices Money Balance of Payments Reserves External
Total Surface Area DEVELOPING MEMBER ECONOMY. ( 000 km 2 ) (million) (%)
 (million) (%)") Land Population Millennium Development Goals National Accounts Prices Money Balance of Payments Reserves External Debt Central Government Finance BASIC STATISTICS 2015 Economic Research and Regional Cooperation
Land Population Millennium Development Goals National Accounts Prices Money Balance of Payments Reserves External Debt Central Government Finance BASIC STATISTICS 2015 Economic Research and Regional Cooperation
Liberia Ebola SitRep no Ministry of Health and Social Welfare Oct. 18th 2014
 Liberia Ebola SitRep no. 156 Ministry of Health and Social Welfare Oct. 18th 2014 National Bomi County Bong County Gbarpolu County Grand Bassa Grand Gedeh Grand Kru Lofa County Margibi County Maryland
Certificate in a vocational program
 N 3,328 5,148 2,928 3,219 3,546 2,004 3,730 3,982 2,327 30,212 GOALS AND PLANS 2. What is your educational goal at this college? High school diploma or GED 1.9 1.3 2.2 1.4 2.2 2.2 1.9 2.0 1.7 1.8 Certificate
WORTHINGTON SCHOOLS ENROLLMENT PROJECTIONS REPORT FEBRUARY 14, 2018
 FEBRUARY 14, 2018 PREPARED FOR: Worthington Schools 200 E. Wilson Bridge Rd. Worthington, OH 43085 T 614.450.6000 PREPARED BY: Cooperative Strategies 3325 Hilliard Rome Road Hilliard, OH 43026 T 614.798.8828
Liberia Ebola SitRep no Ministry of Health and Social Welfare Oct. 4th, 2014
 Liberia Ebola SitRep no. 142 Ministry of Health and Social Welfare Oct. 4th, 2014 National Bomi County Bong County Gbarpolu County Grand Bassa Grand Cape Mount Grand Gedeh Grand Kru Lofa County Margibi
DEVELOPMENT AND IMPLEMENTING URBAN HEALTH EQUITY INDICATORS IN TEHRAN URBAN HEART- TEHRAN. On behalf of Urban- HEART Team Tehran
 DEVELOPMENT AND IMPLEMENTING URBAN HEALTH EQUITY INDICATORS IN TEHRAN URBAN HEART- TEHRAN On behalf of Urban- HEART Team Tehran CAPACITY BUILDING WORKSHOP ON HEALTH SYSTEM DEVELOPMENT What is Urban HEART
DRAFT. Enrollment Projections Report. November 25, 2015
 November 25, 2015 3325 Hilliard Rome Road Hilliard, Ohio 43026 P: 614.798.8828 f: 614.798.8839 www.dejongrichter.com Table of Contents Acknowledgements... 1 Executive Summary... 3 Enrollment Projection
Total Surface Area DEVELOPING MEMBER COUNTRY (DMC) ( 000 sq. km) (Mn) (%)
 ( 000 sq. km) (Mn) (%)") Economics and Research Department Development Indicators and Policy Research Division Basic Statistics 2011 Millennium Development Goals Land Population National Accounts Prices Money Balance of Payments
Economics and Research Department Development Indicators and Policy Research Division Basic Statistics 2011 Millennium Development Goals Land Population National Accounts Prices Money Balance of Payments
NON-FATAL ELECTRICAL INJURIES AT WORK
 NON-FATAL ELECTRICAL INJURIES AT WORK Richard Campbell May 2018 Copyright 2018 National Fire Protection Association (NFPA) CONTENTS Findings and Trends 1 Key Takeaways 2 Background on Data Sources and
MIG DATA FILE. Table 1: Respondent Information by Community Community Number
 MIG DATA FILE Table 1: Respondent Information by Community Community Number 1 2 3 4 5 6 7 Observations 36 13 22 19 38 24 16 168 Observations 21.4 7.7 13.1 11.3 22.6 14.3 9.5 100.0 Place of Survey Home
Statistics South Africa CENSUS Census in brief
 Statistics South Africa CENSUS 2001 Census in brief General information Statistics South Africa Private Bag X44 Pretoria 0001 South Africa 170 Andries Street Pretoria 0002 User information service: (012)
EXPERIENCE IN A COMPANY-WIDE LONG DISTANCE CARPOOL PROGRAM IN SOUTH KOREA
 EXPERIENCE IN A COMPANY-WIDE LONG DISTANCE CARPOOL PROGRAM IN SOUTH KOREA JB s Social Club Presented at TRB 94th Annual Meeting on Jan 12, 2015 Louis Berger Kyeongsu Kim Land & Housing Institute (LHI)
Evaluating Stakeholder Engagement
 Evaluating Stakeholder Engagement Peace River October 17, 2014 Stakeholder Engagement: The Panel recognizes that although significant stakeholder engagement initiatives have occurred, these efforts were
Unemployment Rates August 2010
 September 3, 2010 DATA BRIEF: Black Employment and Unemployment in August 2010 by Sylvia Allegretto, Ary Amerikaner, and Steven Pitts The unemployment rate for Blacks was 16.3% last month. This is according
Annual Report on National Accounts for 2015 (Benchmark Year Revision of 2011) Summary (Flow Accounts)
 Summary (Flow Accounts)") Annual Report on National Accounts for 2015 (Benchmark Year Revision of 2011) Summary (Flow Accounts) I. Overview of Benchmark Year Revision of 2011 P 2 II. Expenditure Series P 3 III. Income Series P
Annual Report on National Accounts for 2015 (Benchmark Year Revision of 2011) Summary (Flow Accounts) I. Overview of Benchmark Year Revision of 2011 P 2 II. Expenditure Series P 3 III. Income Series P
An Evaluation on the Compliance to Safety Helmet Usage among Motorcyclists in Batu Pahat, Johor
 An Evaluation on the Compliance to Safety Helmet Usage among Motorcyclists in Batu Pahat, Johor K. Ambak 1, *, H. Hashim 2, I. Yusoff 3 and B. David 4 1,2,3,4 Faculty of Civil and Environmental Engineering,
Gross Domestic Product: Third Quarter 2016 (Advance Estimate)
") EMBARGOED UNTIL RELEASE AT 8:30 A.M. EDT, FRIDAY, OCTOBER 28, 2016 BEA 16-57 Technical: Lisa Mataloni (GDP) (301) 278-9083 gdpniwd@bea.gov Media: Jeannine Aversa (301) 278-9003 Jeannine.Aversa@bea.gov
EMBARGOED UNTIL RELEASE AT 8:30 A.M. EDT, FRIDAY, OCTOBER 28, 2016 BEA 16-57 Technical: Lisa Mataloni (GDP) (301) 278-9083 gdpniwd@bea.gov Media: Jeannine Aversa (301) 278-9003 Jeannine.Aversa@bea.gov
National Household Travel Survey Add-On Use in the Des Moines, Iowa, Metropolitan Area
 National Household Travel Survey Add-On Use in the Des Moines, Iowa, Metropolitan Area Presentation to the Transportation Research Board s National Household Travel Survey Conference: Data for Understanding
More persons in the cars? Status and potential for change in car occupancy rates in Norway
 Author(s): Liva Vågane Oslo 2009, 57 pages Norwegian language Summary: More persons in the cars? Status and potential for change in car occupancy rates in Norway Results from national travel surveys in
Multi-Tier Framework Survey Kenya
 Ministry of Energy & Petroleum, Kenya Multi-Tier Framework Survey Kenya Preliminary Results for 14 underserved counties in Kenya May 9, 2017 1 Part 1 Overview of the Approach 2 Introduction: Profile of
Rural Energy Access: Promoting Solar Home Systems In Rural Areas In Zambia A Case Study. O.S. Kalumiana
 Rural Energy Access: Promoting Solar Home Systems In Rural Areas In Zambia A Case Study O.S. Kalumiana Department of Energy, Ministry of Energy & Water Development, P.O. Box 51254, Lusaka ZAMBIA; Tel:
Abstract. 1. Introduction. 1.1 object. Road safety data: collection and analysis for target setting and monitoring performances and progress
 Road Traffic Accident Involvement Rate by Accident and Violation Records: New Methodology for Driver Education Based on Integrated Road Traffic Accident Database Yasushi Nishida National Research Institute
Parking Management Element
 Parking Management Element The State Transportation Planning Rule, adopted in 1991, requires that the Metropolitan Planning Organization (MPO) area implement, through its member jurisdictions, a parking
STATISTICS. Economic Research and Regional Cooperation Department. Core Indicators. Development Economics and Indicators Division
 Total Average Annual Growth Proportion of below $1.90 Purchasing Power Parity (PPP) a Day CORE INDICATORS Proportion of Living below the National Poverty Line Annual Growth Per Capita of Gross Gross National
BENCHMARKING URBAN TRANSPORT-A STRATEGY TO FULFIL COMMUTER ASPIRATION
 BENCHMARKING URBAN TRANSPORT-A STRATEGY TO FULFIL COMMUTER ASPIRATION Rahul Tiwari Senior City Transport Officer Directorate, Urban Administration and Development Bhopal & PhD Scholar (+91) 98930 44012
Gross Domestic Product: First Quarter 2017 (Advance Estimate)
") EMBARGOED UNTIL RELEASE AT 8:30 A.M. EDT, FRIDAY, APRIL 28, 2017 BEA 17-19 Technical: Lisa Mataloni (301) 278-9083 gdpniwd@bea.gov Media: Jeannine Aversa (301) 278-9003 Jeannine.Aversa@bea.gov Gross Domestic
EMBARGOED UNTIL RELEASE AT 8:30 A.M. EDT, FRIDAY, APRIL 28, 2017 BEA 17-19 Technical: Lisa Mataloni (301) 278-9083 gdpniwd@bea.gov Media: Jeannine Aversa (301) 278-9003 Jeannine.Aversa@bea.gov Gross Domestic
Gross Domestic Product: Second Quarter 2016 (Second Estimate) Corporate Profits: Second Quarter 2016 (Preliminary Estimate)
 Corporate Profits: Second Quarter 2016 (Preliminary Estimate)") EMBARGOED UNTIL RELEASE AT 8:30 A.M. EDT, FRIDAY, AUGUST 26, 2016 BEA 16-44 Technical: Lisa Mataloni (GDP) (301) 278-9080 gdpniwd@bea.gov Kate Pinard (Corporate Profits) (301) 278-9417 cpniwd@bea.gov Media:
EMBARGOED UNTIL RELEASE AT 8:30 A.M. EDT, FRIDAY, AUGUST 26, 2016 BEA 16-44 Technical: Lisa Mataloni (GDP) (301) 278-9080 gdpniwd@bea.gov Kate Pinard (Corporate Profits) (301) 278-9417 cpniwd@bea.gov Media:
FALL 2007 MBA EXIT SURVEY (Sample size of 29: 15 responses from the San Marcos location and 14 responses from the RRHEC location)
") FALL 2007 MBA EXIT SURVEY (Sample size of 29: 15 responses from the San Marcos location and 14 responses from the RRHEC location) EVALUATION OF MBA CURRICULUM Scale items: 1 = Very Satisfied 6 = Very Dissatisfied
FALL 2007 MBA EXIT SURVEY (Sample size of 29: 15 responses from the San Marcos location and 14 responses from the RRHEC location) EVALUATION OF MBA CURRICULUM Scale items: 1 = Very Satisfied 6 = Very Dissatisfied
HARMONIZED NIGERIA LIVING STANDARD SURVEY 2009/10: CORE WELFARE INDICATORS
 HARMONIZED NIGERIA LIVING STANDARD SURVEY 2009/10: CORE WELFARE INDICATORS Table of Contents 1 The Harmonized Nigeria Living Standard Survey 2009/10... 3 1.1 Survey History & Background... 3 1.2 Methodology...
Unemployment Rates - November 2011
 December 2, 2011 DATA BRIEF: Black Employment and Unemployment in November 2011 The unemployment rate for Blacks was 15.5% last month. This is according to the latest report on the nation s employment
Gross Domestic Product: Third Quarter 2016 (Third Estimate) Corporate Profits: Third Quarter 2016 (Revised Estimate)
 Corporate Profits: Third Quarter 2016 (Revised Estimate)") EMBARGOED UNTIL RELEASE AT 8:30 A.M. EST, THURSDAY, DECEMBER 22, 2016 BEA 16-71 Technical: Lisa Mataloni (GDP) (301) 278-9083 gdpniwd@bea.gov Kate Pinard (Corporate Profits) (301) 278-9417 cpniwd@bea.gov
EMBARGOED UNTIL RELEASE AT 8:30 A.M. EST, THURSDAY, DECEMBER 22, 2016 BEA 16-71 Technical: Lisa Mataloni (GDP) (301) 278-9083 gdpniwd@bea.gov Kate Pinard (Corporate Profits) (301) 278-9417 cpniwd@bea.gov
[Report Title] [Report Tag Line]
![[Report Title] [Report Tag Line]](/thumbs/90/104316182.jpg "[Report Title] [Report Tag Line]") [Report Title] [Report Tag Line] TTS 6 REGIONAL MUNICIPALITY OF PEEL SUMMARY BY WARD MARCH 8 Bess Ashby, Research Director 5 Yonge St. Toronto, ON M5B E7 Phone: (6) 6-6 ext. E-mail: b.ashby@malatest.com
[Report Title] [Report Tag Line] TTS 6 REGIONAL MUNICIPALITY OF PEEL SUMMARY BY WARD MARCH 8 Bess Ashby, Research Director 5 Yonge St. Toronto, ON M5B E7 Phone: (6) 6-6 ext. E-mail: b.ashby@malatest.com
BENCHMARK SURVEY 2013
 AUSTRALIAN CAR WASH INDUSTRY BENCHMARK SURVEY 2013 This survey was undertaken in response to many requests for information about the car wash industry in Australia both the current position and the trends
SOCIO-ECONOMIC and LAND USE DATA
 SOCIO-ECONOMIC and LAND USE DATA FUTURE CONDITIONS January CHATHAM URBAN TRANSPORTATION STUDY - 1 - Table of Contents Introduction 3 TAZ - Municipality - Map Index...8 2005 Socio-economic and Land Use
2009 Community College of Student Engagement (CCSSE) College Results: Frequency Distributions
 College Results: Frequency Distributions") 2009 Community College of Student Engagement (CCSSE) College Results: Frequency Distributions Institutional Research & Effectiveness Frequency Distributions This report summarizes the observed frequencies
2009 Community College of Student Engagement (CCSSE) College Results: Frequency Distributions Institutional Research & Effectiveness Frequency Distributions This report summarizes the observed frequencies
GfK. Growth from Knowledge
 GfK. Growth from Knowledge Passenger Focus Bus Passenger Customer Satisfaction Survey Fieldwork Quality Report Quarter 3 2010 437957 / August 2010 v1 Prepared for: Prepared by: Contacts: Passenger Focus
Unemployment Rates January 2011
 February 4, 2011 DATA BRIEF: Black Employment and Unemployment in January 2011 by Sylvia Allegretto, Ary Amerikaner, and Steven Pitts The unemployment rate for Blacks was 15.7% last month. This is according
HOTELS AND RESTAURANTS REPONS REPONS RETRIE- VED E RATE E RATE EXPEC- TED NO. NO. NO.
 ZONE SOUTH EAST SOUTH SOUTH SOUTH WEST NORTH CENTRAL NORTH EAST APPENDIX I STATISTICAL TABLES Table 1.6 2009 NBS/CBN/NCC COLLABORATIVE SURVEY ON SOCIO-ECONOMIC ACTIVITIES IN NIGERIA STATUS RETURNS ON ECONOMIC
Transportation Demand Management Element
 Transportation Demand Management Element Over the years, our reliance on the private automobile as our primary mode of transportation has grown substantially. Our dependence on the automobile is evidenced
Gross Domestic Product: First Quarter 2018 (Third Estimate) Corporate Profits: First Quarter 2018 (Revised Estimate)
 Corporate Profits: First Quarter 2018 (Revised Estimate)") EMBARGOED UNTIL RELEASE AT 8:30 A.M. EDT, THURSDAY, JUNE 28, 2018 BEA 18-31 Technical: Lisa Mataloni (GDP) (301) 278-9083 gdpniwd@bea.gov Kate Pinard (Corporate Profits) (301) 278-9417 cpniwd@bea.gov Media:
EMBARGOED UNTIL RELEASE AT 8:30 A.M. EDT, THURSDAY, JUNE 28, 2018 BEA 18-31 Technical: Lisa Mataloni (GDP) (301) 278-9083 gdpniwd@bea.gov Kate Pinard (Corporate Profits) (301) 278-9417 cpniwd@bea.gov Media:
Recharge Kick-off Meeting Recharge Activity Review Process for
 Recharge Kick-off Meeting Debra Fry Executive Director, Operating Budget and Recharge Review Gabriella Hato Manager, Recharge Review Sarah Hislen Analyst, Recharge Review Charet Wynn Analyst, Recharge
Ambient PM 10 Monitoring Sechelt, B.C Update
 Ministry of Environment LOWER MAINLAND REGION Ambient PM 10 Monitoring Sechelt, B.C. 2004-2005 Update E N V I R O N M E N T A L Q U A L I T Y Library and Archives Canada Cataloguing in Publication Data
Gross Domestic Product: Fourth Quarter and Annual 2016 (Second Estimate)
") EMBARGOED UNTIL RELEASE AT 8:30 A.M. EST, TUESDAY, FEBRUARY 28, 2017 BEA 17-07 Technical: Lisa Mataloni (GDP) (301) 278-9083 gdpniwd@bea.gov Media: Jeannine Aversa (301) 278-9003 Jeannine.Aversa@bea.gov
EMBARGOED UNTIL RELEASE AT 8:30 A.M. EST, TUESDAY, FEBRUARY 28, 2017 BEA 17-07 Technical: Lisa Mataloni (GDP) (301) 278-9083 gdpniwd@bea.gov Media: Jeannine Aversa (301) 278-9003 Jeannine.Aversa@bea.gov
Real GDP: Percent change from preceding quarter
 EMBARGOED UNTIL RELEASE AT 8:30 A.M. EDT, THURSDAY, SEPTEMBER 28, 2017 BEA 17-51 Technical: Lisa Mataloni (GDP) (301) 278-9083 gdpniwd@bea.gov Kate Pinard (Corporate Profits) (301) 278-9417 cpniwd@bea.gov
September 2014 Data Release
 September 214 Data Release Fannie Mae s consumer attitudinal survey polls the adult U.S. general population to assess their attitudes about homeownership, renting a home, the economy, and household finances.
STUDENT TRANSPORTATION
 Page 1 of 6 Operational Procedure 380 Background STUDENT TRANSPORTATION Although the transportation of students is no longer a requirement of the School Act, School District 72 provides an efficient and
Motorcoach Census. A Study of the Size and Activity of the Motorcoach Industry in the United States and Canada in 2015
 Motorcoach Census A Study of the Size and Activity of the Motorcoach Industry in the United States and Canada in 2015 Prepared for the American Bus Association Foundation by John Dunham & Associates October
Car Sharing at a. with great results.
 Car Sharing at a Denver tweaks its parking system with great results. By Robert Ferrin L aunched earlier this year, Denver s car sharing program is a fee-based service that provides a shared vehicle fleet
Global Status Report on Road Safety: Respondents' Questionnaire
 Global Status Report on Road Safety: Respondents' Questionnaire Country: Respondent's Information Name: Position: Institution: Email: Telephone: Fax: National Data Coordinator Name: Position: Institution:
Summary findings. 1 Missouri has a greater population than any State ranked 1-9 in core group labor force participation.
 Labor in Missouri MSCDC Economic Report Series No. 9903 December 2000 By Professor John O. Ward, Chairman, UMKC Department of Economics Kurt V. Krueger, Department of Economics Graduate Student Michael
Transportation Statistical Data Development Report BAY COUNTY 2035 LONG RANGE TRANSPORTATION PLAN
 Transportation Statistical Data Development Report BAY COUNTY 2035 LONG RANGE TRANSPORTATION PLAN Prepared for Bay County Transportation Planning Organization and The Florida Department of Transportation,
TRANSIT DEMAND IN RURAL DOUGLAS COUNTY: PRELIMINARY BACKGROUND DATA
 TRANSIT DEMAND IN RURAL DOUGLAS COUNTY: PRELIMINARY BACKGROUND DATA Lawrence-Douglas County MPO Regional Transit Advisory Committee Lawrence, Kans. Tuesday October 31, 2017 Chris Zeilinger Assistant Director
EMBARGOED UNTIL RELEASE AT 8:30 A.M. EST, WEDNESDAY, JANUARY 30, 2013 GROSS DOMESTIC PRODUCT: FOURTH QUARTER AND ANNUAL 2012 (ADVANCE ESTIMATE)
") NEWS RELEASE EMBARGOED UNTIL RELEASE AT 8:30 A.M. EST, WEDNESDAY, JANUARY 30, 2013 Lisa Mataloni: (202) 606-5304 (GDP) gdpniwd@bea.gov Recorded message: (202) 606-5306 BEA 13-02 GROSS DOMESTIC PRODUCT:
NEWS RELEASE EMBARGOED UNTIL RELEASE AT 8:30 A.M. EST, WEDNESDAY, JANUARY 30, 2013 Lisa Mataloni: (202) 606-5304 (GDP) gdpniwd@bea.gov Recorded message: (202) 606-5306 BEA 13-02 GROSS DOMESTIC PRODUCT:
Analysis of Road Crash Statistics Western Australia 1990 to Report. December Project: Transport/21
 Analysis of Road Crash Statistics Western Australia 1990 to 1999 Report December 2000 Project: Transport/21 Analysis of Road Crash Statistics Western Australia 1990 to 1999 December 2000 Client: Transport
Real GDP: Percent change from preceding quarter
 EMBARGOED UNTIL RELEASE AT 8:30 A.M. EST, WEDNESDAY, FEBRUARY 28, 2018 BEA 18-08 Technical: Lisa Mataloni (GDP) (301) 278-9083 gdpniwd@bea.gov Media: Jeannine Aversa (301) 278-9003 Jeannine.Aversa@bea.gov
2018 Linking Study: Predicting Performance on the Performance Evaluation for Alaska s Schools (PEAKS) based on MAP Growth Scores
 based on MAP Growth Scores") 2018 Linking Study: Predicting Performance on the Performance Evaluation for Alaska s Schools (PEAKS) based on MAP Growth Scores June 2018 NWEA Psychometric Solutions 2018 NWEA. MAP Growth is a registered
2018 Linking Study: Predicting Performance on the Performance Evaluation for Alaska s Schools (PEAKS) based on MAP Growth Scores June 2018 NWEA Psychometric Solutions 2018 NWEA. MAP Growth is a registered
Internal Audit Report. Fuel Consumption Oversight and Coordination TxDOT Internal Audit Division
 Internal Audit Report Fuel Consumption Oversight and Coordination TxDOT Internal Audit Division Objective To determine if a process exists to ensure retail fuel consumption is appropriately managed and
FAMU Completers Satisfaction Survey Results 2010
 FAMU Completers Satisfaction Survey Results 2010 Non-Member record_type Frequency Percent Percent Cumulative Percent 35 100.0 100.0 100.0 Race: Frequency Percent Percent Cumulative Percent Black 30 85.7
2018 AER Social Research Report
 2018 AER Social Research Report Executive Summary June 2018 2018 AER Social Research Report Executive Summary June 2018 Published by Alberta Energy Regulator Suite 1000, 250 5 Street SW Calgary, Alberta
BUILDING A ROBUST INDUSTRY INDEX BASED ON LONGITUDINAL DATA
 CASE STUDY BUILDING A ROBUST INDUSTRY INDEX BASED ON LONGITUDINAL DATA Hanover built a first of its kind index to diagnose the health, trends, and hidden opportunities for the fastgrowing auto care industry.
The 1997 U.S. Residential Energy Consumption Survey s Editing Experience Using BLAISE III
 The 997 U.S. Residential Energy Consumption Survey s Editing Experience Using BLAISE III Joelle Davis and Nancy L. Leach, Energy Information Administration (USA) Introduction In 997, the Residential Energy
Characteristics of Minimum Wage Workers: Bureau of Labor Statistics U.S. Department of Labor
 Characteristics of Minimum Wage Workers: 2012 Bureau of Labor Statistics U.S. Department of Labor February 26, 2013 In 2012, 75.3 million in the United States age 16 and over were paid at, representing
2018 Linking Study: Predicting Performance on the NSCAS Summative ELA and Mathematics Assessments based on MAP Growth Scores
 2018 Linking Study: Predicting Performance on the NSCAS Summative ELA and Mathematics Assessments based on MAP Growth Scores November 2018 Revised December 19, 2018 NWEA Psychometric Solutions 2018 NWEA.
WHITE PAPER. Preventing Collisions and Reducing Fleet Costs While Using the Zendrive Dashboard
 WHITE PAPER Preventing Collisions and Reducing Fleet Costs While Using the Zendrive Dashboard August 2017 Introduction The term accident, even in a collision sense, often has the connotation of being an
Pupil Transportation. SOCSD Informational Session Presented by Ann Vaccaro Teich, Deputy Superintendent May 13, 2015
 Pupil Transportation SOCSD Informational Session Presented by Ann Vaccaro Teich, Deputy Superintendent May 13, 2015 The Board of Education affirms its goal of providing a safe, efficient, and economical
P0360 Rural Survey June Embargo: 11:00 Date: 17 June 1999
 P0360 Rural Survey June 1999 Embargo: 11:00 Date: 17 June 1999 Rural survey, 1997 Data and metadata set The data and metadata set from the 1997 Rural survey is available on CD-ROM at the following prices:
Black Employm ent an d Unemploymen t Decembe r 2013 Page 1
 January 10, 2014 DATA BRIEF: Black Employment and Unemployment in December 2013 The unemployment rate for Blacks was 11.9% last month. This is according to the latest report on the nation s employment
Teaching English to Foreigners: 2008
 15 June 2009 1100 hrs 106/2009 In 2008, 83,288 foreign students followed courses at local English-language specialised schools. This shows a decrease of 0.8 per cent over 2007. Teaching English to Foreigners:
RESIDENTIAL WASTE HAULING ASSESSMENT SERVICES. January 10, 2011 Presentation to Arvada City Council
 RESIDENTIAL WASTE HAULING ASSESSMENT SERVICES January 10, 2011 Presentation to Arvada City Council CONSULTANT TEAM LBA Associates MSW Consultants Denver based recycling and waste management consultant
NGAMi WEST sub DISTRICT
 NGAMi WEST sub DISTRICT POPULATION AND HOUSING CENsus 2011 SELECTED INDICATORS VOL 8.1 NGAMI WEST SUB DISTRICT Population and Housing Census 2011 Selected Indicators for s and Localities i Population and
RESEARCH ON ASSESSMENTS
 hmhco.com RESEARCH ON ASSESSMENTS HMH Reading Inventory: Estimated Average Annual Growth 3 4 Houghton Mifflin Harcourt (HMH) is committed to developing innovative educational programs and professional
Black Employm ent an d Unemploymen t July Page 1
 August 3, 2012 DATA BRIEF: Black Employment and Unemployment in July 2012 The unemployment rate for Blacks was 14.1% last month. This is according to the latest report on the nation s employment situation
Recommendations of the Expert Group on Preventing Motorcycle Injuries in Children
 Recommendations of the Expert Group on Preventing Motorcycle Injuries in Children All Member States in the WHO South-East Asia (SEA) Region are low- and middle-income countries. In the SEA Region, the
APPENDIX I LIST OF WARD-WISE HOUSEHOLD AND POPULATION IN MYSORE CITY CORPORATION, Page 213
 APPENDIX I LIST OF WARD-WISE HOUSEHOLD AND POPULATION IN MYSORE CITY CORPORATION, 2011 Page 213 Table: List of ward-wise household and population in Mysore City, 2011 Ward Number Households Population
Jurisdictional Guidelines for the Safe Testing and Deployment of Highly Automated Vehicles. Developed by the Autonomous Vehicles Working Group
 Jurisdictional Guidelines for the Safe Testing and Deployment of Highly Automated Vehicles Developed by the Autonomous Vehicles Working Group Background: The AVWG The Working Group established fall 2014
Category V. Criterion 5H: Hazardous Materials (Hazmat)
") Category V Criterion 5H: Hazardous Materials (Hazmat) The agency operates an adequate, effective, efficient, and safe hazardous materials program directed toward protecting the community from the hazards
Category V Criterion 5H: Hazardous Materials (Hazmat) The agency operates an adequate, effective, efficient, and safe hazardous materials program directed toward protecting the community from the hazards
EMBARGOED UNTIL RELEASE AT 8:30 A.M. EST, FRIDAY, JANUARY 30, 2015 GROSS DOMESTIC PRODUCT: FOURTH QUARTER AND ANNUAL 2014 (ADVANCE ESTIMATE)
") NEWS RELEASE EMBARGOED UNTIL RELEASE AT 8:30 A.M. EST, FRIDAY, JANUARY 30, 2015 Lisa Mataloni: (202) 606-5304 (GDP) gdpniwd@bea.gov Jeannine Aversa: (202) 606-2649 (News Media) BEA 15-04 GROSS DOMESTIC
NEWS RELEASE EMBARGOED UNTIL RELEASE AT 8:30 A.M. EST, FRIDAY, JANUARY 30, 2015 Lisa Mataloni: (202) 606-5304 (GDP) gdpniwd@bea.gov Jeannine Aversa: (202) 606-2649 (News Media) BEA 15-04 GROSS DOMESTIC
DIBELSnet System- Wide Percentile Ranks for. DIBELS Next. Elizabeth N Dewey, M.Sc. Ruth A. Kaminski, Ph.D. Roland H. Good, III, Ph.D.
 2011-2012 DIBELSnet System- Wide Ranks for Introduction DIBELS Next Elizabeth N Dewey, M.Sc. Ruth A. Kaminski, Ph.D. Roland H. Good, III, Ph.D. The following report presents the system- wide percentile
National Center for Statistics and Analysis Research and Development
 U.S. Department of Transportation National Highway Traffic Safety Administration DOT HS 809 271 June 2001 Technical Report Published By: National Center for Statistics and Analysis Research and Development
EMBARGOED UNTIL RELEASE AT 8:30 A.M. EST, WEDNESDAY, JANUARY 31, 2007 GROSS DOMESTIC PRODUCT: FOURTH QUARTER 2006 (ADVANCE)
") NEWS RELEASE EMBARGOED UNTIL RELEASE AT 8:30 A.M. EST, WEDNESDAY, JANUARY 31, 2007 Virginia H. Mannering: (202) 606-5304 BEA 07-02 Recorded message: (202) 606-5306 GROSS DOMESTIC PRODUCT: FOURTH QUARTER
NEWS RELEASE EMBARGOED UNTIL RELEASE AT 8:30 A.M. EST, WEDNESDAY, JANUARY 31, 2007 Virginia H. Mannering: (202) 606-5304 BEA 07-02 Recorded message: (202) 606-5306 GROSS DOMESTIC PRODUCT: FOURTH QUARTER
STATISTICAL TABLES RELATING TO INCOME, EMPLOYMENT, AND PRODUCTION
 A P P E N D I X B STATISTICAL TABLES RELATING TO INCOME, EMPLOYMENT, AND PRODUCTION C O N T E N T S NATIONAL INCOME OR EXPENDITURE Page B 1. Gross domestic product, 1960 2009... 328 B 2. Real gross domestic
The Value of Travel-Time: Estimates of the Hourly Value of Time for Vehicles in Oregon 2007
 The Value of Travel-Time: Estimates of the Hourly Value of Time for Vehicles in Oregon 2007 Oregon Department of Transportation Long Range Planning Unit June 2008 For questions contact: Denise Whitney
Capstone Design Project: Developing the Smart Arm Chair for Handicapped People
 Capstone Design Project: Developing the Smart Arm Chair for Handicapped People Kwang Sun Kim 1, Jun Young Kim 2, Kyung Min Jang 3 and Kang Wo Joo 4 1 School of Mechatronics Engineering, Korea University
SDT: KINGDOM OF TONGA NATIONAL ACCOUNTS STATISTICS
 SDT: 35-13 Statistics Department P.O. Box 149, Nuku alofa Government of Tonga Telephone: (676) 23-300 / 23-913 Email: dept@stats.gov.to Website: www.spc.int/prism/tonga/ Price: T$25.00 1 1 2 3 4 5 6 7
Black Employm ent an d Unemploymen t Au gust Page 1
 September 7, 2012 DATA BRIEF: Black Employment and Unemployment in August 2012 The unemployment rate for Blacks was 14.1% last month. This is according to the latest report on the nation s employment situation
The Adoption and Impact of Mobile Money in Kenya: Results from a Panel Survey
 The Adoption and Impact of Mobile Money in Kenya: Results from a Panel Survey William Jack Georgetown Tavneet Suri MIT Sloan November, 2010 Adoption of M PESA Household Survey 3,000 households Ethiopia
Gateshead Care Call. Gateshead Council, Regent Street Gateshead NE8 1HH Tel: How are we doing? April March 2013
 Gateshead Care Call Gateshead Council, Regent Street Gateshead NE8 1HH Tel: 0191 478 7666 Gateshead Care Call How are we doing? April 2012 - March 2013 October 2013 Contents Welcome Welcome 3 Care Call
Black Employm ent an d Unemploymen t Ap ril Page 1
 May 6, 2012 DATA BRIEF: Black Employment and Unemployment in April 2012 The unemployment rate for Blacks was 13.0% last month. This is according to the latest report on the nation s employment situation
Purpose of Presentation
 New Mexico Recycling & Solid Waste Conference Solid Waste Assessment & Management Study for Santa Fe Solid Waste Management Agency, City of Santa Fe and Santa Fe County September 24, 2014 Presented by:
2018 ESCAP population data sheet
 2018 ESCAP data sheet Population and Development Indicators for Asia and the, 2018 Region, subregion, country, territory or area Population at mid-year Population growth 1 2 3 4 5 6 7 8 9 10 11 12 13 14
TRAFFIC SIMULATION IN REGIONAL MODELING: APPLICATION TO THE INTERSTATEE INFRASTRUCTURE NEAR THE TOLEDO SEA PORT
 MICHIGAN OHIO UNIVERSITY TRANSPORTATION CENTER Alternate energy and system mobility to stimulate economic development. Report No: MIOH UTC TS41p1-2 2012-Final TRAFFIC SIMULATION IN REGIONAL MODELING: APPLICATION
Linking the Alaska AMP Assessments to NWEA MAP Tests
 Linking the Alaska AMP Assessments to NWEA MAP Tests February 2016 Introduction Northwest Evaluation Association (NWEA ) is committed to providing partners with useful tools to help make inferences from
April 2014 Data Release
 April 214 Data Release Fannie Mae s consumer attitudinal survey polls the adult U.S. general population to assess their attitudes about homeownership, renting a home, the economy, and household finances.