WORTHINGTON SCHOOLS ENROLLMENT PROJECTIONS REPORT JANUARY 25, 2019
|
|
|
- Bertha Dixon
- 5 years ago
- Views:
Transcription

1 JANUARY 25, 2019 PREPARED FOR: Worthington Schools 200 E. Wilson Bridge Rd. Worthington, OH T PREPARED BY: Cooperative Strategies 3325 Hilliard Rome Road Hilliard, OH T
2

3 Table of Contents Acknowledgements... 2 Executive Summary... 3 Enrollment Projection Methodology... 5 U.S. Census... 8 General Demographics... 9 Estimated School Aged Population Growth Housing Data Resident Live Birth Data Survival Ratios Historical Enrollment Projected Enrollment Enrollment by Boundary Conclusion... 84
4 ACKNOWLEDGMENTS On behalf of Cooperative Strategies, we would like to extend our appreciation to the Worthington Schools for the opportunity to assist them in developing this Enrollment Projections Report. As a planning team, we hope that this document will serve the Worthington Schools for years to come. COOPERATIVE STRATEGIES Tracy Richter, President, Partner Ann Hoffsis, REFP, Senior Director Matt Sachs, Associate Director Sean Hayes, Senior Associate 3325 Hilliard Rome Road Hilliard, OH P PAGE 2

5 EXECUTIVE SUMMARY The enrollment projections for the Worthington Schools included in this report were developed using the cohort survival methodology and Cooperative Strategies custom enrollment projection software, S.T.E.P. [Student Trends & Enrollment Projections]. This custom software was developed in collaboration with The Ohio State University and is based on industry best practices as well as the national experience Cooperative Strategies has with schools, school districts, and state agencies. The Worthington Schools is a suburban school district located outside of Columbus, Ohio. There are 1 PK school, 11 elementary schools, 3 middle schools, and 2 high schools, and 2 alternative schools serving over 10,000 students. The projections presented in this report are meant to serve as a planning tool for the future, and represent the most likely direction of the District. Enrollment projections were developed using the cohort survival methodology and by analyzing the following data outlined in this report: Live birth data Historical enrollment by elementary boundary, by grade Census data Building permits Enrollment projections by grade were developed based on students living within the current elementary boundaries. Enrollment in the Worthington Schools has increased by 1,180 PK-12 students since the school year (not including unmatched or out-of-district students). Based on the cohort survival methodology, enrollment is projected to increase over the next ten years. 16,000 Historical & Projected Enrollment -Worthington School District 14,000 12,000 10,000 8,000 6,000 4,000 2,000 0 Historical Projected - Recommended Projected - Moderate Projected - Low Projected - High PAGE 3
6 As with any projection, the District should pay close attention to the variables associated with determining enrollment projections discussed in this document. Any one or more of these factors can increase or decrease enrollment within the Worthington Schools. It is recommended that the data contained in this report be reviewed on an annual basis to determine how more recent trends will impact both the enrollment and any new housing development. PAGE 4

7 ENROLLMENT PROJECTION METHODOLOGY Introduction Tracing the landscape of the country s public school enrollment back over the past fifty years reveals demographic, economic, and social changes. The United States as a whole continues to undergo major shifts in public student enrollment, due in large part to past events including the baby boom, the availability and use of birth control, and the development of suburbs. The baby boom of the late 1940s and 50s was followed by the baby bust of the 1960s and 70s. This gave rise to the echo baby boom of the 1980s U.S. POPULATION - LIVE BIRTH RATE PER 1,000 POPULATION Source: CDC, National Vital Statistics Report Nationwide, districts have experienced the effects of the echo baby bust of the 1990s. From the 1950s to the 1970s, a dramatic downsizing of the family unit occurred. A direct result was the declining school enrollment of the 1970s and 1980s. As of the 2010 Census, the size of a family was at an all-time low of 3.14 persons. The live birth rate increased for the first time in several years in 1998 and increased again in However, the birth rate resumed a descending pattern in 2001 and reached an all-time low of 11.8 (per 1,000) in PAGE 5
8 When projecting future enrollments, it is vital to track the number of live births, the amount of new housing activity, and the change in household composition. In addition, any of the following factors could cause a significant change in projected student enrollment: Boundary adjustments New school openings Changes / additions in program offerings Preschool programs Change in grade configuration Interest rates / unemployment shifts Intra- and inter-district transfer Magnet / charter / private school opening or closure Zoning changes Unplanned new housing activity Planned, but not built, housing School voucher programs School closures Obviously, certain factors can be gauged and planned for far better than others. For instance, it may be relatively straightforward to gather housing data from local builders regarding the total number of lots in a planned subdivision and calculate the potential student yield. However, planning for changes in the unemployment rate, and how these may either boost or reduce public school enrollment, proves more difficult. In any case, it is essential to gather a wide variety of information in preparation for producing enrollment projections. When looking ahead at a school district s enrollment over the next two, five, or ten years, it is helpful to approach the process from a global perspective. For example: How many new homes have been constructed each year? How many births have occurred each year in relation to the resident population? Is housing experiencing a turnover if so, what is the composition of families moving in/out? Are more or less students attending private school or being home-schooled? What has the unemployment rate trend been over the past ten years? What new educational policies are in place that could affect student enrollment figures? The cohort survival methodology is often used to answer these questions and is standard throughout the educational planning industry. The enrollment projections developed for the Worthington Schools were developed using the cohort survival method. PAGE 6

9 Cohort Survival Method The cohort survival methodology (sometimes referred to as the grade progression ratio method) is a widely used enrollment projection model that is used by many school districts and state and federal agencies to project K-12 enrollment. A cohort is a group of persons [in this case, students]. The cohort survival enrollment projection methodology uses historic live birth data and historic student enrollment to age a known population or cohort throughout the school grades. For instance, a cohort begins when a group of kindergarteners enrolls in grade K and moves to first grade the following year, second grade the next year, and so on. A survival ratio is developed to track how this group of students increased or decreased in number as they moved through the grade levels. By developing survival ratios for each grade transition [i.e. 2nd to 3rd grade] over a ten year period of time, patterns emerge. A projection ratio for each grade transition is developed based on analysis of the survival ratios. The projections are used as a multiplier in determining future enrollment. For example, if student enrollment has consistently increased from the 8th to the 9th grade over the past ten years, the survival ratio would be greater than 100% and could be multiplied by the current 8th grade to develop a projection for next year s 9th grade. This methodology can be carried through to develop ten years of projection figures. Because there is not a grade cohort to follow for students coming into kindergarten, resident live birth counts are used to develop a birth-to-kindergarten survival ratio. Babies born five years previous to the kindergarten class are compared in number, and a ratio can be developed to project future kindergarten enrollments. The cohort survival method is useful in areas where population is stable [relatively flat, growing steadily, or declining steadily], and where there have been no significant fluctuations in enrollment, births, and housing patterns from year to year. The cohort survival methodology inherently considers the net effects of factors such as migration, housing, dropouts, transfers to and from charter schools, open enrollment, and deaths. This methodology does not assume changes in policies, program offerings, or future changes in housing and migration patterns. PAGE 7
10 U.S. CENSUS According to the U.S. Census Bureau, the population in Worthington, Ohio decreased from 14,125 to 13,575, or approximately 4 percent, between the 2000 and 2010 Census. In terms of school-aged children [5-19], the population decreased by 385, or 13 percent. The under age 5 population increased from 752 to 840, or 12 percent. The median age of a Worthington, Ohio resident is 44.9, an increase of 1.0 year since the 2000 Census. The average household size decreased from 2.42 to The average family size decreased from 2.92 to The number of total housing units increased in tandem with the number of vacant housing units. The number of occupied housing units remained relatively flat. The table to the right provides a comparison of the 2000 and 2010 U.S. Census data. WORTHINGTON CITY, OHIO U.S. CENSUS Subject Total population 14,125 13,575 SEX AND AGE Male 6,619 6,402 Female 7,506 7,173 Under 5 years to 19 years 2,914 2, to 64 years 7,857 7, years and over 2,602 2,591 Median age (years) RACE One Race 98.8% 98.0% White 94.0% 93.0% Black or African American 1.7% 2.2% American Indian and Alaska Native 0.1% 0.0% Asian 2.8% 2.3% Native Hawaiian and Other Pacific Islander 0.0% 0.0% Some Other Race 0.2% 0.5% Two or More Races 1.2% 2.0% Hispanic or Latino 1.0% 1.7% DEMOGRAPHICS Average household size Average family size HOUSING OCCUPANCY Total housing units 5,845 5,940 Occupied housing units 5,692 5,691 Vacant housing units Source: U.S. Census PAGE 8
11 GENERAL DEMOGRAPHICS The following information represents block group estimates and projections created from market research and U.S. Census data obtained from the Environmental Systems Research Institute [ESRI]. ESRI provides a yearly update to their demographic data in increments of five years. To make updates to their demographic data set, they use American Community Survey [ACS] data that takes a series of monthly sample surveys but only from areas with populations of 65,000 or more. One year of ACS data is a period estimate as a twelve-month average, rather than a single point in time. According to the ESRI estimates, the total population of Franklin County, Ohio is projected to increase over the next five years. As illustrated in the table below, the number of children, ages 5-18, is projected to increase by 7,685 children, or approximately 3 percent. 120, ,000 80,000 60,000 40,000 20,000 Age Ages ,296 53,894 Ages ,884 34,592 Ages ,531 99,687 Ages ,674 49,250 Ages ,510 82,463 Ages , ,400 Total Population 1,294,124 1,375,004 Source: ESRI BIS FRANKLIN COUNTY POPULATION ESTIMATES FRANKLIN COUNTY POPULATION ESTIMATES 0 Ages 0-2 Ages 3-4 Ages 5-10 Ages Ages PAGE 9
12 ESTIMATED SCHOOL AGED POPULATION GROWTH The map on the following page shows school age population change in the U.S. Census block groups within / around the Worthington Schools boundary. Population changes are based on 2018 and 2023 estimates. A block group is defined by the U.S. Census Bureau as, a statistical division of a census tract, generally defined to contain between 600 and 3,000 people and 240 and 1,200 housing units, and the smallest geographic unit for which the Census Bureau tabulates sample data. PAGE 10
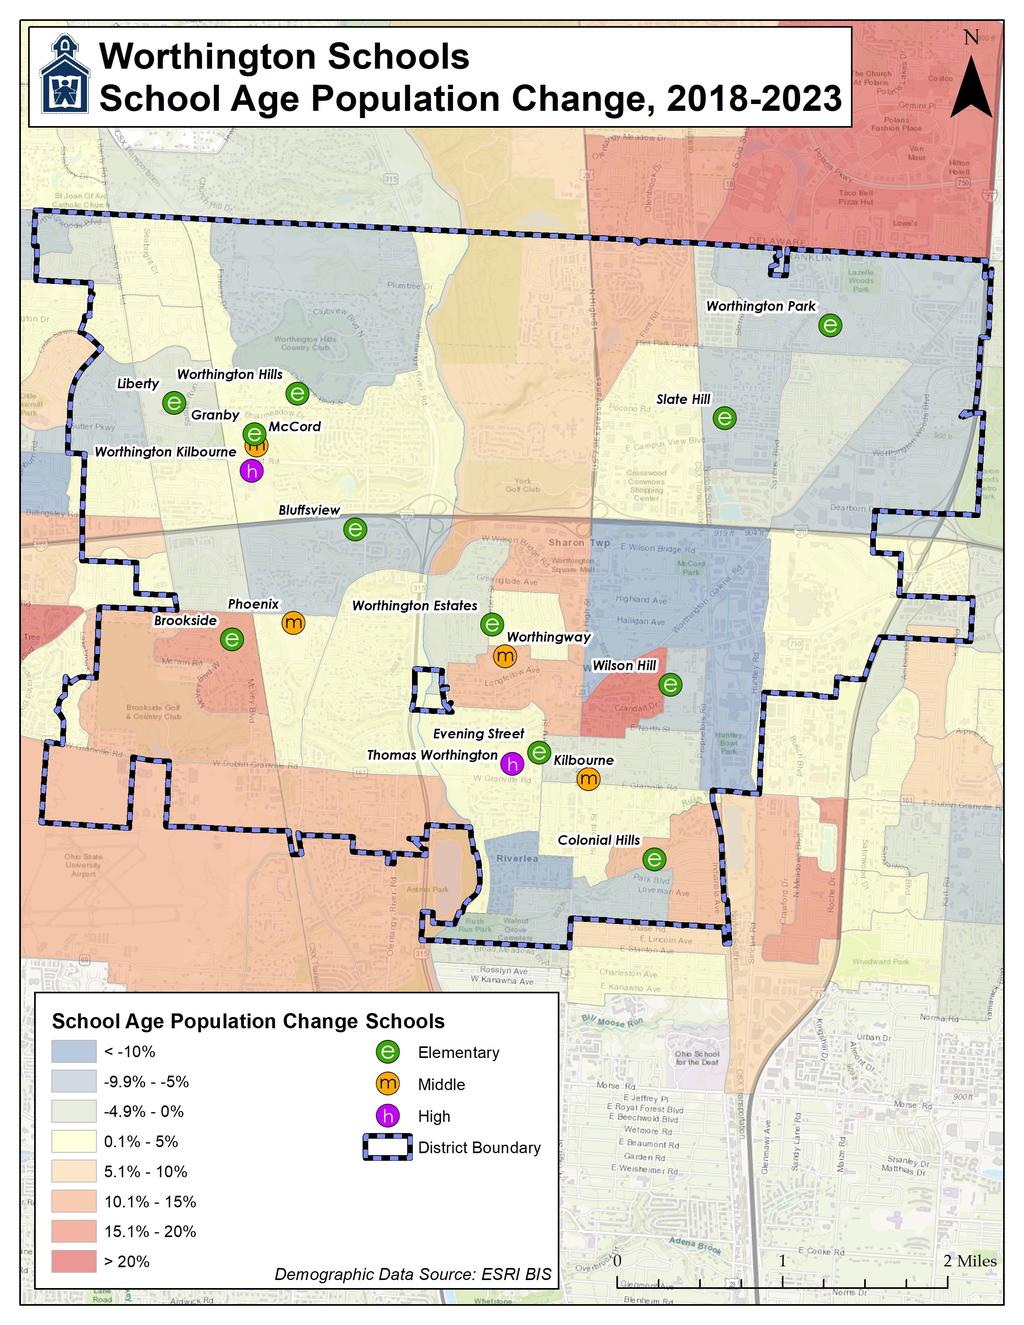
13 PAGE 11
14 HOUSING DATA Housing development and building permits are tracked to determine their effect on student enrollment. The table below illustrates the number of single and multi-family building permits issued in Worthington since BUILDING PERMITS WORTHINGTON, OH Year Single-Family Multi-Family * 8 0 Source: SOCDS Building Permits Database *preliminary through October 2018 PAGE 12
15 RESIDENT LIVE BIRTH DATA Utilization of resident live birth data is recommended when projecting future kindergarten enrollments. This data provides a helpful overall trend. Large bubbles in birth counts, either up or down, can also be planned for or anticipated by the District. In addition, the live birth counts are used in determining a birth-to-kindergarten and birth-to-first grade survival ratio. This ratio identifies the percentage of children born in a representative area who attend kindergarten and first grade in the District five and six years later. The survival ratios for birth-to-kindergarten, birth-to-first grade, as well as grades 1-12 can be found on page 16 of this report. Data is arranged by the residence of the mother. For example, if a mother lives in Worthington but delivers her baby in Cleveland, the birth is counted in Worthington. Live birth counts are different from live birth rates. The live birth count is simply the actual number of live births. A birth rate is the number of births per 1,000 women in a specified population group. The table illustrates live birth counts for zip codes 43016, 43065, 43081, 43085, 43229, and Resident Live Birth Counts by Zip Code Year , Source: Ohio Department of Health PAGE 13
16 The map on the following page illustrates the elementary boundaries and the zip codes within the Worthington Schools. Based on an analysis of student population and elementary boundaries, zip code was used to project kindergarten enrollment for the Granby boundary; zip code was used for the Liberty boundary; zip code was used for the Slate Hill, Worthington Estates, and Worthington Park boundaries; zip code was used for the Colonial Hills, Evening Street, Slate Hill, Wilson Hill, and Worthington Estates boundaries; zip code was used for the Colonial Hills boundary; and zip code was used for the Bluffsview, Brookside, Granby, Slate Hill, Worthington Estates, and Worthington Hills boundaries. 4,000 3,500 3,000 2,500 2,000 1,500 1, RESIDENT LIVE BIRTH COUNTS BY ZIP CODE PAGE 14
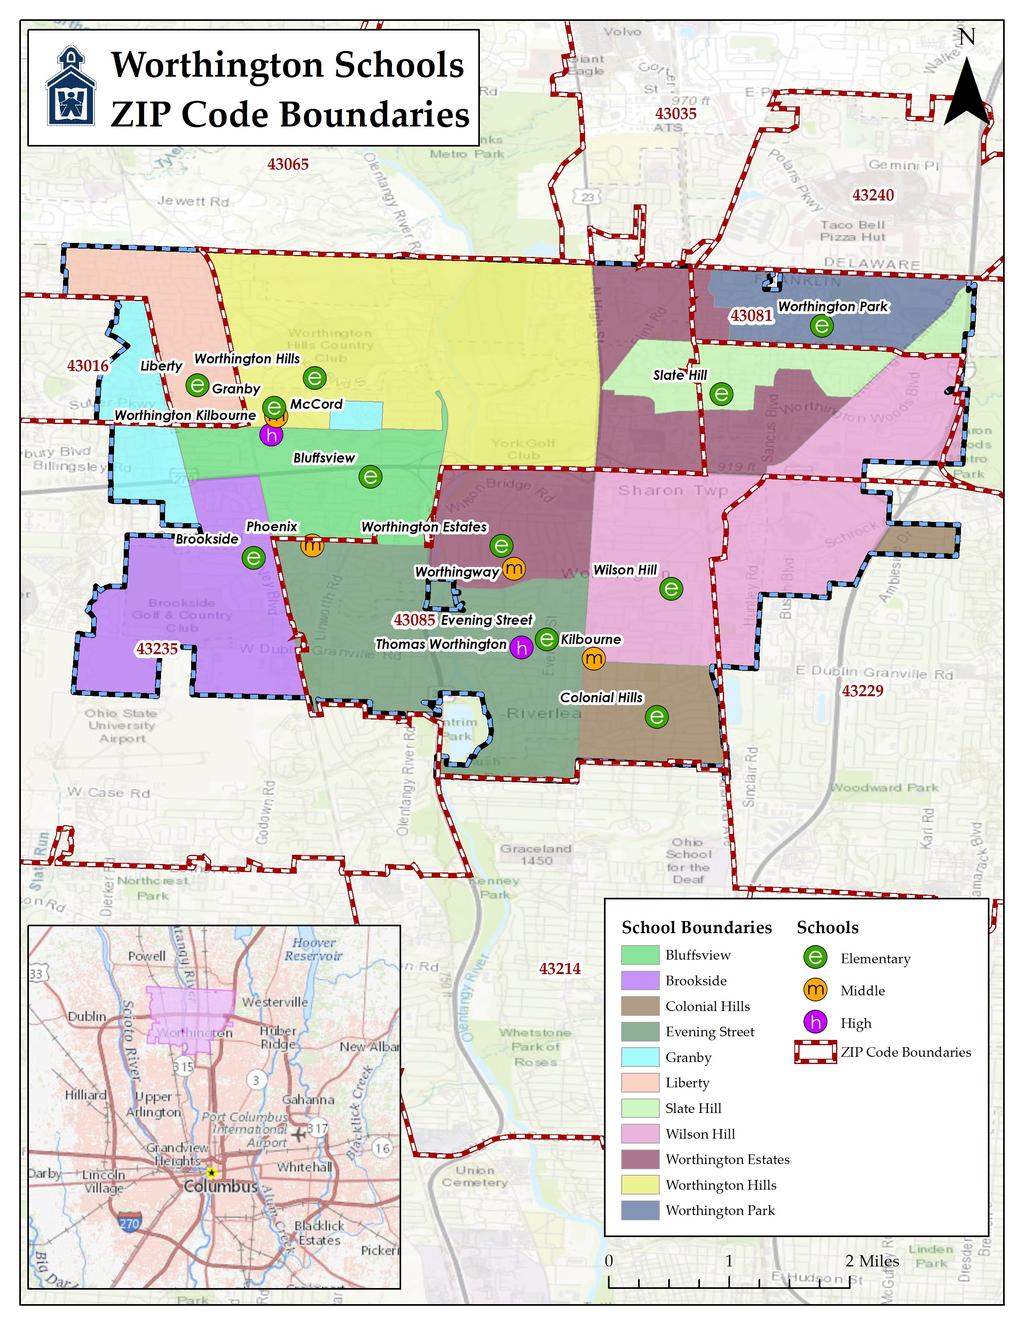
17 PAGE 15
18 SURVIVAL RATIOS The chart below demonstrates the ten-year changes in enrollment as students move through the system. Percentages greater than 100 indicate that there are more students than there were in the previous grade the previous year. In other words, there was an increase in student population where new students were added to the system. Percentages less than 100 indicate that there was decline or students left the system. If the exact number of students in 1st grade during the school year were present in 2nd grade for the school year, the survival ratio would be 100 percent. Birth-to-Kindergarten and Birth-to-First Grade: This ratio indicates the number of children born in the area who attend kindergarten and first grade in the District five and six years later. What is important to note is the trend in survival ratios, not necessarily the actual number. Grades 8 to 9: The higher than usual percentage is a result of school district promotion policies. Often in school districts, students are promoted from 8th to 9th grade and after one year in 9th grade do not have sufficient credits to be classified as a 10th grader and are counted again as 9th graders the following year. There may also be students who are attending private or charter schools or are home schooled through grade 8 and then attend public schools for high school education. The following table illustrates the historical survival ratios in the Worthington Schools over the past seven years by grade level. Survival Ratios - District-wide from to Birth to K K to 1 Birth to 1 1 to 2 2 to 3 3 to 4 4 to 5 5 to 6 6 to 7 7 to 8 8 to 9 9 to to to % % 23.26% % 98.85% % % % % % % % 98.37% % % % 23.16% % % % % % % 99.73% % 99.30% % % % % 22.86% % % % % 99.86% % % % % 98.02% 99.30% % % 22.09% 98.69% % % % % % % % % 97.38% % % % 22.39% 95.67% 99.73% 97.91% 98.18% 98.43% % % % % 98.43% % % % 21.73% 98.70% % 99.33% % % % % % % % % mean simple all years 21.39% % 22.58% % % % % % % % % % 99.10% % std. dev. simple all years 0.89% 0.75% 0.61% 2.82% 1.00% 1.56% 1.45% 1.50% 1.48% 0.98% 1.98% 1.00% 1.69% 1.25% mean simple 5 years 21.27% % 22.45% 99.63% % 99.82% % % % % % % 99.24% % std. dev. simple 5 years 0.94% 0.81% 0.58% 2.96% 0.73% 1.20% 1.60% 1.66% 1.66% 1.10% 2.08% 1.10% 1.85% 1.10% mean simple 3 years 21.38% % 22.07% 97.69% % 99.29% % % % % % % 99.16% % std. dev. simple 3 years 1.27% 0.84% 0.33% 1.74% 0.57% 1.35% 2.11% 2.29% 1.74% 1.04% 0.42% 1.08% 2.24% 1.18% mean simple 2 years 21.48% % 22.06% 97.19% 99.94% 98.62% % 99.52% % % % % % % std. dev. simple 2 years 1.78% 1.18% 0.47% 2.14% 0.28% 1.00% 2.97% 1.55% 1.14% 1.47% 0.56% 1.53% 2.30% 1.60% mean weighted all years 21.65% % 22.13% 98.45% % 99.38% % % % % % % 99.85% % std. dev. weighted all years 1.18% 0.84% 0.50% 2.24% 0.63% 1.19% 1.88% 1.55% 1.29% 1.00% 1.21% 1.07% 1.98% 1.14% mean weighted 5 years 21.76% % 22.04% 98.23% % 99.24% % % % % % % % % std. dev. weighted 5 years 1.23% 0.85% 0.44% 2.02% 0.54% 1.03% 1.97% 1.52% 1.24% 1.02% 0.97% 1.10% 2.00% 1.12% mean weighted 3 years 22.23% % 21.86% 98.17% % 99.14% % % % % % % % % std. dev. weighted 3 years 1.20% 0.80% 0.31% 1.41% 0.27% 0.75% 1.97% 1.21% 0.91% 0.98% 0.39% 1.02% 1.75% 1.05% mean weighted 2 years 22.61% % 21.76% 98.56% % 99.27% % % % % % % % % std. dev. weighted 2 years 0.76% 0.50% 0.20% 0.91% 0.12% 0.43% 1.27% 0.66% 0.49% 0.63% 0.24% 0.65% 0.98% 0.68% PAGE 16
19 HISTORICAL ENROLLMENT As indicated in the table below, over the past seven years, PK-12 student enrollment in the Worthington Schools has increased by 1,180 students (not including unmatched or out-of-district students). Historical Enrollment - District-wide Grade PK K Grand Total 9,096 9,373 9,598 9,831 9,952 10,026 10,276 Source: Worthington Schools Historical Enrollment - District-wide Grade PK K - 5 4,213 4,376 4,484 4,562 4,644 4,568 4, ,079 2,093 2,142 2,161 2,182 2,241 2, ,623 2,689 2,745 2,884 2,881 2,929 2,992 K ,915 9,158 9,371 9,607 9,707 9,738 9,984 Grand Total 9,096 9,373 9,598 9,831 9,952 10,026 10,276 Source: Worthington Schools PAGE 17
20 Historical Enrollment - by Boundary Boundary Trend Bluffsview Boundary Brookside Boundary Colonial Hills Boundary Evening Street Boundary ,001 1,020 1,072 1,064 Granby Boundary Liberty Boundary 1,000 1,017 1, Slate Hill Boundary ,001 1, Wilson Hill Boundary Worthington Estates Boundary 985 1,020 1,103 1,146 1,154 1,157 1,236 Worthington Hills Boundary Worthington Park Boundary Total 9,096 9,373 9,598 9,831 9,952 10,026 10,276 12,000 10,000 8,000 6,000 4,000 2,000 0 HISTORICAL ENROLLMENT - DISTRICT-WIDE PAGE 18
21 PROJECTED ENROLLMENT Cooperative Strategies developed low, moderate, high, and recommended enrollment projections for the Worthington Schools. The moderate enrollment projections are based on a selected average or weighted average of survival ratios (in this case, a 3 year weighted average, by boundary). The low and high enrollment projections are developed using statistical distributional theory, providing the District with a more conservative (low) and more liberal (high) enrollment projection. The recommended enrollment projection is based on a detailed analysis of historical enrollment and resulting survival ratios over the past 10 years. Significant shifts in survival ratio patterns are realized and accounted for in determining projection ratios independently for each grade level. The recommended illustrates the most likely direction of the District based on more recent trends. The range of enrollment projections from low (conservative) to high (liberal) are offered due to the limitations of the cohort survival method in factoring changes to policies, program offerings, and future changes in housing and migration patters. For example, the low enrollment projection might be used if housing declines significantly more than anticipated; the high enrollment projection might be used if housing growth increases at a more rapid rate than seen in recent years. It should be noted that actual live birth counts are available through 2017 and project kindergarten enrollment through To project kindergarten through , an average of the last 3 years of live birth counts was used. Projected PK enrollment does not follow the cohort survival method but is based on the current PK enrollment in each boundary with a District-wide total being 292 students. 16,000 Historical & Projected Enrollment - Worthington School District 14,000 12,000 10,000 8,000 6,000 4,000 2,000 0 Historical Projected - Recommended Projected - Moderate Projected - Low Projected - High PAGE 19
22 PROJECTED ENROLLMENT RECOMMENDED Based on the recommended projected enrollment, the student enrollment in the Worthington Schools is projected to increase from 10,276 in to 12,099 students in Projected Enrollment - Recommended - District-wide PK K , , Grand Total 10,495 10,776 11,000 11,165 11,376 11,546 11,651 11,750 11,917 12,099 Projected Enrollment - Recommended - District-wide PK K - 5 4,747 4,922 5,077 5,160 5,285 5,261 5,259 5,223 5,222 5, ,437 2,457 2,401 2,358 2,390 2,572 2,705 2,866 2,844 2, ,019 3,105 3,230 3,355 3,409 3,421 3,395 3,369 3,559 3,738 K ,203 10,484 10,708 10,873 11,084 11,254 11,359 11,458 11,625 11,807 Grand Total 10,495 10,776 11,000 11,165 11,376 11,546 11,651 11,750 11,917 12,099 PAGE 20
23 Projected Enrollment - Recommended - by Boundary Boundary Trend Bluffsview Boundary 951 1,010 1,082 1,130 1,202 1,266 1,329 1,384 1,435 1,471 Brookside Boundary Colonial Hills Boundary ,000 1,032 Evening Street Boundary 1,088 1,122 1,150 1,170 1,194 1,225 1,234 1,247 1,275 1,279 Granby Boundary ,008 1,015 1,025 1,018 1,031 1,036 1,050 Liberty Boundary 992 1,005 1, Slate Hill Boundary Wilson Hill Boundary Worthington Estates Boundary 1,302 1,374 1,446 1,491 1,530 1,559 1,595 1,632 1,673 1,708 Worthington Hills Boundary 1,015 1,057 1,101 1,144 1,187 1,218 1,248 1,248 1,295 1,308 Worthington Park Boundary Total 10,495 10,776 11,000 11,165 11,376 11,546 11,651 11,750 11,917 12,099 14,000 12,000 10,000 8,000 6,000 4,000 2,000 0 PROJECTED ENROLLMENT - RECOMMENDED - DISTRICT-WIDE PAGE 21
24 PROJECTED ENROLLMENT MODERATE Based on the moderate projected enrollment, the student enrollment in the Worthington Schools is projected to increase from 10,276 in to 11,953 students in Projected Enrollment - Moderate - District-wide PK K , Grand Total 10,475 10,730 10,936 11,087 11,276 11,442 11,535 11,634 11,777 11,953 Projected Enrollment - Moderate - District-wide PK K - 5 4,733 4,891 5,043 5,124 5,243 5,215 5,217 5,185 5,178 5, ,426 2,445 2,381 2,336 2,358 2,539 2,662 2,824 2,803 2, ,024 3,102 3,220 3,335 3,383 3,396 3,364 3,333 3,504 3,683 K ,183 10,438 10,644 10,795 10,984 11,150 11,243 11,342 11,485 11,661 Grand Total 10,475 10,730 10,936 11,087 11,276 11,442 11,535 11,634 11,777 11,953 PAGE 22
25 Projected Enrollment - Moderate - by Boundary Boundary Trend Bluffsview Boundary 952 1,013 1,087 1,138 1,213 1,277 1,342 1,403 1,455 1,493 Brookside Boundary Colonial Hills Boundary ,001 1,000 1,014 1,010 1,038 Evening Street Boundary 1,069 1,087 1,098 1,105 1,115 1,132 1,130 1,136 1,151 1,147 Granby Boundary ,006 1,011 1,022 1,015 1,023 1,027 1,038 Liberty Boundary 994 1,011 1,015 1,007 1, Slate Hill Boundary Wilson Hill Boundary Worthington Estates Boundary 1,299 1,370 1,439 1,480 1,512 1,539 1,570 1,606 1,640 1,679 Worthington Hills Boundary 1,023 1,072 1,127 1,177 1,230 1,268 1,303 1,308 1,364 1,381 Worthington Park Boundary Total 10,475 10,730 10,936 11,087 11,276 11,442 11,535 11,634 11,777 11,953 14,000 12,000 10,000 8,000 6,000 4,000 2,000 0 PROJECTED ENROLLMENT - MODERATE - DISTRICT-WIDE PAGE 23
26 PROJECTED ENROLLMENT LOW Based on the low projected enrollment, the student enrollment in the Worthington Schools is projected to increase from 10,276 in to 10,602 students in Projected Enrollment - Low- District-wide PK K Grand Total 10,296 10,374 10,414 10,413 10,462 10,501 10,482 10,475 10,524 10,602 Projected Enrollment - Low- District-wide PK K - 5 4,647 4,709 4,778 4,796 4,856 4,803 4,798 4,769 4,766 4, ,386 2,380 2,289 2,217 2,203 2,328 2,378 2,474 2,421 2, ,971 2,993 3,055 3,108 3,111 3,078 3,014 2,940 3,045 3,121 K ,004 10,082 10,122 10,121 10,170 10,209 10,190 10,183 10,232 10,310 Grand Total 10,296 10,374 10,414 10,413 10,462 10,501 10,482 10,475 10,524 10,602 PAGE 24
27 Projected Enrollment - Low - by Boundary Boundary Trend Bluffsview Boundary ,042 1,076 1,130 1,177 1,228 1,269 1,305 1,326 Brookside Boundary Colonial Hills Boundary Evening Street Boundary 1,053 1,054 1,048 1,043 1,042 1,047 1,037 1,035 1,040 1,029 Granby Boundary Liberty Boundary Slate Hill Boundary Wilson Hill Boundary Worthington Estates Boundary 1,270 1,309 1,346 1,356 1,366 1,369 1,379 1,392 1,409 1,429 Worthington Hills Boundary 1,008 1,043 1,083 1,119 1,160 1,187 1,210 1,209 1,253 1,262 Worthington Park Boundary Total 10,296 10,374 10,414 10,413 10,462 10,501 10,482 10,475 10,524 10,602 12,000 10,000 8,000 6,000 4,000 2,000 0 PROJECTED ENROLLMENT - LOW - DISTRICT-WIDE PAGE 25
28 PROJECTED ENROLLMENT HIGH Based on the high projected enrollment, the student enrollment in the Worthington Schools is projected to increase from 10,276 in to 13,468 students in Projected Enrollment - High - District-wide PK K , ,001 1,040 1, , ,018 1,023 1,062 1, ,056 1,065 1,104 1, ,092 1,097 1, ,133 1, , , ,008 Grand Total 10,653 11,091 11,484 11,793 12,142 12,465 12,676 12,899 13,163 13,468 Projected Enrollment - High - District-wide PK K - 5 4,827 5,077 5,317 5,473 5,656 5,664 5,663 5,622 5,616 5, ,458 2,512 2,480 2,460 2,521 2,769 2,972 3,219 3,226 3, ,076 3,210 3,395 3,568 3,673 3,740 3,749 3,766 4,029 4,333 K ,361 10,799 11,192 11,501 11,850 12,173 12,384 12,607 12,871 13,176 Grand Total 10,653 11,091 11,484 11,793 12,142 12,465 12,676 12,899 13,163 13,468 PAGE 26
29 Projected Enrollment - High - by Boundary Boundary Trend Bluffsview Boundary 964 1,045 1,136 1,207 1,297 1,384 1,468 1,547 1,618 1,674 Brookside Boundary Colonial Hills Boundary ,031 1,096 1,102 1,126 1,125 1,165 Evening Street Boundary 1,088 1,121 1,150 1,168 1,194 1,223 1,234 1,246 1,272 1,277 Granby Boundary 972 1,020 1,043 1,078 1,095 1,117 1,120 1,143 1,158 1,181 Liberty Boundary 1,011 1,044 1,064 1,069 1,082 1,081 1,066 1,079 1,072 1,084 Slate Hill Boundary Wilson Hill Boundary , ,017 1,039 Worthington Estates Boundary 1,330 1,434 1,538 1,609 1,673 1,723 1,778 1,842 1,907 1,970 Worthington Hills Boundary 1,035 1,101 1,171 1,235 1,302 1,353 1,401 1,415 1,484 1,513 Worthington Park Boundary ,011 1,046 Total 10,653 11,091 11,484 11,793 12,142 12,465 12,676 12,899 13,163 13,468 16,000 14,000 12,000 10,000 8,000 6,000 4,000 2,000 0 PROJECTED ENROLLMENT - HIGH - DISTRICT-WIDE PAGE 27
30 ENROLLMENT BY BOUNDARY The following pages illustrate historical and projected enrollment by boundary. Bluffsview Boundary Brookside Boundary Colonial Hills Boundary Evening Street Boundary Granby Boundary Liberty Boundary Slate Hill Boundary Wilson Hill Boundary Worthington Estates Boundary Worthington Hills Boundary Worthington Park Boundary PAGE 28
31 BLUFFSVIEW BOUNDARY Historical Enrollment - Bluffsview Boundary Grade PK K Grand Total Source: Worthington Schools Historical Enrollment - Bluffsview Boundary Grade PK K K Grand Total Source: Worthington Schools PAGE 29
32 Projected Enrollment - Recommended - Bluffsview Boundary PK K Grand Total 951 1,010 1,082 1,130 1,202 1,266 1,329 1,384 1,435 1,471 Projected Enrollment - Recommended - Bluffsview Boundary PK K K ,061 1,109 1,181 1,245 1,308 1,363 1,414 1,450 Grand Total 951 1,010 1,082 1,130 1,202 1,266 1,329 1,384 1,435 1,471 PAGE 30
33 Projected Enrollment - Moderate - Bluffsview Boundary PK K Grand Total 952 1,013 1,087 1,138 1,213 1,277 1,342 1,403 1,455 1,493 Projected Enrollment - Moderate - Bluffsview Boundary PK K K ,066 1,117 1,192 1,256 1,321 1,382 1,434 1,472 Grand Total 952 1,013 1,087 1,138 1,213 1,277 1,342 1,403 1,455 1,493 PAGE 31
34 Projected Enrollment - Low - Bluffsview Boundary PK K Grand Total ,042 1,076 1,130 1,177 1,228 1,269 1,305 1,326 Projected Enrollment - Low - Bluffsview Boundary PK K K ,021 1,055 1,109 1,156 1,207 1,248 1,284 1,305 Grand Total ,042 1,076 1,130 1,177 1,228 1,269 1,305 1,326 PAGE 32
35 Projected Enrollment - High - Bluffsview Boundary PK K Grand Total 964 1,045 1,136 1,207 1,297 1,384 1,468 1,547 1,618 1,674 Projected Enrollment - High - Bluffsview Boundary PK K K ,024 1,115 1,186 1,276 1,363 1,447 1,526 1,597 1,653 Grand Total 964 1,045 1,136 1,207 1,297 1,384 1,468 1,547 1,618 1,674 PAGE 33
36 BROOKSIDE BOUNDARY Historical Enrollment - Brookside Boundary Grade PK K Grand Total Source: Worthington Schools Historical Enrollment - Brookside Boundary Grade PK K K Grand Total Source: Worthington Schools PAGE 34
37 Projected Enrollment - Recommended - Brookside Boundary PK K Grand Total Projected Enrollment - Recommended - Brookside Boundary PK K K Grand Total PAGE 35
38 Projected Enrollment - Moderate - Brookside Boundary PK K Grand Total Projected Enrollment - Moderate - Brookside Boundary PK K K Grand Total PAGE 36
39 Projected Enrollment - Low - Brookside Boundary PK K Grand Total Projected Enrollment - Low - Brookside Boundary PK K K Grand Total PAGE 37
40 Projected Enrollment - High - Brookside Boundary PK K Grand Total Projected Enrollment - High - Brookside Boundary PK K K Grand Total PAGE 38
41 COLONIAL HILLS BOUNDARY Historical Enrollment - Colonial Hills Boundary Grade PK K Grand Total Source: Worthington Schools Historical Enrollment - Colonial Hills Boundary Grade PK K K Grand Total Source: Worthington Schools PAGE 39
42 Projected Enrollment - Recommended - Colonial Hills Boundary PK K Grand Total ,000 1,032 Projected Enrollment - Recommended - Colonial Hills Boundary PK K K ,014 Grand Total ,000 1,032 PAGE 40
43 Projected Enrollment - Moderate - Colonial Hills Boundary PK K Grand Total ,001 1,000 1,014 1,010 1,038 Projected Enrollment - Moderate - Colonial Hills Boundary PK K K ,020 Grand Total ,001 1,000 1,014 1,010 1,038 PAGE 41
44 Projected Enrollment - Low - Colonial Hills Boundary PK K Grand Total Projected Enrollment - Low - Colonial Hills Boundary PK K K Grand Total PAGE 42
45 Projected Enrollment - High - Colonial Hills Boundary PK K Grand Total ,031 1,096 1,102 1,126 1,125 1,165 Projected Enrollment - High - Colonial Hills Boundary PK K K ,013 1,078 1,084 1,108 1,107 1,147 Grand Total ,031 1,096 1,102 1,126 1,125 1,165 PAGE 43
46 EVENING STREET BOUNDARY Historical Enrollment - Evening Street Boundary Grade PK K Grand Total ,001 1,020 1,072 1,064 Source: Worthington Schools Historical Enrollment - Evening Street Boundary Grade PK K K ,005 1,058 1,052 Grand Total ,001 1,020 1,072 1,064 Source: Worthington Schools PAGE 44
47 Projected Enrollment - Recommended - Evening Street Boundary PK K Grand Total 1,088 1,122 1,150 1,170 1,194 1,225 1,234 1,247 1,275 1,279 Projected Enrollment - Recommended - Evening Street Boundary PK K K ,076 1,110 1,138 1,158 1,182 1,213 1,222 1,235 1,263 1,267 Grand Total 1,088 1,122 1,150 1,170 1,194 1,225 1,234 1,247 1,275 1,279 PAGE 45
48 Projected Enrollment - Moderate - Evening Street Boundary PK K Grand Total 1,069 1,087 1,098 1,105 1,115 1,132 1,130 1,136 1,151 1,147 Projected Enrollment - Moderate - Evening Street Boundary PK K K ,057 1,075 1,086 1,093 1,103 1,120 1,118 1,124 1,139 1,135 Grand Total 1,069 1,087 1,098 1,105 1,115 1,132 1,130 1,136 1,151 1,147 PAGE 46
WORTHINGTON SCHOOLS ENROLLMENT PROJECTIONS REPORT FEBRUARY 14, 2018
 FEBRUARY 14, 2018 PREPARED FOR: Worthington Schools 200 E. Wilson Bridge Rd. Worthington, OH 43085 T 614.450.6000 PREPARED BY: Cooperative Strategies 3325 Hilliard Rome Road Hilliard, OH 43026 T 614.798.8828
GREENE COUNTY SCHOOLS ENROLLMENT PROJECTIONS REPORT APRIL 12, 2017
 APRIL 12, 2017 PREPARED FOR: Greene County Schools 910 West Summer Street Greeneville, TN 37743 T 423-639-4194 PREPARED BY: Cooperative Strategies 3325 Hilliard Rome Road Hilliard, OH 43026 T 614.798.8828
DRAFT. Enrollment Projections Report. November 25, 2015
 November 25, 2015 3325 Hilliard Rome Road Hilliard, Ohio 43026 P: 614.798.8828 f: 614.798.8839 www.dejongrichter.com Table of Contents Acknowledgements... 1 Executive Summary... 3 Enrollment Projection
DRAFT. Enrollment Projections Report. February 12, 2016
 February 12, 2016 3325 Hilliard Rome Road Hilliard, Ohio 43026 P: 614.798.8828 f: 614.798.8839 www.dejongrichter.com Table of Contents Acknowledgements... 2 Executive Summary... 3 Enrollment Projection
School Districts of Randolph County, IN Demographic Study
 School Districts of Randolph County, IN Demographic Study November 15, 2017 McKibben Demographic Research Jerome McKibben, Ph.D. Rock Hill, SC j.mckibben@mckibbendemographics.com 978-501-7069 Assumptions
MAY 2014 ROCHESTER PUBLIC SCHOOLS ENROLLMENT ANALYSIS ROCHESTER PUBLIC SCHOOLS TEAMWORKS INTERNATIONAL
 ROCHESTER PUBLIC SCHOOLS ENROLLMENT ANALYSIS MAY 2014 ROCHESTER PUBLIC SCHOOLS TEAMWORKS INTERNATIONAL ROCHESTER PUBLIC SCHOOLS ROCHESTER, MN ENROLLMENT ANALYSIS 1 INTRODUCTION, METHODOLOGY & SUMMARY 7
Portland Public Schools Enrollment Forecasts, to : Based on October 2016 Enrollments
 Portland State University PDXScholar School District Enrollment Forecast Reports Population Research Center 11-2017 Portland Public Schools Enrollment Forecasts, 2017-18 to 2031-32: Based on October 2016
2007 and 2012 Survey of Business Owners
 2007 and 2012 Survey of Business Owners Table of Contents 1. 2012 Shelby County Survey Results 2. 2012 City of Memphis Survey Results 3. 2007 Shelby County Survey Results 4. 2007 City of Memphis Survey
WESTON, CONNECTICUT Demography and Enrollment Projections
 WESTON, CONNECTICUT Demography and Enrollment Projections September 18, 2012 NESDEC PROJECT TEAM Donald G. Kennedy, Ed.D., Enrollment Projections John H. Kennedy, M.A., Additional Data Arthur L. Bettencourt,
Greenwich Public Schools Enrollment Projections. Enrollment Information
 Greenwich Public Schools Enrollment Projections RISE Committee Presentation March 13, 2007 Enrollment Information Ten Year District Enrollment Projection Five Year Enrollment Projection by School Migration
Produced by the BPDA Research Division:
 March 2018 Produced by the BPDA Research Division: Alvaro Lima Director Jonathan Lee Deputy Director Christina Kim Research Manager Phillip Granberry Senior Researcher/Demographer Matthew Resseger Senior
Demographics Booklet
 Demographics Booklet R E P O R T S M A P S C H A R T S Population est. 2009 1 mi: 1,082 3 mi: 9,566 5 mi: 14,586 Latitude N 35.61947 Longitude W 82.29195 Households est. 2009 1 mi: 461 3 mi: 4,067 5 mi:
Liberty Hill ISD. District Housing Activity Report 3rd Quarter, 2012
 Liberty Hill ISD District Housing Activity Report 3rd Quarter, 2012 GREATER AUSTIN NEW HOME CONSTRUCTION STARTS, CLOSINGS, & LOT DELIVERIES 19000 18000 17000 16000 Year-Over-Year Change Annual Starts +28%
RESEARCH ON ASSESSMENTS
 hmhco.com RESEARCH ON ASSESSMENTS HMH Reading Inventory: Estimated Average Annual Growth 3 4 Houghton Mifflin Harcourt (HMH) is committed to developing innovative educational programs and professional
SOCIO-ECONOMIC and LAND USE DATA
 SOCIO-ECONOMIC and LAND USE DATA FUTURE CONDITIONS January CHATHAM URBAN TRANSPORTATION STUDY - 1 - Table of Contents Introduction 3 TAZ - Municipality - Map Index...8 2005 Socio-economic and Land Use
OLYMPIC GATEWAY PLAZA
 OLYMPIC GATEWAY PLAZA ABERDEEN, WA MICHAEL S SUBLEASE AVAILABLE IMMEDIATELY Property Highlights Located in the Olympic Gateway Plaza Great Visibility to State Hwy 12 13,258 sf Available (103 front x 129
ENROLLMENT MANAGEMENT REPORT SCHOOL PROFILE PUBLIC HEALTH FALL 2018
 ENROLLMENT MANAGEMENT REPORT SCHOOL PROFILE PUBLIC HEALTH FALL 218 INTRODUCTION COLLEGE PROFILE The following college profile has been developed to tailor our annual enrollment report to your school s
American Driving Survey,
 RESEARCH BRIEF American Driving Survey, 2015 2016 This Research Brief provides highlights from the AAA Foundation for Traffic Safety s 2016 American Driving Survey, which quantifies the daily driving patterns
The Value of Travel-Time: Estimates of the Hourly Value of Time for Vehicles in Oregon 2007
 The Value of Travel-Time: Estimates of the Hourly Value of Time for Vehicles in Oregon 2007 Oregon Department of Transportation Long Range Planning Unit June 2008 For questions contact: Denise Whitney
Fatal Motor Vehicle Crashes on Indian Reservations
 April 2004 DOT HS 809 727 Fatal Motor Vehicle Crashes on Indian Reservations 1975-2002 Technical Report Colleges & Universities 2% Other Federal Properties 9% Other 4% Indian Reservations 65% National
National Household Travel Survey Add-On Use in the Des Moines, Iowa, Metropolitan Area
 National Household Travel Survey Add-On Use in the Des Moines, Iowa, Metropolitan Area Presentation to the Transportation Research Board s National Household Travel Survey Conference: Data for Understanding
Demographic Study. Boyd Independent School District. Fall Learn from Yesterday Understand Today Plan for Tomorrow
 Boyd Independent School District Demographic Study Fall 2017 Learn from Yesterday Understand Today Plan for Tomorrow Economic Conditions DFW Area (September 2017) 2.8% 99,800 new jobs National rate 1.2%
The proposed Escondido Village Graduate Student Housing project would include the following features:
 LAND BUILDINGS & REAL ESTATE Parking & Transportation Services TITLE: Proposed Escondido Village Graduate Residences Parking Analysis (Revised 2/23/16) FROM: Brian D. Shaw, Director, Parking & Transportation
ENROLLMENT MANAGEMENT REPORT COLLEGE PROFILE APPLIED HEALTH SCIENCES FALL 2017
 ENROLLMENT MANAGEMENT REPORT COLLEGE PROFILE APPLIED HEALTH SCIENCES FALL 217 INTRODUCTION COLLEGE PROFILE The following college profile has been developed to tailor our annual enrollment report to your
DIBELSnet System- Wide Percentile Ranks for. DIBELS Next. Elizabeth N Dewey, M.Sc. Ruth A. Kaminski, Ph.D. Roland H. Good, III, Ph.D.
 2011-2012 DIBELSnet System- Wide Ranks for Introduction DIBELS Next Elizabeth N Dewey, M.Sc. Ruth A. Kaminski, Ph.D. Roland H. Good, III, Ph.D. The following report presents the system- wide percentile
Population Projections
 College of Liberal Arts and Sciences Bureau of Economic and Business Research Florida Population Studies Bulletin 169, June 2014 by Age, Sex, Race, and Hispanic Origin Population Projections for Florida
Jarrell Independent School District
 Jarrell Independent School District Demographic Study January 22 nd, 2014 Learn from Yesterday Understand Today Plan for Tomorrow Economic Conditions From 2000 to 2013, Texas outperformed the U.S. job
LAGUNA HONDA. Commercial Property For Sale SAN FRANCISCO, CA
 Commercial Property For Sale LOCATED IN Forest Hill PRICE: $2,475,000.00 Price per Square Foot: $201.00 SBA financing available for owner/user Great investment property with existing tenants Located on
Tony Roma s (Closed) Fully Equipped Restaurant Building
 Fully Equipped Restaurant Building") Tony Roma s (Closed) Fully Equipped Restaurant Building 5221 Tacoma Mall Blvd, Tacoma CBA Listing #52400 Price $900,000 Fully Equipped Restaurant Building for $900,000 Great Location! I-5 Exposure Building
Tony Roma s (Closed) Fully Equipped Restaurant Building 5221 Tacoma Mall Blvd, Tacoma CBA Listing #52400 Price $900,000 Fully Equipped Restaurant Building for $900,000 Great Location! I-5 Exposure Building
Who has trouble reporting prior day events?
 Vol. 10, Issue 1, 2017 Who has trouble reporting prior day events? Tim Triplett 1, Rob Santos 2, Brian Tefft 3 Survey Practice 10.29115/SP-2017-0003 Jan 01, 2017 Tags: missing data, recall data, measurement
Household Projections for Japan 1 : Outline of Results and Methods. Hachiro Nishioka, Toru Suzuki, Masakazu Yamauchi, and Keita Suga
 Household Projections for Japan 1 : 2005 2030 Outline of Results and Methods Hachiro Nishioka, Toru Suzuki, Masakazu Yamauchi, and Keita Suga Introduction Household Projections for Japan (Outline of Results
Boston in Context: Neighborhoods American Community Survey. January Longwood, taken by Peter Vanderwarker, from BPDA Archives
 Longwood, taken by Peter Vanderwarker, from BPDA Archives Old North Church, taken by Peter Vanderwarker, from BPDA Archives Boston in Context: Neighborhoods 2011-2015 American Community Survey January
ENROLLMENT MANAGEMENT REPORT COLLEGE PROFILE LIBERAL ARTS AND SCIENCES FALL 2017
 ENROLLMENT MANAGEMENT REPORT COLLEGE PROFILE LIBERAL ARTS AND SCIENCES FALL 217 INTRODUCTION COLLEGE PROFILE The following college profile has been developed to tailor our annual enrollment report to your
Dublin Unified School District Dublin, CA
 Dublin, CA 7-Year Student Population Projections By Residence Fall 2017-2023 (Based on Fall 2016 Data) Prepared by 11850 Pierce Street, Suite 200 Riverside, California 92505 Phone: (888)-337-4471 Fax:
Passenger seat belt use in Durham Region
 Facts on Passenger seat belt use in Durham Region June 2017 Highlights In 2013/2014, 85 per cent of Durham Region residents 12 and older always wore their seat belt when riding as a passenger in a car,
Denver Car Share Program 2017 Program Summary
 Denver Car Share Program 2017 Program Summary Prepared for: Prepared by: Project Manager: Malinda Reese, PE Apex Design Reference No. P170271, Task Order #3 January 2018 Table of Contents 1. Introduction...
FOR SALE DEMPSTER STREET RETAIL CENTER Dempster St / Skokie, IL farabrokerage.com. Property Highlights FOR SALE: $895,000
 FOR SALE DEMPSTER STREET RETAIL CENTER Property Highlights Single-story, commercial building located on highlytrafficked Dempster Street 7,547 +/- SF building 11,800 +/- SF land site Currently divided
201 SOUTH MARY STREET Sunnyvale, CA
 201 SOUTH MARY STREET Sunnyvale, CA RETAIL SPACE FOR SUBLEASE AVAILABLE Rear Entranceway SIZE: 1,991 square feet Property Highlights POSSESSION: Immediate ASKING RENT: $2.75 per Sq. Ft. per Month NNN COMMENTS:
Motorcoach Census. A Study of the Size and Activity of the Motorcoach Industry in the United States and Canada in 2015
 Motorcoach Census A Study of the Size and Activity of the Motorcoach Industry in the United States and Canada in 2015 Prepared for the American Bus Association Foundation by John Dunham & Associates October
Yale University Race/Ethnicity and International Student Enrollment by School to Race/Ethnicity Unknown.
 Hispanic of Any Race Black or African Alaskan Native Asian Islander White Two or More Races Race/Ethnicity Unknown Total U.S. & Resident Alien Students Non-Resident Yale College 2005-06 179 204 193 239
Drivers License Status Report for Milwaukee County
 University of Wisconsin Milwaukee UWM Digital Commons ETI Publications Employment Training Institute 2012 Drivers License Status Report for Milwaukee County John Pawasarat University of Wisconsin - Milwaukee,
CITY OF VANCOUVER ADMINISTRATIVE REPORT
 Supports Item No. 1 T&T Committee Agenda May 13, 2008 CITY OF VANCOUVER ADMINISTRATIVE REPORT Report Date: April 29, 2008 Author: Don Klimchuk Phone No.: 604.873.7345 RTS No.: 07283 VanRIMS No.: 13-1400-10
WorkKeys District Data
 WorkKeys District Data 2015 1 State WorkKeys 2015 Subject Areas Number Percent Bronze Silver Gold Platinum Platinum Average Tested Not Certified Level 3 Level 4 Level 5 Level 6 Level 7 Scale Score Applied
Demographic Report. Jarrell Independent School District. Spring Learn from Yesterday Understand Today Plan for Tomorrow
 Jarrell Independent School District Demographic Report Spring 2018 Learn from Yesterday Understand Today Plan for Tomorrow Economic Conditions Austin Area (December 2017) 3.2% 34,950 new jobs National
Transportation Statistical Data Development Report BAY COUNTY 2035 LONG RANGE TRANSPORTATION PLAN
 Transportation Statistical Data Development Report BAY COUNTY 2035 LONG RANGE TRANSPORTATION PLAN Prepared for Bay County Transportation Planning Organization and The Florida Department of Transportation,
94,250 SF FOR LEASE OR SALE 4900 S SOTO STREET, VERNON, CA 90058
 94,250 SF FOR LEASE OR SALE 4900 S SOTO STREET, VERNON, CA 90058 LEONIS BOULEVARD S SOTO STREET For more information, please contact: JACK CLINE CHUCK CAMPBELL Senior Vice President Senior Vice President
The purpose of the projections is to obtain a future number of private households by family type. This report deals with five different family types:
 Household Projections for Japan 2015-2040 1) Outline of Results and Methods Introduction Household Projections for Japan (Outline of Results and Methods) projected the number of households nationwide and
INVESTMENT OFFERING. OFFERING PRICE $1,346,000 (7.25% Cap Rate)
") INVESTMENT OFFERING National Tire & Battery 4373 New Snapfinger Woods Drive Decatur (Atlanta), GA OFFERING PRICE $1,346,000 (7.25% Cap Rate) Presented By: Jerry Hopkins & Ken Hedrick STAN JOHNSON COMPANY
INVESTMENT OFFERING National Tire & Battery 4373 New Snapfinger Woods Drive Decatur (Atlanta), GA OFFERING PRICE $1,346,000 (7.25% Cap Rate) Presented By: Jerry Hopkins & Ken Hedrick STAN JOHNSON COMPANY
Attachment D Environmental Justice and Outreach
 Attachment D Environmental Justice and Outreach ATTACHMENT D Environmental Justice and Outreach Indicate whether the project will have disproportionately high and adverse impacts on minority or low income
ENROLLMENT MANAGEMENT REPORT GRADUATE DIVISION PROFILE LIFE SCIENCES FALL 2017
 ENROLLMENT MANAGEMENT REPORT GRADUATE DIVISION PROFILE LIFE SCIENCES FALL 217 INTRODUCTION DIVISION PROFILE The following profile report focuses on the graduate program division (as defined in the Graduate
Survey of users of wheelchair seat elevators
 Survey of users of wheelchair seat elevators The Rehabilitation Engineering and Applied Research Center in collaboration with Quantum Rehab surveyed wheelchair users whose powered wheelchairs are equipped
Population Projections
 College of Liberal Arts and Sciences Bureau of Economic and Business Research Florida Population Studies Bulletin 172, June 2015 Population Projections by Age, Sex, Race, and Hispanic Origin for Florida
(Indicator B - Course Completion) Successful Course Completion by Gender Page 1 of 5
 Successful Course Completion by Gender Page 1 of 5") (Indicator B - Course Completion) ful Course Completion by Gender 2008-09 Top : 2009-10 Top : Top : Top : Top : 52.7 52.7 51.7 54.0 54.6 Female 65.1 ok 65.7 ok 64.1 ok 65.0 ok 67.7 ok Male 65.9 ok 65.9
(Indicator B - Course Completion) ful Course Completion by Gender 2008-09 Top : 2009-10 Top : Top : Top : Top : 52.7 52.7 51.7 54.0 54.6 Female 65.1 ok 65.7 ok 64.1 ok 65.0 ok 67.7 ok Male 65.9 ok 65.9
Characteristics of Minimum Wage Workers: Bureau of Labor Statistics U.S. Department of Labor
 Characteristics of Minimum Wage Workers: 2012 Bureau of Labor Statistics U.S. Department of Labor February 26, 2013 In 2012, 75.3 million in the United States age 16 and over were paid at, representing
CETA prime sponsor management decisions and program goal achievement. rural oriented research and development projects: a review and synthesis
 Lawrence University Weeding List #475 Contact: Kimberly Knuppel at: kimberly.knuppel@lawrence.edu L 37.14: 45 L 37.14: 44 L 37.14: 43 L 37.14: 42 unlocking the second gate the implementation of CETA in
ENROLLMENT MANAGEMENT REPORT GRADUATE DIVISION PROFILE FINE ARTS AND HUMANITIES FALL 2017
 ENROLLMENT MANAGEMENT REPORT GRADUATE DIVISION PROFILE FINE ARTS AND HUMANITIES FALL 217 INTRODUCTION DIVISION PROFILE The following profile report focuses on the graduate program division (as defined
LEASE Cornelius Retail on Catawba
 Presented by G Brokerage Property Details Offering both retail and office spaces, these spaces are priced at $14 per square foot for office and $14 per square foot for retail. Options are available to
Prepared: November 2010
 Page Introduction 3 Graph: Enrollment Summary 4 Classroom Capacities and Enrollments 5 Enrollment History and Forecast Summary 6 Graph: Five Year Enrollment Forecast 7 Graph: Census vs. Enrollment 8 Summary
Enrollment and Educator Data ( School Year) About the Data
 About the Data") We will be redesigng school and district report cards 2018. Please complete our survey to tell us what formation you thk would be most valuable on a school or district report card. Massachusetts School
We will be redesigng school and district report cards 2018. Please complete our survey to tell us what formation you thk would be most valuable on a school or district report card. Massachusetts School
JOB OPENINGS AND LABOR TURNOVER APRIL 2016
 For release 10:00 a.m. (EDT) Wednesday, June 8, Technical information: (202) 691-5870 JoltsInfo@bls.gov www.bls.gov/jlt Media contact: (202) 691-5902 PressOffice@bls.gov USDL-16-1149 JOB OPENINGS AND LABOR
Prior Lake - Savage Area Schools Prior Lake, MN
 Prior Lake - Savage Area Schools Prior Lake, MN Elementary Boundary Change Options A-1 and B-1: March 12 th, 2019 Report created by TeamWorks International, Inc 7037 20th Avenue S. Centerville, MN 55038
Enrollment and Educator Data ( School Year) About the Data
 About the Data") Massachusetts School and District Profiles Parthum Middle School Parthum Middle School (01490027) Peter L LeFebre, Prcipal Mailg Address: 255 East Haverhill Street Lawrence, MA 01841 Phone: (978) 691-7224
Massachusetts School and District Profiles Parthum Middle School Parthum Middle School (01490027) Peter L LeFebre, Prcipal Mailg Address: 255 East Haverhill Street Lawrence, MA 01841 Phone: (978) 691-7224
TRANSIT DEMAND IN RURAL DOUGLAS COUNTY: PRELIMINARY BACKGROUND DATA
 TRANSIT DEMAND IN RURAL DOUGLAS COUNTY: PRELIMINARY BACKGROUND DATA Lawrence-Douglas County MPO Regional Transit Advisory Committee Lawrence, Kans. Tuesday October 31, 2017 Chris Zeilinger Assistant Director
KANSAS Occupant Protection Observational Survey Supplementary Analyses Summer Study
 KANSAS Occupant Protection Observational Survey Supplementary Analyses 2018 Summer Study Submitted To: Kansas Department of Transportation Bureau of Transportation Safety and Technology Prepared by: DCCCA
Sigmon Commons 5225 Sigmon Rd, Wilmington, NC 28403
 Sigmon Commons 5225 Sigmon Rd, Wilmington, NC 28403 Matt Ray Ray Properties, Inc. 3684-C Henderson Drive,Jacksonville, NC 28546 matt@rayproperties.com (910) 388-6620 License: 266827 Sigmon Commons $1,991,000
Right dir - wrong track Number of cases
 Q1 Direction of things in Douglas County today Right direction 62 73 69 57 63 67 69 62 Wrong track 20 15 15 25 24 20 22 22 Unsure 18 12 16 17 13 12 9 16 Refused 0 0 0 1 1 1 0 Right dir - wrong track 42
NON-FATAL ELECTRICAL INJURIES AT WORK
 NON-FATAL ELECTRICAL INJURIES AT WORK Richard Campbell May 2018 Copyright 2018 National Fire Protection Association (NFPA) CONTENTS Findings and Trends 1 Key Takeaways 2 Background on Data Sources and
2018 ESCAP population data sheet
 2018 ESCAP data sheet Population and Development Indicators for Asia and the, 2018 Region, subregion, country, territory or area Population at mid-year Population growth 1 2 3 4 5 6 7 8 9 10 11 12 13 14
NEXT. Powered by Qualtrics. 10/3/2018 Potholes & politics
 We want to know Minnesotans' opinions about priorities for transportation infrastructure structures, services, and facilities in our state. How are we doing? How well is the transportation infrastructure
JOB OPENINGS AND LABOR TURNOVER DECEMBER 2017
 For release 10:00 a.m. (EST) Tuesday, February 6, 2018 Technical information: (202) 691-5870 JoltsInfo@bls.gov www.bls.gov/jlt Media contact: (202) 691-5902 PressOffice@bls.gov USDL-18-0204 JOB OPENINGS
Nacogdoches Second Generation Restaurant Space 1208 N University Dr, Nacogdoches, TX 75961
 Nacogdoches Second Generation Restaurant Space 1208 N University Dr, Nacogdoches, TX 75961 Maxx Lovern William Roth Company 11551 Forest Central Dr.,Suite 110, Dallas, TX 75243 maxx.lovern@gmail.com (972)
Robertson County. 3 utilities: Blue Grass Energy Cooperative Fleming-Mason Energy Cooperative Kentucky Utilities DID YOU KNOW?
 3 utilities: Blue Grass Energy Cooperative Fleming-Mason Energy Cooperative Kentucky Utilities Electric Service Areas DID YOU KNOW? By state-law, utilities are guaranteed a monopoly in their service territory.
443 Liberty Drive 443 Liberty Dr, Jacksonville, NC 28546
 443 Liberty Drive 443 Liberty Dr, Jacksonville, NC 28546 Matt Ray Ray Properties, Inc. 3684-C Henderson Drive,Jacksonville, NC 28546 matt@rayproperties.com (910) 388-6620 License: 266827 443 Liberty Drive
MPO Staff Report Technical Advisory Committee: July 12, 2017
 MPO Staff Report Technical Advisory Committee: July 12, 2017 RECOMMENDED ACTION: 2 nd TAC Meeting with Kimley-Horn/WSB in Updating the Street/Highway Element of 2045 Metropolitan Transportation Plan. Matter
Maryland State Department of Education Division of Curriculum, Research, Assessment, and Accountability 200 West Baltimore Street Baltimore, MD
 Maryland State Department of Education Division of Curriculum, Research, Assessment, and Accountability 200 West Baltimore Street Baltimore, MD 21201-2595 (410) 767-1628 MARYLAND STATE DEPARTMENT OF EDUCATION
Electric Vehicle Programs & Services. October 26, 2017
 1 Electric Vehicle Programs & Services October 26, 2017 2 Outline Electric vehicle (EV) market update MGE Programs, Services and Outreach Public charging Home charging Multi-family charging Madison Gas
Abstract. 1. Introduction. 1.1 object. Road safety data: collection and analysis for target setting and monitoring performances and progress
 Road Traffic Accident Involvement Rate by Accident and Violation Records: New Methodology for Driver Education Based on Integrated Road Traffic Accident Database Yasushi Nishida National Research Institute
A.B. UNDERGRADUATE DEGREE CANDIDATES BY CLASS AND GENDER
 OFFICE OF THE REGISTRAR October 15, PRINCETON UNIVERSITY OPENING ENROLLMENTS - - - Undergraduates 5260 5251 5277 5275 5244 Graduate Students 2879 2781 2736 2697 2691 Non-Degree Seeking Part-Time Students
THE 2013 WYOMING HOUSING NEEDS FORECAST
 THE 2013 WYOMING HOUSING NEEDS FORECAST SPONSORED BY THE WYOMING COMMUNITY DEVELOPMENT AUTHORITY FINAL REPORT: MARCH 29, 2013 The 2013 Wyoming Housing Needs Forecast Prepared for Wyoming Community Development
U.S. Census Bureau News Joint Release U.S. Department of Housing and Urban Development
 Raemeka Mayo or Stephen Cooper Economic Indicators Division (01) 76-5160 FOR IMMEDIATE RELEASE TUESDAY, MARCH 17, 015 AT 8:0 A.M. EDT NEW RESIDENTIAL CONSTRUCTION IN FEBRUARY 015 The U.S. Census Bureau
Mead School District 354 Mead, WA
 Mead, WA 10-Year Student Population Projections By Residence Fall 2017-2026 (Based on Fall 2016 Data) Prepared by 11850 Pierce Street, Suite 200 Riverside, California 92505 Phone: (888)-337-4471 Fax: (951)
Johnson County. 2 utilities: Big Sandy RECC Kentucky Power DID YOU KNOW? Residential Rate Comparison. Electric Service Areas
 2 utilities: Big Sandy RECC Kentucky Power Electric Service Areas DID YOU KNOW? Map of Kentucky Electric Service Areas By state-law, utilities are guaranteed a monopoly in their service territory. Most,
Residential Electric Customer Usage Analysis: City of Gastonia, NC. Jennifer Weiss Yijing Cheng
 Residential Electric Customer Usage Analysis: City of Gastonia, NC Jennifer Weiss Yijing Cheng July 2014 Residential Electric Customer Usage and Expenditure Analysis About the Environmental Finance Center
STATISTICAL TABLES RELATING TO INCOME, EMPLOYMENT, AND PRODUCTION
 A P P E N D I X B STATISTICAL TABLES RELATING TO INCOME, EMPLOYMENT, AND PRODUCTION C O N T E N T S NATIONAL INCOME OR EXPENDITURE Page B 1. Gross domestic product, 1960 2009... 328 B 2. Real gross domestic
MONTHLY NEW RESIDENTIAL SALES, SEPTEMBER 2018
 FOR RELEASE AT 10:00 AM EDT, WEDNESDAY, OCTOBER 24, MONTHLY NEW RESIDENTIAL SALES, SEPTEMBER Release Number: CB18 160 October 24, The U.S. Census Bureau and the U.S. Department of Housing and Urban Development
Figure 1 Unleaded Gasoline Prices
 Policy Issues Just How Costly Is Gas? Summer 26 Introduction. Across the nation, the price at the pump has reached record highs. From unleaded to premium grade, prices have broken three dollars per gallon
National Center for Statistics and Analysis Research and Development
 U.S. Department of Transportation National Highway Traffic Safety Administration DOT HS 809 271 June 2001 Technical Report Published By: National Center for Statistics and Analysis Research and Development
Downtown Lee s Summit Parking Study
 Downtown Lee s Summit Parking Study As part of the Downtown Lee s Summit Master Plan, a downtown parking and traffic study was completed by TranSystems Corporation in November 2003. The parking analysis
Figure 15. Yearly Trend in Death Rates for Motor Vehicle Transport: NSW, Year
 6.0 MOTOR VEHICLE TRANSPORT 6.1 Deaths due to Motor Vehicle Transport: The motor vehicle transport (MV) death rate showed a statistically significant decrease overall between 1989 and 1999 although the
Appendix B STATISTICAL TABLES RELATING TO INCOME, EMPLOYMENT, AND PRODUCTION
 Appendix B STATISTICAL TABLES RELATING TO INCOME, EMPLOYMENT, AND PRODUCTION C O N T E N T S Page NATIONAL INCOME OR EXPENDITURE: B. Gross domestic product, 959 005... 80 B. Real gross domestic product,
Elementary and Middle School Spring 2015 Results
 and Colorado Measures of Academic Success (CMAS) Colorado Measures of Academic Success (CMAS) and and Elementary and Middle School Spring 201 Results Spring 201 Results Overall by and Gender Race/Ethnicity
DRP DER Growth Scenarios Workshop. DER Forecasts for Distribution Planning- Electric Vehicles. May 3, 2017
 DRP DER Growth Scenarios Workshop DER Forecasts for Distribution Planning- Electric Vehicles May 3, 2017 Presentation Outline Each IOU: 1. System Level (Service Area) Forecast 2. Disaggregation Approach
Executive Summary. Light-Duty Automotive Technology and Fuel Economy Trends: 1975 through EPA420-S and Air Quality July 2006
 Office of Transportation EPA420-S-06-003 and Air Quality July 2006 Light-Duty Automotive Technology and Fuel Economy Trends: 1975 through 2006 Executive Summary EPA420-S-06-003 July 2006 Light-Duty Automotive
Alfred & Plantagenet Multi-Residential Cart Recycling Program CIF Project Number # Final Report October 1, 2016
 Alfred & Plantagenet Multi-Residential Cart Recycling Program CIF Project Number #545.3 Final Report October 1, 2016 Prepared for: Waste Diversion Ontario Continuous Improvement Fund Office Barrie, Ontario
Whither the Dashing Commuter?
 Whither the Dashing Commuter? The MTA in a Changing Region William Wheeler Director of Special Project Development and Planning Travel in the New York Region has changed from the days of the 9 to 5 commute
Prepared: November 2011 (revised)
") Page Introduction 3 Graph: Enrollment Summary 4 Classroom Capacities and Enrollments 5 Enrollment History and Forecast Summary 6 Graph: Five Year Enrollment Forecast 7 Graph: Census vs. Enrollment 8 Summary
Page Introduction 3 Graph: Enrollment Summary 4 Classroom Capacities and Enrollments 5 Enrollment History and Forecast Summary 6 Graph: Five Year Enrollment Forecast 7 Graph: Census vs. Enrollment 8 Summary
Burton Industrial Park 3983 Richlands Highway, Jacksonville, NC 28540
 Burton Industrial Park 3983 Richlands Highway, Jacksonville, NC 28540 Matt Ray Ray Properties, Inc. 3684-C Henderson Drive,Jacksonville, NC 28546 matt@rayproperties.com (910) 388-6620 License: 266827 Burton
STAFF REPORT CITY COUNCIL MEETING SEPTEMBER 15, 2015
 SHED BUSINESS a "making a positive difference now" TO: FROM: RE: STAFF REPORT CITY COUNCIL MEETING SEPTEMBER 15, 2015 Honorable Mayor and City Council Nancy Kerry, City Manager Discussion and Possible
BCA Benefits and Assumptions Summary
 2016 TIGER Application - Plymouth Multimodal BCA Benefits and Assumptions Summary The Plymouth Multimodal generates a variety of benefits, ranging from monetary such as increased transit fare revenue,
Office Bldg. Class "A" Suites- N. Fro
 Office Bldg. Class "A" Suites- N. Fro Presented by Realty Management Associates, LLC Property Details Harrisburg-Class A Office Building. Three story building with covered private parking on first floor.