Development of Iowa Dot Combination Bridge Separation Barrier with Bicycle Railing
|
|
|
- Madeleine Owen
- 5 years ago
- Views:
Transcription

1 University of Nebraska - Lincoln DigitalCommons@University of Nebraska - Lincoln Engineering Mechanics Dissertations & Theses Mechanical & Materials Engineering, Department of Development of Iowa Dot Combination Bridge Separation Barrier with Bicycle Railing Chaz M. Ginger University of Nebraska-Lincoln, chazg1@yahoo.com Follow this and additional works at: Part of the Automotive Engineering Commons, Computer-Aided Engineering and Design Commons, Structural Engineering Commons, and the Transportation Engineering Commons Ginger, Chaz M., "Development of Iowa Dot Combination Bridge Separation Barrier with Bicycle Railing" (2018). Engineering Mechanics Dissertations & Theses This Article is brought to you for free and open access by the Mechanical & Materials Engineering, Department of at DigitalCommons@University of Nebraska - Lincoln. It has been accepted for inclusion in Engineering Mechanics Dissertations & Theses by an authorized administrator of DigitalCommons@University of Nebraska - Lincoln.
2 DEVELOPMENT OF IOWA DOT COMBINATION BRIDGE SEPARATION BARRIER WITH BICYCLE RAILING by Chaz M. Ginger A THESIS Presented to the Faculty of The Graduate College at the University of Nebraska In Partial Fulfillment of Requirements For the Degree of Master of Science Major: Mechanical Engineering and Applied Mechanics Under the Supervision of Professor John D. Reid Lincoln, Nebraska August, 2018
3 DEVELOPMENT OF IOWA DOT COMBINATION BRIDGE SEPARATION BARRIER WITH BICYCLE RAILING Chaz M. Ginger, M.S. University of Nebraska, 2018 Advisor: John D. Reid The Iowa Department of Transportation typically builds separation barriers between vehicle and pedestrian/bicycle facilities when sidewalks or trails are present on vehicular bridges. Currently, Iowa DOT employs a combination bridge rail that utilizes a concrete parapet that previously had been successfully evaluated to National Cooperative Highway Research Program (NCHRP) Report 350 Test Level 4 (TL-4) criteria for these situations. While the parapet had been successfully evaluated, the combination bridge rail system as a whole had not been evaluated to any crash test standards. Iowa DOT desired that researchers at Midwest Roadside Safety Facility (MwRSF) design and test a combination bridge separation barrier to current Manual for Assessing Safety Hardware (MASH) TL-2 standards to use in place of their current, untested system. During this effort, previous combination rails, low-height vertical parapets, and zone of intrusion (ZOI) studies were reviewed to provide guidance on system design. A simulation effort was also performed to aid in height selection of the parapet, as well as placement of the attached bicycle rail to reduce the amount of negative vehicle-to-rail interaction with the system. Using the information gathered during the review of previous systems and simulation effort, a full system design was produced. It was then
4 recommended that the proposed system be evaluated to MASH test designation 2-11 in order to assess the system s performance during a vehicle impact scenario.
5 ACKNOWLEDGEMENTS First, I would like to thank my advisor Dr. John Reid and Midwest Roadside Safety Facility for allowing me to continue my education under their tutelage. The knowledge and experience I gained during my time as a graduate student at MwRSF was beyond invaluable and I am, and forever will be, very grateful for that. I want to thank both of my parents for providing me with everything I needed to be successful in whatever I have done. My accomplishments are a product of their guidance and they deserve majority of this credit. I would like to thank my professors at Hastings College, Dr. Steven Bever and Dr. Jim Dugan, for the education they provided me. I could not imagine myself reaching this point without their enthusiasm and dedication to the education of their students. To the graduate students and full-time staff, thank you for any help you have given to me. I really enjoyed my time at MwRSF because of you guys. Finally, I want to thank the two most important people in my life, Tayce and our beautiful daughter, Greer. You two were amazing during this whole process and you are the ones who drive me to continue to better myself. This journey would be very difficult without you two by my side.
6 TABLE OF CONTENTS ACKNOWLEDGEMENTS... i TABLE OF CONTENTS... ii LIST OF FIGURES...v LIST OF TABLES... ix CHAPTER 1. INTRODUCTION Background and Problem Statement Objective Scope... 5 CHAPTER 2. LITERATURE REVIEW Pedestrian/Bicycle Railings Vertical/Low-Height Parapets Vehicle Intrusion CHAPTER 3. LS-DYNA SIMULATION Introduction Validation Effort Introduction Background Vehicle Model Baseline Models NCAC Simulation UNL Simulation UNL 10x Simulation Initial Modeling Conclusion Model Refinement Model Friction Conclusion Elastic Barrier Conclusion Barrier Height Study Introduction in. Barrier Height Simulation in. Barrier Height Simulation in. Barrier Height Simulation in. Barrier Height Simulation Height Simulations Comparison Conclusion... 70
7 CHAPTER 4. VEHICLE DIMENSIONS/HEIGHT STUDY AND COMPARISON P vs Silverado Model Purpose Comparison of Results NCHRP 350 TL-2 Systems vs. 2270P Purpose NCHRP 350 vs MASH Test Selection and Process Results Conclusion CHAPTER 5. PEDESTRIAN/BICYCLE RAIL DESIGN Iowa DOT Requirements LRFD Pedestrian/Bicycle Railing Design Loading Rail and Post Design Concepts Rail and Post Connection Concepts Concept Selection Post and Rail Calculations Longitudinal Rail Element Vertical Post Element Baseplate Calculations Loading Required Thickness Post Offset Post-Rail and Post-Baseplate Connection Calculations Post-Baseplate Loading Weld Calculations Anchor Rod Calculations Splice Tube Parapet Details Preliminary Design Details for Full System Simulation Effort CHAPTER 6. FULL SYSTEM SIMULATION Introduction System Model Simulation Results CIP Determination Post Deformation Vehicle Change In Velocity Lateral Vehicle Overlap CIP Determination Conclusion Additional Simulation Analysis Anchor Rod Forces
8 6.5.2 Splice Tube Capacity Splice Tube Bolt Forces Conclusion CHAPTER 7. COMBINATION TRAFFIC/BICYCLE RAIL DESIGN DETAILS CHAPTER 8. SUMMARY AND RECOMMENDATIONS Summary Recommendations CHAPTER 9. REFERENCES CHAPTER 10. APPENDICES Appendix A. Rail Design Calculation
9 LIST OF FIGURES Figure 1. Iowa DOT Standard Separation Barrier (in service)...2 Figure 2. Iowa DOT Alternate Separation Barrier (in service)...3 Figure 3. C411 Combination Rail [4-5]...6 Figure 4. BR27D Bridge Railing on Bridge Deck [7]...9 Figure 5. BR27C Bridge Railing on Bridge Deck [8]...10 Figure 6. Illinois with Added Pedestrian/Bicycle Railing [11]...11 Figure 7. Type 80 SW Bridge Railing [12]...12 Figure 8. Minnesota Combination Traffic/Bicycle Rail [13]...13 Figure 9. Missouri Combination Rail with Four Rail Elements [14]...14 Figure SW Bridge Rail [15]...15 Figure 11. Intrusion Zones for Tall TL-2 Barriers 27 inches and for Short TL-2 Barriers < 27 inches [31]...23 Figure 12. Downstream Sequential Views, NCAC Model and Test No Figure 13. Downstream Sequential Views, NCAC Model and Test No Figure 14. Downstream Sequential Views, UNL Model and Test No Figure 15. Downstream Sequential Views, UNL Model and Test No Figure 16. Downstream Sequential Views, UNL 10x Model and Test No Figure 17. Downstream Sequential Views, UNL 10x Model and Test No Figure 18. Roll Comparison for Modified Friction Models...34 Figure 19. Pitch Comparison for Modified Friction Models...34 Figure 20. Yaw Comparison for NCAC, UNL, and UNL 10x Simulations...35 Figure 21. Downstream Sequential Views, UNL 10xr2 Model and Test No Figure 22. Downstream Sequential Views, UNL 10xr2 Model and Test No Figure 23. Downstream Sequential Views, UNL 10xr3 Model and Test No Figure 24. Downstream Sequential Views, UNL 10xr3 Model and Test No Figure 25. Longitudinal Change in Velocity Comparison for Modified Friction Simulations...42 Figure 26. Downstream Sequential Views, UNL 10xr4 Model and Test No Figure 27. Downstream Sequential Views, UNL 10xr4 Model and Test No Figure 28. Roll Comparison for Modified Friction Models...46 Figure 29. Pitch Comparison for Modified Friction Models...46
10 Figure 30. Yaw Comparison for Modified Friction Models...47 Figure 31. Roll Comparison for Elastic Barrier Models...50 Figure 32. Pitch Comparisons for Elastic Barrier Models...51 Figure 33. Yaw Comparison for Elastic Barrier Models...51 Figure 34. Elastic Barrier Simulations-Impact Forces Comparison...53 Figure 35. Downstream Sequential View, 24-in. Tall Barrier Simulation...56 Figure in. Barrier Height Simulation ZOI Envelope...57 Figure 37. Downstream Sequential View, 25-in. Tall Barrier Simulation...59 Figure in. Barrier Height Simulation ZOI Envelope...60 Figure 39. Downstream Sequential View, 26-in. Tall Barrier Simulation...62 Figure in. Barrier Height Simulation ZOI Envelope...63 Figure 41. Downstream Sequential View, 27-in. Tall Barrier Simulation...65 Figure in. Barrier Height Simulation ZOI Envelope...66 Figure 43. Height Simulations Vehicle Dynamics Comparison...68 Figure 44. ZOI Comparison for Height Study Simulations, Front (Left) and Rear of Vehicle (Right)...70 Figure 45. RSMG-1 Vehicle Dimension Comparison...82 Figure 46. RSMG-2 Vehicle Dimension Comparison...82 Figure 47. LPBR-1 Vehicle Dimension Comparison...83 Figure 48. AASHTO LRFD Pedestrian/Bicycle Rail Loading [3]...86 Figure 49. Rail Design Concepts...88 Figure 50. Fully-Bolted Connection Concept...90 Figure 51. Fully-Welded Connection Concept...91 Figure 52. Combination Connection Concept...91 Figure 53. Example of Pedestrian/Bicycle Rail with Vertical Concentrated Load..94 Figure 54. Rail Force Diagram to Maximize Bending...95 Figure 55. Rail Force Diagram to Maximize Shear...96 Figure 56. Post Force Diagram Figure 57. AISC Steel Design Guide Column Baseplate Loading General Case [40] Figure 58. Baseplate Simplified Traffic Impact (Top) and Pedestrian/Bicycle Loading (Bottom) Figure 59. Post Vehicle Impact Loading Figure 60. Post-Baseplate Front-Flange Weld Tension Diagram Figure 61. Rail-Post Rear-Flange Weld Tension Figure 62. Concrete Area of Influence for Two Adjacent Anchors on Concrete Parapet [42] Figure 63. Comparison of ACI Concrete Breakout and Hybrid Failure Assumptions Figure 64. Typical Splice Tube Detail Figure 65. Standard Built-up Section Cross Section Figure 66. Splice Tube Parallel Plates Configuration for Section Modulus Calculation...122
11 Figure 67. Splice Tube Perpendicular Plates Configuration for Section Modulus Calculation Figure 68. ASTM A572 Model Stress-Strain Curve Comparison Figure 69. Post-Baseplate and Anchor Rod Connection Figure 70. Splice Tube Bolt Model Figure 71. Splice Tube Bolt Assembly with No Preload (Left) and with Preload (Right) Figure 72. Combination Rail Model Figure 73. Combination Rail Close-Up Figure 74. Combination Rail Front-View Figure 75. Full Impact Model Top-View Figure 76. Downstream Sequential Views, Impact 4.3 ft US from Post No. 7 Simulation Figure 77. Post Snag Sequential Views, Impact 4.3 ft US from Post No. 7 Simulation Figure 78. Downstream Sequential Views, Impact 3.3 ft US from Post No. 7 Simulation Figure 79. Post Snag Sequential Views, Impact 3.3 ft US from Post No. 7 Simulation Figure 80. Downstream Sequential Views, Impact 1.7 ft US from Post No. 7 Simulation Figure 81. Post Snag Sequential Views, Impact 1.7 ft US from Post No. 7 Simulation Figure 82. Downstream Sequential Views, Impact 2.6 ft US from Splice Simulation Figure 83. Downstream Sequential Views, Impact 2.6 ft US from Splice Reversed Simulation Figure 84. Post Snag Sequential Views, Impact 2.6 ft US from Splice Reversed Simulation Figure 85. Downstream Sequential Views, Impact 3.8 ft US from Splice Simulation Figure 86. Downstream Sequential Views, Impact 3.3 ft US from Splice Simulation Figure 87. Post Snag Sequential Views, Impact 3.8 ft US from Splice Simulation Figure ft US Post No. 7 Fender Damage Figure ft US Post No. 7 Fender Damage Figure ft US Post No. 7 Fender Damage Figure ft US Post No. 7 Fender Damage Figure ft US Splice Reversed. Fender Damage Figure ft US Splice Fender Damage Figure 94. Longitudinal and Lateral Vehicle Change in Velocity Comparison...153
12 Figure 95. Longitudinal and Lateral Resultant Vehicle Change in Velocity Comparison Figure 96. Iowa Bicycle Rail System Layout Figure 97. Iowa Bicycle Rail System Cross Section Figure 98. Iowa Bicycle Rail Rail and Concrete Parapet Details Figure 99. Iowa Bicycle Rail Rail and Concrete Parapet Details Figure 100. Iowa Bicycle Rail Splice Plate Assembly Figure 101. Iowa Bicycle Rail Splice Plate Component Details Figure 102. Iowa Bicycle Rail Rail and Post Assembly Figure 103. Iowa Bicycle Rail Rail Details Figure 104. Iowa Bicycle Rail System Post and Base Plate Details Figure 105. Iowa Bicycle Rail Concrete Parapet Assembly Details Figure 106. Iowa Bicycle Rail Concrete Parapet Assembly Details Figure 107. Iowa Bicycle Rail Concrete Parapet Reinforcement Figure 108. Iowa Bicycle Rail Hardware Figure 109. Iowa Bicycle Rail Bill of Materials Figure A-1. Baseplate Additional Calculations Figure A-2. Tensile Adhesive Anchorage Calculations Figure A-3. Shear Adhesive Anchorage Calculations Figure A-4. Built-Up Splice Tube Section Moduli Calculations...199
13 LIST OF TABLES Table 1. Previously-Tested Combination Rails...7 Table 1. Previously-Tested Combination Rails (cont d.)...8 Table 2. Vertical/Low-Height Parapet Review Relevant System Details...18 Table 2. Vertical/Low-Height Parapet Review Relevant System Details (cont d.).19 Table 3. Guidelines for Attachments-Relevant Systems [31]...21 Table P vs. Silverado Model Dimensions...74 Table P vs. 2000P Details...77 Table P Test Vehicle Dimensions...78 Table 7. Post Lateral and Longitudinal Deflections Table 8. Vehicle Post Overlap Table 9. US and DS Anchor Rod Forces Table ft US from post No. 7, Splice Bolt Shear Forces Table A-1. Rail and Post - Shear and bending Moment Values Table A-2. Rail Section Details Table A-3. Post Section Details Table A-4. Rail and Post - Load vs. Resistance Comparisons Table A-5. Rail and Post - Load and Capacity Calculations Table A-6. AISC Baseplate Design Guide Calculations Table A-7. Weld - Load and Capacity Calculations Table A-8. Weld Connection Load vs. Resistance Comparisons...196
14 CHAPTER 1. INTRODUCTION Background and Problem Statement The Iowa Department of Transportation (IaDOT) typically builds separation barriers between vehicle and pedestrian/bicycle facilities when sidewalks or trails are present on vehicular bridges. In order to meet American Association of State Highway and Transportation Officials (AASHTO) specifications, steel railings must be attached to crashworthy traffic barriers to achieve a minimum total system height above the trail surface of 42 in. (1,067 mm) for bicyclists. Public demand has encouraged the Iowa DOT to also install railing separators when only a pedestrian sidewalk is present. Recently constructed separation barriers have included the bicycle railing hardware; since, it is assumed that bicyclists will use sidewalks that do not meet minimum criteria required in the design of official bike facilities. In the past, the Iowa DOT has employed standard separation barrier details consisting of a 34-in. (864-mm) tall safety shape concrete barrier with a steel railing attached to its top surface, as shown in Figure 1. However, no evidence has been found that this combined configuration has been crash tested to any test level with the steel attachments in place. The complete system does not appear in the current National Cooperative Highway Research Program (NCHRP) Report 350 [1] collection of crashworthy barriers.
 Since 1999, the Iowa DOT has preferred the use of a vertical-face concrete barriers for low-speed (45 MPH or less) roadway bridges as separation")
15 2 Figure 1. Iowa DOT Standard Separation Barrier (in service) Since 1999, the Iowa DOT has preferred the use of a vertical-face concrete barriers for low-speed (45 MPH or less) roadway bridges as separation barriers between vehicles and pedestrian facilities in and near urban areas. The 34-in. (864-mm) tall, 10-in. (254-mm) wide vertical-face concrete barrier shape used on these projects, as shown in Figure 2, is based on a 32-in. (813 mm) tall barrier approved under NCHRP Report 350 for Test Level 4 (TL-4) conditions, even though the conditions in which this system is used would allow for a TL-2 compliant system.
16 3 Figure 2. Iowa DOT Alternate Separation Barrier (in service) Vertical-face barriers are favored by such entities as Federal Highway Administration (FHWA) and Midwest Roadside Safety Facility (MwRSF) when the total system height is 32 in. (813 mm) or less, because of performance benefits of decreased vehicle rollover and reduced vehicle climbing. The reduced height also decreases the probability that the head of vehicle occupants comes into contact with the barrier during head ejection, also known as head slap. Additionally, in urban areas, separation barriers frequently become obstructions to sight distance, which encourages designers to seek shorter-height barriers for these cases. The location and design of these railing attachments play a crucial role in the safety performance of the total barrier system. Poorly placed and/or designed railing
17 4 attachments could lead to excessive vehicle snag, which could lead to excessive vehicle roll or occupant risk. Also, railings placed incorrectly could lead to an occurrence of head slap, which is when the occupants head extends outside of the vehicle and comes into contact with the system. While crashworthy traffic barriers are being used, the Iowa DOT currently has no complete vehicle/pedestrian separation barrier system that is documented as fully crashworthy in accordance with NCHRP Report 350 or AASHTO s Manual for Assessing Safety Hardware (MASH) [2]. The minimum safe heights for vertical parapets under MASH criteria have not been fully evaluated and defined. Previous testing of TL-2 low-height, vertical barriers under NCHRP 350 indicated that vertical parapets as low as 20 in. (508 mm) have been acceptable. However, the increased center of gravity (CG) height of the 2270P vehicle makes the parapet height unlikely to perform as well under the MASH criteria. Thus, heights greater than 20 in. (508 mm) may be necessary to meet the MASH TL-2 impact safety standards. Verification of a TL-2 low-height, vertical-face, traffic barrier with attached bicycle railing would provide a barrier option for projects where only a pedestrian railing is necessary and could help alleviate sight distance concerns in urban areas. 1.2 Objective The objective of the research project was to develop a MASH TL-2 crashworthy, low-height, vertical-face, traffic barrier with an attached crashworthy bicycle railing. The barrier itself was desired to provide the ability to be used in standard applications as well as allow for the crashworthy bicycle railing to be added as needed. The design was to
18 minimize the height of the concrete barrier portion of the system, while providing 5 improved visibility and sightlines. In addition, the new railing system was to comply with current AASHTO LRFD guidance for bicycle railings with respect to the parapet and combination railing [3]. 1.3 Scope The research objective was achieved by performing several tasks. First, a literature review was conducted on previous crash tests involving bicycle/pedestrian rails, systems utilizing a vertical-face and/or low-height barrier, and Zone of Intrusion (ZOI) studies. All the systems were reviewed, and details were compiled to help aid in the design process. Next, a simulation effort was performed to determine the minimum parapet height that could be used in order to safely redirect the impacting vehicle, with 24 in. (610 mm) being the minimum height that could be achieved. Once the minimum height was determined, design of rail concepts were generated and evaluated. Simulations of the preferred parapet height with the added bicycle rails were performed in order to help determine which design would provide the minimum amount of negative vehicle interaction, such as vehicle snagging and head slap, while still being cost effective. A final design was chosen, and recommended for full-scale crash testing according to MASH test no. 2-11, which involves a 5,000-lb (2270-kg) pickup truck impacting the combination rail at 44 mph (70 km/h) and 25-degree impact angle.

19 CHAPTER 2. LITERATURE REVIEW Pedestrian/Bicycle Railings Historically, limited research has been performed on the development and crash testing of pedestrian/bicycle railings. Specifically, eight pedestrian/bicycle railings have been evaluated through full-scale crash testing and are listed in Table 1. The first of the previously-tested pedestrian/bicycle railings was the C411 bridge rail, as shown in Figure 3. The C411 barrier was a 42 in. (1,067 mm) tall by 12 in. (305 mm) thick reinforced concrete barrier with 6-in. (152-mm) wide by 28-in. (711-mm) high openings at 18 in. (457 mm) center-to-center longitudinal spacing [4-5]. After two fullscale crash tests, the system was determined to be acceptable according to the Performance Level 1 (PL-1) criteria established in the 1989 AASHTO Guide Specifications for Bridge railings [6]. Figure 3. C411 Combination Rail [4-5]
20 7 Table 1. Previously-Tested Combination Rails System [ref #] Test No. Vehicle Test Level Parapet Details Railing Details Shape Height Width Post Rail Pass/ Fail Failure Mechanism C411 [4-5] BR27D [7-9] BR27C [8,10] Small Pass Car AASHTO Vertical 42 in. 12 in. None None PL-1 Aesthetic Sedan Pass Small Vertical Car mounted 4" x 4" x 1/4" Pass on A500 Grade 4" x 4" x Pickup AASHTO sidewalk B, 42" Pass 18 in. 10 in. 3/16" A500 Small PL-1 overall Vertical Grade B Car height, Two Pass on bridge elements Pickup deck Pass Small Vertical Pass Car mounted Pickup 4" x 4" x 1/4" on Pass SUT sidewalk 4" x 4" x AASHTO Pass 24 in. 10 in. PL-2 Small Car 3/16" A500 Grade B A500 Grade B, 42" overall height, One element Pass Vertical Pickup on bridge Pass deck SUT Pass None None None Illinois [11] Small Car AASHTO PL-1 Tubular Steel on 6" curb 25 in in. 2" x 3" x 3/16" Tubular steel 2" x 3" x 3/16" Tubular steel, Two elements, 54" overall height Pass None
21 8 Table 1. Previously-Tested Combination Rails (cont d.) System [ref #] Type 80SW [12] MnDOT Combination Bridge Rail [13] MoDOT Combination Bridge Rail [14] 732SW [15] Test No. Vehicle Test Parapet Details Railing Details Pass/ Level Shape Height Width Post Rail Fail Small 541 Beam Car 20.7 Pass NCHRP and Post Tubular steel rail, 42" 32 in. base, Pickup 350 TL-4 on overall height Pass top 543 SUT sidewalk Pass 4" x 2" x 3" x 2" x 1/8 MNPD-1 Pickup 18 1/8" A500 " A500 Grade Pass NCHRP New 32 in. base, 9 in. Grade B, B, Two 350 TL-4 Jersey MNPD-2 top 120" post elements, 54" Pass spacing overall height 3" x 2" x 1/4" A500 Grade MOBR-1 Pickup B, Three Fail elements, 54" overall height MOBR-2 130MAS H3P MAS H3C MAS H2C14-01 Pickup Pickup Small Car Small Car NCHRP 350 TL-4 MASH TL-3 MASH TL-2 Single Slope Vertical 32 in. 32 in. Standard Single Slope 9 base, 12 top 4" x 2" x 1/4" A500 Grade B, 120" post spacing 3" x 2" x 1/4" A500 Grade B, Four elements, 54" overall height Tubular steel pedestrian handrail, 43" overall height above bridge deck Fail Pass Fail Pass Failure Mechanism None None Vehicle snagged rail causing vehicle rollover None Occupant risk values exceeded limits None
![The second system, the BR27D, as shown in Figure 4, consisted of two 9 horizontal, tubular steel rails supported by vertical, tubular steel posts attached to a rectangular concrete barrier [7-9].](/docs-images/96/128525615/images/22-0.jpg "The BR27D employed an 18-in. (457-mm) tall, vertical-faced concrete parapet with an attached steeling railing creating an overall height of 42 in. (1,067 mm).")
22 The second system, the BR27D, as shown in Figure 4, consisted of two 9 horizontal, tubular steel rails supported by vertical, tubular steel posts attached to a rectangular concrete barrier [7-9]. The BR27D employed an 18-in. (457-mm) tall, vertical-faced concrete parapet with an attached steeling railing creating an overall height of 42 in. (1,067 mm). The system was constructed in two configurations, one with a raised concrete sidewalk and one without. Two full-scale crash tests were utilized to evaluate each configuration. The system was deemed acceptable according to AASHTO PL-1 criteria [6]. Figure 4. BR27D Bridge Railing on Bridge Deck [7]
 tall rectangular concrete barrier [8,10] The system was also constructed with and without a raised sidewalk.")
23 10 The third pedestrian/bicycle railing, the BR27C, as shown in Figure 5, consisted of a single horizontal, tubular steel rail supported by vertical, tubular steel posts and was attached to a 24-in. (610-mm) tall rectangular concrete barrier [8,10] The system was also constructed with and without a raised sidewalk. The BR27C was determined to be acceptable according to the AASHTO PL-2 criteria based on a total of six full-scale tests, three for each configuration [6]. Figure 5. BR27C Bridge Railing on Bridge Deck [8]
![11 The fourth design, as shown in Figure 6, consisted of two horizontal, tubular steel rails and vertical, tubular steel posts attached to the Illinois 2399-1 traffic railing system [11].](/docs-images/96/128525615/images/24-0.jpg "The system was determined to be acceptable according to AASHTO PL-1 criteria based on one full-scale crash test [6]. Figure 6. Illinois 2399-1 with Added Pedestrian/Bicycle Railing [11]")
24 11 The fourth design, as shown in Figure 6, consisted of two horizontal, tubular steel rails and vertical, tubular steel posts attached to the Illinois traffic railing system [11]. The system was determined to be acceptable according to AASHTO PL-1 criteria based on one full-scale crash test [6]. Figure 6. Illinois with Added Pedestrian/Bicycle Railing [11]
 tall by 59.1 in. (1500 mm) wide sidewalk [12].")
25 The fifth system, the Type 80SW, as shown in Figure 7, consisted of a single 12 tubular pedestrian handrail mounted atop an aesthetic, see-through concrete bridge rail with a 8.9 in. (225 mm) tall by 59.1 in. (1500 mm) wide sidewalk [12]. A total of four crash tests were performed on this system under NCHRP Report 350 TL-4 criteria, two with a small car, one with a pickup, and one with a single-unit truck. After testing, the system was recommended for Test Level two (TL-2) use due to the railing being a snagging hazard at higher speeds as well as to provide better protection for pedestrians. Figure 7. Type 80 SW Bridge Railing [12]
![13 The sixth pedestrian/bicycle railing, the Minnesota Combination Traffic/Bicycle Rail, as shown in Figure 8, was designed for use with the standard New Jersey safety shape bridge rail [13].](/docs-images/96/128525615/images/26-0.jpg "The system utilized two longitudinal, tubular steel rails with tubular, breakaway steel posts as vertical supports.")
26 13 The sixth pedestrian/bicycle railing, the Minnesota Combination Traffic/Bicycle Rail, as shown in Figure 8, was designed for use with the standard New Jersey safety shape bridge rail [13]. The system utilized two longitudinal, tubular steel rails with tubular, breakaway steel posts as vertical supports. One wire rope cable was strung through each longitudinal tube to prevent the railing from falling below the concrete barrier after impact. In addition, solid vertical spindles ran between the upper and lower longitudinal rails. The system successfully met the NCHRP Report No. 350 TL-4 criteria by passing full-scale crash tests with both a pickup truck and a single-unit truck. Figure 8. Minnesota Combination Traffic/Bicycle Rail [13]
![14 The seventh system, the Missouri Combination Rail, as shown in Figure 9, was designed to be used on a single slope, concrete barrier [14].](/docs-images/96/128525615/images/27-0.jpg "Originally, the system consisted of a top mounted pedestrian rail that utilized three longitudinal members.")
27 14 The seventh system, the Missouri Combination Rail, as shown in Figure 9, was designed to be used on a single slope, concrete barrier [14]. Originally, the system consisted of a top mounted pedestrian rail that utilized three longitudinal members. This system was tested under NCHRP 350 TL-4, but it did not meet criteria as the vehicle did not remain upright during the test. The vehicle snagged on the horizontal members of the rail, causing the climb of the vehicle to be restricted. The climb restriction caused the vehicle to encounter significant roll as it exited the system, and subsequently rolled over. The system was redesigned with a fourth longitudinal member and retested. During testing, the impacting vehicle experienced snagging, and the vehicle rolled once again. Figure 9. Missouri Combination Rail with Four Rail Elements [14]
 tall by 98 in. (2,489 mm) wide sidewalk [15]. After a total of 3 crash tests, two at TL-3 and one at TL-2, the system was determined to be acceptable for TL-2 conditions under MASH [2].")
28 15 The eighth and final traffic/pedestrian railing, the 732SW, as shown in Figure 10, consisted of a 32-in. (813-mm) tall vertical, concrete barrier with a top-mounted pedestrian handrail and a 8 in. (203 mm) tall by 98 in. (2,489 mm) wide sidewalk [15]. After a total of 3 crash tests, two at TL-3 and one at TL-2, the system was determined to be acceptable for TL-2 conditions under MASH [2]. Figure SW Bridge Rail [15] For the reviewed systems, only the 732SW, designed by CALTRANS, was tested to the MASH TL-2 criteria. The 732SW system did not employ a low-height parapet. The systems that were considered to be the most relevant to this project were the BR27C and BR27D as they both used low-height, vertical parapets. However, these systems are
29 outdated as they were tested to PL-1 and PL-2 test conditions. Based on the literature 16 review, limited guidance was gained as none of the systems matched the desired system very well. 2.2 Vertical/Low-Height Parapets There existed a desire to determine the minimum parapet height greater than or equal to 24 in. (610 mm) that was capable of meeting the MASH TL-2 criteria. Thus, it was deemed necessary to also review the results from past crash-tested systems that utilize vertical parapets. Systems utilizing a height lower than the standard 32 in. (813 mm) were given special attention. This review was performed to aid in determining parapet geometries that would contain the vehicle without causing rollover or override of the barrier, while producing an acceptable level of occupant risk. Unlike safety shape barriers, which more easily allow for impacting vehicles to climb up the face of the parapet, vertical parapets do not allow for the same degree of vehicle climb. This reduced vehicle climb translates into higher vehicle deformations, lateral vehicle accelerations, as well as increased occupant risk under the same impact conditions. When using a low-height, vertical parapet, the propensity for the vehicle to roll toward the barrier increases as height decreases. This finding is due to the fact that the CG of the vehicle is higher with respect to the barrier. In some cases, the CG can actually be higher than that of the barrier. This fact could lead to excessive roll angles, or even complete rollover of the impacting vehicle. If the barrier height is too low, the impacting vehicle could possibly traverse over the barrier, thus rendering the system useless.
30 17 From the 94 full-scale crash tests found and reviewed, a total of fourteen systems utilized a vertical-faced parapet with an overall height lower than 32 in. (813 mm). From these systems, none were tested at MASH TL-2 criteria, and only seven were successfully evaluated at comparable test levels (NCHRP 350 TL-2, AASHTO PL-1). All 14 systems were able to contain and redirect impacting vehicles without exceeding roll limit or occupant risk criteria, except for the T202 barrier which had some failures in certain test configurations. These fourteen systems are listed below in Table 2. The number of successfully-tested, low-height systems suggests that a parapet height between 24 in. (610 mm) and 32 in. (813 mm) could possibly provide adequate results. However, due to the increased CG height and vehicle mass of the 2270P versus the 2000P vehicle, which alters the vehicle s performance, further analysis is needed to select an appropriate barrier height.
31 18 Table 2. Vertical/Low-Height Parapet Review Relevant System Details System [ref. #] T202 [16-18] Stone Masonry Guardwall [19] Modified Kansas Corral [20] Artificial Stone Concrete Median Barrier [19] Iowa Steel Temporary Barrier Rail [21] Test No. Vehicle Test Level Impact Conditions Dynamic Pass/ Height Failure Speed Angle Deflection Fail (in.) Mechanism (mph) (deg.) (in.) Sedan NCHRP Pass None N/A Occupant Small Car Fail Compartment 0 Crush Small Car NCHRP Pass None Pickup TL Pass None Pickup Fail Vehicle Rollover Pickup Pass 30 None Small Car Pass None N/A Sedan NCHRP Pass 27 None N/A Sedan Pass None N/A KM-1 Small Car AASHTO PL-1 Pass 27 None KM-2 Pickup Small Car NCHRP Pass 27 None N/A Sedan I5-1 Pickup AASHTO PL Pass 29 None 17.6
32 19 Table 2. Vertical/Low-Height Parapet Review Relevant System Details (cont d.) System [ref. #] Nebraska Open Concrete Bridge Rail [22-24] TTI Low-Profile PCB [25] BR27D [7] BR27C [10] Tennessee Post and Beam [26] Masonry wall [19] Low-Profile Concrete Bridge Rail [27] FDOT Low Profile TCB [28] Rough Stone Masonry Guardwall [29-30] *N/A = Not available Test No. Vehicle Test Level Impact Conditions Dynamic Pass/ Height Failure Speed Angle Deflection Fail (in.) Mechanism (mph) (deg.) (in.) NEOCR-1 Pickup AASHTO PL-1 NEOCR-2 Pickup NEOCR-3 SUT NEOCR-4 SUT Pass 29 None 1.1 AASHTO PL-2 NEOCR-5 Pickup NEOCR-6 Pickup NIT-1 Pickup NCHRP 350 TL F-1 Pickup NCHRP 230 Pass 20 None 9901F-2 Small Car Small Car AASHTO PL-1 Pass 18 None Pickup Small Car AASHTO PL-2 Pass 24 None Pickup Small Car N/A NCHRP 230 Pass 27 None Pickup N/A Pickup NCHRP 350 TL Pass 27 None 0.6 LPBR-1 Pickup NCHRP 350 TL Pass 20 None N/A Pickup NCHRP 350 TL-2 Pass 18 None Small Car RSMG-1 Pickup NCHRP 350 TL Pass 22 None 0.25 RSMG-2 Pickup
33 2.3 Vehicle Intrusion 20 Previous crash tests of concrete barriers revealed a potential for the pickup truck to extend over the top of the parapet and contact any pedestrian/bicycle railing attached to the top of the existing bridge railing. Previously-tested systems and ZOI studies were reviewed to provide guidance on proper set back of pedestrian/bicycle rails to reduce chances of negative interaction between the vehicle and railing. ZOI is the maximum extent of any component past the top, front face of the barrier. Starting in 1999, researchers at MwRSF performed a comprehensive review of numerous systems to establish guidelines for placing attachments on bridge rails and median barriers [31]. It was desired to determine the ZOI of impacting vehicles on different parapet geometries so that an attachment could be placed either outside of the ZOI envelope or placed such that the negative interaction between the vehicle and attachment could be reduced to a minimum. From the systems reviewed by MwRSF researchers, six systems were determined to be relevant to this review. These systems all used a parapet height lower than the standard of 32 in. (813 mm) and were all tested at TL-2 or higher tests levels. The details, such as barrier height and maximum significant intrusion, for each of these systems are listed in Table 3. Values of vehicle intrusion were found using a combination of film and photographic analysis.
34 21 Table 3. Guidelines for Attachments-Relevant Systems [31] Barrier Class Barrier Name Barrier Height (in.) Test Level Equivalence Vehicle Max Significant Intrusion (in.) Vehicle Component Concrete with Sloped Face Low Profile Portable Concrete Barrier Federal Lands Modified Kansas Corral Bridge Rail 20 TL-2 27 TL-2 small car 12 hood/fender pickup 28 hood/fender small car 2 car side pickup 5 hood/fender Concrete with Vertical Face Nebraska Open Concrete Bridge Railing Nebraska Open Concrete Bridge Rail 29 TL-4 29 TL-2 pickup 16 leading box corner pickup 14 fender/leading box corner pickup 12 hood/fender pickup 12 hood/fender Concrete/Steel Combination Bridge Rails BR27C Bridge Railing on Deck 42 TL-4 BR27D Bridge Railing on Deck 42 TL-2 small car 0 none pickup 10 hood small car 0 none pickup 7 hood
35 For these systems, the Low-Profile, Portable Concrete Barrier had the highest 22 intrusion at a value of 28 in. (711 mm) for the pickup truck at a height of 20 in. (508 mm). This intrusion was relatively high due to the portable barrier not being rigid (i.e., barrier translated), thus the results cannot be directly applied to a rigid barrier of the same height. The Federal Lands Modified Kansas Corral Bridge Rail provided the lowest intrusion with a railing height of 27 in. (686 mm). The two combination rails, BR27C and BR27D, provided a maximum significant intrusion of 10 in. (254 mm) and 7 in. (178 mm), respectively. These two systems have an attached pedestrian/bicycle rail, so the intrusion could have been limited by that interaction, but both provided successful results with no snagging of the vehicle on the pedestrian/bicycle rail. After reviewing all of the systems, MwRSF provided general guidelines for attachments for each test level [31]. MwRSF showed that the intrusion zone extended 12 in. (305 mm) behind the front face of the barrier and extended a total of 78 in. (1981 mm) above the ground line for TL-2 barriers with a height greater than 26 in. (660 mm), as shown in Figure 11. Similarly, for TL-2 barriers that have a height lower than 27 in. (686 mm), the intrusion zone extended a total of 28 in. (711 mm) behind the front face and 78 in. (1,981 mm) above the ground line. Due to the lack of systems, the intrusion zone for the lower-height TL-2 barriers was generated from the review of the Low-Profile, Portable Concrete Barrier, which had much lower height than 27 in. (686 mm) at an overall railing height of 20 in. (508 mm).
36 23 Figure 11. Intrusion Zones for Tall TL-2 Barriers 27 inches and for Short TL-2 Barriers < 27 inches [31] Due to the lack of ZOI data for low-height systems, an appropriate rail setback cannot be established without further investigation. The guidelines provided by MwRSF for systems 27 in. (686 mm) or below, would require an unreasonable, large rail setback if no vehicle-rail interaction was desired. The two reviewed combination rails experienced some interaction with the rail but did not act as a snagging hazard. The results from those two systems and guidelines provided by MwRSF suggest that vehiclerail interaction cannot be avoided. The design of the upper railing would need to withstand vehicle contact without becoming a hazard to occupants or nearby pedestrians and bicyclists.
37 CHAPTER 3. LS-DYNA SIMULATION Introduction A study was performed using nonlinear, finite element analysis (FEA) to help determine a recommended height for the vertical parapet as well as help determine the extent at which the vehicle extends over the front face of the barrier to help aid in bicycle/pedestrian rail placement and design. LS-DYNA was the software code used for the simulation effort [32]. The simulation study was performed due to the lack of combination rails, low-height, vertical-face parapets previously tested, and the lack of information regarding ZOI for these systems. 3.2 Validation Effort Introduction Previous studies had been performed on low-height, vertical-faced parapets using NCHRP 350 criteria [1]. However, no previously-performed simulation efforts were found of vertical-faced parapets using MASH criteria. Thus, it was determined that a validation effort was necessary in order to build confidence in any conclusions or recommendations that would be made using the results from the FEA study Background To validate the model that was used for this research project, a TL-3 vertical-face parapet was simulated using full-scale crash test no [33]. The system, referred to as the T222 bridge rail, was developed by researchers at Texas A&M Transportation Institute (TTI) for use on their roadways. The system utilized a 32-in. (813-mm) tall parapet that was attached to the roadway using steel anchor plates, which produced an overall system height of 32¾ in. (832 mm). The T222 system was
38 considered the most relevant system for the validation effort on the grounds that it 25 employed a vertical-faced parapet, was tested under MASH criteria, and used the 2270P vehicle. During test no , the truck impacted the T222 barrier and was redirected safely. No wheel or suspension disengagement occurred, and all four tires remained inflated during the test. With respect to the barrier, a dynamic deflection of 2.1 in. (53 mm) was observed with no measured permanent set. Damage to barrier was minor and consisted of spalling, contact marks, and minor cracking Vehicle Model The vehicle model used for the simulation effort was based off of the National Crash Analysis Center (NCAC) 2270P Chevy Silverado model that had been previously modified by MwRSF personnel for roadside safety applications. The model used for this effort was the Version 3 Reduced Silverado model (V3r). During the validation process, friction, steering damping, barrier properties, and vehicle tire models were all varied in order to create a model that would accurately recreate what was observed in physical testing Baseline Models A total of three models with varying parameters were produced for the initial modeling of test no For the most part, the crash event that was simulated corresponded to the 3-11 test condition found in MASH, which involves a 5,000-lb (2270-kg) pickup truck impacting at 62 mph (100 km/h) and 25 degrees. Rigid shell elements were used to model the 32-in. (813-mm) tall T222 bridge rail. All the nodes of
39 the barrier were constrained from any translational or rotational motion. Modeling the 26 barrier in such a way allowed for no deformation and no deflection of the barrier. The first simulation performed involved the Silverado model with the original NCAC tire model. This model is referred to as the NCAC model. The tire model used within the NCAC model is considered a stable option but provides less accuracy as the tire model is overly stiff compared to actual tires. The second model of the Silverado utilized the UNL tire model (UNL model). The UNL tire model is generally less stable but provides a softer response, closer to that seen in physical testing of tires. Finally, the third model (UNL 10x model) created still used the UNL model, but the steering damping was increased by 10 times the value used in the previous models. The data and results from the simulations of each of the three models were compared with physical testing based on video comparison and transducer data. The models were also compared with respect to one another in order to choose the most accurate model NCAC Simulation Analysis of the simulation for the T222 impacted by the V3r model using the NCAC tire model found that the NCAC model did not provide the best correlation with test no Comparison of the high-speed video, as shown in Figures 12 and 13, found that the V3r with NCAC tire model displayed increased vehicle roll, pitch, and yaw as compared to the full-scale crash test. This finding was confirmed by comparison of the rate gyro data between the simulation and testing. Additionally, the front wheels of the NCAC model tended to steer toward the barrier, while the front wheels in test no remained relatively straight.
40 27 Time = sec Time = sec Time = sec Time = sec Figure 12. Downstream Sequential Views, NCAC Model and Test No

41 28 Time = sec Time = sec Time = sec Time = sec Figure 13. Downstream Sequential Views, NCAC Model and Test No
42 3.2.6 UNL Simulation 29 A simulation using the UNL tire model in place of the NCAC tire model was performed and analyzed. The UNL model provided better roll and pitch comparison to full-scale test no as compared with the NCAC model. While the roll and pitch values were improved by switching tire models, the change caused the yaw to actually worsen. Comparison of the UNL model with test no is shown in Figures 14 and UNL 10x Simulation A third simulation was performed and analyzed, which used the UNL tire model while increasing the steering damping by a factor of 10. Analysis showed that the pitch and yaw were significantly improved over the UNL and NCAC models. However, the roll observed during the UNL 10x simulation was worse when compared to the UNL model. Comparison of the UNL 10x simulation and test no can be seen in Figures 16 and 17. Roll, pitch, and yaw comparison between the NCAC, UNL, and UNL 10x models can all be seen in Figures 18 through 20.
43 30 Time = sec Time = sec Time = sec Time = sec Figure 14. Downstream Sequential Views, UNL Model and Test No
44 31 Time = sec Time = sec Time = sec Time = sec Figure 15. Downstream Sequential Views, UNL Model and Test No
45 32 Time = sec Time = sec Time = sec Time = sec Figure 16. Downstream Sequential Views, UNL 10x Model and Test No
46 33 Time = sec Time = sec Time = sec Time = sec Figure 17. Downstream Sequential Views, UNL 10x Model and Test No
47 PITCH ANGLE [DEG.] ROLL ANGLE [DEG.] 34 ROLL COMPARISON T222 NCAC UNL UNL 10x TIME [S] Figure 18. Roll Comparison for Modified Friction Models PITCH COMPARISON T222 NCAC UNL UNL 10x TIME [S] Figure 19. Pitch Comparison for Modified Friction Models
48 YAW ANGLE [DEG.] 35 YAW COMPARISON T222 NCAC UNL UNL 10x TIME [S] Figure 20. Yaw Comparison for NCAC, UNL, and UNL 10x Simulations Initial Modeling Conclusion The main difference observed between the models was the vehicle s roll, pitch, and yaw, as the variances in the rest of the data analyzed were considered negligible. Based on that finding, it was determined to choose the best model that gave the best overall results with respect to roll, pitch, and yaw. Comparing the models, the NCAC model was not selected for further refinement; since, its roll and pitch performance was the worst out of the three and for also providing the second worst yaw performance. The UNL model was determined to be the second worst as it provided the worst overall yaw and second worst pitch. However, the UNL model did provide the best roll comparison, but it was determined that yaw performance was more critical. Finally, the UNL 10x
49 36 model was determined to be the best as it provided the best overall pitch, acceptable roll, and was the only model in which the vehicle did not yaw back into the barrier Model Refinement After analysis of the first three initial models, it was determined that further refinement was needed as the models did not replicate test data as accurately as desired. To improve the performance of the simulation, two main ideas were suggested, the first being to modify the friction parameters within the simulation, and the second being to model the barrier as elastic to try and replicate the dynamic deflection and impact forces observed in physical testing. All refinements were applied to the UNL 10x model as it provided the best overall performance during the initial modeling Model Friction During a previous effort performed by MwRSF researchers, it was shown that decreasing vehicle to ground friction resulted in a decrease in roll and pitch. Due to this result, the same friction change was applied to the model in hopes to produce a similar effect. Specifically, the vehicle to ground friction was decreased from 0.9 to 0.4. Observation of the tire to ground interaction in previous models seemed to show the impacting tire behaving in an unrealistic manner as the simulation progressed, such as irregular oscillation in the right-front tire and suspension components. This finding was assumed to be attributed to the vehicle to ground friction and that decreasing the friction would reduce the effect. During analysis of the decreased vehicle to ground friction model (UNL10xr2 model), it was observed that the decrease in vehicle to ground friction resulted in improved vehicle pitch, but at the cost of slightly increased yaw and virtually unchanged
50 37 roll. Also, the oscillations once observed in model s right-front tire and suspension were significantly reduced. While the model showed some improvement, it still did not provide the desired amount of accuracy, as it did not improve vehicle roll and also caused the vehicle to yaw more toward the barrier. Comparison of UNL 10xr2 and test no is shown in Figures 21 and 22. Vehicle to barrier friction was also studied in order to get a better understanding of how friction would affect the model. The vehicle to barrier friction was increased from 0.1 to 0.4. Previous studies had shown that modifying the vehicle to barrier friction provided significant changes to vehicle dynamics. However, no conclusions or recommended values were provided from these studies. Analysis of the increased vehicle to barrier friction model (UNL 10xr3 model) showed a decrease in roll and slight improvement in yaw over the UNL 10xr2 model. However, the pitch of the vehicle was substantially worse than the UNL 10x model. Comparison of UNL 10xr3 and test no is shown in Figures 23 and 24. Another important result observed was the improvement in change in velocity along the longitudinal axis of the vehicle, which is simply the area under the acceleration curve in that same direction. The original UNL 10x model produced a relatively high change in velocity when compared to the full-scale test, but increasing the vehicle to barrier friction provided a result very similar to that seen in the physical test, as shown in Figure 25.

51 38 Time = sec Time = sec Time = sec Time = sec Figure 21. Downstream Sequential Views, UNL 10xr2 Model and Test No
52 39 Time = sec Time = sec Time = sec Time = sec Figure 22. Downstream Sequential Views, UNL 10xr2 Model and Test No
53 40 Time = sec Time = sec Time = sec Time = sec Figure 23. Downstream Sequential Views, UNL 10xr3 Model and Test No
54 41 Time = sec Time = sec Time = sec Time = sec Figure 24. Downstream Sequential Views, UNL 10xr3 Model and Test No
55 42 Figure 25. Longitudinal Change in Velocity Comparison for Modified Friction Simulations Finally, a model that used decreased vehicle to ground friction coupled with increased vehicle to barrier friction was simulated. Analysis of the combined modified friction model (UNL 10xr4 model) showed improved results over previous models, which provided the best overall comparison to physical test data. Comparison of UNL 10xr4 and test no is shown in Figures 26 and 27. With respect to roll, the UNL 10xr4 model improved upon the original UNL 10x and UNL 10xr2 models. It did not improve when compared with the roll observed UNL 10xr3 model, but differences between the two were negligible. With respect to pitch, the UNL 10xr4 model provided similar results to the original UNL 10x model. The UNL 10xr4 model did provide worse yaw than the UNL 10x model, but it was determined that the difference between the two was acceptable. The UNL 10xr4 however, did provide much better results with respect to
56 43 longitudinal change in velocity than the UNL 10x model. Comparison of the UNL 10x and Modified UNL10x models with physical test data is shown in Figures 28 through Conclusion From the analysis, it was determined that the UNL 10xr4 simulation provided the best overall results and was chosen for further refinement. While the UNL 10xr4 model did not show vast improvements over previous models, it provided the best combination of roll, pitch, and yaw characteristics, while providing relatively good longitudinal change in velocity results. Based on the results, the decrease in vehicle to ground friction and increase in vehicle to barrier friction used in conjunction with increased steering damping and the UNL tire model was determined to be the best combination of model parameters for which to move forward.
57 44 Time = sec Time = sec Time = sec Time = sec Figure 26. Downstream Sequential Views, UNL 10xr4 Model and Test No
58 45 Time = sec Time = sec Time = sec Time = sec Figure 27. Downstream Sequential Views, UNL 10xr4 Model and Test No
59 PITCH ANGLE [DEG.] ROLL ANGLE [DEG.] ROLL COMPARISON 46 T222 UNL 10x UNL 10xr2 UNL 10xr3 UNL 10xr TIME [S] Figure 28. Roll Comparison for Modified Friction Models PITCH COMPARISON T222 UNL 10x UNL 10xr2 UNL 10xr3 UNL 10xr TIME [S] Figure 29. Pitch Comparison for Modified Friction Models
60 YAW ANGLE [DEG.] 47 YAW COMPARISON T222 UNL 10x UNL 10xr2 UNL 10xr3 UNL 10xr TIME [S] Figure 30. Yaw Comparison for Modified Friction Models Elastic Barrier After the friction models were analyzed and compared, it was determined that further improvement should be pursued using the UNL 10xr4 friction parameters. Originally, the T222 barrier was modeled as rigid, which did not allow for any deformation or deflection of the barrier. While this method of modeling is efficient, it does lack accuracy, as no barrier is perfectly rigid. In an attempt to improve the results, it was decided to model the barrier as an elastic cantilever to try to recreate the deflection seen in testing. Also, this model was generated in order to try and reduce the high impact forces observed during the previous simulations, which seemed to play a role in the vehicle model s excessive roll and pitch. To model the barrier as elastic, the elements of the barrier were changed from shells to solids, and the material of the barrier was changed from MAT_RIGID to
61 MAT_ELASTIC. Also, since the barrier in test no was placed on anchor 48 plates, which allowed the barrier to translate laterally before allowing it to flex, the exact material parameters that were needed to cause the desired deflection were unknown. So to replicate the dynamic deflection of the barrier, the Young s modulus of the material was originally set at ksi (200 GPa) and decreased until the desired amount of deflection was found. Deflections greater than that observed in physical testing were also studied to observe the effect on the vehicle dynamics. The UNL 10xr6 model, which was modified to have a modulus of elasticity of ksi (200 GPa) while keeping the friction parameters used in UNL 10xr4, showed similar results to that seen in the UNL 10xr4 model. The vehicle dynamics were virtually unchanged when compared to the UNL 10xr4 model. With respect to barrier flexure, the UNL 10xr6 model allowed for a maximum dynamic deflection of in. (0.1 mm), more than 2 in. (51 mm) less than what was observed in test no While similar, the UNL 10xr6 model provided an overly stiff response and did not provide any improvement over the previous model. Next, the modulus of elasticity was decreased to 72.5 ksi (0.5 GPa) to create the UNL 10xr7 model. Decreasing the modulus of elasticity resulted in increased vehicle roll toward the barrier, while the vehicle pitch and yaw remained similar to that seen in the UNL 10xr4 model. It was also found that the UNL 10xr7 model did show increased flexure in the barrier. The parameters used in the UNL10xr7 model allowed for a maximum dynamic deflection of 1.1 in. (27 mm), which occurred during tail slap, as well as a dynamic deflection of 0.7 in. (19 mm) during initial impact. Like the previous UNL 10xr6 model, the UNL 10xr7 model did not provide adequate dynamic deflection or
62 improvement to vehicle dynamics. 49 Next, the modulus of elasticity was further decreased to 7.3 ksi (0.05 GPa), creating the UNL 10xr8 model. Analysis of the results showed that the choice of 7.3 ksi (0.05 GPa) vastly increased vehicle roll toward the barrier and caused significant changes in both pitch and yaw. While the pitch results showed some improvement prior to the occurrence of tail slap, the results following tail slap deviated greatly from the trend observed in physical testing. With respect to barrier flex, the dynamic deflection due to initial impact reached a value of 7.7 in. (196 mm) and a value of 5.6 in. (142 mm) during tail slap. Dynamic deflection of the barrier in the UNL 10xr8 model exceeded the dynamic deflection produced during physical testing by more than 5 in. (127 mm). While the UNL 10xr8 showed some improvements in the early part of the simulation with respect to vehicle pitch, all other results did not improve the results over previous models. Finally, the UNL 10xr9 model was generated, which used a modulus of elasticity of 29.0 ksi (0.2 GPa). While the vehicle dynamics did show improvement over the UNL 10xr8 model, the model once again did not show an improvement over the UNL 10xr4 model. The dynamic deflection however, did compare well with the physical testing. During simulation, initial impact generated 1.8 in. (45 mm) of dynamic deflection followed by a 2.3 in. (59 mm) deflection caused by tail slap. While the model was able to provide maximum dynamic deflection within 0.2 in. (5 mm) of the value measured in testing, the model still did not allow for an acceptable comparison with respect to vehicle dynamics. Analysis of results showed that the increased flexure of the barrier actually caused a negative response. As the modulus of elasticity was decreased, an increase in vehicle
63 ROLL ANGLE [DEG.] 50 roll toward the barrier was produced, as shown in Figure 31. For the most part, the pitch of the vehicle was not affected to the same degree as the roll, as the pitch remained relatively the same throughout the modeling, as show in Figure 32. However, the pitch in UNL 10xr8 model showed a much larger deviation from the test data after tail slap occurred when compared to previous models, such as the UNL 10xr4 model. Yaw, as shown in Figure 33, showed little change with changing barrier stiffness. Only the UNL10xr8 model, which provided the most flexure, showed any significant change. This change however was considered not to be an improvement over previous models as the yaw of the vehicle deviates from the physical test data earlier than the models that utilized a stiffer barrier. ROLL COMPARISON T222 UNL 10xr4 UNL 10xr6 UNL 10xr7 UNL 10xr8 UNL 10xr TIME [S] Figure 31. Roll Comparison for Elastic Barrier Models
64 YAW ANGLE [DEG.] PITCH ANGLE [DEG.] 51 PITCH COMPARISON T222 UNL 10xr4 UNL 10xr6 UNL 10xr7 UNL 10xr8 UNL 10xr TIME [S] Figure 32. Pitch Comparisons for Elastic Barrier Models YAW COMPARISON T222 UNL 10xr4 UNL 10xr6 UNL 10xr7 UNL 10xr8 UNL 10xr TIME [S] Figure 33. Yaw Comparison for Elastic Barrier Models
65 52 Another important result was the dynamic deflection increased the perpendicular as wall force decreased, as expected. While the wall force decreased, it did not compare well with physical test data, as most 2270P vehicles tested at TL-3 conditions experience an initial wall force peak ranging 70 to 90 kips (311 to 400 kn). During test no , the wall force during initial impact reached a maximum value of 78.9 kips (351.0 kn) and produced a value of 31.4 kips (140.0 kn) during tail slap. During simulation, the initial wall force exceeded 100 kips (444.8 kn) on all simulations performed, as shown in Figure 34. Even when the barrier was modified to allow for a dynamic deflection of 7.7 in. (196 mm), more than 5 in. (127 mm) greater than the dynamic deflection measured in test no , the initial impact force peak still registered well above the impact force calculated from the testing of the T222 system. The wall force experienced during tail slap, regardless of barrier elasticity, all exceeded the wall force observed within physical testing. Due to the trends observed in the wall force data and vehicle dynamics, it was determined that the elastic barrier did not provide improved results.
66 LOAD [KIPS] WALL IMPACT LOAD COMPARISON 53 T222 UNL 10xr4 UNL 10xr6 UNL 10xr7 UNL 10xr8 UNL 10xr TIME [S] Figure 34. Elastic Barrier Simulations-Impact Forces Comparison Conclusion After analysis of all models, it was determined that further refinement of the barrier model should not be continued. Based on the comparison of the results, the UNL 10xr4 model was determined to provide the best overall results, as the model produced vehicle dynamics that were more closely comparable than any other model. The main issue encountered during the simulation effort was that regardless of parameter changes to the barrier, the vehicle showed very high impact forces, which played a major role in the vehicle dynamics. Even when modeling the barrier as elastic and allowing the barrier to flex beyond 7 in. (178 mm), the impact forces exceeded the impact forces calculated from test no , and the vehicle dynamics did not provide a good comparison. Further improvement of the model would require an in-depth study of the vehicle model, especially wheel and suspension components, which is beyond the scope of this project.
67 54 Further non-standard barrier modeling methods could have been pursued to combat the negative results, but the main focus of the simulation effort was to generate an accurate vehicle model, not a barrier model. Any improvements made to the T222 barrier model would not provide improved results in future simulations due to the future barrier model being inherently more rigid as the barrier was rigidly attached to the deck instead of attached by anchor plates. 3.3 Barrier Height Study Introduction After the validation effort was completed, simulations to determine the optimal height of the traffic barrier were performed using the UNL 10xr4 model parameters while varying the barrier height. The barrier was first simulated at the minimum height of 24 in. (610 mm) and then simulated in one inch increments up to a 27-in. (686-mm) tall barrier height. The impact conditions were MASH test designation no. 2-11, a 5,000-lb (2270- kg) pickup truck impacting at 44 mph (70 km/h) and 25 degrees. During this effort, the ZOI of the vehicle was evaluated as well as the ability of the barrier to redirect the vehicle at each simulated height in order to aid in bicycle rail design and placement in. Barrier Height Simulation The first simulation involved a 24-in. (610-mm) barrier height. During simulation, the vehicle impacted the barrier, and the vehicle was redirected without overriding the barrier or causing the vehicle to roll over, as shown in Figure 35. With respect to ZOI, the front bumper was able to extend a maximum of 13.6 in. (345 mm) past the front face of the barrier at a height of 33.3 in. (846 mm) above the ground line. The fender, along with the headlight, were able to extend past the front face of the barrier a total of 14.6 in. (371
68 55 mm) at a height above the ground line of 43.9 in. (1,115 mm), which corresponded to the maximum intrusion observed. With respect to ZOI, the maximum value with respect to the box occurred when the back end of the truck impacted the barrier (tail slap) at a value of 14.8 in. (376 mm) at a height of 44.8 in. (1,138 mm) above the ground line. The zone of intrusion envelope for the 24-in. (610-mm) barrier height simulation is shown in Figure 36.
69 56 Time = sec Time = sec Time = sec Time = sec Time = sec Time = sec Time = sec Time = sec Figure 35. Downstream Sequential View, 24-in. Tall Barrier Simulation
70 57 24 in. Barrier Height ZOI Envelopes Barrier Fender/Bumper 30 Box Max ZOI 42 in. Top of Bumper Figure in. Barrier Height Simulation ZOI Envelope
71 in. Barrier Height Simulation 58 The next simulation used a barrier with total overall height of 25 in. (635 mm). Similar to the 24-in. (610-mm) barrier height simulation, the Silverado model impacted the barrier and was redirected, as shown in Figure 37. No override or excessive vehicle roll, pitch, or yaw were observed during simulation. When using a 25-in. (635-mm) barrier height, the front bumper reached a maximum ZOI of 10.3 in. (262 mm) at a height of 32.2 in. (818-mm) over the ground line. The front fender, which produced the maximum ZOI value, reached a total of 13.1 in. (333 mm) past the front face of the barrier at a height of 44.0 in. (1,118 mm) above the ground line. The box of the truck model reached a ZOI value of 14.1 in. (358 mm) at a height of in. (1,279 mm) above the ground line. The ZOI envelope for the front end of the vehicle as well as the box during the 25-in. (635-mm) barrier height simulation is shown in Figure 38.


72 59 Time = sec Time = sec Time = sec Time = sec Time = sec Time = sec Time = sec Time = sec Figure 37. Downstream Sequential View, 25-in. Tall Barrier Simulation
73 60 25 in. Barrier Height ZOI Envelopes Barrier Fender/Bumper 30 Box Max ZOI 42 in. Top of Bumper Figure in. Barrier Height Simulation ZOI Envelope
74 in. Barrier Height Simulation 61 Next, a 26-in. (660-mm) height barrier was simulated. The vehicle impacted the barrier and was successfully redirected, as shown in Figure 39. Dynamics of the vehicle were determined to be acceptable as the vehicle did not override or roll over. The front bumper produced a ZOI of 6.7 in. (170 mm) at a height of 30.0 in. (762 mm) above the ground line. The left-front fender reached a maximum value of 10.7 in. (272 mm) at a height of 34.1 in. (866 mm), which was the maximum ZOI for the front of the vehicle. With respect to the box of the vehicle model, a ZOI of 14.2 in. (361 mm) at a height of 50.7 in. (1,288 mm) was observed, making that value the maximum overall ZOI value for the simulation. The ZOI envelope for the 26-in. (660-mm) barrier height is shown in Figure 40.

75 62 Time = sec Time = sec Time = sec Time = sec Time = sec Time = sec Time = sec Time = sec Figure 39. Downstream Sequential View, 26-in. Tall Barrier Simulation
76 63 26 in. Barrier Height ZOI Envelopes Barrier Fender/Bumper 30 Box Max ZOI 42 in. Top of Bumper Figure in. Barrier Height Simulation ZOI Envelope
77 in. Barrier Height Simulation 64 Finally, a barrier height of 27 in. (686 mm) was simulated. When impacted by the Silverado truck model, the 27-in. (686 mm) barrier captured and redirected the vehicle, as shown in Figure 41. The vehicle was redirected without excessive roll, pitch, and yaw, meaning the vehicle was stable throughout the event. The front bumper of the impacting Silverado was able to reach a ZOI value of 5.0 in. (127 mm) at a height of 29.7 in. (754 mm) above the ground line. The ZOI of the right-front fender reached a value of 11.7 in. (297 mm) at a height of 42.1 in. (1,069 mm) above the ground line. The box of the Silverado model produced the maximum ZOI value at a value of 14.0 in. (356 mm) at a height of 50.9 in. (1,293 mm) above the ground line. The box produced the maximum ZOI value. The ZOI envelope for the 27-in. (686 mm) barrier height is shown in Figure 42.
78 65 Time = sec Time = sec Time = sec Time = sec Time = sec Time = sec Time = sec Time = sec Figure 41. Downstream Sequential View, 27-in. Tall Barrier Simulation
79 66 27 in. Barrier Height ZOI Envelopes Barrier Fender/Bumper 30 Box Max ZOI 42 in. Top of Bumper Figure in. Barrier Height Simulation ZOI Envelope
80 3.3.6 Height Simulations Comparison 67 Analysis of the four height simulations showed that each simulated barrier height was able to successfully capture and redirect the vehicle. Comparison of the vehicle dynamics, as shown in Figure 43, show very little variance as the height of the barrier was increased. In general, as the barrier height was increased, the roll of the vehicle toward the barrier decreased. However, the 26-in (660-mm) barrier height showed less vehicle roll than the 27-in (686 mm) tall barrier after 400 ms into the simulation, but it had produced virtually identical roll prior to this point. Overall, the 26-in (660-mm) barrier height produced the most desirable vehicle roll, but variance between the simulations was minor. Similar to roll, the pitch of the vehicle was reduced as the barrier height increased. Once again, the 26-in. (660-mm) and 27-in. (686-mm) barrier heights produced almost identical results to one another. All barriers provided reasonable vehicle pitch characteristics, with the 27-in. (686-mm) barrier providing the best overall. All simulations provided the same general trend with respect to yaw. As the barrier height of the vehicle was increased, an increase in yaw toward the barrier was decreased. While differences in yaw were observed between the simulations, the differences were determined negligible as all models provided acceptable results, and yaw of the vehicle was considered less critical than roll and pitch.
81 68 ROLL COMPARISON TL-2 24 TL-2 25 TL-2 26 TL ROLL ANGLE [DEG.] TIME [S] PITCH COMPARISON TL-2 24 TL-2 25 TL-2 26 TL PITCH ANGLE [DEG.] TIME [S] YAW COMPARISON TL-2 24 TL-2 25 TL-2 26 TL-2 27 YAW ANGLE [DEG.] TIME [S] Figure 43. Height Simulations Vehicle Dynamics Comparison
82 69 Analysis of the ZOI for each of the simulated heights showed a general decrease in maximum ZOI for the front end of the vehicle as barrier height increased, as shown in Figure 44. The decrease in ZOI was caused by increased engagement of the bumper, which caused less bumper override of the barrier as barrier height increased. However, when observing the ZOI produced by the box of the Silverado model during tail slap, the values for each height were all within 1 in. (25 mm) of each other. The ZOI values generated with respect to the rear end of the vehicle for the 24 in. (610 mm), 25 in. (635 mm), 26 in. (660 mm) and 27 in. (686 mm), were 14.8 in. (376 mm), 14.1 in. (358 mm), 14.2 in. (361 mm), and 14.0 in. (356 mm), respectively.
83 70 Figure 44. ZOI Comparison for Height Study Simulations, Front (Left) and Rear of Vehicle (Right) Conclusion All simulations performed during the height study showed the ability to capture and redirect the vehicle regardless of barrier height. The vehicle model remained stable and did not show any tendency to override the barrier system. Also, while the ZOI of the vehicle did show a general decrease as height increased, the ZOI values for both the front and rear of vehicle were relatively the same for each height simulated. The ZOI envelopes for each simulation suggest that regardless of barrier height, the likelihood of interaction between the impacting vehicle and bicycle/pedestrian rail is almost certain.
84 71 Based on these results, as well as the objectives of the project, a minimum barrier height of 24 in. (610 mm) was determined to be the best overall option. The 24-in. (610- mm) tall barrier was able to successfully capture and redirect the vehicle, while not causing the vehicle to experience excessive vehicle roll, pitch, or yaw. Also, the 24-in. (610-mm) tall barrier provided the lowest barrier option, as a shorter barrier would not conform to IaDOT standards. A taller barrier could also be considered, as the results from the simulations showed that increased barrier heights provided slightly better performance, but at the cost of decreased visibility.
85 72 CHAPTER 4. VEHICLE DIMENSIONS/HEIGHT STUDY AND COMPARISON P vs Silverado Model Purpose In order to better explain the behavior observed during simulation, the dimensions of the vehicle used in test no were compared with the NCAC Silverado model used in the simulation effort. During the simulation effort, the Silverado model did not provide results that could be considered completely accurate when compared to physical testing. Due to the discrepancy between the simulations and full-scale crash testing, it was suggested that the increased roll and pitch observed during simulation could possibly be attributed to the Silverado model not being the same as the 2270P truck used in crash testing Comparison of Results First, the NCAC Silverado model was based off of a Chevy Silverado, while the vehicle used in test no was a Dodge Ram 1500 pickup. Since the simulation model and the test vehicle utilized a different make and model, it cannot be expected that the two vehicles would perform in the same manner. Also, the Silverado model itself was first created in 2008, making the model somewhat outdated, as the accuracy of the model could be limited by modeling techniques and/or computing power available at the time. Based on this fact, differences between simulation and physical testing were expected. Next, the vertical heights and widths of relevant components of the Silverado model were measured within LS-PREPOST. A comparison of the dimensions measured on the Silverado model and the 2270P vehicle used in test no is shown below in Table 4. When comparing the dimensions of the Silverado model with the
86 73 Dodge truck used in physical testing, the model dimensions would suggest that it would produce less roll and pitch. In general, the Silverado model is a longer and wider vehicle than the truck used in testing. The length of the model should provide increased pitch stability, and the width should help reduce the amount of vehicle roll when compared to the truck used in physical testing. Also, the CG height of the Silverado model was 0.99 in. (25 mm) lower than the CG of the Dodge truck. This once again implies that the Silverado model would show a lower tendency to roll than what was observed in physical testing. However, during simulation, it was observed that the Silverado model showed increased roll and pitch over the physical testing. This result suggests that the increased roll and pitch observed during simulation is a product of something other than vehicle dimensions.
87 Table P vs. Silverado Model Dimensions 74 Vehicle Measurements 2270P (in.) Model (in.) Difference (in.) Front Bumper Width Roof/Overall height Overall Length, Bumper to Bumper Rear Bumper to Center of Rear Wheel Wheel Center to Center Length Front Bumper to Center of Front Wheel Bottom of Front Bumper Height Top of Front Bumper Height Bottom of Rear Bumper Height Top of Rear Bumper Height Front Track Width Rear Track Width Height of Front of Hood Front of Hood to Front of Bumper Tire Diameter Wheel Diameter Bottom of Door Height Rear Bumper Width CG Height NCHRP 350 TL-2 Systems vs. 2270P Purpose While the initial simulation effort was being performed, a comparison between the NCHRP Report P vehicle and MASH 2270P vehicle was being performed in parallel. Due to the lack of low-height, vertical-face, barriers that were crash tested to MASH TL-2 conditions, it was determined necessary to make the comparison between the 2000P and the 2270P vehicles in order to create a better understanding of how the 2270P vehicle might perform on these particular systems. Since there were successfully tested NCHRP 350 TL-2 systems, which utilized a low-height vertical parapet, the
88 75 comparison of the two vehicles was made in order to make the results of the NCHRP 350 tests more relevant for this project. Also, the comparison was used to create confidence in the simulation effort as well as be a replacement incase simulations did not provide reasonable results NCHRP 350 vs MASH With the introduction of MASH, vehicle changes were also introduced. Specifically, the pickup truck designation was changed from 2000P to 2270P, meaning the mass of the truck was increased by 591 lb (270 kg). The overall length of the vehicle was increased by a total of 26 in. (660 mm), and wheelbase was increased by 16 in. (406 mm). The track width also increased to a nominal value of 148 in. (3,760 mm), an increase of 2 in. (50 mm) over the previous 2000P vehicle. Also, the CG height for the 2270P vehicle was increased by a total of 0.45 in. (11 mm) over the 2000P vehicle. Differences between the 2270P and 2000P vehicles are compiled in Table 5. The increased mass of the 2270P vehicle implies increased impact severity when compared to the 2000P vehicle. The increased CG height suggests increased propensity of vehicle roll. However, the wider track width of the 2270P would provide the opposite result, as a wider vehicle provides more roll stability in general. Based on the comparison overall, it would be expected that the 2270P would show increased vehicle roll when compared to the 2000P vehicle. Also, the increased wheel base and overall length would provide the 2270P vehicle with increased pitch and possibly yaw stability. Once the nominal dimensions of the NCHRP P and MASH 2270P vehicles were compared, it was determined to put together a list of dimensions of 2270P vehicles from recent crash tests in order to get a good representation of the general
89 76 dimensions of recently-tested vehicles. These dimensions, which are shown in Table 6, were then used to compare to vehicles and barriers used in previous NCHRP 350 tests in order to provide some guidance as to how the 2270P vehicle would behave during testing of barriers under NCHRP 350 TL-2.
90 77 Table P vs. 2000P Details Property 2000P 2270P Difference MASS, lb (kg) lb kg Test Inertial 4409 ± ± 110 (2000 ± 45) (2270 ± 50) Dummy --- Optional Max. Ballast (200) (200) 0 0 Gross Static 4409 ± ± 110 (2000 ± 45) (2270 ± 50) DIMENSIONS, in. (mm) in mm Wheelbase 132 ± ± Front Overhang Overall Length (3350 ± 250) 31 ± 4 (800 ± 100) 211 ± 10 (5350 ± 250) Overall Width --- Hood Height --- Track Width CENTER OF MASS LOCATION, in. (mm) 65 ± 6 (1650 ± 150) (3760 ± 300) 39 ± 3 (1000 ± 75) 237 ± 13 (6020 ± 325) 78 ± 2 (1950 ± 50) 43 ± 4 (1100 ± 75) 67 ± 1.5 (1700 ± 38) Aft of Front Axle 55 ± 6 63 ± 4 (1400 ± 150) (1575 ± 100) Above Ground (minimum) (700) 28.0 (710) LOCATION OF ENGINE Front Front LOCATION OF DRIVE AXLE TYPE OF TRANSMISSION OTHER Rear Manual or Automatic Regular Cab 2wd Conventional Bed 1/2 Ton (1500) or 3/4 Ton (2500) Rear Manual or Automatic Quad Cab 2wd Conventional Bed 1/2 Ton (1500) in mm
91 78 Property Table P Test Vehicle Dimensions ILT-1 (in.) [34] MGSLS-1 (in.) [35] MGSLS-2 (in.) [35] 34AGT-1 (in.) [36] MSPBN-1 (in.) [37] Average (in.) Front Bumper Width Roof/Overall height Overall Length, Bumper to Bumper Rear Bumper to Center of Rear wheel Wheel Center to Center Length Front Bumper to Center of Front Wheel Bottom of Front Bumper Height Top of Front Bumper Height Bottom of Rear Bumper Height Top of Rear Bumper Height Front Track Width Rear Track Width Height of Front of Hood Front of Hood to Front of Bumper Tire Diameter Wheel Diameter Bottom of Door Height Rear Bumper Width CG Height
92 Test Selection and Process During the literature search, a total of three systems were found that were considered relevant for the comparison between the 2000P and 2270P vehicles. The tests that were chosen were the first test of the Rough Stone Masonry Guardwall (RSMG-1), the second test of the Rough Stone Masonry Guardwall (RSMG-2), and testing of the Low-Profile Bridge Rail (LPBR-1) [27,29-30]. These systems were designed and tested at MwRSF under NCHRP 350 TL-2 criteria. These three tests were chosen for the comparison due to the use of low-height, vertical-faced, barriers that were all determined to be acceptable according to NCHRP 350 TL-2 conditions. Specifically, the system tested during RSMG-1 had an overall height of 22 in. (559 mm), while the systems tested during RSMG-2 and LPBR-1 were 20 in. (508 mm) tall. Once the tests were chosen, the relevant vertical dimensions of the test vehicle used for the specific test, the average of the relevant dimensions of the 2270P vehicle complied previously, as well as the barrier dimensions were all plotted together within Microsoft Excel. Plotting these values allowed for a visual representation of the heights of the vehicles compared to the barriers to help assist in estimating how the 2270P would react to these low-height barriers. The main goal of this process was to see what components of the 2000P vehicle were captured by a given barrier height and then compare those heights with the same components on the 2270P. If the heights were similar or the same components would be captured within the barrier height, then the likelihood of the 2270P truck being captured by that barrier height would be considered higher. If the components of the 2270P vehicle were not captured within the barrier height, then the chance of the vehicle being captured would be considered to be lower.
93 Results During analysis of the three test comparisons, it was observed that all three comparisons provided similar results. All three NCHRP 350 TL-2 tests were able to capture the center of the wheels, the bottom of the door, and bottom of the bumper within the barrier height, as shown in Figures 45 through 47. When looking at those same components on the 2270P, it is clear that those same components are also captured within the heights of the barriers. Also, results show that for the 2270P the bottom of bumper and bottom of door height are not only captured, but they are captured at a lower height than the 2000P vehicle. Since the bottom of the bumper is lower than the 2000P vehicle, this result simply means that a greater portion of the bumper is being captured by the barrier. The same can be applied to the bottom of the door. Since the bottom of door height is lower on the 2270P, more of the vehicle is being captured by the barrier. Capturing more of the vehicle and at lower heights than the 2000P creates confidence that a test using the 2270P vehicle would be successful purely based on these dimensions. If we look at the center of wheel height, we see that the 2270P vehicles show a maximum difference in height of 2 in. (51 mm) above the 2000P vehicle. The center of the wheel was captured within the barrier height, but the increased height suggests a less stable response from the 2270P. With respect to CG height, it was observed that the CG height was higher for the 2270P than it was for 2000P in all the chosen tests. In general, this result was expected as MASH criteria for the 2270P vehicle sets the nominal CG height higher than what was used for the NCHRP P vehicle. Due to the increased CG height of the 2270P
94 81 when compared to the 2000P vehicle, it would be expected that the 2270P would show a higher tendency to roll as it impacts the barrier Conclusion Based on the comparison, it was determined that probability of the 2270P being captured by low-height parapets was high. The only result that would negatively affect the ability of the vehicle to be capture was the fact that the CG height of the 2270P vehicle was higher than that of the 2000P by only 0.5 in. (13 mm). The fact that the same components that were captured on the 2000P would also be captured on the 2270P provides confidence that the 2270P would have a good chance for also being captured. While the results of this comparison provided promising results, it is important to note that this comparison did not take into account the vehicle s weight. The mass of the 2270P versus the 2000P vehicle plays a major role in the behavior of the vehicle and cannot be ignored.
95 82 Figure 45. RSMG-1 Vehicle Dimension Comparison Figure 46. RSMG-2 Vehicle Dimension Comparison
96 Figure 47. LPBR-1 Vehicle Dimension Comparison 83
97 84 CHAPTER 5. PEDESTRIAN/BICYCLE RAIL DESIGN 5.1 Iowa DOT Requirements The Iowa DOT provided several preferences regarding the design of the vehiclebicycle-pedestrian rail. First and foremost, the pedestrian/bicycle railing was to be designed to withstand the loadings stated for pedestrian/bicycle railings within AASHTO s LRFD Bridge Design Specifications [3]. Additionally, the Iowa DOT preferred that the pedestrian/bicycle railing be mounted on top of the concrete parapet. Mounting the rail on top would eliminate the need for a backside curb on the bike path in order to comply with American with Disabilities Act (ADA) [38] requirements for railings mounted to the back of the parapet. The Iowa DOT also stated the design should maximize visibility by using widely-spaced, small section elements, and minimize horizontal elements used (i.e., use one horizontal rail, rather than two). It was desired that the rail design considered the need for increased lateral setback to mitigate negative vehicle interaction with the rail, head ejection concerns, and the potential for interference of the combination rail with snow plows. The IaDOT originally preferred to have two configurations, one used when no raised sidewalk was present and one to be used when a 6-in. (152-mm) tall raised sidewalk was present. With respect to the parapet, the IaDOT stated that the rail would need to be designed to be used with a 10-in. (254-mm) wide concrete parapet utilizing no. 4 steel reinforcement. 5.2 LRFD Pedestrian/Bicycle Railing Design Loading Chapter 13 of AASHTO s LRFD Bridge Design Specifications [3] lays out the design requirements for railings. Specifically, sections 13.8 through describes the design requirements for pedestrian, bicycle, and combination rails. With respect to
98 85 geometry of the system, the railing was required to have an overall height of at least 42 in. (1,067 mm) above the top of the walkway or bicycle path, e.g., a 24-in. (610-mm) tall parapet must have an added 24-in. (610-mm) tall pedestrian/bicycle rail attached to achieve a 42 in. (1,067 mm) overall height when installed on top of a 6-in (152-mm) tall raised pathway. The design specifications also defined the maximum clear opening space for the railing. Clear space is defined as the space between horizontal and/or vertical elements. For the lower 27 in. (686 mm) of the railing, any clear space must be small enough to prevent the pass through of a 6-in. (152-mm) diameter sphere. For any part of the railing above 27 in. (686 mm), the clear space must prevent pass through of an 8-in. (203-mm) diameter sphere. However, the opening size recommendations for pedestrian/bicycle railings are only specified for railings on the outer edge of a bikeway when highway traffic is separated from the pathway by a traffic railing. IaDOT was concerned with the pedestrian/bicycle railing on the separator barrier only. Thus, the combination pedestrian/bicycle railing was not subject to the pass-through specifications, but it still needed to meet the 42 in. (1,067 mm) height relative to the surface of the sidewalk or bikeway and the structural loading requirement. With respect to the structural capacity of the railing, design specifications required that the railing withstand specified design loads. The design live load for pedestrian/bicycle railings was specified as 50 lb/ft (730 N/m) acting both transversely and vertically, acting simultaneously, as shown in Figure 48. Also, a 200-lb (889-N) concentrated load, acting simultaneously with the previous loads, at any point and in any direction at the top of the longitudinal element. The posts of pedestrian/bicycle railings
99 86 should be designed for a concentrated design live load applied transversely at the center of gravity of the upper longitudinal element. The value of the concentrated design live load for posts is calculated using Equation 1. P LL = L (1) Where: PLL = Post live load L = Post spacing Figure 48. AASHTO LRFD Pedestrian/Bicycle Rail Loading [3] 5.3 Rail and Post Design Concepts In attempt to meet IaDOT s preferences, multiple design concepts were generated. Sketches of the proposed concepts are shown in Figure 49. First, all design concepts utilized one rail element in order to keep the design simple and to maximize visibility, which was placed on top of a 24-in. (610-mm) tall parapet. Concept (a) used a vertical
100 87 post with the rail placed within the post span. Concept (b) used a vertical post with the rail placed on the front side of the posts. Concepts (c) and (d) both place the rail on top of the posts. However, concept (d) set the posts farther back on the baseplates to allow for the vehicle to intrude farther past the front face of the barrier without interaction with the posts and/or rails. Placement of the rail could be centered or shifted to either side of the post to create different rail offsets. The first four concepts were designed in such a way to keep the system simple. The last four concepts were designed in such a way to increase rail setback as well as provide a more aesthetically-pleasing system. Concept (e) used a horizontal steel tube welded to a vertical tube, creating a 90-degree angle. Concepts (f) and (g) both angled toward the pedestrian/bicycle traffic side, to different degrees, in order to increase rail set back. Concept (h) used a 90-degree radius bend, so only one element needed to be used. The placement of the rail for these concepts could be placed in multiple orientations, similar to concepts (a) through (d). For all concepts, square, rectangular, or round sections could be used.
101 Figure 49. Rail Design Concepts 88
102 Rail and Post Connection Concepts Three main concepts were created to attach the rail to the post section as well as connect the post to the baseplate. The first connection concept attached the rail to the post using steel angle brackets and either bolts or welds, as shown in Figure 50. The second concept considered fully welding the rail to the post and the post to the baseplate, as shown in Figure 51. The third concept used a combination of welding angle brackets to either the post or the rail and using bolts for the other connections, as shown in Figure 52. The fully-bolted concept was considered to have consistent performance when compared to the other concepts. Variances in structural capacity of the other concepts were thought to be higher than the variances in strength of the components used in the fully-bolted connection, making the full-bolted system more consistent when impacted. Also, installation and repair was considered to be simpler for the fully-bolted concept, as only simple hand tools would need to be used. Additionally, the fully-bolted concept was thought to provide a cost savings, as it would be unnecessary to employ a welder to connect these parts. Finally, the longevity of the fully-bolted connections over welded connections would be improved, as the system could be coated before installation using more effective painting or galvanizing methods. If welded on site, the protective coating would need to be applied in less than ideal conditions. The negatives for this concept were that it did not provide the most pleasing appearance and required more parts than other concepts. The fully-welded concept provided a much cleaner appearance than the bolted or combination concepts due to reduced number of parts and elimination of bulky parts. However, as stated before, the welded connection may not provide consistent
103 90 performance as compared to the other concepts due to the inconsistent nature of the welding process. Quality, thus capacity, of welded connections could vary greatly due to improper welding technique used by the welder and/or the environmental conditions in which the weld would be applied. Installation and repair of the welded system was thought to be a more difficult fabrication process as the system would need to be held in alignment and then welded. The combination connection concept combined the positives and negatives of both the fully-bolted and fully-welded connection concepts. Figure 50. Fully-Bolted Connection Concept
104 91 Figure 51. Fully-Welded Connection Concept Figure 52. Combination Connection Concept
105 Concept Selection After discussion with IaDOT, it was decided to continue with Concept (d) using the fully-welded connection type and square/rectangular HSS elements. The use of Concept (d) would keep the system simple, while still providing increased rail setback to reduce the severity of negative interaction with the system. After discussing the positives and negatives of each connection concept, IaDOT shared that their installers could build the system in sections, as well as coat them in the shop, and then transport the sections by truck to the field site. The method proposed by IaDOT suggested that the install and repair would be a much simpler process than previously understood. Also, with the sections being more efficiently welded and coated in the shop, longevity of the system would be improved. With this method, sections could be placed with minimal alignment issues. From this, the system was designed to allow for the sections to be assembled in 20 ft. (6 m) sections while utilizing a 10 ft (3 m) post spacing. Additionally, IaDOT chose to proceed with only one configuration instead of two configurations as previously proposed. It was decided that the configuration would employ a 24-in. (610-mm) tall parapet and a 24-in. (610-mm) tall pedestrian/bicycle rail, giving the system an overall height of 48 in. (1,219 mm). IaDOT shared that they were only concerned with keeping the parapet 24 in. (610 mm) tall with respect to the roadway and the total system at least 42 in. (1,067 mm) above the pedestrian/bicycle path. By designing the system with a 48 in. (1,219 mm) overall height the pedestrian/bicycle rail would be 48 in. (1,219 mm) above the pedestrian/bicycle path when the raised sidewalk was not present and 42 in. (1,067 mm) above the pedestrian/bicycle path when the standard 6-in. (152-mm) raised sidewalk was present. Using only one configuration
106 93 further eases the assembly/installation/repair process as the parapet and/or the pedestrian/bicycle rail dimensions would remain constant regardless of where its placement. Using one configuration also eliminates the need to stock components for two systems. 5.6 Post and Rail Calculations The calculations described herein were used to design an anchored, straight, pedestrian/bicycle rail that was configured with uniform post spacing and mounted on top of a 24-in. (610-mm) tall concrete parapet. The applied loads were defined by the requirements published in the AASHTO LRFD Bridge Design Specifications [3] for a pedestrian/bicycle rail. These loads corresponded to the critical loading that was applied to the pedestrian/bicycle rail, which generated the critical forces. Section sizes and their capacities were located within the American Institute of Steel Construction s (AISC) Steel Construction Manual [39]. Calculations for the final railing design can be found in Appendix A. No additional factors were applied to the pedestrian/bicycle rail live loads, as IaDOT considered the live loading presented in AASHTO LRFD Bridge Design Specifications [3] for a pedestrian/bicycle rail to already be factored. Appropriate reduction factors were applied to the section capacity equations for the different loading cases Longitudinal Rail Element The longitudinal rail element was designed to withstand two types of live loads: (a) a uniformly distributed load of 50 lb/ft (730 N/m) applied both transversely (y-axis) and vertically (z-axis) and (b) a concentrated load of 200 lb (889 N) applied at any point and in any direction. An example of the design loading conditions with a concentrated load acting vertically downward in the center of the top longitudinal beam is shown in Figure 53.
107 94 To determine the rail section size to resist the bending produced by the applied live loading, the rail was treated as a simply supported beam, as shown in Figure 54. The concentrated load was applied directly in the center as to maximize the bending moment produced. The bending moment of the rail in the y-direction was calculated using superposition of the concentrated and distributed loads, as shown in Equation 2. The same process was used to calculate the bending moment in the z-direction. However, no concentrated load was present as it was already applied to the y-direction calculation, creating Equation 3. The same process was repeated for the case when the concentrated load was applied vertically and the bending moment along both axes was calculated using Equations 4 and 5. Figure 53. Example of Pedestrian/Bicycle Rail with Vertical Concentrated Load
 M rail,z z = PL 4 + wl2 8 (4) M rail,z z = wl2 8 (3) M rail,y y = wl2 8 (5) Where: Mrail,y-y = Bending moment in")
108 95 Figure 54. Rail Force Diagram to Maximize Bending Case 1 Case 2 M rail,y y = PL 4 + wl2 8 (2) M rail,z z = PL 4 + wl2 8 (4) M rail,z z = wl2 8 (3) M rail,y y = wl2 8 (5) Where: Mrail,y-y = Bending moment in rail about rail y-y axis Mrail,z-z = Bending moment in rail about rail z-z axis P = Concentrated load w = Distributed load L = Post spacing Using a similar configuration, the shear force in the rail section was calculated. However, to maximize shear in the rail the concentrated load was placed near the end of the rail, as shown in Figure 55. The shear force due to the live loading in this configuration was then calculated in the vertical direction using Equation 6. The same process was applied to the transverse direction, as shown in Equation 7. The concentrated load was omitted due to it already being applied in the vertical direction. The
 V rail,y y = P + wl 2 (8) V rail,y y = wl 2 (7) V rail,z z = wl 2 (9) Where: Vrail,z-z = Shear force in rail along z-z")
109 96 concentrated load was then applied in the transverse direction and the loading on the section was evaluated using Equations 8 and 9. Figure 55. Rail Force Diagram to Maximize Shear Case 1 Case 2 V rail,z z = P + wl 2 (6) V rail,y y = P + wl 2 (8) V rail,y y = wl 2 (7) V rail,z z = wl 2 (9) Where: Vrail,z-z = Shear force in rail along z-z axis Vrail,y-y = Shear force in rail along y-y axis P = Concentrated load w = Distributed load Once the live-load bending moment produced by the live loading was found, the proper section needed to be selected to resist the loading. Using the AISC Steel Construction Manual, section sizes and their flexural capacities were found. Specifically, section F7.1 was used to determine the flexural capacity. Equation F7-1 located within
110 97 the AISC Steel Construction Manual calculates the nominal flexural strength of a section using the plastic section modulus and specified minimum yield stress of the material, as shown in Equation 1O. However, it was desired that no plastic deformation should occur from the applied loading, so the elastic section modulus was used in place of the plastic section modulus, as shown in Equation 11. Using the elastic section modulus would limit all deformation to the elastic region of the material s stress-strain curve, thus resulting in no permanent deformation. φm n = φf y Z (10) φm ns = φf y S (11) Where: φmn = Nominal flexural strength φmns = Nominal elastic flexural strength Fy = Specified minimum yield stress Z = Plastic section modulus S = Elastic section modulus φ = 0.9 Since the load was applied in two directions, the bending moments in each direction were normalized and summed following the process discussed in section H1 of AISC Steel Construction Manual. Specifically, Equation H1-1b sums the moments in the two directions, and compares the result to unity, as shown in Equation 12. If the sum exceeds one, the section is likely to fail plastically. This was process was performed for both orientations of the concentrated load.
111 98 M rail,y y φm nsy + M rail,z z φm nsz 1 (12) Where: Mrail,y-y = Bending moment in rail about rail y-y axis Mrail,z-z = Bending moment in rail about rail z-z axis φmns,y-y = Nominal elastic flexural strength about y-y axis φmns,z-z = Nominal elastic flexural strength about z-z axis With respect to shear, Chapter G of the AISC Steel Construction Manual discusses the determination of shear capacity of various members. Specifically, section G4 was used to find the shear resistance of the rail by following Equation G4-1, as shown in Equations 13 through 16. φv n = φ0.6f y A w C v2 (13) A w = 2ht (14) h = b 3t (15) C v2 = 1.0 (16) Where: φvn = Nominal flexural strength Fy = Specified minimum yield stress Aw = Area of webs Cv2 = Web shear buckling strength coefficient h = Width resisting shear force t = Design wall thickness b = Outside dimension of element φ= 0.75 Since the rail was introduced to both flexure and shear, the rail needed to be analyzed with respect to the combined loading section of the AISC Steel Construction Manual, Section H3.2. Specifically, the process applies to HSS sections subjected to combined torsion, shear, flexure, and axial force. Due to the loading scenario only shear
112 and flexure were present. The capacity of the rail was then found using Equation 17. This process was performed for both loading cases and for each major axis of the rail M rail V rail + ( ) φm nsrail φv nrail 1 (17) Where: Mrail = Bending moment in rail φmnsrail = Rail s nominal elastic flexural strength Vpost = Shear in rail φvnrail = Rail s nominal shear strength Vertical Post Element The posts were subjected to a concentrated live load, PLL, as defined in (1). The concentrated live load was applied transversely at the center of gravity of the upper horizontal element. The post was assumed to act as a single cantilever beam, as shown in Figure 56. The bending moment and shear force in the post were calculated using Equations 18 and 19, respectively.
113 100 Figure 56. Post Force Diagram M Post = P LL H L (18) V post = P LL (19) Where: Mpost = Bending moment in post due to force PLL PLL = Post live load HL = Height at which load is applied Vpost = Shear in post The resistance of the post to both flexure and shear were found using the same process used for the rail element. However, loading was only in one direction, removing the need to analyze the moment in two directions. Since the post was introduced to both
114 flexure and shear, a similar process as used for the combined loading applied to the rail was performed using Equation 2O. 101 M post + ( V 2 post ) M nspost V npost 1 (20) Where: Mpost = Bending moment in post due to force PLL Mnspost = Post s nominal elastic flexural strength Vpost = Shear in post Vnpost = Post s nominal shear strength Using this process, a 3-in. x 2-in. x 1/8-in. (76-mm x 51-mm x 3-mm) HSS ASTM A500 Grade C steel tube was selected for the rail, while a 2-in. x 2-in. x 1/8-in. (51-mm x 51-mm x 3-mm) HSS ASTM A500 Grade C steel tube was selected for the post. The selected post section was the smallest square HSS section size listed within the AISC Steel Construction Manual, allowing for maximum visibility. For the rail, the section size was chosen to allow for good visibility, while providing some post protection and ease within the installation process. By making the rail wider than the post, more surface area was present for connecting the post to the rail. Also, the wider rail allows the front and rear faces of the post to extend out from the front and rear faces of the rail. This offset of the post from the faces of the rail provided some post snag reduction if a pedestrian/bicyclist were to fall into the system. For post spacing, 120 in. (3,048 mm) was chosen. This post spacing was the largest that was used on other systems. This high post spacing also would contribute to retaining good visibility for motorists attempting to observe any hazards beyond the system.
115 Baseplate Calculations The baseplate was designed to allow for mounting the pedestrian/bicycle rail on top of the parapet, while providing enough strength to resist the loading conditions. The dimensions of the parapet only allowed for the use of two anchor rods per baseplate, as the reinforcement of the barrier limited the amount of space to place more anchor rods, and the overall width of the parapet provided limited space to effectively use more anchors. Additional anchors could be used, but at the cost of using baseplate dimensions that would be unreasonably large or at the cost of reduction in capacity of the anchorage connection due to the spacing of the anchor rods as the areas of influence will overlap each other to a greater extent as discussed during the following anchor rod calculations. Thus, the baseplate was designed to have a single row of anchor rod holes that were aligned along the longitudinal axis of the parapet Loading The baseplate and connections were designed to resist the elastic moment capacity of the post, instead of only resisting the pedestrian/bicycle loading. This design approach provided sufficient baseplate and connection strength to keep the system intact if impacted by a vehicle. Excessively weak baseplates and connections could cause the components of the system to become a dislodged and become debris hazards from overloading. With a more robust design approach, the system would be more likely to remain whole, thus making it less of a hazard when impacted under vehicle loading Required Thickness To find the required baseplate thickness, Chapter 1 of AISC s Steel Design Guide [40] was used. Specifically, the guide discusses the design process to determine the
116 103 required thickness of the baseplate subjected to an axial load and bending moment on the attached post, as shown in Figure 57. This process assumes the loading on the post creates a stress distribution on the plate and tension within the anchors. From this distribution, the thickness of the baseplate to resist the loading can be found. The first step of the process requires an estimation or selection of desired baseplate dimensions, width and length, and knowledge of loading on the post. Once the desired dimensions were chosen, Equations 21 and 22 were used to determine if the baseplate needed to be designed for small or large eccentricities. e = M P e N 6 (21) (22) Where: e = Eccentricity M = Post bending moment P = Post axial load N = Depth of baseplate If Equation 22 is satisfied, then the baseplate design needs to follow the process for small eccentricities, otherwise the design process for large eccentricities needs to be followed. For the pedestrian/bicycle rail, it was found that the baseplate needed to be designed for large eccentricity, as the bending moment in the post was much higher than that of the axial load. The process laid out in the design guide for large eccentricities was then followed to determine the required thickness. From this process it was determined that a 1/2-in. (13-mm) thick, ASTM A572 Grade 50 steel baseplate would provide adequate strength.
117 104 The required thickness of the plate was also checked through the use of simple static beam analysis in order to confirm that the results of design guide process were acceptable. The baseplate was treated like a beam with an applied tension force acting downward due to the anchor rods, a force acting upward due to the contact of the concrete parapet with the baseplate, and a moment acting on the plate from the attached post, as shown in Figure 58. The first case assumed an impact of the system from the traffic side similar to a vehicle impact. The moment for this case was assumed to be the moment capacity of the post. The baseplate was then designed to resist the elastic flexural capacity of the post. The second case applied the pedestrian/bicycle loading on the nontraffic side, creating a bending moment in the opposite direction. For the traffic-side loading case, the plate was assumed to be stiffened by the post, so the back end of the plate acted like a cantilever with a force applied at the end. For the pedestrian/bicycle loading case, it was assumed that the tension force from the anchor rods created a cantilever experiencing a bending moment due to the pedestrian/bicycle load applied on the attached post. The thickness of the baseplate could then be solved using Equations 23 through 25 for both cases.
118 Figure 57. AISC Steel Design Guide Column Baseplate Loading General Case [40] 105
119 106 Figure 58. Baseplate Simplified Traffic Impact (Top) and Pedestrian/Bicycle Loading (Bottom) σ b = M S S = bt2 6 (23) (24) t = 6F rl = 6M (25) P LL bσ allowed bσ allowed Where: σb = Bending stress M = Bending moment S = Section modulus of baseplate
120 107 b = Width of baseplate cross-section t = Thickness of baseplate FR = Force between baseplate and parapet due to rotation L = Distance from back of post to rear edge of baseplate MPLL = Bending moment from post loading From this process, it was determined that a 3/8-in. (10- mm) thick baseplate was needed to resist the vehicle impact loading case, and a 5/8-in. (16-mm) thick baseplate was needed to resist the pedestrian/bicycle loading. To provide adequate strength, a 5/8- in. (16-mm) thick, ASTM A572 Grade 50 steel baseplate was selected Post Offset To reduce the amount of vehicle interaction with the pedestrian/bicycle rail, the post was set back, and the baseplate dimensions were defined to accommodate this offset. With the parapet being 10-in. (254-mm) wide with standard 3/4-in. (19-mm) chamfers on the front and rear edges of the parapet, the rear edge of the baseplate was placed 1 in. (25 mm) forward from the rear face of the parapet, or the pedestrian/bicycle traffic face. The post was then placed 1 in. (25 mm) forward from the rear edge of the baseplate, thus creating a post offset of 6 in. (152 mm) from the front, or traffic-side, face of the parapet. While the previous simulation height study suggested that the vehicle could intrude up to 14.8 in. (376 mm), design constraints could not allow for a post offset that would completely eliminate the possibility for vehicle-post interaction. Because of this fact, the post offset was maximized for the parapet and baseplate dimensions to reduce as much interaction as possible.
121 Post-Rail and Post-Baseplate Connection Calculations Post-Baseplate Loading The post-baseplate connection was analyzed using both the pedestrian/bicycle and vehicle impact loading. However, the vehicle impact loading was considered to be a more extreme case, as it provided higher bending moment and shear force in the post. Designing the post-baseplate welds to resist the vehicle impact loading provided a more conservative approach. Designing for vehicle impact load also would reduce the chance that system would become a debris hazard when impacted by a vehicle by allowing the posts to deform first rather than immediately detach due to low connection strength. For the vehicle impact loading, it was assumed that the loading would apply enough force to exceed the flexural capacity of the post. Once the post met its flexural capacity, no more force could be applied to the post. It was then assumed that the weld would need to resist the moment capacity of the post as well as the shear force to develop that moment. The shear force was assumed to be created by a concentrated force applied 10 in. (254 mm) above the base of the post, as shown in Figure 59. This height was found from the previous barrier height simulations. The height corresponded to a location at which the vehicle would impact the post if the post were present during that simulation effort and that height was confirmed in the full-system simulation effort. Using the assumed impact height along with the flexural capacity of the post, the force applied from the impact loading was found using Equation 26. This force was then used as the shear force for designing the weld.
122 109 Figure 59. Post Vehicle Impact Loading P v = M NP 10 (26) Where: Pv = Assumed vehicle impact load MNP = Post nominal flexural capacity The bending moment that corresponded to the flexural strength of the post was assumed to create an upward tension force on the weld attaching the front flange of the post to the baseplate, as shown in Figure 60. The post was assumed to rotate about the

123 110 base of the rear flange when the moment was applied to it. This rotation of the post would cause the front flange of the post to displace vertically and when welded, would experience a tension force. The tension force was then found using Equation 27. T w = M P n (27) Where: Tw = Tension in weld MP = Bending moment in post n = Depth of post Figure 60. Post-Baseplate Front-Flange Weld Tension Diagram For the rail-post connection, the connection was designed to resist the previouslystated pedestrian/bicycle impact loading. The same type of rotation that was used for the post analysis was applied to the rail-post connection. Since the load was applied laterally
124 111 at the center of the front flange of the rail, a moment would be produced at the connection. It was assumed that the rail would rotate about the point where the rear flange of the post met the rail, thus creating a tension force like the post-baseplate connection, as shown in Figure 61. The tension force was found in a similar manner to the post-baseplate connection using Equation 28. T w = P Ph 2n (28) Where: Tw = Tension in weld PP = Pedestrian/Bicycle load h = Height of rail n = Depth of post Figure 61. Rail-Post Rear-Flange Weld Tension
125 Weld Calculations To attach the rail to the post and the post to the baseplate, fillet welds were used and analyzed using Section J2 of the AISC Steel Construction Manual. The welds were assumed to be applied fully along all faces of the post for both the rail-post and postbaseplate connections. The strength of the welds was analyzed using Equation J2-5, as shown in Equation 29. φr n = φ0.60f EXX ( sin 1.5 θ)a we (29) Where: φrn = Weld resistance FEXX = Filler metal classification strength Awe = Effective area of the weld ϴ = Angle between the line of action of the required force and the weld longitudinal axis φ=0.75 The shear force was assumed to be resisted by the welds placed parallel to the load applied for both the rail-post and post-baseplate connections. The tension force created by the moment in the rail and post was assumed to be resisted by the weld along the front-flange. Also, the weld size was determined based on the size limitations for fillet welds within Chapter J of the AISC Steel Construction Manual. Specifically, Table J2.4 specifies that when the thinnest joining material is 1/4 in. (6 mm) or less, the minimum weld size that can be used is 1/8 in. (3 mm). Additionally, it is stated that the maximum weld size along edges of material less than 1/4 in. (6 mm) thick cannot exceed the thickness of the material. Since the thickness of the post and rails were chosen to be 1/8 in. (3 mm) and the baseplate to be 5/8 in. (16 mm), the weld size selected was 1/8 in. (3 mm).
126 113 Using this process, it was found that 1/8 in. (3 mm) fillet welds using E70 filler metal would provide enough resistance to prevent failure when the pedestrian/bicycle loading was applied to the system for both connections. When analyzing the weld resistance of the post-baseplate connection under vehicle impact load, it was found that the front-flange weld did not provide enough strength when considered to act alone. However, this analysis was considered conservative as the front weld would not be the only weld resisting the tension force. The welds placed on the webs of the post would also provide tension resistance. Additionally, Table J2.5 within AISC Steel Construction Manual, states that tensions applied to fillet welds for parallel parts can be neglected for the design process. For shear, it was found that the weld resistance greatly exceeded the required strength needed to prevent failure under vehicle impact loading. 5.9 Anchor Rod Calculations The design of epoxy adhesive anchorages for the railing-to-parapet connection was developed using ACI procedures for concrete breakout, steel fracture, and bond strength [41]. The design calculations considered steel fracture, concrete breakout, and adhesive bond failure in tension. Shear calculations considered steel fracture, concrete breakout, and concrete pryout. The calculations also accounted for reduction in anchor capacity due to the distance to the edge of the parapet and anchor spacing based on the area of influence for the concrete and bond failures, as well as reduction factors for steel and concrete breakout for the loadings both in shear and tension. Anchorage area of influence defines a region of the concrete where the anchorage forces are distributed in order to develop load for both concrete breakout and bond strength. If these areas exceed the edge of the parapet or overlap the area of influence of other anchors, then the capacity
127 114 of the anchor is reduced by the ratio of the unavailable area divided by the original assumed influence area. A simple example of area of influence for two anchors that exceed the concrete edge and interfere with adjacent anchors is shown in Figure 62. The purple area denotes where the area of influence extends beyond the parapet edges. The orange area indicates where the area of influence for anchors A and B overlap. In this area, only half of the overlapping area can be utilized by each anchor, so the anchor capacity must be reduced accordingly [42]. A final note should be made regarding an additional modification that was made to the ACI calculations for this project. Originally, the anchorage capacity was calculated just as ACI entailed. However, anchor rod forces from the full-system simulation, discussed in later chapters, greatly exceeded the initial calculated values. Because of this finding, the anchorage capacity calculations were revisited in order to ensure the anchor rods would provide enough capacity to resist the forces observed in the simulation effort. Calculations for tensile concrete breakout capacity indicated that extremely large embedment depths would be required to provide the desired anchorage capacity. These calculations assume a concrete cone failure of the parapet that extends diagonally from the base of the anchor to the edges of the area of influence. While this assumption may be true for large-area, unreinforced slabs, it was not believed to be accurate for the reinforced concrete parapet in this research. A more reasonable form of the failure mode was believed to be a hybrid concrete cone and adhesive bond failure, as shown in Figure 63. In this type of failure mode, the concrete cone failure is prevented from extending to the base of the anchor by the longitudinal rebar. The hybrid failure assumption was extended to the ACI calculations by assuming that the upper
128 115 portion of the anchor embedment contributed to the concrete breakout and the lower portion of the embedment contributed to a bond failure. Thus, the calculations for the concrete breakout and bond strength were performed with different anchor embedment depths and then summed to determine the tensile anchor capacity [42]. This process was used in a previous MwRSF project, which involved redesigning the BR27C systems to use epoxy adhesive anchorage connections, rather than the original cast in place anchor method used [42]. During bogie testing, it was found that the described method provided adequate capacity in tension for the two anchor rod case, bogie test IBP-3. Results from testing showed that anchor rod tension forces could have reached values up to 35 kips (155 kn), while calculations using the hybrid epoxy anchorage method generated a capacity of only kips (85.23 kn). Results of the tests when compared to initial calculations indicated that the hybrid epoxy method was fairly conservative, so the process was considered to be acceptable. Originally, the tension force in the anchor rods was taken as the value calculated during the baseplate thickness determination process. However, once the system was simulated, which will be discussed in a following section, it was found that the tension forces were much higher than expected. The calculations were then performed once again using these higher tension values to ensure that the anchorage connection provided enough strength to prevent failure. Using the stated methods, proper epoxy anchorage parameters were found. An embedment depth of 12 in. (305 mm) was chosen, with the first 5.5 in. (140 mm) resisting concrete breakout and the bottom 6.5 in. (165 mm) resisting bond failure. These values corresponded to the point at which the concrete breakout cone came into contact
129 116 with the longitudinal reinforcement of the parapet. The anchor rod was chosen to be a 3/4-in. (19-mm) diameter, ASTM F1554 Grade 105 threaded rod. Upon modification to the anchorage connection, the baseplate designed was revaluated to accommodate the increased anchor rod diameter and spacing. All calculations for anchorages were performed using Hilti RE-500 epoxy adhesive, which has a bond strength of 1,560 psi (10.8 MPa). The concrete compressive strength for the design calculations was assumed to be 4,000 psi (27.6 MPa).

130 Figure 62. Concrete Area of Influence for Two Adjacent Anchors on Concrete Parapet [42] 117
131 Figure 63. Comparison of ACI Concrete Breakout and Hybrid Failure Assumptions 118
132 Splice Tube To ease installation and repair of the system, splice tubes were used to connect rail sections. Splice tubes allow sections of rails to be more easily connected and disconnected than their welded counterparts. Splice tubes simply slide into the ends of adjacent rail sections and allow the connection of those rail sections through the use of hex bolts, in this case, that extend from the top of the rail sections through the splice tube and out the bottom side of rail sections. An example of the standard splice tube configuration is shown in Figure 64. Since splice tubes join rail sections, they also experience the same loading as the rail sections. This requires that splice tube sections have equal or higher resistance to bending than that of the rail sections that it connects. Designing the splice tube in this way ensures that failure will not occur at the splice. Failure at the splice could create a spearing hazard, as ends of the rail section could be exposed. The bending strength of any cross section is dependent upon the section modulus. The chosen rail section, which was 3 in. x 2 in. x 1/8 in. (76 mm x 51 mm x 3 mm), had a section modulus of in. 3 (14,208 mm 3 ) about the x-axis and in. 3 (11,340 mm 3 ) about the y-axis. The splice tube would need to have a higher section modulus in both axes to be considered stronger. Since the splice tube needed to slide into the rail section, the proper splice tube dimensions needed to be selected to provide adequate clearance. It was determined that the splice tube should allow for a minimum clearance of 1/8 in. (3 mm) on all sides when inserted into the rail. This selection would allow for the tube to be easily inserted into the rail and prevent binding in case of minor splice tube or rail warpage. From this fact, the splice tube outside dimensions needed to be 2.5 in. x 1.5 in.
133 120 (64 mm x 25 mm) at most. However, no standard section size listed within the AISC Steel Construction Manual provided adequate stiffness and clearance. Figure 64. Typical Splice Tube Detail Since no standard section sizes provided the correct strength and clearance, a built-up section design was pursued. Built-up sections are the joining of plate steel, usually by fillet welds, to create a non-standard section. An example of the cross section of a built-up section is shown in Figure 65. Using this method allows the designer to select all the parameters of the section to meet design needs. To solve for section modulus, the built-up section was analyzed as separate sections then summed to find the total section modulus about both major axes. First, the two plates parallel to the axis of bending were analyzed, creating a configuration similar to Figure 66. The section modulus for this case was then solved using Equation 3O. The plates that run were placed perpendicular to the axis of bending were treated simply as rectangles, as shown in Figure 67 and the appropriate section modulus was calculated using Equation 31. The section moduli from both cases were then summed in order to find the total section modulus. The same process was repeated about the other major axis.
134 121 S 1 = b(d3 d 1 3 ) 6d = b((2t 1 + d 1 ) 3 d 1 3 ) 6(2t 1 + d 1 ) (30) Where: S1 = Section Modulus of Parallel Plates b = Width of horizontal plates d = Outside distance between plates d1 = Inside distance between plates t1 = Thickness of horizontal plates S 2 = 2b 1d = 2t 2d (31) Where: S2 = Section Modulus of Perpendicular Plates d2 = Height of vertical plates b = Width of vertical plates t1 = Thickness of horizontal plates t2 = Thickness of vertical plates Using this process, a 2.5-in. x 1.5-in. x 5/16-in. (64-mm x 38-mm x 8-mm) builtup section, utilizing 3/16-in. (5-mm) fillet welds provided the appropriate strength and clearance. The section modulus of the designed built-up section was calculated to be in. 3 (17,108 mm 3 ) about the strong axis and in. 3 (11,389 mm 3 ) about the weak axis, providing a built-up section with higher bending capacity along both major axes. The section also provided the necessary clearance of 1/8 in. (3 mm) on all sides. The rail sections were designed to be spliced at 20 ft (6.1 m) intervals, and each rail was connected to the next rail with a splice tube assembly using a 1/2 in. (13 mm) gap between each rail end. The splices in the rail were placed 30 in. (762 mm) away from the end of the post. The splice was placed at this location (quarter-span) rather than at the mid-span of the rail because maximum bending would occur in the center of the span.
135 122 Placing the splice in at quarter-span was used to reduce the loading to the splice tube assembly. Figure 65. Standard Built-up Section Cross Section Figure 66. Splice Tube Parallel Plates Configuration for Section Modulus Calculation
136 123 Figure 67. Splice Tube Perpendicular Plates Configuration for Section Modulus Calculation 5.11 Parapet Details The general parapet dimensions desired by the IaDOT was 24 in. (610 mm) tall by 10 in. (254 mm) wide. The compressive strength of the concrete was specified to be 4,000 psi (27.6 MPa). The reinforcement for the parapet was determined by MwRSF engineers to resist an estimated TL-2 vehicle impact loading of 35 kips (156 kn) using yield-line theory. IaDOT had stated that the design should employ no greater than no. 4 steel reinforcing bars using 2-in. (51-mm) concrete clear cover. From the estimated vehicle loading and IaDOT requirements, the reinforcement for the parapet was generated Preliminary Design Details for Full System Simulation Effort The design that was modeled for the final simulation effort utilized the parapet details selected by the Iowa DOT, which was a 24 in. (610 mm) tall by 10 in. (254 mm)
137 124 wide concrete parapet. For the posts, HSS 3 in. x 2 in. x 1/8 in. (76 mm x 51 mm x 3 mm) ASTM A500 Grade C steel tube sections were selected. For the rails, HSS 2 in. x 2 in. x 1/8 in. (51 mm x 51 mm x 3 mm) ASTM A500 Grade C steel sections were chosen. The baseplate dimensions were 6 in. (152 mm) deep by 7 in. (178 mm) wide by 3/8 in. (10 mm) thick and the material selected was ASTM A572 Grade 50 steel. The post was placed on the baseplate such that it allowed for the front flange of the post to have a 5 in. (127 mm) offset from the front face of the parapet. The baseplate design allowed for the uses of two anchor rods spaced 5 in. (127 mm) apart along the longitudinal axis of the barrier. These anchor rods were centered between the front and rear faces of the parapet. The anchor rods were selected to be 5/8 in. (16 mm) diameter, ASTM F1554 Grade 55 threaded rods utilizing an embedment depth of 6 in. (152 mm) and epoxy to attach them to the parapet. The post-to-baseplate and rail-to-post connections used 1/8 in. (3 mm) fillet welds. The attached bicycle rail was designed to be installed using 20 ft (6 m) preassembled sections with a post spacing of 10 ft (3 m). For future full-scale crash testing, the design was assembled with five sections, creating an overall system length of 100 ft. (30 m). Adjacent rail sections connected through the use of splices tubes and ASTM A325 bolts. Originally, HSS 2.5 in. x 1.5 in. x 1/8 in. (64 mm x 38 mm x 3 mm) ASTM A500 Grade C steel sections and 1/8 in. (3 mm) thick ASTM A572 thick shims were selected. However, during the simulation process, the splice tube assemblies were changed to the same built-up splice tube sections that were employed in the final system design.
138 125 CHAPTER 6. FULL SYSTEM SIMULATION 6.1 Introduction After the system was preliminarily designed, the next step involved simulation of the system to observe and investigate its crash performance during testing. This process was performed to confirm that design choices were appropriate and also to determine the location of the Critical Impact Point (CIP), which was the location which created the worst-case impact scenario. The model simulated the test conditions of MASH test designation no. 2-11, which involves the 2270P pickup truck model impacting at 44 mph (70 km/h) at a 25-degree impact angle. The ability of the system to capture and redirect the vehicle, the severity of snag between the vehicle and the attached steel railing, and component forces were all observed to evaluate the performance of the preliminary design. 6.2 System Model The main components, such as the parapet, rails, posts, splice tubes, baseplates, and connection hardware, were all modeled initially within Solidworks, meshed using Hypermesh, and the impact was simulated using LS-DYNA. The concrete parapet had dimensions of 24 in. (610 mm) tall by 10 in. (254 mm) wide by 100 ft (30.5 m) long and used the same parameters that were determined from the validation effort. The vehicle that was used in the simulations was the same Silverado v3r model which was determined to be most accurate during the validation effort. The impact conditions of the simulation were defined to replicate the conditions of MASH test designation no. 2-11, which are the test conditions that will be used to evaluate the systems performance in full-scale crash testing. The 2270P pickup used in MASH test
139 126 designation no provides more vehicle instability, barrier loading, and snag severity than the 1100c small car used in MASH test designation 2-10, thus making it the more severe impact scenario for the nature of this system. The mid-planes of the posts, rails, and splice tubes were modeled using shell elements. The shell elements were then given appropriate contact thickness in order to properly model the sections. The material properties were defined using data from previous testing of ASTM A500 grade B steel using *MAT_PIECEWISE_LINEAR_PLASTICITY. The testing showed that the strength of ASTM A500 Grade B steel exceeded the nominal values stated for ASTM A500 Grade C steel. Thus, it was determined acceptable to use the ASTM A500 Grade B steel material model as it was already defined. To model the welds between the post and the rails, the nodes between the posts and rails were simply merged. Modeling the connection in this way gave the connection infinite strength. While this might not be accurate, the results of the design calculations showed that the welds provided enough strength that failure of the weld was unlikely. Also, modeling techniques for welds has not yet reached the accuracy necessary to produce realistic results without extensive testing and validation. Modeling the welds using merged nodes also decreased the requirements for computational power and simplified the system. The baseplates were modeled similar to the posts and rails, but with different material properties. The mid-planes were meshed using shell elements, and material properties were defined using *MAT_PIECEWISE_LINEAR_PLASTICITY. The material properties were desired to match ASTM A572 Grade 50 steel. Previous work
140 Stress (GPa) 127 performed at MwRSF stated that ASTM A572 Grade 50 steel was similar to that of AASHTO M180 steel that is used in guardrail systems [43]. The stress-strain curve was taken from that work and modified to better match the nominal properties of ASTM A572 Grade 50. Originally, the material model had a defined yield strength of 65 ksi (450 MPa). This value was reduced to 50 ksi (350 MPa), and the stress-strain curve was scaled down linearly to match that change as well. The modified stress-strain curve, along with the original, is shown in Figure 68. The connection of the post to the baseplate was treated in the same manner as the post-rail connection. ASTM A572 Grade 50 Model Stress-Strain Curves Strain Scaled Original Figure 68. ASTM A572 Model Stress-Strain Curve Comparison The shafts of anchor rods were modeled as hexagon cylinders rather than trying to mesh the threads. Meshing threads was determined unnecessary as that amount of detail would take many elements and drastically increase computing cost for little gain. To make up for the absence of threads, the nodes of the nut were merged to the shaft, thus creating a rigid bond between the shaft and nut. To connect the anchor rod to the parapet,
141 128 the nodes of the anchor rod shaft were merged with the nodes on the top surface of the parapet. There was no need to model the anchor rods exactly as they would appear in the actual system, as no concrete deformation would occur in the simulation due to the parapet s rigid material properties. These anchor rods were meshed using solid elements defined with *MAT_PIECEWISE_LINEAR_PLASTICITY for the material properties. A similar process to define the stress-strain curve as used previously was applied to the anchor rods using a stress-strain curve generated from testing of ASTM A325 bolts. However, the anchor rods needed to be scaled up, as the ASTM A325 model had a defined yield strength of 92 ksi (634 MPa) and ASTM F1554 Grade 105 anchor rods had a yield strength of 105 ksi (724 MPa). The baseplate, post, and anchor rod mesh is shown in Figure 69. The geometry of the splice tube connection hardware was similar to that of the anchor rods. The bolt head and nut were modeled as hexagon cylinders on the ends of the splice tube bolt shaft, as shown in Figure 70. The nodes of the nut and bolt model were merged to the shaft to create a rigid connection. Once again, solid elements were used with material properties defined by *MAT_PIECEWISE_LINEAR_PLASTICITY. The material properties were selected to match the unmodified ASTM A325 bolt model stated previously. For both the anchor rods and splice tube bolts, *INITIAL_STRESS_SECTION was used to generate preload. This method compresses the element that the section is defined on until that element reaches a defined stress value and holds that value for a
142 129 defined amount of time. An example of the stressed and unstressed state is shown in Figure 71. The final full-system model is shown in Figures 72 through 75. The system was modeled with five rail sections, thus creating an overall length of 100 ft (30.5 m). Additional cross sections were created to monitor forces at the base of the impacted post, anchor rods at that same post, and the splice tube bolts at the splice nearest the impact. The modeling techniques only allowed for deformation modes of the railing, and no failure of the connection could occur. Since the connections could not fail, the loads into the components would be expected to reach values higher than what would occur in fullscale crash testing.

143 Figure 69. Post-Baseplate and Anchor Rod Connection 130

 and")
144 131 Figure 70. Splice Tube Bolt Model Figure 71. Splice Tube Bolt Assembly with No Preload (Left) and with Preload (Right)

145 132 Figure 72. Combination Rail Model Figure 73. Combination Rail Close-Up


146 133 Figure 74. Combination Rail Front-View Figure 75. Full Impact Model Top-View 6.3 Simulation Results Multiple impact locations were simulated to determine the CIP. Specifically, seven different impact locations were chosen to try to select the worst-case impact scenario. During this process, vehicle change in velocity, anchor rod/splice tube bolt forces, post/rail deformations, and vehicle intrusion were monitored to help make the
147 134 decision on CIP for full-scale crash testing, as well as to make necessary design changes based on the performance. Overall, snag severity was considered to be the most important factor when determining the CIP for this system. The first simulated impact location involved the vehicle model impacting 4.3 ft (1.3 m) upstream (US) from Post No. 7. This location was chosen to try to maximize snag of vehicle components onto the post. Graphical results of the simulation are shown in Figure 76. The vehicle was observed to impact the post, causing the post to deflect backward and eventually causing the post to buckle. The front bumper and headlight assembly came into contact with the post, followed by significant snagging of the rightfront fender on Post No. 7, as shown in Figure 77. The vehicle continued forward, eventually being redirected safely by the system. The next simulated case involved the vehicle impacting 3.3 ft (1 m) US from Post No. 7. Graphical results of the simulation are shown below in Figure 78. The vehicle impacted the post, causing the post to buckle at the point where the front bumper made contact, as well as just above the baseplate. The front bumper made contact and headlight assembly came into contact with the post, followed by significant snagging of the rightfront fender on Post No. 7, as shown in Figure 79. The vehicle continued forward, eventually being safely redirected by the system.
148 135 Time = sec Time = sec Time = sec Time = sec Time = sec Time = sec Time = sec Time = sec Figure 76. Downstream Sequential Views, Impact 4.3 ft US from Post No. 7 Simulation


149 136 Time = sec Time = sec Time = sec Time = sec Time = sec Time = sec Time = sec Time = sec Figure 77. Post Snag Sequential Views, Impact 4.3 ft US from Post No. 7 Simulation
150 137 Time = sec Time = sec Time = sec Time = sec Time = sec Time = sec Time = sec Time = sec Figure 78. Downstream Sequential Views, Impact 3.3 ft US from Post No. 7 Simulation


151 138 Time = sec Time = sec Time = sec Time = sec Time = sec Time = sec Time = sec Time = sec Figure 79. Post Snag Sequential Views, Impact 3.3 ft US from Post No. 7 Simulation
152 139 The next simulated case involved the vehicle impacting 1.7 ft (0.5 m) US from Post No. 7. Graphical results of the simulation are shown in Figure 80. Similarly, the vehicle impacted the post, causing the post to buckle at the point where the front bumper made contact. The front bumper and headlight assembly came into contact with the post, followed by significant snagging of the right-front fender on Post No. 7, as shown in Figure 81. Following the post buckle, the baseplate experienced significant bending due to the post rotation. The vehicle continued forward, eventually being safely redirected by the system. The next simulations were modeled to maximize snag on the splice and splice hardware. The first simulation involved the vehicle impacting 2.6 ft (0.8 m) US from the splice downstream (DS) from Post No. 7. The second case simulated the same impact point. However, the splice was placed US from post No. 7, rather than DS, in attempt to snag both the splice and post. Graphical results from both these simulations are shown in Figures 82 and 83. For both cases, the vehicle impacted the system with minor interaction between the vehicle and the splice section. Slight snagging of the fender and hood on the splice tube bolts was observed. For the reversed case the fender experienced snagging on the post DS from the impacted splice. As the simulations continued, the vehicle was safely redirected without excessive pitch or roll motions.

153 140 Time = sec Time = sec Time = sec Time = sec Time = sec Time = sec Time = sec Time = sec Figure 80. Downstream Sequential Views, Impact 1.7 ft US from Post No. 7 Simulation


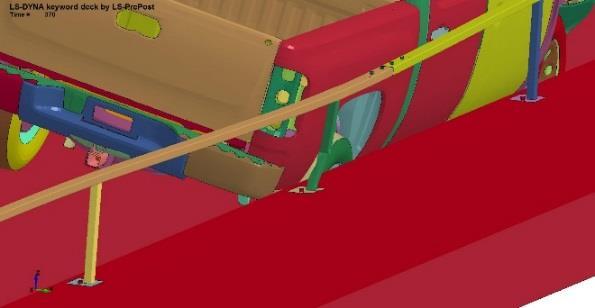
154 141 Time = sec Time = sec Time = sec Time = sec Time = sec Time = sec Time = sec Time = sec Figure 81. Post Snag Sequential Views, Impact 1.7 ft US from Post No. 7 Simulation

155 142 Time = sec Time = sec Time = sec Time = sec Time = sec Time = sec Time = sec Time = sec Figure 82. Downstream Sequential Views, Impact 2.6 ft US from Splice Simulation
156 143 Time = sec Time = sec Time = sec Time = sec Time = sec Time = sec Time = sec Time = sec Figure 83. Downstream Sequential Views, Impact 2.6 ft US from Splice Reversed Simulation


157 144 Time = sec Time = sec Time = sec Time = sec Time = sec Time = sec Time = sec Time = sec Figure 84. Post Snag Sequential Views, Impact 2.6 ft US from Splice Reversed Simulation
158 145 After the graphical results were analyzed, two additional simulations were created to allow for more data to determine the CIP. The first simulation used an impact 3.8 ft (1.2 m) US from Post No. 7. This impact location was chosen because the impacts at 4.3 ft (1.3 m) and 3.3 ft (1 m) US from Post No. 7 seemed to provide the greatest snag on Post No. 7. Thus, it was desired to see if snag could be increased using an impact location between those two points. The second simulated model involved a vehicle impact point of 3.3 ft (1 m) US from the splice section. This point was chosen to confirm that snag on the splice was relatively minor like the other splice impact simulations suggested, making post snag the more severe snag case. Graphical results of these two simulations are shown in Figures 85 and 86. For the case where the vehicle impacted 3.8 ft (1.2 m) US from Post No. 7, similar results to previous post snag simulations were observed. The vehicle impacted the system and was redirected safely. During impact, snagging of the fender on the post occurred, as shown in Figure 87. Buckling of the post was present at the location where the bumper came into contact with the post. For the simulation where the vehicle impacted 3.3 ft (1 m) US of the splice DS from Post No. 7, the vehicle showed little interaction with the splice. Slight snagging between the vehicle fender and splice bolt assemblies occurred, along with minor snagging of the right-front fender on the post, but nothing severe.

159 146 Time = sec Time = sec Time = sec Time = sec Time = sec Time = sec Time = sec Time = sec Figure 85. Downstream Sequential Views, Impact 3.8 ft US from Splice Simulation
160 147 Time = sec Time = sec Time = sec Time = sec Time = sec Time = sec Time = sec Time = sec Figure 86. Downstream Sequential Views, Impact 3.3 ft US from Splice Simulation


161 148 Time = sec Time = sec Time = sec Time = sec Time = sec Time = sec Time = sec Time = sec Figure 87. Post Snag Sequential Views, Impact 3.8 ft US from Splice Simulation
162 CIP Determination Post Deformation To determine the severity, of snag multiple aspects of the simulation were reviewed. First, the vehicle model and system were analyzed visually. During the cases where post snag occurred, snag of the vehicle on the post caused a high level of deformation to the right-front fender, as shown in Figures 88 through 93. However, the deformation did not seem realistic and would be expected to cause tearing in full-scale crash testing. Tearing of the fender should decrease the severity of the snag, but to what degree is unknown. For these cases, the 1.7 ft (0.5 m) US from Post No. 7 simulation provided the most fender damage but overall, the damage to the right-front fender in each simulation was much too similar to make a decision on CIP purely based on fender deformation.


163 150 Figure ft US Post No. 7 Fender Damage Figure ft US Post No. 7 Fender Damage Figure ft US Post No. 7 Fender Damage Figure ft US Splice Reversed. Fender Damage Figure ft US Post No. 7 Fender Damage Figure ft US Splice Fender Damage
164 151 Comparing the deformation of the posts, the 3.3 ft (1 m) US from Post No. 7 case showed the most post deformation and deflection. This finding suggested that interaction of the vehicle with the post was the highest in this case, possibly creating higher snag severity. Both the measured post deflections and visual deformations in the 4.3 ft (1.3 m) and 3.8 ft (1.2 m) US from Post No. 7 simulations were nearly identical, while the splice snag cases produced little post deflections. Lateral and longitudinal deflections measured at the top of the impacted post for each simulation are listed in Table 7. While some degree of post deformation did result from snag, quantifying the severity of the snag on visual deformation and post deflection was difficult and could lead to incorrect selection of the most severe snag case. For the splice snag cases, the height of the rail led to a minor amount of interaction between the vehicle and the splice section. The lack of interaction caused very little snagging of the vehicle on the splice occurred, and the post snag cases were considered to be more critical. The reversed splice and the 3.3 ft (1 m) US from the splice cases did produce some snag of the right-front fender on the post, but not to the same degree as the other simulations. Table 7. Post Lateral and Longitudinal Deflections Simulation Run Lateral Deflection Longitudinal Deflection in. (mm) in. (mm) 4.3 ft US from post No (95) 0.64 (16) 3.3 ft US from post No (169) 0.44 (11) 1.7 ft US from post No (161) 0.65 (17) 2.6 ft US of Splice 1.12 (29) 0.05 (1) 2.6 ft US of Splice Reversed 1.07 (27) 0.40 (10) 3.8 ft US from post No (124) 0.49 (12) 3.3 ft US of Splice 3.70 (94) 0.46 (11)
165 Vehicle Change In Velocity Next, the change in velocity of the vehicle model was observed in order to help determine snag severity. Change in velocity of the vehicle is the integration of the acceleration of the vehicle, as measured at the CG of the vehicle. The higher the acceleration experienced by the vehicle, the higher the change in velocity. In general, the more severe the vehicle snag, then the higher the accelerations experienced by the vehicle, which in turn creates a higher change in velocity of that vehicle. A comparison plot of the change in velocity for each simulated case is shown below in Figures 94 and 95. For all simulations, change in velocity of the CG of the vehicle was determined in the longitudinal and lateral directions, as well as the resultant of the two directions. For these three scenarios, all simulations showed minimal differences. For the simulations performed, the 1.7 ft (0.5 m) US from Post No.7 impact provided the highest peak changes in velocity, while the 2.6 ft (0.8 m) US from splice impact showed the lowest change in velocity, as shown in Figures 94 and 95. The initial peak resultant change in velocities were all within 3 ft/s (0.9 m/s). With the difference in magnitudes between each simulation being relatively small, as well as with the simulations all following the same general trend, the change in velocities alone were not enough to eliminate impact points as potential CIP s.

166 153 Figure 94. Longitudinal and Lateral Vehicle Change in Velocity Comparison Figure 95. Longitudinal and Lateral Resultant Vehicle Change in Velocity Comparison Lateral Vehicle Overlap The final step taken to help determine CIP, was to analyze the lateral vehicle overlap beyond the impacted post. Overlap was defined as the vehicle extent laterally behind the front face of the post. Overlap was considered pertinent as the vehicle intrusion behind the front face of the post indicates whether a vehicle will interact with
167 154 that post as the impact event continues. A high overlap was assumed to create more snag risk, while a low overlap was considered to create less snag risk. The measured overlap of the vehicle just before impact of the post and the maximum overall value during impact of the post for each simulation is shown in Table 8. For vehicle overlap at impact and the maximum value, the 3.8 ft (1.2 m) US from Post No. 7 simulation provided the highest measured values. The 1.7 ft (0.5 m) US from Post No. 7 produced the lowest overlap value at initial impact of the post, while the 2.6 ft (0.8 m) US from Splice reversed simulation provided the lowest maximum value. The two splice impact simulations did not produce any overlap as the vehicle model impacted just DS from the post. The measured values of overlaps from the simulations suggests that the 3.8 ft (1.2 m) US from Post No. 7 impact point simulation showed the most snag potential due to having the highest overlap values. Table 8. Vehicle Post Overlap Simulation Impact Location At Impact in. (mm) Maximum in. (mm) 4.3 ft US from post No (210) 8.31 (211) 3.3 ft US from post No (190) 8.39 (213) 1.7 ft US from post No (93) 7.73 (196) 2.6 ft US from Splice N/A N/A 2.6 ft US from Splice Reversed 7.25 (184) 7.25 (184) 3.8 ft US from post No (216) 8.99 (228) 3.3 ft US from Splice N/A N/A *N/A = Not Applicable
168 CIP Determination Conclusion From the analysis of the simulations, it was determined that the 3.8 ft (1.2 m) US from Post No. 7 simulation provided the highest snag severity. It was chosen, because it provided the highest overlap and similar change in velocity to the other simulations. It did not provide the largest post deflection, but the exact relationship between post deflection and snag severity is not known. Since snag severity was considered to be the main factor in CIP selection, the 3.8 ft (1.2 m) US from post No. 7 was chosen as the CIP. It is important to note that the differences between each simulation that involved post snag was minimal and would most likely create similar amount of snag in full-scale crash testing. Overlap of the vehicle was considered to be the most critical to determine the impact point that would provide highest snag severity due to not relying on system deformation. Since the system was modeled without failure, snag severity was difficult to quantify through the deformation of system components, as they might break away or detach in full-scale crash testing. For overlap, the values rely only on the vehicle and parapet, rather than on the whole system, thus making the results somewhat more accurate by reducing possible chances for error. Since overlap was a less complex measurement, it was simpler to quantify how vehicle overlap might influence vehicle snag in full-scale crash testing. 6.5 Additional Simulation Analysis Along with the analysis to determine CIP, additional analyses were performed in order to determine if the design would perform acceptably. For this investigation, certain design aspects were altered in order to create a better performing system.
169 Anchor Rod Forces Using the cross sections placed in the model, the forces imparted to the anchor rods were analyzed. Specifically, the anchor rod tension and shear forces were analyzed. The peak tension and shear forces experienced by both the US and DS anchor rod on the impacted post are shown below in Table 9. Originally, the baseplate calculations indicated that the anchor rods would experience 3.87 kips (17.21 kn) from the specified post loading. However, the loading calculations only took into consideration loading along one axis and not the complex 3D loading the vehicle would apply to the post. The simulation results showed approximately 6 times increase over the calculated tension forces. From the original calculations, it was determined that a 5/8-in. (16-mm) diameter, ASTM Grade 55 F1554 anchor rod would provide enough strength along with a 6-in (152-mm) embedment depth. Upon viewing the forces imparted to the anchor rods, it was decided that revaluation of the design was necessary. This revaluation led to increasing the anchor rod diameter to 3/4 in. (19 mm), the use of the hybrid epoxy anchorage design process, and to increasing the anchor rod grade from Grade 55 to 105, as stated in CHAPTER 5. The anchorage capacity was increased to withstand the observed tension forces experienced in the simulations except for the highest case of kips (103.4 kn). Since it was not required that the system resist vehicle impact loading and this value seemed to be an outlier, it was decided that the anchorage capacity did not need to resist tension forces of this magnitude.
170 157 Table 9. US and DS Anchor Rod Forces Simulation Run 4.3 ft US from post No ft US from post No ft US from post No. 7 Resultant Tension X Shear Y Shear Shear kips (kn) kips (kn) kips (kn) kips (kn) US DS US DS US DS US DS (70.26) (72.64) (103.36) (65.91) (64.29) (66.69) (-17.60) (-10.18) (-16.36) (-7.05) (-8.18) 1.84 (8.18) 1.91 (8.49) 2.44 (10.86) (-8.71) 1.49 (6.62) 1.73 (7.71) (-4.48) 4.41 (19.64) 2.91 (12.93) 3.68 (16.35) 2.09 (9.30) 2.04 (9.06) 1.93 (8.59) 2.6 ft US of Splice (69.48) (68.43) (-6.01) 1.39 (6.19) 0.45 (2.00) 0.82 (3.65) 1.38 (6.13) 1.39 (6.19) 2.6 ft US of Splice Reversed (57.75) (53.47) (-6.29) 0.43 (1.91) (-2.50) 0.83 (3.68) 1.52 (6.75) 1.04 (4.63) 3.8 ft US from post No (74.66) (64.50) (-18.99) 1.43 (6.37) 2.10 (9.34) 1.97 (8.77) 4.38 (19.50) 2.04 (9.07) 3.3 ft US of Splice (70.15) (67.77) (-10.10) 0.99 (4.39) 1.11 (4.93) 0.96 (4.27) 2.46 (10.94) 1.05 (4.65) Splice Tube Capacity During initial simulations, it was observed that the splice tube was not performing as expected. Impact of the vehicle caused the system to oscillate heavily near the ends of the rail sections where the splice tubes were located. Deformation of the impacted splice tube in bending was also observed, indicating the section did not provide adequate bending strength. This observation led to the revaluation of the preliminary design, which utilized HSS sections and shims, and eventually to the use of the built-up section splice tube, as discussed in the previous chapter. Clearances between the splice tube and rail, as
171 158 well as the splice tube section properties were modified to improve reduce the observed behavior Splice Tube Bolt Forces The shear forces imparted to the splice tube bolts for the chosen CIP simulation were also monitored and then used to determine splice tube dimensions that would provide adequate capacity to resist the forces. The shear forces measured at the top and bottom of each splice tube bolt are shown in Table 10. The Center Downstream (CDS) splice tube bolt experienced the highest lateral and longitudinal shear forces, while the Upstream (US) splice tube bolt experienced the highest resultant shear force. The longitudinal shear force was used to determine if the section of both the splice tube and rail provided enough capacity to resist bearing failure and tear out, while the maximum resultant shear was used in order to determine if the bolts themselves provided enough shear capacity. The magnitudes of the shear forces were rather low compared to the capacity of the rail, splice tube, and splice tube bolts, so it was determined that the choice of splice tube bolts provide adequate capacity to resist the forces experienced in the simulations.
172 159 Table ft US from post No. 7, Splice Bolt Shear Forces Load Parameter X Shear kips (kn) Y Shear kips (kn) Resultant Shear kips (kn) Location US CUS CDS DS Top Bottom Top Bottom Top Bottom (0.11) (0.113) (0.563) (0.585) (0.974) (1.018) (-0.146) (-0.164) (0.483) (0.465) (0.917) (0.878) (0.194) (0.188) (0.6) (0.551) (0.607) (0.57) 0.04 (0.178) (0.167) (-0.498) (-0.465) (0.55) (0.523) 6.6 Conclusion The simulation results indicated that the system was able to contain and safely redirect the vehicle. The CIP was determined to be 3.8 ft. (1.2 m) US from a post through the simulation of multiple impact locations. This location was chosen as it provided the most vehicle overlap, suggesting that it would create the highest snag severity of the locations simulated. Forces in the anchor rods and splice tube bolts were monitored and used to evaluate whether they provided adequate capacity to resist the loads. It was found that the capacity of the anchor rods needed to be increased, while the chosen splice tube bolts were determined to provide enough strength. While the model did not mimic the actual system with complete accuracy, the results from the simulation were good enough to provide the needed guidance.
173 160 CHAPTER 7. COMBINATION TRAFFIC/BICYCLE RAIL DESIGN DETAILS The proposed barrier system was configured to be 100 ft 4 1/2 in. (30.6 m) long, consisting of a bicycle rail mounted on top of a vertical-faced concrete parapet, as shown in Figures 96 through 109. The longitudinal rail of the upper bicycle rail is to be fabricated with 3-in. x 2-in. x 1/8-in. (76-mm x 51-mm x 3-mm) ASTM A500 Grade C structural steel tubing. The longitudinal rail consists of 20 ft (6.1 m) long sections spliced at the quarter-span between two posts. The rails are to be attached to the top of the posts using 1/8-in. (3- mm) fillet welds around the entire post section. The expansion/splice tubes for the rail ends are to be fabricated with two 28in. (718 mm) long by 2 in. (51 mm) wide by 1/4 in. (6 mm) thick ASTM A572 Gr. 50 steel plates welded to two 28 1/4 in. (718 mm) long by 1 1/4- in. (32 mm) wide by 5/16-in. (8 mm) thick ASTM A572 Gr. 50 steel plates using 3/16-in. (5-mm) fillet welds. The combination of plates will create outside dimensions of 2.5 in. x 1.5 in. (64 mm x 38 mm). The expansion/splice tubes would be inserted into the longitudinal rail ends and held in place with four 1/2-in. (13-mm) diameter, 3 1/4-in. (83-mm) long ASTM F3125 bolts placed vertically - two in the upstream tube section and two in the downstream tube section. The US and DS end sections will not utilize an anchored termination to the parapet for the suggested full-scale crash testing. Termination design configurations will be suggested upon successful completion of full-scale crash testing of the proposed system.
174 161 The 21 3/8-in. (543-mm) tall steel posts should be fabricated with 2-in. x 2-in. x 1/8-in. (51-mm x 51-mm x 3-mm) ASTM A500 Grade C structural steel tubing. A 9 1/4- in. x 7-in. x 5/8-in. (235-mm x 178-mm x 16-mm) ASTM A572 Grade 50 steel plate should be welded to the base of each post in order to attach it to the top of the barrier with two 3/4 in. (19 mm) diameter, 14 in. (356 mm) long ASTM long F1554 Grade 105 anchor rods. The posts are to be attached to the barrier with the anchor rods placed in a line along the longitudinal axis of the barrier spaced 5 in. (127 mm) apart using epoxy adhesive with a minimum bond strength of 1,560 psi (10.8 MPa). All connection hardware should be dip coated with appropriate ASTM galvanization process and specification as stated in the Bill of Materials. The posts were designed to be spaced 10 ft (3 m) on center. The overall height of the system is to be 48 in. (1,219 mm) above the ground. The parapet should consist of NE mix 47BD concrete or any concrete with a minimum concrete compressive strength of 4,000 psi (27.6 MPa). The reinforcement should consist of ASTM A615 Grade 60 #4 rebar steel coated with ASTM A775 or ASTM A934 epoxy. The stirrups are to be placed at 24 in. (610 mm) spacing and 12 in. (305 mm) at the end sections. A total of four longitudinal bars should be utilized with a vertical spacing of 10 1/4 in. (260 mm) between the two lower and two upper longitudinal bars.
175 Figure 96. Iowa Bicycle Rail System Layout 162
176 Figure 97. Iowa Bicycle Rail System Cross Section 163
177 Figure 98. Iowa Bicycle Rail Rail and Concrete Parapet Details 164
178 Figure 99. Iowa Bicycle Rail Rail and Concrete Parapet Details 165
179 Figure 100. Iowa Bicycle Rail Splice Plate Assembly 166
180 Figure 101. Iowa Bicycle Rail Splice Plate Component Details 167
181 Figure 102. Iowa Bicycle Rail Rail and Post Assembly 168
182 Figure 103. Iowa Bicycle Rail Rail Details 169
183 Figure 104. Iowa Bicycle Rail System Post and Base Plate Details 170
184 Figure 105. Iowa Bicycle Rail Concrete Parapet Assembly Details 171
185 Figure 106. Iowa Bicycle Rail Concrete Parapet Assembly Details 172
186 Figure 107. Iowa Bicycle Rail Concrete Parapet Reinforcement 173
187 Figure 108. Iowa Bicycle Rail Hardware 174
188 Figure 109. Iowa Bicycle Rail Bill of Materials 175
189 176 CHAPTER 8. SUMMARY AND RECOMMENDATIONS 8.1 Summary The objective of this study was to develop a TL-2 combination bridge separation barrier with upper bicycle railing for the IaDOT. The new system could be uses when sidewalks or trails are present on vehicular bridges. Existing combination barrier systems utilized by IaDOT were not previously crash tested to any impact safety standards. Thus, it was desired to have the new barrier system meet AASHTO MASH TL-2and be used on new construction projects. First, a literature search was conducted to review existing combination rails, lowheight parapets, vertical parapets, as well as ZOI studies pertaining to these systems, which can be found in CHAPTER 2. The reviewed systems and studies were used to provide guidance on the system design, such as rail, configuration and placement as well as parapet height. During this process, it was found that a limited number of crashworthy combination rails existed. Specifically, no MASH TL-2 combination rails or low-height, vertical-face parapets had been found, and limited research results existed on ZOI envelopes for these systems. Thus, the data gathered provided general guidance, but it could not be directly applied to the design. CHAPTER 3 discussed the initial simulation effort that was performed. This process began with the validation of the vehicle model using previous full-scale crash testing. Three initial models of MASH test designation no. 3-11, involving the 2270P Silverado truck model impacting the T222 barrier, were simulated. The results from those simulations were compared to results obtained in full-scale crash test no From these initial simulations, the vehicle model that performed most like the test vehicle
190 177 in the actual crash test was selected and refined to create a more accurate model. Friction parameters, tire models, barrier modeling techniques, and steering damping were all studied during the validation process in attempt to create better agreement between the simulation model and full-scale crash test data. Once the vehicle model was validated, the parapet height study was conducted using the validated model parameters. The parapet height study resulted in the selection of a 24-in. (610-mm) tall concrete barrier as simulation suggested that it would perform adequately while providing IaDOT with the lowest-height parapet. During the simulation of the impact event, the vehicle was captured and redirected with no vehicle override of the barrier system. From this effort, the ZOI of the vehicle at this height was analyzed to help determine the probability of vehicle-to-rail interaction and with placement of the rail to reduce the snag severity. The observed ZOI values produced suggested that vehicle interaction with a future bicycle railing was unavoidable, so the system needed to be designed while anticipating this interaction. Vehicle and system dimensions from previous full-scale crash tests were reviewed to also provide guidance on parapet height, as discussed in CHAPTER 4. The results from this review suggested that a 24 in. (610 mm) tall parapet would provide adequate height to capture and redirect the 2270P truck. This review also showed that systems lower than 24 in. (610 mm) safely captured and redirected the impacting vehicles under NCHRP 350 TL-2 conditions. However, these systems were tested to older crash test standards that used the smaller 2000P truck rather than the 2270P truck. So results of the previous tests could not be directly applied to the system at hand.
191 178 After selecting the parapet height, the bicycle railing design process began, which was initially discussed in CHAPTER 5. Multiple bicycle rail concepts were produced and presented to the IaDOT to receive input and feedback. The IaDOT selected the top mounted, offset-post, configuration using welded connections as the preferred design. An overall 48 in. (1,219 mm) was chosen along with the rail-to-rail connection method using splice tubes. The loading conditions from AASHTO s LRFD Bridge Design Specifications - were used to determine the section sizes. Capacities of the rail and post sections, baseplates, and welded connections were calculated using methods and procedures provided in AISC s Steel Construction Manual. This analysis led to the selection of a 3-in. x 2-in. x 1/8-in. (76-mm x 51-mm x 3-mm) rail section, a 2-in. x 2-in. x 1/8-in. (51-mm x 51-mm x 3-mm) post section, and a 9 ¼-in. x 7-in. x 5/8-in. (235-mm x 178-mm x 16-mm) baseplate, all connected with 1/8-in. (3- mm) fillet welds. The splice tube design process led to the selection of a built-up section using four 5/16 in. (8 mm) thick steel plates connected through the use of 1/8-in. (3-mm) fillet welds at the outer corners. To attach the bicycle rail to the concrete parapet, epoxy adhesive and threaded anchor rods were employed as per IaDOT s request. Originally, the connection was designed exactly as described in the ACI concrete code. The capacity of the anchorage connection in shear and tension was found with the methods described by ACI and compared with the expected/calculated system forces. Due to the width of the parapet, the process needed to be modified to consider the reduced available concrete area. The required embedment depth suggested a concrete area of influence that was larger than the width would allow. The capacity of the connection was then reduced by
192 179 the ratio of the unavailable area divided by the original assumed influence area. Thus, decreasing the capacity of the anchorage connection as embedment depth increased. This method suggested that a 6-in. (152-mm) embedment depth would provide the necessary capacity when the anchor rods were placed in the center of the parapet along the parapet s longitudinal axis. However, simulation of the system model showed much higher anchor rod tension forces than originally calculated. The anchorage connection was then redesigned using a hybrid method that took into consideration the reinforcement of the parapet using the higher tension values observed during simulation. This process led to the selection of a 12-in. (305-mm) anchor rod embedment depth as well as an increase in anchor rod grade and diameter. Using the preliminary design details found during the design process, a system model was created to study the performance of the system, as well as determine the CIP for future full-scale crash testing, as discussed in CHAPTER 6. The vehicle model and model parameters that were found during the validation effort were used for the simulation effort to examine the system behavior. The parapet was modeled as rigid shells with overall parapet dimensions of 24 in. (610 mm) tall by 10 in. (254 mm) wide by 100 ft (3 m) long. The rail sections, post sections, baseplates, and splice tube inserts were modeled as shells and used steel properties. The properties for each of the components was scaled or modified to better match the specific material properties that would be used during full-scale crash testing of the actual system. The connections between the post and baseplates, as well as the connections between the post and the rails, were modeled by simply merging the nodes at the intersection of the components. The splice tube bolts and anchor rods were modeled using solid elements with the
193 180 appropriate steel properties. Nodes of the anchor rods that intersected with the parapet model were merged to the parapet creating an infinitely-strong bond between them. The vehicle model was given an initial velocity of 44 mph (70 km/h) and an angle relative to the system of 25 degrees to simulate the MASH TL-2 testing conditions. During this process, the simulation was observed to ensure that the overall performance of the system was acceptable and used to determine if redesign of any component was necessary. Overall, the system was able to capture and redirect the vehicle successfully without the occurrence of unacceptable snagging of the vehicle. Also, the CIP for future full-scale crash testing was determined through the simulation of the vehicle impacting the barrier system model at multiple impact points. Due to the nature of the system, snag severity was considered to be the most important factor in determining the CIP. Several other parameters, such as, vehicle damage, system damage, vehicle accelerations and velocities, as well as vehicle overlap of the system were observed and measured. From this process, it was concluded that an impact 3.8 ft (1.2 m) US from a post would provide the highest probability of snag and the highest snag severity for all of the impact points simulated base on observed overlap. Thus this impact point was taken as the CIP to be used in full-scale crash testing. After the simulation effort was conducted, the barrier design details were confirmed and finalized for use in the full-scale crash testing program. The suggested final design system details are presented in CHAPTER Recommendations It is recommended that the proposed system undergo full-scale crash testing to evaluate system performance using MASH test designation no. 2-11, which involves the
194 P truck impacting the system with a velocity of 44 mph (70 km/h) at an angle of 25 degrees to evaluate the performance of the system. This test designation was selected due the 2270P providing the highest vehicle instability, potential for vehicle-to-rail interaction, and system loading. Test designation 2-10, which involves the 1100c vehicle was not considered to be as critical, due to the 1100C providing a higher vehicle stability height and lower head ejection concerns than the 2270P. The critical impact point is 45 5/8 in. (1158 mm) US from Post No. 4, as shown in Figure 96 within CHAPTER 7. Once the test is conducted, results should be analyzed in order to determine if the system meets the requirements for associated with test designation no of MASH.
195 182 CHAPTER 9. REFERENCES 1. Ross, H.E., Sicking, D.L., Zimmer, R.A., and Michie, J.D., Recommended Procedures for the Safety Performance Evaluation of Highway Features, National Cooperative Highway Research Program (NCHRP) Report 350, Transportation Research Board, Washington, D.C., Manual for Assessing Safety Hardware (MASH), Second Edition, American Association of State Highway and Transportation Officials (AASHTO), Washington, D.C., AASHTO LRFD Bridge Design Specifications, Seventh Edition, American Association of State Highway and Transportation Officials (AASHTO), Washington, D.C., Hirsch, T.J., Buth, C.E., and Campise, W., Aesthetically Pleasing Concrete Combination Pedstrian-Traffic Bridge Rail Texas Type C411, Research Report F, Texas Transportation Institute, Texas A&M University, College Station, Texas, October Hirsch, T.J. and Buth, C.E., Aesthetically Pleasing Concrete Combination Pedestrian-Traffic Bridge Rail, Transportation Research Record No Transportation Research Board. National Research Council, Washington D.C., December 1992, pages AASHTO LRFD Bridge Design Specifications, American Association of State Highway and Transportation Officials (AASHTO), Washington, D.C., Buth, C.E., Hirsch, T.J., and Menges, W.L., Testing Of New Bridge Rail and Transition Designs Volume III: Appendix B BR27D Bridge Railing, Report No. FHWA-RD , Texas Transportation Institute, Texas A&M University, College Station, Texas, June Bullard, D.L., Jr., Menges, W.L., and Buth, C.E., Development of Combination Pedestrian Traffic Bridge Railings. Transportation Research Record No Transportation Research Board. National Research Council, Washington D.C., December 1994, pages Alberson, D.C., Menges, L.W., Buth, C.E., Performance Level 1 Bridge Railings, Transportation Research Record No Transportation Research Board. National Research Council, Washington D.C., December 1995, pages Buth, C.E., Hirsch, T.J., and Menges, W.L., Testing Of New Bridge Rail and Transition Designs Volume III: Appendix G BR27C Bridge Railing, Report No. FHWA-RD , Texas Transportation Institute, Texas A&M University, College Station, Texas, June 1997.
196 Buth, C.E. and Menges. W.L., Testing and Evaluation of Retrofit Bridge Railings and Transition. Report No. FHWA-RD Submitted to the Office of Safety and Traffic Operations R&D. Federal Highway Administration, Performed by Texas Transportation Institute. Texas A&M University. College Station, Texas. January Meline, R., Jewell, J., and Peter, R., Vehicle Crash Tests of the Aesthetic, See- Through Concrete Bridge Rail With Sidewalk, Type 80 SW, Report No , Materials Engineering and Testing Services, California Department of Transportation, Sacramento, California. August Polivka, K.A., Faller, R.K., Keller, E.A., Sicking, D.L., Rohde, J.R., and Holloway, J.C., Design and Evaluation of the TL-4 Minnesota Combination Traffic/Bicycle Bridge Rail, Final Report to the Midwest States Regional Pooled Fund Program, Transportation Research Report No. TRP , Project No. SPR-3(17), Midwest Roadside Safety Facility, University of Nebraska-Lincoln, Lincoln, Nebraska, November Hascall, J.A., Polivka, K.A., Rohde, J.R., Faller, R.K.,Sicking, D.L., and Holloway, J.C., Design and Evaluation of an Open Traffic/Bicycle Bridge Railing System, Final Report to the Midwest States Regional Pooled Fund Program, Transportation Research Report No. TRP , Project No. SPR-3(17), Midwest Roadside Safety Facility, University of Nebraska-Lincoln, Lincoln, Nebraska, February 9, Whitesel D., Jewell, J., and Meline, R., Compliance Crash Testing of the Type 732SW Bridge Rail, Report No. FHWA/CA , Roadside Safety Research Group, California Department of Transportation, Sacramento, California. May 9, Hirsch, T.J., Buth, C.E., Campise W.L., and Kaderka, D., Crash Test of Texas T202, Report No. FHWA/TX-88/1179-2F, Texas Transportation Institute, Texas A&M University, College Station, Texas, May Buth, C.E., Williams, W.F., Bligh, R.P., Menges, W.L., and Butler, B.G., Tests 4, 5, & 6: NCHRP Report 350 Testing Of The Texas Type T202 Bridge Rail, Report No. FHWA/TX-99/1804-3, Texas Transportation Institute, Texas A&M University, College Station, Texas, December Buth, C.E., Williams, W.F., Bligh, R.P., Menges, W.L., and Haug, R.R., Performance Of The TxDOT T202 (MOD) Bridge Rail Reinforced With Fiber Reinforced Polymer Bars, Report No. FHWA/TX-03/ , Texas Transportation Institute, Texas A&M University, College Station, Texas, December Stout, D., Hinch, J., and Sawyer, D., Guardrail Testing Program: Final Report, Final Report to the Eastern Federal Lands Highway Division, Federal Highway
197 Administration, FHWA Report No. FHWA-RD , ENSCO Report No. FHWA-89-07, ENSCO, Inc., Springfield, Virginia, June Hancock, K.L., Hansen, A.G., and Mayer, J.B, Aesthetic Bridge Rails, Transitions, and Terminals For Park Roads and Parkways, Report No. FHWA-RD , Submitted to the Office of Safety and Traffic Operations R&D. Federal Highway Administration, Performed by The Science Corporation Engineering Systems Division, Northwest Washington, DC, May Post, E.R., Faller, R.K., Pfeifer, B.G., and Holloway, J.C., Full-Scale Vehicle Crash Test on the Iowa Steel Temporary Barrier Rail, Final Report to the Iowa Department of Transportation, Transportation Research Report No. TRP , Midwest Roadside Safety Facility, University of Nebraska-Lincoln, December Faller, R.K., Holloway, J.C., Pfeifer, B.G., and Rosson, B.T., Performance Level 1 Tests on the Nebraska Open Concrete Bridge Rail, Final Report to the Nebraska Department of Roads, Transportation Research Report No. TRP , Midwest Roadside Safety Facility, University of Nebraska-Lincoln, February Holloway, J.C., Faller, R.K., Wolford, D.F., Dye, D.L., Sicking, D.L., Performance Level 2 Tests on a 29-in. Open Concrete Bridge Rail, Final Report to the Midwest States Regional Pooled Fund Program, Transportation Research Report No. TRP , Midwest Roadside Safety Facility, University of Nebraska-Lincoln, June Polivka, K.A., Faller, R.K., Rohde, J.R., Reid, J.D., Sicking, D.L., and Holloway, J.C., Safety Performance Evaluation of the Nebraska Open Bridge Rail on an Inverted Tee Bridge Deck, Final Report to the Nebraska Department of Roads, Transportation Research Report No. TRP , Midwest Roadside Safety Facility, University of Nebraska-Lincoln, January 21, Guidry, T.R., and Beason, W.L., Development of a Low-Profile Portable Concrete Barrier, Report No. TX-92/990-4F, Texas Transportation Institute, Texas A&M University, College Station, Texas, November Bligh, R.P., Mak, K.K., and Hirsch, T.J., Evaluation of Tennessee Bridge Rail Designs, Report No. RF , Texas Transportation Institute, Texas A&M University, College Station, Texas, May Polivka, K.A., Faller, R.K., Sicking, D.L., Rohde, J.R., Reid, J.D., and Holloway, J.C., Development of a Low-Profile Bridge Rail for Test Level 2 Applications, Final report to the Midwest States Regional Pooled Fund Program, Transportation Research Report No. TRP , Midwest Roadside Safety Facility, University of Nebraska-Lincoln, August 20, 2002.
198 Consolazio, G., Gurley, K, Ellis, R., Wilkes, J, and Shriner, J, Temporary Low Profile Barrier Roadside Safety: Phase II, Report No. BC976, Department of Civil & Coastal Engineering, University of Florida, Gainesville, Florida, January Johnson, E.A., Faller, R.K., Reid, J.D., Sicking, D.L., Bielenberg, R.W., Lechtenberg, K.A., and Rosenbaugh, S.K., Analysis, Design, and Dynamic Evaluation of a TL-2 Rough Stone Masonry Guardwall. Final Report to the U.S. Department of Transportation Federal Highway Administration, Transportation Research Report No. TRP , Midwest Roadside Safety Facility, University of Nebraska-Lincoln, May 6, Reid, J.D., Faller, R.K., A New TL-2 Rough Stone Masonry Guardwall, Transportation Research Record: Journal of the Transportation Research Board, Washington, D.C., Keller E.A., Sicking, D.L., Faller, R.K., Polivka, K.A., and Rohde, J.R., Guidelines for Attachments to Bridge Rails and Median Barriers, Final Report to the Midwest States Regional Pooled Fund Program, Transportation Research Report No. TRP , Project No. SPR-3(17), Midwest Roadside Safety Facility, University of Nebraska-Lincoln, Lincoln, Nebraska, February 26, Halquist, L.O., LS-DYNA Keyword User s Manual. Version 970, Livermore California,Livermore software Technology Corporation, Williams, F.W., Bligh, R.P. and Menges. W.L., MASH Test 3-11 of the TxDOT T222 Bridge Rail. Report No. FHWA/TX-14/ Submitted to the Office of Safety and Traffic Operations R&D. Federal Highway Administration, Performed by Texas Transportation Institute. Texas A&M University. College Station, Texas. July Asadollahi Pajouh, M., Bielenberg, R.W., Schmidt, J.D., Lingenfelter, J., Faller, R.K., and Reid, J.D., Placement of Breakaway Light Poles Located Directly Behind Midwest Guardrail System (MGS), Final report to the Illinois Tollway, Transportation Research Report No. TRP , Midwest Roadside Safety Facility, University of Nebraska-Lincoln, June 29, Meyer, D.T., Reid, J.D., Lechtenberg, K.A., Bielenberg, R.W., and Faller, R.K., Increased Span Length for the MGS Long-Span Guardrail System Part II: Full-Scale Crash Testing, Final report to the Midwest States Regional Pooled Fund Program, Transportation Research Report No. TRP , Midwest Roadside Safety Facility, University of Nebraska-Lincoln, April 7, Rosenbaugh, S.K., Fallet, W.G., Faller, R.K., Bielenberg, R.W., Reid, J.D., 34-in. Tall Thrie Beam AGT to Concrete Buttress, Draft report to the Nebraska Department of Roads, Transportation Research Report No. TRP , Midwest Roadside Safety Facility, University of Nebraska-Lincoln, July 11, 2017.
199 Mash Testing of Bullnose with Break Away Steel Posts (Test Nos. MSPBN-1-3), Draft report to the Midwest States Regional Pooled Fund Program, Transportation Research Report No. TRP , Midwest Roadside Safety Facility, University of Nebraska-Lincoln, June 8, ADA Standards for Accessible Design, United States Department of Justice, September Steel Construction Manual, American Institute of Steel Design (AISC), Fifteenth Edition, First Printing, Steel Design Guide 1, American Institute of Steel Design (AISC), 2 nd Edition, First Printing, May ACI Committee 318, Building Code Requirements for Structural Concrete (ACI ) and commentary, Farmington Hills, Mi, American Concreate Institute, August Bielenberg, R.W., Reid, J.D., Rosenbaugh, S.K., Haase, A.J., and Faller, R.K., Attachment of Combination Rails to Concrete Parapets Utilizing Epoxy Adhesive Anchors. Final Report to the Iowa Department of Transportation, Transportation Research Report No. TRP , Midwest Roadside Safety Facility, University of Nebraska-Lincoln, November 3, Humphrey, B.M., Faller, R.K., Bielenberg, R.W., Reid, J.D, and Negahban, M., Improved Methodolgies in Modeling and Predicting Failure in AASHTO M-180 Guardrail Steel Using Finite Element Anlysis Phase 1, Final Report to the Nebraska Department Of Roads, Transportation Research Report No. TRP , Midwest Roadside Safety Facility, University of Nebraska-Lincoln, August 23, 2016.
200 CHAPTER 10. APPENDICES 187
201 Appendix A. Rail Design Calculation 188
202 189 Using the pedestrian/bicycle loading stated in AASHTO LRFD Bridge Design Specifications and the rail/post section configurations/equations discussed in CHAPTER 5, both shear loading and bending moments were calculated, as shown in Table A-1. Table A-1. Rail and Post - Shear and bending Moment Values Post Spacing (Rectangular) Distributed Load w 10 ft 50 lb/ft 120 in lb/in. Point Load P 200 lb Railing Height ft 22.5 in. XX 23 in. YY Rail Shear Horizontal Vertical Moment Horizontal Vertical Post Shear Moment XX YY 450 lb 250 lb lb-in lb-in. 700 lb lb-in lb-in. The section properties for various rectangular and square HSS ASTM A500 Grade C sections were all gathered from the AISC Steel Construction Manual and compiled into a Microsoft Excel spreadsheet. The section properties were then referenced
203 190 in ordered to calculate their capacities, using Microsoft Excel s formula functions, due to the loading conditions. Both the rail and post section properties that were selected for the final design are shown in Tables A-2 and A-3. Table A-2. Rail Section Details Property Value Units Rail section 3 x 2 x in. Rail height Nominal depth Nominal width Wall thickness, t 24 in. 3 in. 2 in in. h in. b in. b/t h/t S X-X in. 3 S Y-Y in. 3 Table A-3. Post Section Details Property Value Units Post section Post spacing Nominal depth Nominal width Wall thickness, t h b 2 x 2 x in. 120 in. 2 in. 2 in in in in. b/t h/t S X-X in. 3 S Y-Y in. 3
204 191 With the loads and capacities known, a comparison between the capacities and loads was performed to select the appropriate section. The comparison between capacity and load for the final selected sections is shown in Table A-4. Table A-4. Rail and Post - Load vs. Resistance Comparisons Rail Nominal Capacity Required Design Load XX Shear lb > 250 lb YY Shear lb > 450 lb XX Shear lb > 450 lb YY Shear lb > 250 lb Horizontal Moment lb-in > lb-in. Vertical Moment lb-in > 7500 lb-in. Normalized < 1 Horizontal Moment lb-in > lb-in. Vertical Moment lb-in > 7500 lb-in. Normalized < 1 Normalized < 1 Post Nominal Capacity Required Design Load XX Shear lb > 700 lb YY Shear lb > 700 lb XX Moment lb-in > lb-in YY Moment lb-in > lb-in Table A-5 displays the calculations performed for the process above using the equations discussed in CHAPTER 5. The calculations performed in Table A-5 were the same as used to populate the cells in both the Capacity and Required Design Load columns in Table A-4.


205 Table A-5. Rail and Post - Load and Capacity Calculations 192
206 193 Table A-6 displays the process followed, and the equations used to determine the required baseplate thickness using the AISC Steel Design Guide 1 for column baseplates. This process assumed an applied moment and axial load to the post from the pedestrian/bicycle loading. ASTM A572 Grade 50 steel properties were used to design the baseplate. Table A-6. AISC Baseplate Design Guide Calculations Variable Input Units Calculation Description B 9.25 in. Width of BP N 7 in. Depth of BP Pu 0.45 kips Axial Load on BP M 24.3 kip-in. Max Moment at Base of Post Fp ksi ϕ*0.85*fc'*sqrt(a1/a2) Allowable Bearing Stress Fp ksi ϕ*1.7*fc' Allowable Bearing Stress Fp 2.75 ksi Allowable Bearing Stress e 54.0 in. Ecentricity f' kips M/Pu A 7.13 in. 2 (f'+sqrt((f')^2-4*(fp*b/6)(pu*a'+m)))/(fp*b/3) length of bear stress block along N A 0.82 in. 2 (f'-sqrt((f')^2-4*(fp*b/6)(pu*a'+m)))/(fp*b/3) length of bear stress block along N T 9.97 kips (Fp*A*B/2)-Pu Tension in Anchors T/ T/2 Tension in each Anchor T lb Tension in Anchors T/ lb Tension in each Anchor Critical Section 2.55 in. (N-0.95d)/2 Critical Section m 2.55 in. (N-0.95d)/2 location of critcal section along N n in. (B-0.95d)/2 location of critical section along B fpu(m) ksi Fp*(A-m)/A Pressure at critical bending plane Mupl kip-in./in. (Fp*m^2/2)+((Fp-fpu(m))*m^2/3) Required moment strength Mupl 2.49 kip-in./in. T*(m-3)/(2*(m-3)) Required moment strength t 0.47 in. sqrt(4*mpl/(ϕ*fy)) required thickness The additional required thickness and anchor rod tension calculation process is shown in Figure A-1. This procedure is explained in the baseplate section of CHAPTER 5. Case 1 studied the condition where the pedestrian/bicycle loading was placed on the non-traffic side. Case 2 studied a loading applied on the vehicle traffic side that would exceed the post s moment capacity.
207 194 Figure A-1. Baseplate Additional Calculations The process followed, and equations used to calculate the load and capacities of the fillet welds used in the final design are shown in Table A-7. The calculations used in Table A-7 were the same used to populate the cells in Table A-8. The loads and capacities were compared to evaluate the section of interest s ability to resist the design loads.

208 Table A-7. Weld - Load and Capacity Calculations 195

209 196 Table A-8. Weld Connection Load vs. Resistance Comparisons Figures A-2 and A-3 both display the outputs from the hybrid epoxy anchorage design process. The process was performed using a modified Microsoft Excel spreadsheet that was produced to calculate the epoxy anchorage capacities according to ACI concrete code. The outputs shown were then compared to the anchor rod tensions and shear force values observed during simulation to ensure the connection provided adequate capacity.
1962: HRCS Circular 482 one-page document, specified vehicle mass, impact speed, and approach angle for crash tests.
 1 2 3 1962: HRCS Circular 482 one-page document, specified vehicle mass, impact speed, and approach angle for crash tests. 1973: NCHRP Report 153 16-page document, based on technical input from 70+ individuals
Advances in Simulating Corrugated Beam Barriers under Vehicular Impact
 13 th International LS-DYNA Users Conference Session: Automotive Advances in Simulating Corrugated Beam Barriers under Vehicular Impact Akram Abu-Odeh Texas A&M Transportation Institute Abstract W-beam
AASHTO Manual for Assessing Safety Hardware, AASHTO/FHWA Joint Implementation Plan Standing Committee on Highways September 24, 2015
 AASHTO Manual for Assessing Safety Hardware, 2015 AASHTO/FHWA Joint Implementation Plan Standing Committee on Highways September 24, 2015 Full Scale MASH Crash Tests (NCHRP 22-14(02)) Conducted several
A MASH Compliant W-Beam Median Guardrail System
 0 0 0 0 0 A MASH Compliant W-Beam Median Guardrail System By A. Y. Abu-Odeh, R. P. Bligh, W. Odell, A. Meza, and W. L. Menges Submitted: July 0, 0 Word Count:, + ( figures + tables=,000) =, words Authors:
INCREASED SPAN LENGTH FOR THE MGS LONG-SPAN GUARDRAIL SYSTEM
 University of Nebraska - Lincoln DigitalCommons@University of Nebraska - Lincoln Mechanical (and Materials) Engineering -- Dissertations, Theses, and Student Research Mechanical & Materials Engineering,
SAFETY PERFORMANCE OF WORK-ZONE DEVICES UNDER MASH TESTING
 SAFETY PERFORMANCE OF WORK-ZONE DEVICES UNDER MASH TESTING Schmidt, Faller, Lechtenberg, Sicking, Holloway Midwest Roadside Safety Facility Nebraska Transportation Center University of Nebraska-Lincoln
Crash Testing Growth Common Roadside Hardware Systems Draft FHWA and AASHTO Requirements for Implementing MASH 2015
 64 th Annual Illinois Traffic Safety and Engineering Conference October 14, 2015 Crash Testing Growth Common Roadside Hardware Systems Draft FHWA and AASHTO Requirements for Implementing MASH 2015 1 https://www.youtube.com/watch?feature
PR V2. Submitted by. Professor MIDWEST Vine Street (402) Submitted to
 Submitted to") FINAL REPORT PR4893118-V2 ZONE OF INTRUSION STUDY Submitted by John D. Reid, Ph.D. Professor Dean L.. Sicking, Ph.D., P.E. Professorr and MwRSF Director MIDWEST ROADSIDE SAFETY FACILITY University of Nebraska-Lincoln
FINAL REPORT PR4893118-V2 ZONE OF INTRUSION STUDY Submitted by John D. Reid, Ph.D. Professor Dean L.. Sicking, Ph.D., P.E. Professorr and MwRSF Director MIDWEST ROADSIDE SAFETY FACILITY University of Nebraska-Lincoln
Manual for Assessing Safety Hardware
 American Association of State Highway and Transportation Officials Manual for Assessing Safety Hardware 2009 vii PREFACE Effective traffic barrier systems, end treatments, crash cushions, breakaway devices,
Development and Validation of a Finite Element Model of an Energy-absorbing Guardrail End Terminal
 Development and Validation of a Finite Element Model of an Energy-absorbing Guardrail End Terminal Yunzhu Meng 1, Costin Untaroiu 1 1 Department of Biomedical Engineering and Virginia Tech, Blacksburg,
Evaluation and Design of ODOT s Type 5 Guardrail with Tubular Backup
 Evaluation and Design of ODOT s Type 5 Guardrail with Tubular Backup Draft Final Report Chuck A. Plaxico, Ph.D. James C. Kennedy, Jr., Ph.D. Charles R. Miele, P.E. for the Ohio Department of Transportation
SUMMARY CHANGES FOR NCHRP REPORT 350 GUIDELINES [NCHRP (02)] Keith A. Cota, Chairman Technical Committee on Roadside Safety June 14, 2007
![SUMMARY CHANGES FOR NCHRP REPORT 350 GUIDELINES [NCHRP (02)] Keith A. Cota, Chairman Technical Committee on Roadside Safety June 14, 2007](/thumbs/87/97351925.jpg "SUMMARY CHANGES FOR NCHRP REPORT 350 GUIDELINES [NCHRP (02)] Keith A. Cota, Chairman Technical Committee on Roadside Safety June 14, 2007") SUMMARY CHANGES FOR NCHRP REPORT 350 GUIDELINES [NCHRP 22-14 (02)] Keith A. Cota, Chairman Technical Committee on Roadside Safety June 14, 2007 BACKGROUND Circular 482 (1962) First full scale crash test
SUMMARY CHANGES FOR NCHRP REPORT 350 GUIDELINES [NCHRP 22-14 (02)] Keith A. Cota, Chairman Technical Committee on Roadside Safety June 14, 2007 BACKGROUND Circular 482 (1962) First full scale crash test
DEVELOPMENT OF A TRANSITION BETWEEN FREE-STANDING AND REDUCED-DEFLECTION PORTABLE CONCRETE BARRIERS PHASE I
 Research Project Number TPF-5(193) Supplement #78 DEVELOPMENT OF A TRANSITION BETWEEN FREE-STANDING AND REDUCED-DEFLECTION PORTABLE CONCRETE BARRIERS PHASE I Submitted by Mojdeh Asadollahi Pajouh, Ph.D.
VULCAN BARRIER TL-3 GENERAL SPECIFICATIONS
 VULCAN BARRIER TL-3 GENERAL SPECIFICATIONS I. GENERAL A. The VULCAN BARRIER TL-3 (VULCAN TL-3) shall be a highly portable and crashworthy longitudinal barrier especially suited for use as a temporary barrier
VERIFICATION & VALIDATION REPORT of MGS Barrier Impact with 1100C Vehicle Using Toyota Yaris Coarse FE Model
 VERIFICATION & VALIDATION REPORT of MGS Barrier Impact with 1100C Vehicle Using Toyota Yaris Coarse FE Model CCSA VALIDATION/VERIFICATION REPORT Page 1 of 4 Project: CCSA Longitudinal Barriers on Curved,
VULCAN BARRIER TL-3 GENERAL SPECIFICATIONS
 VULCAN BARRIER TL-3 GENERAL SPECIFICATIONS I. GENERAL A. The VULCAN BARRIER TL-3 (VULCAN TL-3) shall be a highly portable and crashworthy longitudinal barrier especially suited for use as a temporary barrier
Implementation of AASHTO s Manual for Assessing Safety Hardware (MASH) 2016
 2016") Implementation of AASHTO s Manual for Assessing Safety Hardware (MASH) 2016 Update from the Technical Committee on Roadside Safety Keith Cota, New Hampshire DOT MASH 2016 Overview Background Ballot Results/Dates
Implementation of AASHTO s Manual for Assessing Safety Hardware (MASH) 2016 Update from the Technical Committee on Roadside Safety Keith Cota, New Hampshire DOT MASH 2016 Overview Background Ballot Results/Dates
Improving Roadside Safety by Computer Simulation
 A2A04:Committee on Roadside Safety Features Chairman: John F. Carney, III, Worcester Polytechnic Institute Improving Roadside Safety by Computer Simulation DEAN L. SICKING, University of Nebraska, Lincoln
DEVELOPMENT OF A MASH TL-3 TRANSITION BETWEEN GUARDRAIL AND PORTABLE CONCRETE BARRIERS
 Duplication for publication or sale is strictly prohibited without prior written permission of the Transportation Research Board Paper No. 17-01712 DEVELOPMENT OF A MASH TL-3 TRANSITION BETWEEN GUARDRAIL
Assessing Options for Improving Roadside Barrier Crashworthiness
 13 th International LS-DYNA Users Conference Session: Simulation Assessing Options for Improving Roadside Barrier Crashworthiness D. Marzougui, C.D. Kan, and K.S. Opiela Center for Collision Safety and
Product Specification. ABSORB 350 TM TL-2 Non-Redirective, Gating, Crash Cushion Applied to Quickchange Moveable Barrier
 TB 000612 Rev. 0 Page 1 of 9 Product Specification ABSORB 350 TM TL-2 Non-Redirective, Gating, Crash Cushion Applied to Quickchange Moveable Barrier I. General The ABSORB 350 TM TL-2 System is a Non-Redirective,
Texas Transportation Institute The Texas A&M University System College Station, Texas
 1. Report No. FHWA/TX-07/0-5527-1 4. Title and Subtitle DEVELOPMENT OF A LOW-PROFILE TO F-SHAPE TRANSITION BARRIER SEGMENT 2. Government Accession No. 3. Recipient's Catalog No. Technical Report Documentation
Evaluation of the Midwest Guardrail System stiffness transition with curb
 University of Nebraska - Lincoln DigitalCommons@University of Nebraska - Lincoln Civil Engineering Faculty Publications Civil Engineering 2016 Evaluation of the Midwest Guardrail System stiffness transition
Development of Combination Pedestrian-Traffic Bridge Railings
 TRANSPORTATION RESEARCH RECORD 1468 41 Development of Combination Pedestrian-Traffic Bridge Railings D. LANCE BULLARD, JR., WANDA L. MENGES, AND C. EUGENE BUTH Two bridge railing designs have been developed
Working Paper. Development and Validation of a Pick-Up Truck Suspension Finite Element Model for Use in Crash Simulation
 Working Paper NCAC 2003-W-003 October 2003 Development and Validation of a Pick-Up Truck Suspension Finite Element Model for Use in Crash Simulation Dhafer Marzougui Cing-Dao (Steve) Kan Matthias Zink
COMPARISON OF THE IMPACT PERFORMANCE OF THE G4(1W) AND G4(2W) GUARDRAIL SYSTEMS UNDER NCHRP REPORT 350 TEST 3-11 CONDITIONS
 AND G4(2W) GUARDRAIL SYSTEMS UNDER NCHRP REPORT 350 TEST 3-11 CONDITIONS") Paper No. 00-0525 COMPARISON OF THE IMPACT PERFORMANCE OF THE G4(1W) AND G4(2W) GUARDRAIL SYSTEMS UNDER NCHRP REPORT 350 TEST 3-11 CONDITIONS by Chuck A. Plaxico Associate Research Engineer Worcester Polytechnic
Paper No. 00-0525 COMPARISON OF THE IMPACT PERFORMANCE OF THE G4(1W) AND G4(2W) GUARDRAIL SYSTEMS UNDER NCHRP REPORT 350 TEST 3-11 CONDITIONS by Chuck A. Plaxico Associate Research Engineer Worcester Polytechnic
Technical Report Documentation Page 2. Government Accession No. 3. Recipient's Catalog No. 1. Report No. FHWA/TX-09/
 1. Report No. FHWA/TX-09/0-6071-1 4. Title and Subtitle ANALYSIS OF ROADSIDE SAFETY DEVICES FOR USE ON VERY HIGH-SPEED ROADWAYS Technical Report Documentation Page 2. Government Accession No. 3. Recipient's
MASH 2016 Implementation: What, When and Why
 MASH 2016 Implementation: What, When and Why Roger P. Bligh, Ph.D., P.E. Senior Research Engineer Texas A&M Transportation Institute June 7, 2016 2016 Traffic Safety Conference College Station, Texas Outline
Simulation of Structural Latches in an Automotive Seat System Using LS-DYNA
 Simulation of Structural Latches in an Automotive Seat System Using LS-DYNA Tuhin Halder Lear Corporation, U152 Group 5200, Auto Club Drive Dearborn, MI 48126 USA. + 313 845 0492 thalder@ford.com Keywords:
June 5, In Reply Refer To: HSSD/B-178. Mr. Kevin K. Groeneweg Mobile Barriers LLC Genesee Trail Road Golden, CO Dear Mr.
 June 5, 2008 1200 New Jersey Avenue, SE. Washington, DC 20590 In Reply Refer To: HSSD/B-178 Mr. Kevin K. Groeneweg Mobile Barriers LLC 24918 Genesee Trail Road Golden, CO 80401 Dear Mr. Groeneweg: This
ArmorGuard Barrier Portable Longitudinal Barrier
 ArmorGuard Barrier Portable Longitudinal Barrier Installation & Maintenance Manual AGB I&M 082409 Page 1 of 12 ArmorGuard Barrier Table of contents Preface... 2 Applications and System Characteristics
BarrierGate. General Specifications. Manual Operations General Specifications
 BarrierGate General Specifications Manual Operations General Specifications BarrierGate GENERAL SPECIFICATIONS I. GENERAL A. The BarrierGate system (the gate) shall be designed and manufactured by Energy
MODELING SUSPENSION DAMPER MODULES USING LS-DYNA
 MODELING SUSPENSION DAMPER MODULES USING LS-DYNA Jason J. Tao Delphi Automotive Systems Energy & Chassis Systems Division 435 Cincinnati Street Dayton, OH 4548 Telephone: (937) 455-6298 E-mail: Jason.J.Tao@Delphiauto.com
CRITICAL FLARE RATES FOR W-BEAM GUARDRAIL DETERMINING MAXIMUM CAPACITY USING COMPUTER SIMULATION NCHRP 17-20(3)
") CRITICAL FLARE RATES FOR W-BEAM GUARDRAIL DETERMINING MAXIMUM CAPACITY USING COMPUTER SIMULATION NCHRP 17-2(3) Submitted by Beau D. Kuipers, B.S.M.E., E.I.T. Graduate Research Assistant Ronald K. Faller,
CRITICAL FLARE RATES FOR W-BEAM GUARDRAIL DETERMINING MAXIMUM CAPACITY USING COMPUTER SIMULATION NCHRP 17-2(3) Submitted by Beau D. Kuipers, B.S.M.E., E.I.T. Graduate Research Assistant Ronald K. Faller,
July 10, Refer to: HSA-10/CC-78A
 July 10, 2003 Refer to: HSA-10/CC-78A Barry D. Stephens, P.E. Senior Vice President of Engineering ENERGY ABSORPTION Systems, Inc. 3617 Cincinnati Avenue Rocklin, California 95765 Dear Mr. Stephens: Your
Guide Rail Safety Symposium
 Ministry of Transportation Guide Rail Safety Symposium MTO Provincial Roadside Safety Update Mark C. Ayton, P. Eng. Senior Engineer, Highway Design MTO Highway Standards Branch MTO Provincial Roadside
ArmorGuard Barrier Portable Longitudinal Barrier
 ArmorGuard Barrier Portable Longitudinal Barrier Installation & Maintenance Manual AGB I&M 112811 Page 1 of 13 ArmorGuard Barrier Table of contents Preface... 2 Applications and System Characteristics
Texas Transportation Institute The Texas A&M University System College Station, Texas
 1. Report No. FHWA/TX-05/9-8132-P7 4. Title and Subtitle TL-4 CRASH TESTING OF THE F411 BRIDGE RAIL 2. Government Accession No. 3. Recipient's Catalog No. 5. Report Date October 2004 Technical Report Documentation
DYNAMICS AND SAFETY ASSESSMENT OF A TRUCK IMPACT ONTO VARIOUS TYPES OF ROADSIDE CONCRETE BARRIERS ON CURVED ROADS. A Thesis by. Prasanna K Parvatikar
 DYNAMICS AND SAFETY ASSESSMENT OF A TRUCK IMPACT ONTO VARIOUS TYPES OF ROADSIDE CONCRETE BARRIERS ON CURVED ROADS A Thesis by Prasanna K Parvatikar Master of Science, Wichita State University, 2007 Bachelor
Form DOT F (8-72) Texas Transportation Institute The Texas A&M University System College Station, Texas
 Texas Transportation Institute The Texas A&M University System College Station, Texas") 1. Report No. FHWA/TX-02/4162-1 Technical Report Documentation Page 2. Government Accession No. 3. Recipient's Catalog No. 4. Title and Subtitle EVALUATION OF TEXAS GRID-SLOT PORTABLE CONCRETE BARRIER
1. Report No. FHWA/TX-02/4162-1 Technical Report Documentation Page 2. Government Accession No. 3. Recipient's Catalog No. 4. Title and Subtitle EVALUATION OF TEXAS GRID-SLOT PORTABLE CONCRETE BARRIER
Analysis of Existing Work-Zone Sign Supports Using Manual for Assessing Safety Hardware Safety Performance Criteria
 University of Nebraska - Lincoln DigitalCommons@University of Nebraska - Lincoln Civil Engineering Faculty Publications Civil Engineering 2011 Analysis of Existing Work-Zone Sign Supports Using Manual
February 8, In Reply Refer To: HSSD/CC-104
 February 8, 2008 200 New Jersey Avenue, SE. Washington, DC 20590 In Reply Refer To: HSSD/CC-04 Barry D. Stephens, P.E. Sr. Vice President Engineering Energy Absorption Systems, Inc. 367 Cincinnati Avenue
Crash Performance of Strong-Post W-Beam Guardrail with Missing Blockouts Carolyn E. Hampton and Hampton C. Gabler
 Crash Performance of Strong-Post W-Beam Guardrail with Missing Blockouts Carolyn E. Hampton and Hampton C. Gabler Virginia Tech Center for Injury Biomechanics, Blacksburg VA 24061 Abstract Missing blockouts
NUMERICAL ANALYSIS OF IMPACT BETWEEN SHUNTING LOCOMOTIVE AND SELECTED ROAD VEHICLE
 Journal of KONES Powertrain and Transport, Vol. 21, No. 4 2014 ISSN: 1231-4005 e-issn: 2354-0133 ICID: 1130437 DOI: 10.5604/12314005.1130437 NUMERICAL ANALYSIS OF IMPACT BETWEEN SHUNTING LOCOMOTIVE AND
EXTENDING TL-2 SHORT-RADIUS GUARDRAIL TO LARGER RADII
 Research Project Number TPF-5(193) Supplement 27 EXTENDING TL-2 SHORT-RADIUS GUARDRAIL TO LARGER RADII Submitted by Cody S. Stolle, Ph.D., E.I.T. Post-Doctoral Research Associate Robert W. Bielenberg,
PARAPETS / RAILS / MEDIANS / SIDEWALKS TABLE OF CONTENTS CHAPTER 25
 TABLE OF CONTENTS CHAPTER 25 FILE NO. TITLE DATE TABLE OF CONTENTS AND INTRODUCTION 25.TOC-1 Table of Contents Chapter 25... 28Dec2016 25.00 Introduction Chapter 25... 28Dec2016 VDOT STANDARD PARAPETS
safedirection.com.au Ref: PM 017/02
 DISTRIBUTOR 0 Product Manual Ref: PM 017/02 Table of Contents 1.0 Introduction... 3 2.0 The... 3 3.0 How the Functions... 4 4.0 Crash Test Performance... 4 5.0 Characteristics of Terminals... 5 5.1 Gating
July 17, In Reply Refer To: HSSD/B-176A
 July 17, 2008 1200 New Jersey Avenue, SE. Washington, DC 20590 In Reply Refer To: HSSD/B-176A Mr. John Addy Hill & Smith Springvale Business and Industrial Park Bliston, Wolverhampton, West Midlands, UK,
Technical Report Documentation Page Form DOT F (8-72) Reproduction of completed page authorized
 Reproduction of completed page authorized") 1. Report No. FHWA/TX-05/0-4162-3 4. Title and Subtitle 2. Government Accession No. 3. Recipient's Catalog No. DEVELOPMENT OF LOW-DEFLECTION PRECAST CONCRETE ARRIER 5. Report Date January 2005 Technical
1. Report No. FHWA/TX-05/0-4162-3 4. Title and Subtitle 2. Government Accession No. 3. Recipient's Catalog No. DEVELOPMENT OF LOW-DEFLECTION PRECAST CONCRETE ARRIER 5. Report Date January 2005 Technical
Midwest Guardrail System Without Blockouts
 Duplication for publication or sale is strictly prohibited without prior written permission of the Transportation Research Board Paper No. 13-0418 Midwest Guardrail System Without Blockouts by John D.
ROBUST PROJECT Norwegian Public Roads Administration / Force Technology Norway AS
 ROBUST PROJECT Norwegian Public Roads Administration / Force Technology Norway AS Evaluation of small car - RM_R1 - prepared by Politecnico di Milano Volume 1 of 1 January 2006 Doc. No.: ROBUST-5-002/TR-2004-0039
Evaluation of Barriers for Very High Speed Roadways
 TTI: 0-6071 Evaluation of Barriers for Very High Speed Roadways ISO 17025 Laboratory Testing Certificate # 2821.01 Crash testing performed at: TTI Proving Ground 3100 SH 47, Building 7091 Bryan, TX 77807
DEVELOPMENT OF A MASH TL-3 MEDIAN BARRIER GATE
 TTI: 9-1002 DEVELOPMENT OF A MASH TL-3 MEDIAN BARRIER GATE ISO 17025 Laboratory Testing Certificate # 2821.01 Crash testing performed at: TTI Proving Ground 3100 SH 47, Building 7091 Bryan, TX 77807 Research/Test
TRACC. Trinity Attenuating Crash Cushion
 TRACC Trinity Attenuating Crash Cushion CSP Pacific Business Unit of Fletcher Concrete & Infrastructure Limited 306 Neilson Street Onehunga, Auckland Phone: (09) 634 1239 or 0800 655 200 Fax: (09) 634
Vehicle Dynamic Simulation Using A Non-Linear Finite Element Simulation Program (LS-DYNA)
") Vehicle Dynamic Simulation Using A Non-Linear Finite Element Simulation Program (LS-DYNA) G. S. Choi and H. K. Min Kia Motors Technical Center 3-61 INTRODUCTION The reason manufacturers invest their time
Vehicle Dynamic Simulation Using A Non-Linear Finite Element Simulation Program (LS-DYNA) G. S. Choi and H. K. Min Kia Motors Technical Center 3-61 INTRODUCTION The reason manufacturers invest their time
PRODUCT DESCRIPTION. X-Tension DS. is suitable for all road types: Motorways, country roads, city streets for speed categories up to 110 km/h.
 INDEX Introduction 2 Product Description 3 Installation 6 Specifications 7 Crash Tests Table 8 Reusability 9 FAQ 10 Annexes 14 Drawings 15 Pictures 16 Crash Tests Results 18 Approvals 23 INTRODUCTION Improving
STI Project: Barrier Systems, Inc. RTS-QMB Longitudinal Barrier. Page 38 of 40 QBOR1. Appendix F (Continued) Figure F-3
 Figure F-3") Barrier Systems, Inc. RTS-QMB Longitudinal Barrier STI Project: QBOR1 Page 38 of 40 Appendix F (Continued) Figure F-3 t=.500sec 115 meters overall 37.1 Impact Severity (kj).. 141.6 Angle (deg).. 25 Speed
Barrier Systems, Inc. RTS-QMB Longitudinal Barrier STI Project: QBOR1 Page 38 of 40 Appendix F (Continued) Figure F-3 t=.500sec 115 meters overall 37.1 Impact Severity (kj).. 141.6 Angle (deg).. 25 Speed
Methodologies and Examples for Efficient Short and Long Duration Integrated Occupant-Vehicle Crash Simulation
 13 th International LS-DYNA Users Conference Session: Automotive Methodologies and Examples for Efficient Short and Long Duration Integrated Occupant-Vehicle Crash Simulation R. Reichert, C.-D. Kan, D.
Development of a Finite Element Model of a Motorcycle
 Development of a Finite Element Model of a Motorcycle N. Schulz, C. Silvestri Dobrovolny and S. Hurlebaus Texas A&M Transportation Institute Abstract Over the past years, extensive research efforts have
MINIMUM EFFECTIVE LENGTH FOR THE MIDWEST GUARDRAIL SYSTEM
 Duplication for publication or sale is strictly prohibited without prior written permission of the Transportation Research Board Paper No. 15-0484 MINIMUM EFFECTIVE LENGTH FOR THE MIDWEST GUARDRAIL SYSTEM
Evaluation of the Midwest Guardrail System Stiffness Transition with Curb
 Duplication for publication or sale is strictly prohibited without prior written permission of the Transportation Research Board Paper No. -0 Evaluation of the Midwest Guardrail System Stiffness Transition
Universal TAU-IIR Redirective, Non-Gating, Crash Cushion
 TB 110927 Rev. 0 Page 1 of 5 Product Specification Universal TAU-IIR Redirective, Non-Gating, Crash Cushion I. General The Universal TAU-IIR system is a Redirective, Non-Gating Crash Cushion in accordance
TEST MATRICES FOR EVALUATING CABLE MEDIAN BARRIERS PLACED IN V-DITCHES
 Midwest States Regional Pooled Fund Research Program Fiscal Year 2012 (Year 22) Research Project Number TPF-5(193) Supplement #44 NDOR Sponsoring Agency Code RPFP-12-CABLE1&2 TEST MATRICES FOR EVALUATING
Guardrail/Bridgerail Recommendations for Very Low Volume Local Roads in Kansas
 Guardrail/Bridgerail Recommendations for Very Low Volume Local Roads in Kansas MINK Conference September 20, 2017 Ronald J. Seitz, P.E. and Tod Salfrank The Problem The Local Road System in Kansas is Very
Performance Based Design for Bridge Piers Impacted by Heavy Trucks
 Performance Based Design for Bridge Piers Impacted by Heavy Trucks Anil K. Agrawal, Ph.D., P.E., Ran Cao and Xiaochen Xu The City College of New York, New York, NY Sherif El-Tawil, Ph.D. University of
June 27, In Reply Refer To: HSSD/B-176
 June 27, 2008 1200 New Jersey Avenue, SE. Washington, DC 20590 In Reply Refer To: HSSD/B-176 Mr. John Addy Hill & Smith Springvale Business and Industrial Park Bliston, Wolverhampton, West Midlands, UK,
Simulation and Validation of FMVSS 207/210 Using LS-DYNA
 7 th International LS-DYNA Users Conference Simulation Technology (2) Simulation and Validation of FMVSS 207/210 Using LS-DYNA Vikas Patwardhan Tuhin Halder Frank Xu Babushankar Sambamoorthy Lear Corporation
*Friedman Research Corporation, 1508-B Ferguson Lane, Austin, TX ** Center for Injury Research, Santa Barbara, CA, 93109
 Analysis of factors affecting ambulance compartment integrity test results and their relationship to real-world impact conditions. G Mattos*, K. Friedman*, J Paver**, J Hutchinson*, K Bui* & A Jafri* *Friedman
Continued Development of a Non-Proprietary, High-Tension, Cable End Terminal System
 University of Nebraska - Lincoln DigitalCommons@University of Nebraska - Lincoln Nebraska Department of Transportation Research Reports Nebraska LTAP 4-29-2016 Continued Development of a Non-Proprietary,
Stationary Bike Generator System
 Central Washington University ScholarWorks@CWU All Undergraduate Projects Undergraduate Student Projects Spring 2017 Stationary Bike Generator System Rakan Alghamdi Central Washington University, rk_rk11@hotmail.com
Evaluating The Relevancy Of Current Crash Test Guidelines For Roadside Safety Barriers On High Speed Roads
 Evaluating The Relevancy Of Current Crash Test Guidelines For Roadside Safety Barriers On High Speed Roads Connie Xavier Dominique Lord Chiara Dobrovolny Roger Bligh TRB 1 st International Roadside Safety
Research Project Number SPR-P1(13)M326 DEVELOPMENT OF A MASH TL-3 TRANSITION BETWEEN GUARDRAIL AND PORTABLE CONCRETE BARRIERS.
M326 DEVELOPMENT OF A MASH TL-3 TRANSITION BETWEEN GUARDRAIL AND PORTABLE CONCRETE BARRIERS.") Research Project Number SPR-P1(13)M326 DEVELOPMENT OF A MASH TL-3 TRANSITION BETWEEN GUARDRAIL AND PORTABLE CONCRETE BARRIERS Submitted by David A. Gutierrez, B.S.C.E., E.I.T. Graduate Research Assistant
Research Project Number SPR-P1(13)M326 DEVELOPMENT OF A MASH TL-3 TRANSITION BETWEEN GUARDRAIL AND PORTABLE CONCRETE BARRIERS Submitted by David A. Gutierrez, B.S.C.E., E.I.T. Graduate Research Assistant
PARAPETS / RAILS / MEDIANS / SIDEWALKS TABLE OF CONTENTS CHAPTER 25
 TABLE OF CONTENTS CHAPTER 25 FILE NO. TITLE DATE TABLE OF CONTENTS AND INTRODUCTION 25.TOC-1 Table of Contents Chapter 25... 08Aug2018 25.00 Introduction Chapter 25... 03May2018 VDOT STANDARD PARAPETS
Improvement Design of Vehicle s Front Rails for Dynamic Impact
 5 th European LS-DYNA Users Conference Crash Technology (1) Improvement Design of Vehicle s Front Rails for Dynamic Impact Authors: Chien-Hsun Wu, Automotive research & testing center Chung-Yung Tung,
July 15, In Ford s letter of May 2003 to law enforcement customers, Ford stated:
 Mr. Douglass B. Lampe Office of General Counsel Ford Motor Company The American Road Dearborn, MI 48126 Re: Ford Crown Victoria Police Interceptors Dear Mr. Lampe: Independent crash testing commissioned
An Analysis of Less Hazardous Roadside Signposts. By Andrei Lozzi & Paul Briozzo Dept of Mechanical & Mechatronic Engineering University of Sydney
 An Analysis of Less Hazardous Roadside Signposts By Andrei Lozzi & Paul Briozzo Dept of Mechanical & Mechatronic Engineering University of Sydney 1 Abstract This work arrives at an overview of requirements
Impact analysis of a vertical flared back bridge rail-to-guardrail transition structure using simulation
 Finite Elements in Analysis and Design 41 (2005) 371 396 www.elsevier.com/locate/finel Impact analysis of a vertical flared back bridge rail-to-guardrail transition structure using simulation Ali O. Atahan,
Conventional Approach
 Session 6 Jack Broz, PE, HR Green May 5-7, 2010 Conventional Approach Classification required by Federal law General Categories: Arterial Collector Local 6-1 Functional Classifications Changing Road Classification
Texas Transportation Institute The Texas A&M University System College Station, Texas
 1. Report No. FHWA/TX-04/9-8132-1 4. Title and Subtitle TESTING AND EVALUATION OF THE FLORIDA JERSEY SAFETY SHAPED BRIDGE RAIL 2. Government Accession No. 3. Recipient's Catalog No. 5. Report Date February
Abaqus Technology Brief. Automobile Roof Crush Analysis with Abaqus
 Abaqus Technology Brief Automobile Roof Crush Analysis with Abaqus TB-06-RCA-1 Revised: April 2007. Summary The National Highway Traffic Safety Administration (NHTSA) mandates the use of certain test procedures
November 16, 1998 Refer to: HNG-14. Mr. David Allardyce Mechanical Engineer B&B Electromatic Main Street Norwood, Louisiana 70761
 November 16, 1998 Refer to: HNG-14 Mr. David Allardyce Mechanical Engineer B&B Electromatic 14113 Main Street Norwood, Louisiana 70761 Dear Mr. Allardyce: In your August 31 letter, you presented some preliminary
s MEDIAN BARRIERS FOR TEXAS HIGHWAYS
 s MEDIAN BARRIERS FOR TEXAS HIGHWAYS SUMMARY REPORT of Research Report Number 146-4 Study 2-8-68-146 Cooperative Research Program of the Texas Transportation Institute and the Texas Highway Department
W-Beam Guiderail Transition from Light to Heavy Posts
 TRANSPORTATION RESEARCH RECORD 1198 55 W-Beam Guiderail Transition from Light to Heavy Posts DONALD G. HERRING AND JAMES E. BRYDEN Two full-scale crash tests evaluated a transition between lightand heavy-post
DESIGN FOR CRASHWORTHINESS
 - The main function of the body structure is to protect occupants in a collision - There are many standard crash tests and performance levels - For the USA, these standards are contained in Federal Motor
Development of a TL-5 Vertical Faced Concrete Median Barrier Incorporating Head Ejection Criteria
 Midwest States Regional Pooled Fund Research Program Fiscal Year 2004-2005 (Year 15) Research Project Number SPR-3(017) NDOR Sponsoring Agency Code RPFP-05-01 Development of a TL-5 Vertical Faced Median
INCREASED SPAN LENGTH FOR THE MGS LONG-SPAN GUARDRAIL SYSTEM PART III: FAILURE ANALYSIS
 Midwest States Pooled Fund Research Program Fiscal Years 2013 (Years 23) Research Project Number TPF-5(193) Supplement #56 NDOR Sponsoring Agency Code RPFP-13-MGS-3 INCREASED SPAN LENGTH FOR THE MGS LONG-SPAN
CrashGard. Sand Barrel System Product Guide
 Product Guide General Information PSS CrashGard is a non-redirective, gating sand barrel, or crash cushion. Sand barrels are designed to protect fixed objects, whether permanent or temporary. Sand barrels
DEFLECTION LIMITS FOR TEMPORARY CONCRETE BARRIERS
 Midwest State s Regional Pooled Fund Research Program Fiscal Year 1998-1999 (Year 9) NDOR Research Project Number SPR-3(017) DEFLECTION LIMITS FOR TEMPORARY CONCRETE BARRIERS Submitted by Dean L. Sicking,
FINITE ELEMENT METHOD IN CAR COMPATIBILITY PHENOMENA
 Journal of KONES Powertrain and Transport, Vol. 18, No. 4 2011 FINITE ELEMENT METHOD IN CAR COMPATIBILITY PHENOMENA Marcin Lisiecki Technical University of Warsaw Faculty of Power and Aeronautical Engineering
Development and Implementation of the Simplified MGS Stiffness Transition
 Duplication for publication or sale is strictly prohibited without prior written permission of the Transportation Research Board Paper No. 12-3367 Development and Implementation of the Simplified MGS Stiffness
Racing Tires in Formula SAE Suspension Development
 The University of Western Ontario Department of Mechanical and Materials Engineering MME419 Mechanical Engineering Project MME499 Mechanical Engineering Design (Industrial) Racing Tires in Formula SAE
ROOF CRUSH SIMULATION OF PASSENGER CAR FOR IMPROVING OCCUPANT SAFETY IN CABIN
 ROOF CRUSH SIMULATION OF PASSENGER CAR FOR IMPROVING OCCUPANT SAFETY IN CABIN Anandkumar. M. Padashetti M.Tech student (Design Engineering), Mechanical Engineering, K L E Dr. M S Sheshagiri College of
An Evaluation of Active Knee Bolsters
 8 th International LS-DYNA Users Conference Crash/Safety (1) An Evaluation of Active Knee Bolsters Zane Z. Yang Delphi Corporation Abstract In the present paper, the impact between an active knee bolster
Influence of Different Platen Angles and Selected Roof Header Reinforcements on the Quasi Static Roof Strength of a 2003 Ford Explorer FE Model
 Influence of Different Platen Angles and Selected Roof Header Reinforcements on the Quasi Static Roof Strength of a 2003 Ford Explorer FE Model Joachim Scheub, Fadi Tahan, Kennerly Digges, Cing Dao Kan
Effectiveness of ECP Brakes in Reducing the Risks Associated with HHFT Trains
 Effectiveness of ECP Brakes in Reducing the Risks Associated with HHFT Trains Presented To The National Academy of Sciences Review Committee October 14, 2016 Slide 1 1 Agenda Background leading to HM-251
WP5 - Computational Mechanics B5 - Temporary Vertical Concrete Safety Barrier MAIN REPORT Volume 1 of 1
 ROBUST PROJECT TRL Limited WP5 - Computational Mechanics B5 - Temporary Vertical Concrete Safety Barrier MAIN REPORT Volume 1 of 1 December 2005 Doc. No.: ROBUST-5-010c Rev. 0. (Logo here) Main Report
Virginia Department of Transportation
 TEST REPORT FOR: Virginia Department of Transportation SKT SP 350 50 (15.24 m) System PREPARED FOR: Virginia Department of Transportation 1401 E. Broad St. Richmond, VA 23219 TEST REPORT NUMBER: REPORT
April 22, In Reply Refer To: HSA-10/WZ-206. Mr. Jan Miller TrafFix Devices 220 Calle Pintoresco San Clemente, California Dear Mr.
 April 22, 2005 400 Seventh St., S.W. Washington, D.C. 20590 In Reply Refer To: HSA-10/WZ-206 Mr. Jan Miller TrafFix Devices 220 Calle Pintoresco San Clemente, California 92672 Dear Mr. Miller: Thank you
ADVANCED HIGH-STRENGTH STEEL FRONT RAIL SYSTEM PHASE II
 ADVANCED HIGH-STRENGTH STEEL FRONT RAIL SYSTEM PHASE II John Catterall General Motors Corporation Background Lightweighting initiatives have demonstrated that advanced high strength steels (AHSS) can be
Petition for Rulemaking; 49 CFR Part 571 Federal Motor Vehicle Safety Standards; Rear Impact Guards; Rear Impact Protection
 The Honorable David L. Strickland Administrator National Highway Traffic Safety Administration 1200 New Jersey Avenue, SE Washington, D.C. 20590 Petition for Rulemaking; 49 CFR Part 571 Federal Motor Vehicle