EXTENDING TL-2 SHORT-RADIUS GUARDRAIL TO LARGER RADII
|
|
|
- Martin Carson
- 5 years ago
- Views:
Transcription


1 Research Project Number TPF-5(193) Supplement 27 EXTENDING TL-2 SHORT-RADIUS GUARDRAIL TO LARGER RADII Submitted by Cody S. Stolle, Ph.D., E.I.T. Post-Doctoral Research Associate Robert W. Bielenberg, M.S.M.E., E.I.T. Research Associate Engineer Dean L. Sicking, Ph.D., P.E. Emeritus Professor John D. Reid, Ph.D. Professor Ronald K. Faller, Ph.D., P.E. Research Associate Professor and MwRSF Director Karla A. Lechtenberg, M.S.M.E., E.I.T. Research Associate Engineer MIDWEST ROADSIDE SAFETY FACILITY Nebraska Transportation Center University of Nebraska-Lincoln 130 Whittier Research Center 2200 Vine Street Lincoln, Nebraska (402) Submitted to WISCONSIN DEPARTMENT OF TRANSPORTATION 4802 Sheboygan Avenue Madison, Wisconsin MwRSF Research Report No. TRP March 31, 2014
2 TECHNICAL REPORT DOCUMENTATION PAGE 1. Report No Recipient s Accession No. TRP Title and Subtitle 5. Report Date Extending TL-2 Short-Radius Guardrail to Larger Radii March 31, Author(s) 8. Performing Organization Report No. Stolle, C.S., Reid, J.D., Bielenberg, R.W., Faller, R.K., Sicking, D.L., and Lechtenberg, K.A. TRP Performing Organization Name and Address 10. Project/Task/Work Unit No. Midwest Roadside Safety Facility (MwRSF) Nebraska Transportation Center University of Nebraska-Lincoln 130 Whittier Research Center 2200 Vine Street Lincoln, Nebraska Contract or Grant (G) No. TPF-5(193) Supp Sponsoring Organization Name and Address 13. Type of Report and Period Covered Wisconsin Department of Transportation 4802 Sheboygan Avenue Madison, Wisconsin Final Report: Sponsoring Agency Code TPF-5(193) Supplement # Supplementary Notes 16. Abstract (Limit: 200 words) Longitudinal barriers are commonly used to shield hazards including bridge rail ends, bridge parapets, and slopes. In some locations, a secondary roadway intersects the primary roadway within the guardrail s length-of-need (LON). Some intersections have radii as large as 72 ft (22 m) between primary and secondary roadways, which require untested modifications to existing short radius guardrail systems. No short radius systems have been tested and approved to shield hazards with these conditions. A validated computer simulation model of the Yuma County system was modified and simulated with larger radii of 24, 48, and 72 ft (7.3, 15, and 22 m) using a 2000P vehicle in LS-DYNA. Impacts with 27-in. (686-mm) tall systems frequently resulted in vehicle vaulting when impacted at 45 mph (72 km/h), although blockouts reduced vaulting and increased system effectiveness. Maximum practical speeds to utilize 27-in. (686-mm) tall curved guardrail systems with blockouts were 19, 22, and 23 mph (31, 35, and 37 km/h) for radii of 24, 48, and 72 ft (7.3, 15, and 22 m), respectively. Maximum practical speeds without blockouts were 29, 26, and 41 mph (47, 42, and 66 km/h), respectively. Blockouts reduced vaulting by maintaining rail height, reducing tire interaction with post debris, and facilitating easier rail release via post twisting. A 29-in. (737-mm) tall system with blockouts and a 31-in. (787-mm) tall system without blockouts performed acceptably at 45 mph (72 km/h) and 25 degrees, downstream of the beginning of the Length-of-Need (LON). 17. Document Analysis/Descriptors 18. Availability Statement Highway Safety, Roadside Appurtenances, Short-Radius Guardrail, Simulation, LS-DYNA, Curved Guardrail, Intersection, and NCHRP Report No. 350 No restrictions. Document available from: National Technical Information Services, Springfield, Virginia Security Class (this report) 20. Security Class (this page) 21. No. of Pages 22. Price Unclassified Unclassified 253 i
3 DISCLAIMER STATEMENT This report was completed with funding from the Wisconsin Department of Transportation. The contents of this report reflect the views and opinions of the authors who are responsible for the facts and the accuracy of the data presented herein. The contents do not necessarily reflect the official views or policies of the Wisconsin Department of Transportation nor the Federal Highway Administration, U.S. Department of Transportation. This report does not constitute a standard, specification, regulation, product endorsement, or an endorsement of manufacturers. ii
4 ACKNOWLEDGEMENTS The authors wish to acknowledge the Wisconsin Department of Transportation for sponsoring this project. Acknowledgement is also given to the following individuals who made a contribution to the completion of this research project. Midwest Roadside Safety Facility J.C. Holloway, M.S.C.E., E.I.T., Test Site Manager S.K. Rosenbaugh, M.S.C.E., E.I.T., Research Associate Engineer J.D. Schmidt, Ph.D., P.E., Post-Doctoral Research Assistant A.T. Russell, B.S.B.A., Shop Manager K.L. Krenk, B.S.M.A., Maintenance Mechanic S.M. Tighe, Laboratory Mechanic D.S. Charroin, Laboratory Mechanic Undergraduate and Graduate Research Assistants Wisconsin Department of Transportation Jerry Zogg, P.E., Chief Roadway Standards Engineer Erik Emerson, P.E., Standards Development Engineer iii
5 TABLE OF CONTENTS TECHNICAL REPORT DOCUMENTATION PAGE... i DISCLAIMER STATEMENT... ii ACKNOWLEDGEMENTS... iii LIST OF FIGURES... vii LIST OF TABLES... xiii 1 INTRODUCTION Background Research Objectives Project Outline LITERATURE REVIEW Historical W-Beam Short Radius Systems Systems Tested to NCHRP Report No System Tested to AASHTO Guidance Specifications Short Radius Systems Tested to NCHRP Report No. 350 and MASH TTI Short-Radius Project MwRSF Short-Radius Project Bullnose Systems Tested Prior to NCHRP Report No Bullnose Systems Tested to NCHRP Report No Relationship Between Bullnose and Short Radius Guardrail Systems Short Radius Systems with Larger Radii SELECTION OF SHORT RADIUS GUARDRAIL SYSTEM BASELINE SIMULATIONS MODEL COMPOSITION Summary of System Components and Computer Simulation Models Modifications for Additional Simulations Previously Validated Models of System Components Components Validated for Use in Model Wood CRT Posts Baseline Models Mesh Sensitivity Post Calibration through Dimensional Variation Post-and-Soil Interaction Modeling Components Without Validation Details and Construction of Full-Scale Crash Models Test No. YC End Anchorage Radius Transition to Stiff Bridge Rail Model Assembly iv
6 4.6.2 Modifications for Simulation of Test No. YC Modifications for Simulation of 31-in. (787-mm) Tall System Vehicle Models Modeling Difficulties SIMULATION OF YUMA COUNTY SHORT RADIUS GUARDARIL SYSTEM Test No. YC-3 Simulation and Full-Scale Test Test No. YC-4 Simulation and Full-Scale Test Modified 31-in. Yuma County System Simulation Discussion SYSTEM DETAILS FOR SIMULATED LARGER-RADII SYSTEMS NUMERICAL SIMULATIONS OF SYSTEMS WITH 24-FT (7.3-M) RADII Systems with 27-in. (686-mm) Top Mounting Height Systems without Blockouts Attached to Radius Posts Systems with Blockouts Attached to Radius Posts Systems with 31-in. (787-mm) Top Mounting Height Impacts at 45 mph (72 km/h) Impacts at 50 mph (80 km/h) Discussion NUMERICAL SIMULATIONS OF SYSTEMS WITH 48-FT (15-M) RADII Systems with 27-in. Top Mounting Height Systems Without Blockouts Attached to Radius Posts Systems with Blockouts Attached to Radius Posts Systems with 31-in. (787-mm) Top Mounting Height Impacts at 45 mph (72 km/h) Impacts at 50 mph (80 km/h) Discussion NUMERICAL SIMULATIONS OF SYSTEMS WITH 72-FT (22-M) RADII Systems with 27-in. Top Mounting Height Systems Without Blockouts Systems with Blockouts Attached to Radius Posts Systems with 31-in. (787-mm) Top Mounting Height Impacts at 45 mph (72 km/h) Impacts at 50 mph (80 km/h) Discussion EVALUATION OF SIMULATION RESULTS Summary of Results Maximum Practical Speeds for Short-Radius Guardrails Critical Impact Locations Causes of Vaulting and Penetration Additional Concerns v
7 11 CURVED GUARDRAIL EFFECTIVENESS EVALUATION SIMULATION OF SYSTEMS WITH 29-IN. (737-MM) MOUNTING HEIGHTS Introduction Generation of 29-in. (737-mm) Tall System Models Simulation Results Systems with 24-ft (7.3-m) Radius Systems with 48-ft (15-m) Radius Systems with 72-ft (22-m) Radius Discussion Conclusions SUMMARY, CONCLUSIONS, AND RECOMMENDATIONS FUTURE WORK REFERENCES APPENDIX Appendix A. Modified Yuma Co. Design Drawings [27] vi
8 LIST OF FIGURES Figure 1. Washington W-Beam Short Radius Design [10]...19 Figure 2. TTI W-Beam Short Radius Design [11]...21 Figure 3. CRT Post and Cable Anchor Details, TTI W-Beam Short Radius System [11]...22 Figure 4. Turndown Rail Details, TTI W-Beam Short Radius System [11]...23 Figure 5. Transition Details, TTI W-Beam Short Radius System [11]...24 Figure 6. Curved Rail Bend Details, TTI W-Beam Short Radius System [11]...25 Figure 7. Downstream Curved Rail Bend Details, TTI W-Beam Short Radius System [11]...25 Figure 8. Yuma County Short-Radius Guardrail System Final Design Details [6, 27]...26 Figure 9. Final Thrie Beam Short Radius Design, TTI Thrie Beam Short Radius System [8]...28 Figure 10. Transition to Rigid Bridge Rail Details, TTI Thrie Beam Short Radius System [8]...29 Figure 11. Standard and CRT Post Details, TTI Thrie Beam Short Radius System [8]...30 Figure 12. Rail-to-Post Connection Details, TTI Thrie Beam Short Radius System [8]...31 Figure 13. Turned-Down Anchor Details, TTI Thrie Beam Short Radius System [8]...32 Figure 14. Curved Nose Thrie Beam Section, TTI Thrie Beam Short Radius System [8]...32 Figure 15. Preliminary Thrie Beam Short Radius Design, MwRSF Short Radius System [12, 9]...34 Figure 16. Final Thrie Beam Short Radius Design, MwRSF Short Radius Design [14]...35 Figure 17. Primary Side Post Layout, MwRSF Short Radius Design [14]...36 Figure 18. Secondary Side Post Layout, MwRSF Short Radius Design [14]...37 Figure 19. Primary Side Cable Anchorage Details, MwRSF Short Radius Design [14]...38 Figure 20. Secondary Side Cable Anchorage Details, MwRSF Short Radius Design [14]...39 Figure 21. Cable Anchorage Component Details, MwRSF Short Radius Design [14]...40 Figure 22. Tension Cable and Anchor Plate Used in Curved Nose Piece, MwRSF Short Radius Design [14]...41 Figure 23. Post Naming Conventions and Rail Heights, MwRSF Short Radius Design [14]...42 Figure 24. Foundation Tube Details, MwRSF Short Radius Design [14]...43 Figure 25. MGS BCT and MGS CRT Post Details, MwRSF Short Radius Design [14]...44 Figure 26. BSR and Thrie Beam Post Details, MwRSF Short Radius Design [14]...45 Figure 27. Post Details, MwRSF Short Radius Design [14]...46 Figure 28. Stiff Bridge Rail Details, MwRSF Short Radius Design [14]...47 Figure 29. Stiff Bridge Rail Post Details, MwRSF Short Radius Design [14]...48 Figure 30. Rail Slot Details, MwRSF Short Radius Design [14]...49 Figure 31. Rail Slot Details, MwRSF Short Radius Design [14]...50 Figure 32. Thrie Beam Bend Details, MwRSF Short Radius Design [14]...51 Figure 33. Thrie Beam Bend Details, MwRSF Short Radius Design [14]...52 Figure 34. Thrie Beam Bend Details, MwRSF Short Radius Design [14]...53 Figure 35. Required Bullnose Crash Tests According to NCHRP Report No Figure 36. Acceptable Short Radius Guardrail System Designs, FHWA Technical Memorandum [7]...60 Figure 37. Washington State Standards for Short Radius Guardrail at Intersecting Roadways [26]...61 Figure 38. Wisconsin State Standards for Short Radius Guardrail at Intersecting Roadways...62 Figure 39. Wisconsin State Standards for Short Radius Guardrail at Intersecting Roadways...63 Figure 40. Example Applications for Systems with Radii Larger than 16 ft (4.9 m)...64 Figure 41. Construction Drawings, Yuma County Short Radius Guardrail System [6]...67 vii
9 viii March 31, 2014 Figure 42. Cable Anchor and Foundation Details, Yuma County Short Radius Guardrail System [6]...68 Figure 43. End Terminal Details, Yuma County Short Radius Guardrail System [6]...69 Figure 44. Developmental System Photographs, Test Nos. YC-1 through YC-3 [6]...70 Figure 45. Fractured CRT Posts without Bolt Damage [14]...73 Figure 46. LS-DYNA Models of CRT Posts in Rigid Sleeves, 90, 45, and 0-Degree Orientations...75 Figure 47. Force vs. Deflection, CRT Post at 90 deg in Rigid Sleeve, Models and Bogie Tests..76 Figure 48. Energy vs. Deflection, CRT Post at 90 deg in Rigid Sleeve, Models and Bogie Tests...76 Figure 49., Force vs. Deflection, CRT Post at 45 deg in Rigid Sleeve, Models and Bogie Tests...77 Figure 50. Energy vs. Deflection, CRT Post at 45 deg in Rigid Sleeve, Models and Bogie Tests...77 Figure 51. Force vs. Deflection, CRT Post at 0 deg in Rigid Sleeve, Models and Bogie Tests...78 Figure 52. Energy vs. Deflection, CRT Post at 0 deg in Rigid Sleeve, Models and Bogie Tests...78 Figure 53. Time-Sequential Images, Simulation and Test No. MNCRT Figure 54. Time-Sequential Images, Simulation and Test No. MNCRT Figure 55. Comparison of Force vs. Deflection of CRT Post in 90-Degree Orientation, General/Automatic Single Surface and Eroding Single Surface Contact Types...82 Figure 56. Comparison between (a) General/Automatic Single Surface and (b) Eroding Single Surface Contact Types at Same Instant in Time...83 Figure 57. Post Size Comparison, (a) Fine, (b) Coarse, and (c) Surrogate Meshes...84 Figure 58. Force vs. Deflection, 90-Degree Impact, Tests and Surrogate Models...85 Figure 59. Energy vs. Deflection, 90-Degree Impact, Tests and Surrogate Models...85 Figure 60. Force vs. Deflection, 45-Degree Impact, Tests and Surrogate Models...86 Figure 61. Energy vs. Deflection, 45-Degree Impact, Tests and Surrogate Models...86 Figure 62. Force vs. Deflection, 0-Degree Impact, Tests and Surrogate Models...87 Figure 63. Energy vs. Deflection, 0-Degree Impact, Tests and Surrogate Models...87 Figure 64. Strong-Axis Impact Bogie Acceleration Force vs. Displacement, Tests and Simulation...89 Figure 65. Strong-Axis Impact Bogie Energy vs. Displacement, Test and Simulation...89 Figure 66. Weak-Axis Impact Bogie Acceleration Force vs. Displacement, Tests and Simulation...90 Figure 67. Weak-Axis Impact Bogie Acceleration Force vs. Displacement, Tests and Simulation...90 Figure 68. Model of Crash Test No. YC-3 with Post Numbers Shown...93 Figure 69. Model of Crash Test No. YC Figure 70. Model of Modified BCT End Anchorage, Model of Test No. YC Figure 71. Model of Radius, Model of Test No. YC-3 (Fracture Region Highlighted)...96 Figure 72. Transition Section, Model of Test No. YC Figure 73. Model of System in Test No. YC-4 with Post Numbers Shown Figure 74. Model of 31-in. (787-mm) Tall, Modified System Derived from Details of Test No. YC-4 with Post Numbers Shown Figure 75. Ballasted 2500 Model and Example 1984 Ford Pickup Similar to Test Vehicle [32]...103
10 Figure 76. Shell Element Edge Penetration Behind Bolt Head Figure 77. Shell Edge Penetration between Solid Elements of Posts Figure 78. Beam Element Wrap around Bolt Head and Shank Figure 79. Effect of Stiffening C-Channel Length (a) Channel Terminates at Post (b) Channel Terminates at Midspan Figure 80. Time-Sequential Photographs, Simulation of Test No. YC Figure 81. Time-Sequential Photographs, Simulation of Test No. YC Figure 82. Time-Sequential Photographs, Simulation of Test No. YC Figure 83. Time-Sequential Photographs, Simulation of Test No. YC Figure 84. Time-Sequential Photographs of Test No. YC-3 [6] Figure 85. Time-Sequential Photographs of Test No. YC-3 [6] Figure 86. Time-Sequential Images, Simulation of Test No. YC Figure 87. Time-Sequential Images, Simulation of Test No. YC Figure 88. Time-Sequential Images, Simulation of Test No. YC Figure 89. Time-Sequential Images, Simulation of Test No. YC Figure 90. Time-Sequential Photographs of Test No. YC-4 [6] Figure 91. Final Vehicle Position after Crash (a) Reported [6] (b) Photograph [6] (c) Simulation Figure 92. Time-Sequential Photographs, 31-in. (787-mm) Modification to Test No. YC Figure 93. Time-Sequential Photographs, 31-in. (787-mm) Modification to Test No. YC Figure 94. Time-Sequential Photographs, 31-in. (787-mm) Modification to Test No. YC Figure 95. Time-Sequential Photographs, 31-in. (787-mm) Modification to Test No. YC Figure 96. Schematic Drawings of Short Radius Simulation Models Figure 97. Simulation Model with Post Numbers, 24-ft (7.3-m) Radius Figure 98. Simulation Model with Post Numbers, 48-ft (15-m) Radius Figure 99. Simulation Model with Post Numbers, 72-ft (22-m) Radius Figure 100. Images of Impacts with 27-in. (686-mm) Tall, 24-ft (7.3-m) Radius Systems without Blockouts Attached to Posts on Radius Figure 101. Images of Impacts with 27-in. (686-mm) Tall, 24-ft (7.3-m) Radius Systems without Blockouts Attached to Posts on Radius Figure 102. Images of Impacts with 27-in. (686-mm) Tall, 24-ft (7.3-m) Radius Systems without Blockouts Attached to Posts on Radius Figure 103. Images of Impacts with 27-in. (686-mm) Tall, 24-ft (7.3-m) Radius Systems with Blockouts Attached to Radius Posts Figure 104. Images of Impacts with 27-in. (686-mm) Tall, 24-ft (7.3-m) Radius Systems with Blockouts Attached to Radius Posts Figure 105. Images of Impacts with 31-in. (787-mm) Tall, 24-ft (7.3-m) Radius Systems at 45 mph (72 km/h) Figure 106. Images of Impacts with 31-in. (787-mm) Tall, 24-ft (7.3-m) Radius Systems at 45 mph (72 km/h) Figure 107. Images of Impacts with 31-in. (787-mm) Tall, 24-ft (7.3-m) Radius Systems at 45 mph (72 km/h) Figure 108. Images of Impacts with 31-in. (787-mm) Tall, 24-ft (7.3-m) Radius Systems at 50 mph (80 km/h) Figure 109. Images of Impacts with 27-in. (686-mm) Tall, 48-ft (15-m) Radius Systems without Blockouts Attached to Posts on Radius ix
11 x March 31, 2014 Figure 110. Images of Impacts with 27-in. (686-mm) Tall, 48-ft (15-m) Radius Systems without Blockouts Attached to Posts on Radius Figure 111. Images of Impacts with 27-in. (686-mm) Tall, 48-ft (15-m) Radius Systems without Blockouts Attached to Posts on Radius Figure 112. Images of Impacts with 27-in. (686-mm) Tall, 48-ft (15-m) Radius Systems with Blockouts Attached to Radius Posts Figure 113. Images of Impacts with 27-in. (686-mm) Tall, 48-ft (15-m) Radius Systems with Blockouts Attached to Radius Posts Figure 114. Images of Impacts with 27-in. (686-mm) Tall, 48-ft (15-m) Radius Systems with Blockouts Attached to Radius Posts Figure 115. Images of Impacts with 31-in. (787-mm) Tall, 48-ft (15-m) Radius Systems at 45 mph (72 km/h) Figure 116. Images of Impacts with 31-in. (787-mm) Tall, 48-ft (15-m) Radius Systems at 45 mph (72 km/h) Figure 117. Images of Impacts with 31-in. (787-mm) Tall, 48-ft (15-m) Radius Systems at 45 mph (72 km/h) Figure 118. Images of Impacts with 31-in. (787-mm) Tall, 48-ft (15-m) Radius Systems at 50 mph (80 km/h) Figure 119. Images of Impacts with 31-in. (787-mm) Tall, 48-ft (15-m) Radius Systems at 50 mph (80 km/h) Figure 120. Images of Impacts with 31-in. (787-mm) Tall, 48-ft (15-m) Radius Systems at 50 mph (80 km/h) Figure 121. Images of Impacts with 27-in. (686-mm) Tall, 72-ft (22-m) Radius Systems without Blockouts Attached to Posts on Radius Figure 122. Images of Impacts with 27-in. (686-mm) Tall, 72-ft (22-m) Radius Systems without Blockouts Attached to Posts on Radius Figure 123. Images of Impacts with 27-in. (686-mm) Tall, 72-ft (22-m) Radius Systems without Blockouts Attached to Posts on Radius Figure 124. Images of Impacts with 27-in. (686-mm) Tall, 72-ft (22-m) Radius Systems with Blockouts Attached to Radius Posts Figure 125. Images of Impacts with 27-in. (686-mm) Tall, 72-ft (22-m) Radius Systems with Blockouts Attached to Radius Posts Figure 126. Images of Impacts with 27-in. (686-mm) Tall, 72-ft (22-m) Radius Systems with Blockouts Attached to Radius Posts Figure 127. Images of Impacts with 31-in. (787-mm) Tall, 72-ft (22-m) Radius Systems at 45 mph (72 km/h) Figure 128. Images of Impacts with 31-in. (787-mm) Tall, 72-ft (22-m) Radius Systems at 45 mph (72 km/h) Figure 129. Images of Impacts with 31-in. (787-mm) Tall, 72-ft (22-m) Radius Systems at 45 mph (72 km/h) Figure 130. Images of Impacts with 31-in. (787-mm) Tall, 72-ft (22-m) Radius Systems at 50 mph (80 km/h) Figure 131. Images of Impacts with 31-in. (787-mm) Tall, 72-ft (22-m) Radius Systems at 50 mph (80 km/h) Figure 132. Images of Impacts with 31-in. (787-mm) Tall, 72-ft (22-m) Radius Systems at 50 mph (80 km/h) Figure 133. Location of the Beginning of the LON for Non-Perpendicular Intersections...177
12 xi March 31, 2014 Figure 134. Phases in Vehicle Capture for 24, 48, and 72-ft (7.3, 15, and 22-m) Radii (a) Membrane Tension (b) Mixed Membrane Tension and Pocketing (c) Fully-Developed Pocket Figure 135. Progression of Rail Damage for Curved Guardrail Figure 136. Criteria for Identifying (a) Beginning and (b) End of Transition Between Membrane Tension and Guardrail Pocketing Figure 137. Vehicle Speed Comparison for Impacts near Center of Radius, 45 mph (72 km/h) 190 Figure 138. Upper Corrugation Flattening and Twisting Below Vehicle, 27-in. (686-mm) Rail Height Figure 139. Lower Corrugation Flattening and Interlocking with Vehicle, 31-in. (787-mm) Rail Height (bumper colored red for clarity) Figure 140. Wheel Interaction with Post Debris, 45 mph (72 km/h) impact with 27-in. (686- mm) Tall, 48-ft (15-m) Radius System with Blockouts at Post No Figure 141. Departure Speed Distribution Comparison for 45-mph (72-km/h) Roadways using NCHRP Report No. 665 Data [36] Figure 142. Roadway Departure IS-Value Distribution Comparisons for 45-mph (72-km/h) Roadways using NCHRP Report No. 665 Data [36] Figure 143. Distribution of Vehicle Speeds and Expected Lower Bound of Capture Frequency Figure 144. Vehicle IS Value at Departure and Expected Upper Bound of Capture Frequency 204 Figure 145. Total Vehicle Energy at Departure and Expected Average Guardrail Capture Frequency Figure 146. Time-Sequential Images of Impact at Post No. 5, 24-ft (7.3-m) Radius System with 29-in. (737-mm) Mounting Height Figure 147. Time-Sequential Images of Impact at Post No. 6, 24-ft (7.3-m) Radius System with 29-in. (737-mm) Mounting Height Figure 148. Time-Sequential Images of Impact at Post No. 7, 24-ft (7.3-m) Radius System with 29-in. (737-mm) Mounting Height Figure 149. Time-Sequential Images of Impact at Post No. 9, 48-ft (15-m) Radius System with 29-in. (737-mm) Mounting Height Figure 150. Time-Sequential Images of Impact at Post No. 10, 48-ft (15-m) Radius System with 29-in. (737-mm) Mounting Height Figure 151. Time-Sequential Images of Impact at Post No. 11, 48-ft (15-m) Radius System with 29-in. (737-mm) Mounting Height Figure 152. Time-Sequential Images of Impact at Post No. 12, 48-ft (15-m) Radius System with 29-in. (737-mm) Mounting Height Figure 153. Time-Sequential Images of Impact at Post No. 13, 48-ft (15-m) Radius System with 29-in. (737-mm) Mounting Height Figure 154. Time-Sequential Images of Impact at Post No. 9, 72-ft (22-m) Radius System with 29-in. (737-mm) Mounting Height Figure 155. Time-Sequential Images of Impact at Post No. 10, 72-ft (22-m) Radius System with 29-in. (737-mm) Mounting Height Figure 156. Time-Sequential Images of Impact at Post No. 11, 72-ft (22-m) Radius System with 29-in. (737-mm) Mounting Height Figure 157. Time-Sequential Images of Impact at Post No. 12, 72-ft (22-m) Radius System with 29-in. (737-mm) Mounting Height Figure A-1. Recommended Design Details for Yuma County Short-Radius System [27]...234
13 Figure A-2. Alternative Design Details for Yuma County Short-Radius System [27] Figure A-3. Rail Elevation, Post Spacing, and Post Details [27] Figure A-4. Upstream End Anchorage Details [27] Figure A-5. Timber Post Details, Transition Post Nos. 10 through 12 [27] Figure A-6. Transition C-Channel Stiffener Details [27] Figure A-7. Transition Timber Post Details, Post Nos. 8 and 9 [27] Figure A-8. CRT Post Details, Post Nos. 3 through 7 [27] Figure A-9. CRT Post Details [27] Figure A-10. Transition Post Blockout Details, Post No. 7 [27] Figure A-11. Transition Post Blockout Details, Post Nos. 8 through 12 [27] Figure A-12. End Shoe Details for W-beam Connector to Concrete Barrier [27] Figure A-13. Rail Punch Details for W-Beam Near Transition [27] Figure A-14. Rail Punch Details for W-Beam at End Anchorage [27] Figure A-15. Rail Punch Details for Straight Guardrail Upstream of Radius [27] Figure A-16. Rail Punch Details for Curved W-beam Nose Section [27] Figure A-17. Rail Punch Details for W-beam at Transition [27] Figure A-18. Post Details [27] Figure A-19. Post Details [27] xii
14 LIST OF TABLES Table 1. Summary of Short Radius Guardrail Systems...5 Table 2. Summary of Short-Radius Guardrail Systems Full-Scale Crash Testing...6 Table 3. Summary of Short Radius Guardrail Systems (cont)...7 Table 4. Summary of Short-Radius Guardrail Systems Full-Scale Crash Testing...8 Table 5. Summary of Short Radius Guardrail Systems (cont)...9 Table 6. Summary of Short-Radius Guardrail Systems Full-Scale Crash Testing...10 Table 7. Summary of Tested Bullnose Guardrail Systems...11 Table 8. Summary of Short-Radius Guardrail Systems Full-Scale Crash Testing...12 Table 9. Summary of Tested Bullnose Guardrail Systems (cont)...13 Table 10. Summary of Short-Radius Guardrail Systems Full-Scale Crash Testing...14 Table 11. Summary of Tested Bullnose Guardrail Systems (cont)...15 Table 12. Summary of Short-Radius Guardrail Systems Full-Scale Crash Testing...16 Table 13. Summary of Tested Bullnose Guardrail Systems (cont)...17 Table 14. Summary of Short-Radius Guardrail Systems Full-Scale Crash Testing...18 Table 15. Summary of Short Radius and Bullnose Documented Testing by Radius...59 Table 16. Summary of Material Parameters Used in CRT Posts...74 Table 17. Comparison of Results, Tests and Simulations...81 Table 18. Comparison of Post Fracture Times, Simulation and Test No. YC Table 19. Comparison of Post Fracture Times, Test No. YC-4 and Simulation Table 20. Simulation Analysis Summary for 24-ft (7.3-m) Radius Systems Table 21. Simulation Analysis Summary for 24-ft (7.3-m) Radius Systems (cont) Table 22. Simulation Analysis Summary for 48-ft (15-m) Radius Systems Table 23. Simulation Analysis Summary for 48-ft (15-m) Radius Systems (cont) Table 24. Simulation Analysis Summary for 72-ft (22-m) Radius Systems Table 25. Simulation Analysis Summary for 72-ft (22-m) Radius Systems (cont) Table 26. Phase Transitions for 45-mph (72-km/h), 25-degree Impacts into 24-ft (7.3-m) Radius Systems Table 27. Phase Transitions for 45-mph (72-km/h), 25-degree Impacts into 48-ft (15-m) Radius Systems Table 28. Phase Transitions for 45-mph (72-km/h), 25-degree Impacts into 72-ft (22-m) Radius Systems Table 29. Summary of Maximum Practical Speeds and Beginning of LON Table 30. Percentage of Crashes Captured by Curved Guardrail Designs Table 31. Simulation Analysis Summary for 24-ft (7.3-m) Radius System, 29-in. (737-mm) Top Rail Height Table 32. Simulation Analysis Summary for 24-ft (7.3-m) Radius System, 29-in. (737-mm) Top Rail Height Table 33. Summary of 29-in. (713-mm) Tall Curved Guardrail System Recommendations xiii
15 1 INTRODUCTION 1.1 Background Bridge rails are commonly used to shield errant vehicles from falling into a hazard being spanned by the bridge. To shield the ends of the bridge railings and to provide guardrail runout length upstream from the bridge hazard, crashworthy guardrail systems with transitions and end terminals are frequently utilized. The minimum length of guardrail required to shield a hazard is determined using length-of-need (LON) formulas found the American Association of State Highway and Transportation Officials (AASHTO s) Roadside Design Guide [1]. In some instances, the location of a bridge is very close to an intersection, such that the secondary or intersecting roadway is within the guardrail LON. Short-radius guardrail systems were designed to prevent errant vehicles from interacting with the bridge hazard, as well as to provide a stiffness transition to a stiff bridge rail. To date, no systems have yet passed the Test Level 3 (TL-3) impact criteria identified in either the National Cooperative Highway Research Program (NCHRP) Report No. 350 [2] or the American Association of Highway Transportation Officials (AASHTO) Manual for Assessing Safety Hardware (MASH) [3]. Most short radius systems were tested in accordance with NCHRP Report No. 230 [4]. The Yuma County short-radius system was first tested in accordance with the AASHTO Guide Specifications for Bridge Railings [5], and was later approved for use with NCHRP Report No. 350 TL-2 impact conditions [6]. Although short-radius guardrails have been recommended for use with radii up to 30 ft (9.1 m) in the FHWA Technical Advisory T [7], the performance of systems with radii larger than 10 ft (3.0 m) is not well-documented. Systems with radii larger than previously tested may not be as stiff as systems with smaller radii. Increased flexibility during impact may disrupt beneficial bumper-to-rail engagement and culminate in vaulting override or underride. At very 1
16 large radii, the guardrail stiffness may initially increase as the rail tensile forces become increasingly tangential. Wisconsin DOT commissioned a study to evaluate currently-accepted designs of shortradius guardrail systems with larger radii of curvature using computer simulation. Because crash testing was beyond the scope of this project, no federal approval of the designs will be pursued. It was believed that the research would provide guidance for safe intersection speed and radius combinations and suggest potential improvements in the design of current short-radius guardrail systems when used on large radius intersections. 1.2 Research Objectives The research objective of this project was to evaluate modifications to the design of an approved short-radius guardrail systems with larger radii of curvature, determine the performance limits of the systems, and evaluate the limiting travel speeds on roadways for which the simulated short-radius guardrail could still perform adequately. 1.3 Project Outline A series of tasks were conducted to complete the research objectives: 1. Evaluate existing short-radius guardrail designs which received approval from FHWA; 2. Develop and validate baseline models of short-radius guardrail systems using crash test results; 3. Modify the validated short radius design with larger radii and different rail heights; 4. Determine the maximum speeds at which the larger-radius designs were still determined to be crashworthy; and 5. Provide an approximate percentage of crashes which could be contained by various radius and hardware configurations. 2
17 2 LITERATURE REVIEW Several short-radius systems were successfully tested according to criteria presented in NCHRP Report No. 230 [4]. The tested systems typically consisted of W-beam guardrail with radii between 8 and 10 ft (2.4 and 3.0 m) mounted on rectangular or circular Controlled Release Terminal (CRT) posts with 42-in. (1,067-mm) embedment depths and anchorages. Criteria presented in NCHRP Report 230 required a minimum of four crash tests conducted at 60 mph (97 km/h): 1) 4,500-lb (2,041-kg) sedan at 0 degrees, centerline aligned with stiff bridge rail; 2) 4,500-lb (2,041-kg) sedan at 25 degrees, at the critical impact point (CIP) near the transition; 3) 4,500-lb (2,041-kg) sedan at 25 degrees, centerline aligned with midpoint of radius; and 4) 1,900-lb (862-kg) small car at 20 degrees, centerline aligned with midpoint of radius. The Yuma County short-radius guardrail system was tested in accordance with the AASHTO Guide Specifications [5] Performance Level 1 (PL-1) impact conditions. A total of six tests conducted at 45 mph (72 km/h) were required: 1) 1,984-lb (900-kg) small car at 20 degrees, at the CIP near the transition; 2) 5,401-lb (2,450-kg) pickup truck at 20 degrees, at the CIP near the transition; 3) 1,984-lb (900-kg) small car at 20 degrees, centerline aligned with midpoint of radius; 4) 5,401-lb (2,450-kg) pickup truck at 20 degrees, centerline aligned with midpoint of radius; 5) 1,984-lb (900-kg) small car at 0 degrees, centerline aligned with stiff bridge rail; and 6) 5,401-lb (2,450-kg) pickup truck at 0 degrees, centerline aligned with stiff bridge rail. 3
18 4 March 31, 2014 No short-radius systems have been successfully crash tested according to NCHRP Report No. 350 [2] or MASH [3] TL-3 impact conditions. Seven tests were required according to NCHRP Report No. 350 crash test conditions. NCHRP Report No. 350 impact conditions are discussed in literature [8-9]. A summary of previously-tested short-radius systems are shown in Tables 1 through 5. Bullnose systems, which share many similar features as short-radius systems, are summarized in Tables 7 through Historical W-Beam Short Radius Systems Systems Tested to NCHRP Report No. 230 Two W-beam short-radius systems which were successfully tested according to NCHRP Report 230 criteria included the Washington [10] and Texas Transportation Institute (TTI) [11] designs. Each design consisted of curved W-beam guardrail mounted on wooden breakaway posts connected to a downstream anchorage and rigid or semi-rigid bridge railing. The final design of the Washington short-radius design is shown in Figure 1. The system consisted of a curved W-beam end termination, 25 ft (7.6 m) of W-beam including a Breakaway Cable Terminal (BCT) end anchorage system with two cable anchors: one attached to each BCT post. The cables were spliced together near the ground line. The guardrail radius was 8-ft 6-in. (2,591-mm), and 25 ft (7.6 m) of W-beam guardrail was used to transition to a rigid bridge rail. The system was configured such that the barrier adjacent to the secondary roadway was installed parallel with the road, whereas the primary side of the system had a 10:1 flare upstream of the bridge rail. Posts installed at the transition were 6 in. x 8 in. x 72 in. (152 mm x 203 mm x 1,829 mm) rectangular timber posts, and posts installed on the radius and secondary side of the system were 6 in. x 8 in. x 72 in. (152 mm x 203 mm x 1,829 mm) rectangular CRT posts. One CRT post on the primary roadway side and all six transition posts utilized 6 in. x 8 in. x 14 ¼ in. (152
19 5 March 31, 2014 Table 1. Summary of Short Radius Guardrail Systems Test No. WA-1 WA-1M Reference No. Secondary Road Anchorage Buffer end section (curved, flattened W- beam piece) with BCT cable anchor and 1 BCT post Buffer end section (curved, flattened W- beam piece) with BCT cable anchor and 1 BCT post Secondary Side Rail Radius 12-ft 6-in. parallel 8-ft 6-in. radius, to road, 12-gauge 12.5-ft Long, 12- W-beam gauge W-beam WA-2M Same as WA-1M Same as WA-1M WA-3M 10 Buffer end section (curved, flattened W- beam piece) with 2 Same as WA-2M BCT cable anchors and 2 BCT posts Primary Side Rail 25 ft with 10:1 flare, 12-gauge W- beam Same as WA-1 Same as WA-1 Same as WA-1 Same as WA- 1M Same as WA- 2M Post Details A BCT post in concrete footer with BCT cable anchor Post No. 1 (Secondary Side) BCT post in concrete footer with BCT cable anchor Post No. 1 (Secondary Side) Post Details B 6-in. x 8-in. x 7 ft long timber post Post No. 2, 6-ft 3-in. from Post No. 1 6-in. x 8-in. x 7 ft long timber post with pipe substituted for post-to-rail attachment Post No. 2, 6-ft 3-in. from Post No. 1 Same as WA-1M Same as WA-1M Same as WA-1M Same as WA-2M Same as WA-2M BCT post in soil foundation tube with BCT cable anchor attached to foundation tube Post No. 2, 6-ft 3-in. from Post No. 1 Post Details C 4-in. x 6-in. x 7-ft long timber post Post No. 3, 6-ft 3-in. from Post No. 2 (start of radius) 4-in. x 6-in. x 7-ft long timber breakaway post Post No. 3, 6-ft 3-in. from Post No. 2 (start of radius) 4-in. x 6-in. x 7-ft long timber breakaway post Post Nos. 3-5, 6-ft 3-in. from Post No. 2 (start of radius) Post Details D 4-in. x 6-in. x 7-ft long timber post Post No. 4, 6-ft 3-in. from Post No. 3 (center of radius) 4-in. x 6-in. x 7-ft long timber breakaway post Post No. 4, 6-ft 3-in. from Post No. 3 (center of radius) 4-in. x 6-in. x 7-ft long timber breakaway post Post No. 6, 6-ft 3-in. from Post No. 3 (center of radius) Post Details E BCT post in concrete footer with BCT cable anchor Post No. 5, 6-ft 3-in. from Post No. 4 (end of radius) BCT post in concrete footer Post No. 5, 6-ft 3-in. from Post No. 4 (end of radius) BCT post in concrete footer Post No. 7, 6-ft 3-in. from Post No. 6 (end of radius) Post Details F Est. 6-in. x 8-in. x 7-ft long timber post (unk) with 6-in. x 8-in. blockouts Post Nos. 6-8, 3-ft 1.5-in. spacing, 6-ft 3-in. from Post No. 5 Same as WA-1 Est. 6-in. x 8-in. x 7-ft long timber post (unk) with 6-in. x 8-in. blockouts Post Nos. 8-10, 3-ft 1.5- in. spacing, 6-ft 3-in. from Post No. 7 Post Details G 10-in. x 10-in. x 7-ft long timber posts with 8- in. x 8-in. x 14-in. blockouts Post Nos. 9-11, 3-ft 1.5- in. spacing, 3-ft 6-in. from Post No. 8 Same as WA-1 10-in. x 10-in. x 7-ft long timber posts with 8- in. x 8-in. x 14-in. blockouts Post Nos , 3-ft 1.5-in. spacing, 3-ft 6-in. from Post No. 10 Same as WA-2M Same as WA-2M Same as WA-2M Same as WA-2M Same as WA-2M NOTES W-beam End Shoe Attachment to Concrete Bridge Rail 1:2 Slope at Center of Posts Same as WA-1, pipe postto-rail attachment used at secondary side BCT anchor Added 12-ft 6-in. W-beam and two additional breakaway posts to secondary side of system Second post converted to BCT post with addl cable anchor attached to foundation tube, spliced to first cable WA-4M WA-5M Same as WA-3M Same as WA-3M Same as WA- 3M Same as WA-3M with Same as WA-3M Same as WA-3M Same as WA-3M Same as WA-3M post-to-rail attachment Same as WA-3M Same as WA-3M Same as WA-3M removed Bolt removed from post no. 6; final system design shown in Figure ft Long turndown anchor 25-ft with 14-ft 3-25-ft parallel to in. radius, 25-ft road, 12-gauge W- long (90-deg beam bend) 9-ft 4.5-in. straight W-beam, 12-ft 6- in. tubular W-beam transition, 12-gauge W-beam 7-in. diameter timber posts Post nos. 1-2, 6-ft 3-in. spacing (secondary side) Same as Same as Same as Same as Same as Same as with nested W-beam Same as with nested W- beam Same as Same as Same as , except that post no. 2 converted to 7-in. diameter CRT Same as with nested W- beam Same as , except radius increased to 16 ft Same as with nested W- beam Same as Same as Same as in. diameter CRT posts Post nos. 3-4, 6-ft 3-in. spacing Same as except anchorage depth was increased from 38 to 44 in. BCT post with cable anchor Post no. 5 (start of radius) Same as in. diameter CRT posts Post nos. 6-7, 6-ft 3-in. spacing (along radius) Same as except anchorage depth was increased from 38 to 44 in. BCT post with cable anchor Post no. 8 (end of curve) 7-in. diameter CRT posts Post no. 8, 6-ft 3-in. spacing (end of radius) 7-in. diameter timber posts Post nos. 9-10, 6-ft 3-in. from post no. 8, with 3-ft 1.5-in. spacing 7-in. diameter timber posts (attached to bridge rail) Post Nos , 3-ft 1.5-in. from Post No. 10, 1-ft 6.75-in. Spacing Same as Same as Tubular W-beam transition to stiff bridge rail (safety shape concrete barrier) Post no. 8 converted from BCT to CRT post Same as Same as Same as Same as Same as Same as Same as Rail nested throughout Same as Same as Same as Same as Same as Same as Same as Same as in. diameter CRT posts 7-in. diameter timber post Post nos. 1 Post nos. 2-4, 6-ft 3-in. spacing Same as Same as Same as Same as Same as Radius increased to cause splices to occur at post locations Post no. 2 converted to 7- in. diameter CRT System shown in Figures 2 through 7
20 Table 2. Summary of Short-Radius Guardrail Systems Full-Scale Crash Testing March 31, 2014 Test No. WA-1 WA-1M Reference No. Vehicle 1978 Plymouth sedan 4,520 lb 1978 Honda small car 1,903 lb Impact Conditions 60.0 mph and 0 deg 60.8 mph and 23.7 deg Impact Location Centerline of vehicle with center point of radius Rail Height (in.) Angled hit into guardrail 27 Result 27 Failed - vehicle vaulted system Conditionally Failed - longitudinal ΔV exceeded limits WA-2M WA-3M Dodge sedan 4,789 lb 1978 Dodge sedan 4,640 lb 60.6 mph and 13.4 deg 58.9 mph and 16.6 deg Angled hit into guardrail 27 Angled hit into guardrail 27 Failed - all posts on secondary side fractured Failed - W-beam fractured during impact WA-4M 1978 Dodge sedan 4,650 lb 58.8 mph and 14.6 deg Angled hit into guardrail 27 Passed (despite yaw, back tires overriding system) WA-5M 4,640 lb 1978 Plymouth sedan 59.0 mph and 1.1 deg Centerline of vehicle aligned with center point of radius 27 Passed Yugo GV small car 1,970 lb 1987 Yugo GV small car 1,970 lb 1987 Yugo GV small car 1,970 lb 1982 Cadillac sedan 4,500 lb 1985 Cadillac coupe sedan 4,500 lb 1983 Cadillac coupe 4,500 lb 58.4 mph and 20.5 deg 59.0 mph and 20.4 deg 60.2 mph and 20.7 deg 57.1 mph and 24.7 deg 58.5 mph and 26.8 deg 58.3 mph and 2.0 deg Center point of radius ~27.1 Center point of radius ~27.1 Failed - High occupant accelerations, overrode system Failed - splice rupture, car penetrated system Center point of radius ~27.1 Passed 75 in. from end of concrete barrier Centerline of vehicle with center point of radius Centerline of vehicle aligned with bridge rail ~27.1 Passed ~27.1 Failed - underride and roof crush ~27.1 Passed 6
21 7 March 31, 2014 Table 3. Summary of Short Radius Guardrail Systems (cont) Test No. YC-1 YC-2 YC-3 YC-4 YC-5 YC-6 YC Reference No. 6 8 Secondary Road Anchorage BCT end terminal with two wood posts in foundation tubes, two BCT cables Same as YC-1 through YC-3 W-beam turndown anchor Same as and Secondary Side Rail 12-ft 6-in. straight W-beam (includes anchor) with 10:1 flare, 12- gauge W-beam 25-ft straight W- beam (includes anchor) with 10:1 flare, 12-gauge W-beam 12-ft 6-in. W- beam to thrie beam transition piece, 12-ft 6-in. 10-gauge thrie beam Same as and Radius 8-ft radius, 12-ft 6-in. long W- beam, 12-gauge, 90-degree bend Same as YC-1 through YC-3 25-ft. thrie beam forming 16-ft radius, 10-gauge Same as and Primary Side Rail 18-ft 9-in. straight W-beam with 10:1 flare, 12-gauge W- beam Same as YC-1 through YC-3 12-ft 6-in. thrie beam and 6-ft 3-in. nested thrie beam transition, 10-gauge Same as and Post Details A BCT posts in soil foundation tubes, BCT cable attached to rail and post no. 1, BCT cable spliced to first cable, attached to post no. 2 Post nos. 1-2, 6-ft 3-in. post spacing Same as YC-1 through YC-3 7-in. diameter wood post Post no. 1 (at turndown anchor) Same as and Post Details B 6-in. x 8-in. CRT posts Post nos. 3-5, 6-ft 3-in. post spacing (all on radius) Offset post nos. A&B, not attached to rail (behind radius) 6-in. x 8-in. CRT posts Post nos. 3-4, 6-ft 3-in. post spacing 7-in. diameter CRT posts Post nos. 2-8, 6-ft 3-in. spacing, located 6-ft 3-in. from post no. 1 Same as and , except that post-to-rail bolts removed from several posts on radius Post Details C 6-in. x 8-in. timber posts with 6-in. x 8-in. x in. timber blockouts Post nos. 6-7, 3-ft 1.5-in. spacing, located 3-ft 1.5- in. from post no. 5 6-in. x 8-in. CRT posts Post nos. 5-7, 6-ft 3-in. post spacing (all on radius) Offset post nos. A&B, not attached to rail 7-in. diameter timber posts Post nos. 9-10, 3-ft 1.5-in. spacing, located 6-ft 3-in. from post no. 8 Same as and Post Details D 8-in. x 8-in. timber post with timber blockout Post no. 8, located 3-ft 1.5-in. from post no. 7 6-in. x 8-in. timber posts with 6-in. x 8-in. x in. timber blockouts Post nos. 8-9, 3-ft 1.5-in. spacing, located 3-ft 1.5- in. from post no. 5 7-in. diameter timber posts Post nos , 1-ft in. spacing, located 3-ft 1.5-in. from post no. 8 Same as and Post Details E 10-in. x 10-in. timber posts with timber blockouts Post nos. 9-11, 1-ft in. spacing, located 1-ft 6.75-in. from post no. 8 8-in. x 8-in. timber post with timber blockout Post no. 10, located 3-ft 1.5-in. from post no. 7 N/A Post Details F N/A 10-in. x 10-in. timber posts with timber blockouts Post nos , 1-ft in. spacing, located 1-ft 6.75-in. from post no. 8 N/A Same as and Same as and Post Details G N/A N/A N/A Same as and NOTES Two BCT cables were spliced together at upstream anchor; one attached to BCT bearing plate at post no. 1, the other was attached to the foundation tube at post no. 2 Secondary roadway side lengthened to increase anchorage capacity System shown in Figure 8 Similar to first TTI system tested, using thrie beam in lieu of nested W-beam Post-to-rail attachments removed from posts on radius System shown in Figures 9 through 14
22 Table 4. Summary of Short-Radius Guardrail Systems Full-Scale Crash Testing March 31, 2014 Test No. YC-1 Reference No. Vehicle 1982 Chevrolet pickup 5,376 lb Impact Conditions 45 mph and 1.4 deg Impact Location Centerline of vehicle with tangent line to bridge rail Rail Height (in.) Result 27 Passed YC-2 Volkswagen Rabbit 1,978 lb 50.3 mph and 0.7 deg Centerline of vehicle with tangent line to bridge rail 27 Passed YC-3 Chevrolet pickup 5,380 lb 44.8 mph and 19.7 deg Centerline of vehicle aligned with radius 27 Failed - rail released from BCT post YC-4 6 Chevrolet pickup 5,381 lb 44.9 mph and 20.1 deg Centerline of vehicle aligned with radius 27 Passed YC-5 Volkswagen Rabbit 1,980 lb 44.2 mph and 20 deg Centerline of vehicle with center of 2nd freestanding CRT 27 Passed YC-6 Volkswagen Rabbit 1,980 lb 51.1 mph and 19.4 deg 13 ft upstream of bridge end 27 Passed YC Chevrolet pickup 5,424 lb 1986 Chevrolet ,409 lb 1985 Chevrolet pickup 4,409 lb 45.2 mph and 20.7 deg 60.9 mph and 26.0 deg 63.0 mph and 25.6 deg 12 ft upstream of bridge end 27 Passed 3.5 posts upstream from concrete barrier Centerline of vehicle with center post of radius (thrie beam) (thrie beam) Passed Overrode system - rail formed ramp Ford F250 4,409 lb 63.0 mph and 24.6 deg Centerline of vehicle with center post of radius (thrie beam) Overrode system - rail formed ramp Chevrolet Sprint 1,978 lb 1984 Lincoln Town Car 4,500 lb 60.1 mph and 19.1 deg 60.4 mph and 24.5 deg Centerline of vehicle with center post of radius Centerline of vehicle with center post of radius (thrie beam) (thrie beam) Marginal pass - rail crushed windshield Limited pass - rail released from terminal 8
23 9 March 31, 2014 Table 5. Summary of Short Radius Guardrail Systems (cont) Test No. SR-1 SR-2 SR-3 SR-4 SR-5 SR-6 SR-7 SR-8 Reference No. Secondary Road Anchorage FLEAT end terminal (secondary road side) 9, 12 Same as SR FLEAT end terminal (secondary road side) Same as SR-4 Same as SR-6 Secondary Side Rail 25-ft straight W- beam, 6-ft 3-in. straight W-beamto-thrie transition, 12-ft 6-in. straight thrie beam, 12- gauge Radius 7-ft 10-in. radius, 12-ft 6-in. long, 90-degree bend slotted thrie beam, 12-gauge, reinforced with nose cable & button swages Primary Side Rail 12-ft 6-in. straight slotted, 12-gauge thrie beam, 12-ft 6- in. straight, 12- gauge thrie beam, 12-ft 6-in. thrie beam 10-gauge transition to stiff bridge rail Post Details A FLEAT end anchorage Same as SR-1 Same as SR-1 Same as SR-1 Same as SR-1 8-ft 11⅜-in. radius, 12-ft 6-in. 25-ft straight W- beam, 6-ft 3-in. straight W-beam- long, 90-degree bend slotted thrie to-thrie transition, beam, 12-gauge, 12-ft 6-in. straight reinforced with thrie beam, 12- nose cable & gauge button swages 37-ft 6-in. slotted thrie beam in a parabolic flare, 12- gauge, and 12-ft 6- in. thrie beam, 10- gauge transition to stiff bridge rail Non-proprietary W-beam end terminal system (5.5- in. x 7.5-in. BCT posts in soil foundation tubes with cable anchor) Post nos. 10S-11S, 6-ft 3- in. spacing Same as SR-4 Same as SR-4 Same as SR-4 Same as SR-4 Post Details B 8-in. x 6-in. CRT posts with blockouts Post nos. 1-2, 6-ft 3-in. spacing 8-in. x 6-in. CRT posts with blockouts Post nos. 1, 1.5, 2, 2.5, 3- ft 1.5-in. spacing 8-in. x 6-in. CRT posts with blockouts Post nos. 7S-9S, 6-ft 3-in. spacing, located 6-ft 3-in. from post no. 2 Same as SR-4 Post Details C 6-in. x 8-in. thrie beam CRT post with two 6-in. x 8-in. blockouts (one tapered) Post no. 3, located 6-ft 3- in. from post no. 2 Same as SR-1 8-in. x 6-in. CRT posts with blockouts Post nos. 7S-9S, 6-ft 3-in. spacing, located 6-ft 3-in. from post no. 10S Post no. 6S, 3-ft 1.5-in. from post no. 7S Post Details D 5.5-in. x 7.5-in. thrie BCT posts in 6-ft soil foundation tube Post nos. 4-5 (start and end of radius) with secondary and primary side cable anchors, located 6-ft 3-in. from post no. 3 8-in. x 6-in. CRT posts with double blockouts (one tapered) Post nos. 3S-5S, 6-ft 3-in. spacing, located 6-ft 3-in. from post no. 6S Same as SR-6 Same as SR-6 Same as SR-6 Same as SR-6 Same as SR-6 Same as SR-6 Same as SR-6 Post Details E 6-in. x 8-in. thrie beam CRT posts with two 6-in. x 8-in. blockouts (one tapered) Post nos. 6-9, 3-ft 1.5-in. spacing, located 3-ft 1.5- in. from post no in. x 7.5-in. thrie BCT posts in soil foundation tubes Post nos. 1P, 1S-2S (start and end of radius) with secondary and primary side cable anchors, located 3-ft 1.5-in. from post no. 3S Post Details F 6-in. x 8-in. thrie beam CRT posts with one 6-in. x 8-in. blockout Post nos , 3-ft 1.5- in. spacing, located 3-ft 1.5-in. from post no. 9 6-in. x 8-in. thrie beam CRT posts with two 6-in. x 8-in. blockouts (one tapered) Post nos. 2P-13P, 1-ft 6.75-in. spacing, located 1- ft 6.75-in. from post no. 1P Post Details G 6-in. x 8-in. thrie beam CRT posts with two 6- in. x 8-in. blockouts (one tapered) Post nos , 1-ft 6.75-in. spacing, located 3-ft 1.5-in. from post no. 5 Same as SR-1 Same as SR-1 Same as SR-1 Same as SR-1 6-in. x 8-in. thrie beam CRT posts with two 6- in. x 8-in. blockouts (one tapered) Post nos. 2P-13P, 1-ft 6.75-in. spacing, located 1-ft 6.75-in. from post no. 1P Same as SR-4 Same as SR-4 Same as SR-4 Same as SR-4 Same as SR in. x 7.5-in. thrie BCT post (post nos. 2S) and BSR posts (post nos. 1P and 1S) in soil foundation tubes with secondary and primary side cable anchors, located 3-ft 1.5- in. from post no. 3S Same as SR-6 Same as SR-6 NOTES 2:1 slope break point (SBP) at center of post Shown in Figure 15 Slope eliminated and post spacing between post nos. 1 and 3 halved Parabolic flare added to primary side of system In test no. SR-5: external cable anchor added to front of system; in test no. SR-6, external anchor was modified such that it was entirely within the system (no external trigger in front of system) Post nos. 1S, 1P converted to BSR posts (shown in Figures 16 through 34); (2) plate washers added to post nos. 1S-2S and 1P- 4P; (3) thrie beam slot tabs reduced from 2 in. wide to 1 in.
24 Table 6. Summary of Short-Radius Guardrail Systems Full-Scale Crash Testing March 31, 2014 Test No. SR-1 SR-2 SR-3 SR-4 SR-5 SR-6 SR-7 SR-8 Reference No. 9, Vehicle 1995 Ford F-250 pickup 4,473 lb 1994 Chevrolet C2500 pickup 4,440 lb Ford F250 pickup 4,489 lb 1999 Chevrolet C2500 pickup 4,420 lb 1997 Ford F250 pickup 4,411 lb 1996 Geo Metro small car 1,969 lb 2002 Dodge Ram pickup 4,989 lb 2002 Dodge Ram pickup 5,000 lb Impact Conditions 61.5 mph and 19.0 deg 64.7 mph and 16.1 deg 63.9 mph and 0.9 deg 66.0 mph and 1.8 deg 63.3 mph and 0.9 deg 61.8 mph and 0.8 deg 62.3 mph and 18.1 deg 62.8 mph and 17.9 deg Impact Location Centerline of pickup with centerpoint of radius Centerline of pickup with centerpoint of radius Centerline of pickup with centerline of primary-side post no. 1 Centerline of pickup with centerline of primary-side post no. 1 Centerline of pickup with centerline of primary-side post no. 1 Right front quarter point of vehicle with centerline of nose Centerline of pickup with centerpoint of radius Centerline of pickup with centerpoint of radius Rail Height (in.) (thrie beam) (thrie beam) (thrie beam) (thrie beam) 31 (thrie beam) 31 (thrie beam) 31 (thrie beam) 31 (thrie beam) Result Failed - rollover on top of system Failed - rollover on top of system Failed - rollover on top of system Failed - tear in floorboard Passed Failed - windshield crushed by rail and hood Failed - rollover at end of event Failed - vehicle overrode rail at end of impact sequence 10
25 11 March 31, 2014 Table 7. Summary of Tested Bullnose Guardrail Systems Test No. B1 B Reference No. Anchorages W-beam end anchorages with cable anchors at nose and ends of system W-beam breakaway cable anchors at nose, W-beam end anchorages with cable anchors at ends of system with swaged fittings W-beam breakaway cable anchors at nose, two-directional W-beam end anchorages with Same as test no. 275 cable anchors at ends of system with swaged fittings 278 Same as test no W-beam end anchorages with BCT cables adjacent to bridge piers, front and back sides of system Rail Configuration Nose: 12-ft 6-in., 4.3-ft radius W-beam (90-degree bend) Front and back sides: Two 12-ft 6-in., straight W- beams Nose: 12-ft 6-in., 4.6-ft radius W-beam with two rail strengthening cables Transition: 12-ft 6-in. rail with 10-degree bend Front and back sides: Two 12-ft 6-in., straight W- beams Same as test no. 277, except that steel brackets were used to retain buttons at ends of nose strengthening cables Two-cable breakaway anchor attached to one post with double Nose: Buffer head attachment on first post blockouts on both sides of post at Flattened rail: 25-ft W-beam flattened and bent at every front of system and one post through post no. 5 breakaway cable anchor on each Straight rail: 12-ft 6-in. straight rail to center of system side at post no. 2 One breakaway cable anchor on each side at post no. 2 2A Same as test no. 2 4 Same as test no. 2 Back side: Two 12-ft 6-in., straight W-beam (to anchor) Nose: 12-ft 6-in., 5-ft radius asymmetrical nose Transition: Two 12-ft 6-in., 40-ft radius W-beam transitioning to straight guardrail Front side: 12-ft 6-in., straight W-beam (to anchor) Similar to test no. 1, but geometry of bends and rail flattening modified Similar to test no. 2, but geometry of bends and rail flattening modified Similar to test no. 2A, but geometry of bends and rail flattening modified System Dimensions 8.6-ft Wide 29.3-ft Long (half-length) 8.6-ft Wide 42.1-ft Long (half-length) Same as test no. 275 Post Details A 6-in. x 8-in. timber posts with 6-in. x 8-in. 16 ft Wide blockouts, placed in holes 30-ft Long (halflength) backfilled with lean concrete; 5 posts on back side, 7 posts on front side Same as test no. 277 Approx 37.5 ft long Approx 37.5 ft long Approx 37.5 ft long Approx 37.5 ft long 6-in. x 6-in. Douglas Fir timber post in concrete footing at center of nose Post no. 1 Same as test no. 271 Post Details B 6-in. x 6-in. Douglas Fir timber post with cable anchor Post no. 2, located 6-ft 3- in. from post no. 1 6-in. x 6-in. Douglas Fir timber post with breakaway cable anchor Post no. 2, located 6-ft 3- in. from post no. 1 Same as test no. 275 Same as test no in. x 4-in. Douglas Fir timber post in concrete footing at center of nose Post no in. x 7.5-in. BCT post with 1-in. slit, two blockouts on each of front and back sides, and two cable anchors (one to each side) Post no. 1 Same as test no. 1, except cable anchors were removed Same as test no. 2 Same as test no. 1, except cable anchors were removed N/A 6-in. x 6-in. Douglas Fir timber post in concrete footing with breakaway cable anchor Post no. 2, located 6-ft 3- in. from post no in. x 7.5-in. BCT post with cable anchor (attaches to rail downstream of post no. 3) and slit Post no. 2, located 6-ft 3- in. from post no. 1 Same as test no. 1, except slit in post no. 2 was modified Same as test no. 2, except slit in post no. 2 was modified Same as test no. 1, except slit in post no. 2 was modified Post Details C 8-in. x 6-in. timber posts with 6-in. x 8-in. blockouts Post nos. 3-4, 6-ft 3-in. spacing, located 6-ft 3-in. from post no. 2 8-in. x 6-in. timber posts with 6-in. x 8-in. blockouts Post nos. 3-6, 6-ft 3-in. spacing, located 6-ft 3-in. from post no. 2 8-in. x 8-in. timber posts with 8-in. x 8-in. blockouts Post nos. 3-6, 6-ft 3-in. spacing, located 6-ft 3-in. from post no. 2 8-in. x 8-in. timber posts with 8-in. x 8-in. blockouts and additional breakaway hole drilled Post nos. 3-6, 6-ft 3-in. spacing, located 6-ft 3-in. from post no. 2 6-in. x 8-in. CRT posts with 6-in. x 8-in. blockouts placed in concrete foundations and slit Post nos. 3-4, 6-ft 3-in. spacing, located 6-ft 3-in. from post no. 2 Same as test no. 1, except slits in post nos. 3-4 were modified Post Details D 8-in. x 6-in. timber post with 6-in. x 8-in. blockout and cable anchor Post no. 5-6, 6-ft 3-in. spacing, located 6-ft 3-in. from post no. 4 8-in. x 6-in. timber post with 6-in. x 8-in. blockout and cable anchor Post no. 7-8, 6-ft 3-in. spacing, located 6-ft 3-in. from post no. 6 Post Details E Post Details F N/A N/A N/A N/A 6-in. x 8-in. CRT post with 6-in. x 8-in. blockout placed in concrete foundations and slit Post no. 3, located 6-ft 3- in. from post no. 2 Same as test no. 1, except slits in post nos. 3-4 were modified NOTES N/A N/A Symmetrical system N/A N/A Same as test no. 275 N/A N/A Same as test no. 277 N/A N/A 6-in. x 8-in. timber posts Post no. 5, located 6-ft 3- in. from post no. 4 N/A N/A Same as test no. 1 N/A N/A 6-in. x 8-in. CRT posts with 6-in. x 8-in. blockouts and slit Post no. 4, located 6-ft 3- in. from post no. 3 6-in. x 8-in. timber posts Post no. 5, located 6-ft 3- in. from post no. 4 N/A Same as test no. 1 N/A N/A Concrete fill behind posts to simulate frozen soil conditions Asymmetrical system Series of design changes made after each test Nine 3 ft diameter inertial barrels used in center of system Steel angles used to support rail at each post on the system Sand barrels were eliminated Concrete footings resized to 24-in. diameter Symmetrical system Bent and flattened rail sections that came to a point at "nose" Minor tweaks to geometry and post reactions Minor tweaks to geometry and post reactions Minor tweaks to geometry and post reactions
26 Table 8. Summary of Short-Radius Guardrail Systems Full-Scale Crash Testing March 31, 2014 Test No. B1 B2 Reference No. Vehicle Impact Conditions Impact Location Rail Height (in.) 1971 Chevrolet Vega small car 2,290 lb 61.5 mph and 0 deg Centerline of vehicle with furthest extent of system Chrysler sedan 62.3 mph and 0 Centerline of vehicle with 4,500 lb deg furthest extent of system Result Passed Passed Dodge Polara sedan 4,780 lb 41 mph and 0 deg Centerline of vehicle aligned with centerline of system 27 Failure - rail rupture permitted vehicle penetration Mercury Monterey sedan 4,960 lb 1970 Mercury Monterey sedan 4,960 lb 63 mph and 0 deg 59 mph and 0 deg Centerline of vehicle aligned with centerline of system Centerline of vehicle aligned with centerline of system 27 Failure - vehicle struck feature behind rail 27 Passed Mercury Monterey sedan 4,960 lb 64 mph and 10 deg Centerline of vehicle aligned with center of posts on trafficside flare 27 Failure - rail formed ramp and vehicle vaulted rail 1 Small car 2,400 lb 29.1 mph and 0 deg Centerline of vehicle aligned with centerline of system 27 Passed 2 2A 17 Sedan 4,520 lb Sedan 4,540 lb 62.7 mph and 0 deg 62.7 mph and 0 deg Centerline of vehicle aligned with centerline of system Centerline of vehicle aligned with centerline of system 27 Deflection was greater than desired, but passed 27 Passed Gran Fury sedan 4,500 lb 57.4 mph and 24 deg At cable anchor rail connection attached to post no Marginal - excessive deflection 12
27 13 March 31, 2014 Table 9. Summary of Tested Bullnose Guardrail Systems (cont) Test No. Reference No. Anchorages Rail Configuration System Dimensions Post Details A Post Details B Post Details C Post Details D Post Details E Post Details F NOTES BN-1 Anchor from post no. 1 to primary side of system (not secondary side), cable anchorages on both ends of straight rail Nose: 12-ft 6-in., 12-gauge thrie beam with 5-ft radius Transition: 12-ft 6-in., 12-gauge thrie beam with 25-ft radius and 30-in. rail height Straight rail: 37-ft 6-in., 12-gauge thrie beams with 34- in. height at post no. 6 Approx 10 ft wide, 45 ft long 5.5-in. x 7.5-in. BCT post located at center of nose with anchor to primary side of system Post no. 1 6-in. x 8-in. CRT post Post no. 2, located 6-ft 3- in. from post no. 1 6-in. x 8-in. CRT post with 6-in. x 8-in. blockout Post no. 3, located 6-ft 3- in. from post no. 2 6-in. x 8-in. CRT post with 6-in. x 8-in. x 14-in. steel blockout Post no. 4, located 6-ft 3- in. from post no. 3 6-in. x 8-in. timber post with 6-in. x 8-in. x 14-in. steel blockouts Post nos. 5-10, spaced 6- ft 3-in. on center, located 6-ft 3-in. from post no. 4 N/A Symmetrical except that cable anchor at post no. 1 only attached to primary (upstream, or front) end of system and not secondary (downstream, or back side) of system, ditch located in front of system BN-2 BN-3 Similar to test no. BN-1, except Similar to test no. BN-1, except that steel plates were that the anchorage on post no. 1 welded to thrie beam at post locations to force bends to was removed occur there, and the nose was flattened at post no. 1 Same as test no. BN-2 Similar to test no. BN-2, except that welded plates adjacent to post nos. 1 and 2 (both sides) were removed to prevent stress concentrations Same as BN-1 Similar to test no. BN-1, except cable anchor was removed Similar to test no. BN-1, except that the rail height was lowered to 27 in. Same as test no. BN-1 Same as test no. BN-1 Same as test no. BN-1 N/A Same as BN-2 Same as test no. BN-2 Same as test no. BN-2 Same as test no. BN-2 Same as test no. BN-2 Same as test no. BN-2 N/A Rail height lowered at post no. 2, primary-side cable anchor removed from post no. 1, and brackets welded to rail near posts to force rail to bend at post locations Welded plates removed from rail near post nos. 1 and 2 (both sides) BN-4 18 Anchor from post no. 2 on primary side to rail upstream of Same as test no. BN-3 post no. 3, cable anchorages on both ends of straight rail Same as BN in. x 7.5-in. BCT post rotated and attached to the rail through the weak axis Post no in. x 7.5-in. BCT post with cable attachment to rail upstream of post no. 3 and blockout added to downstream face (primary side only) Post no. 2, located 6-ft 3- in. from post no. 1 Same as BN-3 Same as BN-3 Same as BN-3 N/A Post no. 1 rotated such that impact would engage bending through weak axis, post no. 2 modified to fracture more quickly but anchor rail until fracture BN-5 Anchor from post no. 2 to rail upstream of post no. 3 on both Same as test no. BN-4 sides, cable anchorages on both Same as BN-4 Same as BN-4 ends of straight rail 5.5-in. x 7.5-in. BCT post with cable attachment to rail upstream of post no. 3 and blockout added to downstream face (both sides) Same as BN-4 Same as BN-4 Same as BN-4 N/A Similar to test no. BN-4, except that system became completely symmetrical Post no. 2, located 6-ft 3- in. from post no. 1 BN-6 Same as test no. BN-5, except excess length of BCT threaded Similar to test no. BN-5, except that the post bolt slots rod cut off to prevent punching at post no. 3 were eliminated shear rupture in rail Same as BN-5 Same as BN-5 Same as BN-5 Same as BN-5 Same as BN-5 Same as BN-5 N/A Post bolt slots at post no. 3 eliminated and ends of BCT rail attachment threaded rod cut off, due to rail ruptures BN-7 BN-8 BN-9 Same as test no. BN-6 Similar to test no. BN-6, except rail height was increased to 29 in. at post no. 2 (both sides) Same as BN-6 Same as test no. BN-6, except that steel blockouts were used to space the rail from the post Same as test no. BN-6, except that steel blockouts were used to space the rail from the post (both sides) Same as test no. BN-6, except that steel blockouts were used to space the rail from the post (both sides) Same as BN-6 Same as BN-6 N/A Rail height increased to 29 in. at post no. 2 and steel blockouts were used on post nos. 1-3 (both sides) BN-10 Similar to test nos. BN-7 through BN-9, except that Anchor cable brackets attached cable clamps were substituted for the cable anchor to rail due to cable anchor at post bracket for the cable anchors attached to post no. 2 no. 2 eliminated (both sides) Same as BN-7 through BN-9 Same as BN-7 through BN-9 Same as BN-7 through BN-9 Same as BN-7 through BN-9 Same as BN-7 through BN-9 Same as BN-7 through BN-9 N/A Anchor cable brackets attached to rail due to cable anchor at post no. 2 eliminated and substituted for cable clamps
28 Table 10. Summary of Short-Radius Guardrail Systems Full-Scale Crash Testing March 31, 2014 Test No. BN-1 BN-2 BN-3 BN-4 BN-5 BN-6 Reference No. 18 Vehicle Sedan 4,635 lb Sedan 4,333 lb Small car 1,940 lb Small car 1,990 lb Sedan 4,675 lb Sedan 4,870 lb Impact Impact Location Conditions Centerline of vehicle aligned 60 mph and 0 deg with centerline of system (NCHRP Report 230 test 41/50) Centerline of vehicle aligned 59.1 mph and 4.7 with centerline of system deg (NCHRP Report 230 test 41/50) 56.9 mph and 0 deg 61.0 mph and -4.0 deg mph and deg 59.5 mph and 18.7 deg Centerline of vehicle aligned with centerline of system (NCHRP Report 230 test 52/45) Centerline of vehicle aligned with centerline of system (NCHRP Report 230 test 52/45) Centerline of vehicle aligned with centerline of system (NCHRP Report 230 test 41/50) Critical impact point (NCHRP Report 230 test 54) Rail Height (in.) 30 (post 2) 34 (post 6) 27 (post 2) 34 (post 6) 27 (post 2) 34 (post 6) 27 (post 2) 34 (post 6) 27 (post 2) 34 (post 6) 27 (post 2) 34 (post 6) Result Failed - vehicle underrode barrier Passed Failed - excessive decelerations Marginal - excessive decelerations Passed Marginal - vehicle came to rest on top of system BN-7 Sedan 4,665 lb 59.9 mph and 0.5 deg Centerline of vehicle aligned with centerline of system (NCHRP Report 230 test 41/50) 29 (post 2) 34 (post 6) Passed BN-8 Sedan 4,695 lb 61.4 mph and 19.0 deg Critical impact point (NCHRP Report 230 test 54) 29 (post 2) 34 (post 6) Passed BN-9 Sedan 4,680 lb 59.9 mph and 15.5 deg Critical impact point (NCHRP Report 230 test 54) 29 (post 2) 34 (post 6) Failed - rail ruptured BN-10 Sedan 4,640 lb 59.9 mph and 15.0 deg Critical impact point (NCHRP Report 230 test 54) 29 (post 2) 34 (post 6) Passed 14
29 15 March 31, 2014 Table 11. Summary of Tested Bullnose Guardrail Systems (cont) Test No. BN-11 BN-12 BN-13 BN-14 Reference No. Anchorages Same as test nos. BN11 through BN13 BN-15 Same as test no. BN-14 Same as test no. BN-14 BN Post nos were removed and replaced with rigid concrete Same as test no. BN-10 backup to simulate bridge pier (both sides) Same as test no. BN-15 Rail Configuration Same as test nos. BN-11 through BN-13, except rectangular washers were added to post nos. 2 and 3 to retain posts with rail (both sides) Similar to test no. BN-15, except nose piece thickened to 10-gauge and slotted to catch small car bumper System Dimensions Same as test no. BN-10 Same as test nos. BN-11 through BN-13 Same as test no. BN-14 Same as test no. BN-15 Post Details A Same as test nos. BN-11 through BN-13 Same as test no. BN-14, except blockout removed Post Details B Same as test nos. BN-11 through BN-13 Same as test no. BN-14, except blockout removed (both sides) Post Details C Same as test nos. BN-11 through BN-13 Post Details D Same as test no. BN-10 Same as test no. BN-10 Same as test no. BN-10 Same as test no. BN-10 Same as test nos. BN-11 through BN-13 Post Details E 6-in. x 8-in. timber post with 6-in. x 8-in. x 14-in. steel blockouts Same as test nos. BN-11 through BN-13 Post Details F Rigid concrete backup structure Substituted for post nos. 9- Post nos. 5-8, spaced 6-ft 10, 6-ft 3-in. attachment 3-in. on center, located 6- spacing, located 6-ft 3-in. ft 3-in. from post no. 4 from post no. 8 Same as test nos. BN-11 through BN-13 Same as test no. BN-14 Same as test no. BN-14 Same as test no. BN-14 Same as test no. BN-14 NOTES Rigid concrete backup structure added to simulate real-world bridge pier attachments Rectangular washers added to post nos. 2 and 3 to retain posts on rail and reduce launching Blockouts removed from post nos. 1 and 2 (both sides) Same as test no. BN-15 Same as test no. BN-15 Same as test no. BN-15 Same as test no. BN-15 Same as test no. BN-15 Same as test no. BN-15 Final symmetrical system
30 Table 12. Summary of Short-Radius Guardrail Systems Full-Scale Crash Testing March 31, 2014 Test No. Reference No. Vehicle Impact Conditions Impact Location Rail Height (in.) Result BN-11 Sedan 4,305 lb 59.9 mph and 16.2 deg Critical impact point (NCHRP Report 230 test 54) 29 (post 2) 34 (post 6) Vehicle came to rest on top of rail - passed BN-12 BN-13 BN-14 BN-15 BN Pickup truck 5,400 lb Small car 1,820 lb Small car 1,800 lb Small car 1,935 lb Small car 1,935 lb 55 mph and 0.1 deg 59.4 mph and 58.7 mph and 2.7 deg 58.7 mph and 60.2 mph and Centerline of vehicle aligned with centerline of system (NCHRP Report 230 test 41/50) Centerline of vehicle aligned with centerline of system (NCHRP Report 230 test 52/45) Centerline of vehicle aligned with centerline of system (NCHRP Report 230 test 52/45) Centerline of vehicle aligned with centerline of system (NCHRP Report 230 test 52/45) Centerline of vehicle aligned with centerline of system (NCHRP Report 230 test 52/45) 29 (post 2) 34 (post 6) 29 (post 2) 34 (post 6) 29 (post 2) 34 (post 6) 29 (post 2) 34 (post 6) 29 (post 2) 34 (post 6) Passed Failed - excessive decelerations Failed - underride caused rail to crush windshield (due to vehicle bouncing in approach ditch) Failed - underride caused rail to crush windshield Despite windshield crush, passed 16
31 17 March 31, 2014 Table 13. Summary of Tested Bullnose Guardrail Systems (cont) Test No. MBN-1 MBN-2 Reference No. Anchorages Cable anchorage used at post no. 2 and cable end anchor used at end of system (symmetrical, both sides) Same as test no. MBN-1 Rail Configuration Nose: 12-ft 6-in. long, 62 3/16-in. radius, slotted thrie beam Transition: 12-ft 6-in. long, 34-ft 1.5-in. radius slotted thrie beam Straight Rail: 37-ft 6-in. thrie beam MBN-3 Same as test no. MBN-2 Same as test no. MBN-2 MBN-4 MBN-5 MBN Same as test no. MBN-3 Same as test no. MBN-4 Similar to test no. MBN-1, except slot tabs in transition thrie beam were reduced, and slots were added to first of straight rail segments Same as test no. MBN-3, except that steel cables were added to middle and top corrugations of thrie beam at nose Same as test no. MBN-4 System Dimensions Post Details A 5.5-in. x 7.5-in. BCT post 14-ft 10-in. at end of radius wide, 53-ft long Post no. 1 Same as test no. MBN-1 Same as test no. MBN-2 Same as test no. MBN-3 Same as test no. MBN-4 Post Details B 5.5-in. x 7.5-in. BCT post with cable anchor and angled ground strut to post no. 1 Post no. 2, located 6-ft 3- in. from post no. 1 Same as test no. MBN-1 Same as test no. MBN-1 Same as test no. MBN-2 Similar to test no. MBN- 2, except blockouts were reduced to in. long Post Details C 6-in. x 8-in. timber posts with rectangular blockouts Post nos. 3-9, 6-ft 3-in. spacing, located 6-ft 3-in. from post no in. x 7.5-in. BCT post with thrie beam blockout Post no. 3, located 6-ft 3- in. from post no. 2 Similar to test no. MBN- 2, except blockouts were reduced to in. long Post Details D BCT end anchorage with ground strut Post nos , located 6- ft 3-in. from post no. 9 6-in. x 8-in. CRT post with thrie beam blockout Post no. 4, located 6-ft 3- in. from post no. 3 6-in. x 8-in. CRT posts with in. tall blockouts Post nos. 4-5, 6-ft 3-in. spacing, located 6-ft 3-in. from post no. 3 Post Details E N/A 6-in. x 8-in. timber posts with rectangular thrie beam blockouts Post nos. 5-9, 6-ft 3-in. spacing, located 6-ft 3-in. from post no. 4 6-in. x 8-in. timber posts with in. tall blockouts Post nos. 6-9, 6-ft 3-in. spacing, located 6-ft 3-in. from post no. 5 Post Details F N/A BCT end anchorage with ground strut Post nos , located 6- ft 3-in. from post no. 9 Same as MBN-2 Same as test no. MBN-3 Same as test no. MBN-3 Same as test no. MBN-3 Same as test no. MBN-3 Same as test no. MBN-3 Same as test no. MBN-3 Same as test no. MBN-4 Same as test no. MBN-4 Same as test no. MBN-4 Same as test no. MBN-4 Same as test no. MBN-4 Same as test no. MBN-4 NOTES Similar to BN-14 system, except ditch in front of system eliminated, post no. 1 shifted away from center of nose, and symmetrical construction Post nos. 3 and 4 were converted to breakaway posts (both sides) Blockout sizes reduced for post nos. 2-9, and post no. 5 converted to CRT Steel cables added to nose to reduce rail rupture potential Same design, but new series of tests & new report MBN-7 MBN-8 MBN-9 USPBN- 1 USPBN ,23 Same as test no. MBN-5 and MBN-6 Same as test no. MBN-5 and MBN-6 Similar to test no. MBN-7, except that the groundline strut between Same as test no. MBN-7 post nos. 1 and 2 was eliminated (both sides) Cable anchorage used at post no. 2 and cable end anchor used at end of system (symmetrical, both sides) Nose: 12-ft 6-in. long, 62 3/16-in. radius, slotted thrie beam with reinforcing cables and swaged cable buttons Transition: 12-ft 6-in. long, 34-ft 1.5-in. radius slotted thrie beam Straight Rail: 37-ft 6-in. thrie beam 24 Same as USPBN-1 Same as USPBN-1 Same as test no. MBN-5 and MBN-6 Same as test no. MBN-7 14-ft 10-in. wide, 53-ft long Same as USPBN-1 Same as test no. MBN-5 and MBN-6, except standard BCT foundation tubes used Same as test no. MBN in. x 7.5-in. BCT post in 90-in. deep foundation tube at end of radius Post no. 1 Same as USPBN-1 6-in. x 8-in. CRT post with cable anchor and angled ground strut to post no. 1 Post no. 2, located 6-ft 3- in. from post no in. x 7.5-in. BCT post with cable anchor Post no. 2, located 3-ft 1.5-in. from post no in. x 7.5-in. BCT post in 70-in. soil foundation tube with cable anchor Post no. 2, located 3-ft 1.5-in. from post no. 1 Same as USPBN-1 6-in. x 8-in. CRT posts with in. tall blockouts Post nos. 3 through 6, 3-ft 1.5-in. spacing, located 3- ft 1.5-in. from post no. 2 6-in. x 8-in. CRT posts with in. tall blockouts (one straight, one tapered) Post nos. 3 through 7, 3-ft 1.5-in. spacing, located 3- Universal Breakaway Steel Posts with in. tall blockouts (one straight, one tapered) Post nos. 3 through 7, 3-ft 1.5-in. spacing, located 3- ft 1.5-in. from post no. 2 Similar to USPBN-1, except MwRSF's modified Universal Breakaway Steel Post substituted for the original 6-in. x 8-in. CRT post with in. tall blockout Post no. 7, located 6-ft 3- in. from post no. 6 6-in. x 8-in. CRT post with in. tall blockouts (one straight, one tapered) Post no. 8, located 6-ft 3- in. from post no. 7 Universal Breakaway Steel Post with in. tall blockouts (one straight, one tapered) Post no. 8, located 6-ft 3- in. from post no. 7 Similar to USPBN-1, except MwRSF's modified Universal Breakaway Steel Post substituted for the original 6-in. x 8-in. timber posts with in. tall blockouts Post nos. 8-11, 6-ft 3-in. spacing, located 6-ft 3-in. from post no. 7 6-in. x 8-in. timber posts with in. tall blockouts Post nos. 9-12, 6-ft 3-in. spacing, located 6-ft 3-in. from post no. 8 W6x9 posts with 6-in. x 8- in. x in. straight blockouts Post nos. 9-12, spaced 6- ft 3-in., located 6-ft 3-in. from post no. 8 Same as USPBN-1 BCT end anchorage with ground strut Post nos , located 6- ft 3-in. from post no. 11 BCT end anchorage with ground strut Post nos , located 6- ft 3-in. from post no. 12 BCT end anchorage with ground strut Post nos , located 6- ft 3-in. from post no. 12 Same as USPBN-1 Two additional CRT posts added to give additional strength Final system details, approved according to NCHRP Report No. 350 criteria Similar to MBN-9 using Universal Breakaway Steel Posts developed at MwRSF Similar to USPBN-2 using modified Universal Breakaway Steel Posts developed at MwRSF Approved according to NCHRP Report No. 350
32 Table 14. Summary of Short-Radius Guardrail Systems Full-Scale Crash Testing March 31, 2014 Test No. Reference No. Vehicle Impact Conditions Impact Location Rail Height (in.) Result MBN-1 MBN Ford F250 pickup 4,404 lb 1988 Ford Festiva small car 1,953 lb 63.0 mph and 0.1 deg 64.2 mph and -3.4 deg Centerline of vehicle aligned with centerline of system 1/4-point offset of vehicle with centerline of system (thrie beam) (thrie beam) Failure - rail rupture permitted vehicle penetration Passed MBN-3 MBN Chevrolet C2500 pickup 4,384 lb 1991 Chevrolet C2500 pickup 4,431 lb 62.2 mph and -1.1 deg 64.3 mph and 0.58 deg Centerline of vehicle aligned with centerline of system Centerline of vehicle aligned with centerline of system (thrie beam) (thrie beam) Failure - rail rupture permitted vehicle penetration Passed MBN Chevrolet C2500 pickup 4,493 lb 64.0 mph and 13.4 deg Centerline of vehicle aligned with center point of nose (thrie beam) Passed MBN Chevrolet C2500 pickup 4,477 lb 63.1 mph and 20.4 deg CIP along length of thrie beam (thrie beam) Failure - rail formed ramp, vehicle vaulted MBN Chevrolet C2500 pickup 4,488 lb 62.1 mph and 24.9 deg CIP along length of thrie beam (thrie beam) Failure - rail formed ramp, vehicle vaulted MBN GMC 2500 pickup 4,482 lb 62.0 mph and 21.5 deg CIP along length of thrie beam (thrie beam) Passed MBN Ford Festiva small car 1,993 lb 65.2 mph and 15.7 deg Centerline of vehicle aligned with center point of nose (thrie beam) Passed USPBN- 1 22, GMC 2500 pickup 4,474 lb 63.2 mph and 22.6 deg Centerline of truck aligned with center of post no (thrie beam) Failure - rail formed ramp, vehicle vaulted USPBN GMC 2500 pickup 4,564 lb 62.9 mph and 21.7 deg Centerline of truck aligned with center of post no (thrie beam) Passed 18
33 Primary Roadway Side Secondary Roadway Side Figure 1. Washington W-Beam Short Radius Design [10] mm x 203 mm x 362 mm) timber blockouts. The final design was determined to pass all crash test criteria according to NCHRP Report No
34 20 March 31, 2014 The TTI W-beam short radius system utilized round timber posts instead of rectangular posts, and anchored the W-beam on the secondary roadway with a W-beam turndown anchor [11]. The TTI system is shown in Figures 2 through 7. The W-beam guardrail was nested throughout the radius section. The transition utilized tubular, nested rail with an additional rail mounted backwards against the post. A cable anchor was attached to the rail downstream of the radius to develop tension in the transition region. The TTI W-beam system was tested and evaluated according to NCHRP Report 230 evaluation criteria. The system performed acceptably during each crash test, with one exception. After the 4,500-lb (2,041-kg) sedan impacted the curved rail at 15 degrees and 90% of the vehicle s energy was dissipated, the rail disengaged from the bumper and rose up the vehicle s front end, crushing the windshield. Although this performance was determined to be unacceptable, researchers postulated that since this impact type was both infrequent and relatively severe, the system would perform acceptably in the majority of impacts. Thus, the system was recommended for use in locations with intersecting roadways System Tested to AASHTO Guidance Specifications The Yuma County system [6] was designed specifically for one oblique intersection, with a 5.5-degree system flare. The successfully-tested final system details are shown in Figure 8. Researchers identified five different critical impact locations with associated impact angles to assess system performance. Light truck impacts were used to assess structural adequacy and pocketing near the transition and when impacted tangentially to the bridge rail, in addition to an angled impact on the nose. Small car impacts were used to evaluate the tendency to underride when impacting tangentially to the bridge rail and at an angle to the nose. The preliminary design of the Yuma County system performed acceptably according to AASHTO PL-1 criteria in all but one test, in which both of the secondary-side anchorage BCT
35 21 March 31, 2014 Figure 2. TTI W-Beam Short Radius Design [11]
36 Figure 3. CRT Post and Cable Anchor Details, TTI W-Beam Short Radius System [11] 22
37 Figure 4. Turndown Rail Details, TTI W-Beam Short Radius System [11] 23
38 Figure 5. Transition Details, TTI W-Beam Short Radius System [11] 24 March 31, 2014
39 Figure 6. Curved Rail Bend Details, TTI W-Beam Short Radius System [11] Figure 7. Downstream Curved Rail Bend Details, TTI W-Beam Short Radius System [11] 25
40 Two cables to develop upstream and downstream tension at post nos. 1 and 2 Figure 8. Yuma County Short-Radius Guardrail System Final Design Details [6, 27] posts fractured and the spliced two-cable BCT anchor released, allowing the vehicle to encroach behind the barrier system. Researchers lengthened the secondary side of the system to increase anchoring capacity, and the system was determined to be successful. 2.2 Short Radius Systems Tested to NCHRP Report No. 350 and MASH No short radius systems have yet been approved according to the TL-3 crash test conditions required in NCHRP Report No. 350 or MASH. The majority of NCHRP Report No. 350 and MASH-compliant tests on short-radius system were conducted at either TTI or the Midwest Roadside Safety Facility (MwRSF). 26
41 2.2.1 TTI Short-Radius Project Researchers at TTI designed a thrie beam alternative to the TTI W-beam short-radius system successfully tested according to NCHRP Report No. 230 [8]. Final design details are shown in Figures 9 through 14. Researchers observed that the bending section of a nested 12- gauge (2.6-mm) W-beam section was approximately equivalent to the bending strength of a 10- gauge (3.3-mm) thrie beam section. Due to the broader capture area of the thrie beam, the higher top mounting height and lower bottom corrugation height, and ease of construction relative to the nested W-beam guardrails particularly at splice locations, researchers postulated that the thrie beam should perform approximately as well as the W-beam system. Initially, the design was tested according to the TL-3 impact conditions criteria presented in NCHRP Report No The first crash test, consisting of a 2000P vehicle impacting the system at 60.9 mph (98.0 km/h) and 26 degrees near the transition, was determined to be successful. The remaining two tests conducted with a 2000P vehicle into the curved nose of the system were both determined to be failures, due to override and vaulting. Researchers concluded that the system would require extensive modification to be considered crashworthy according NCHRP Report No Testing commenced with the 1,800-lb (816-kg) small car and 4,500-lb (2,041-kg) sedan with angled hits into the center of the curved radius in compliance with NCHRP Report No The two tests passed with marginal performance due to the release of the rail from the upstream turned-down anchor in the sedan test and underride of the small car. The marginal performance of the system was unexpected, because the increased top mounting height of 31 in. (787 mm) also resulted in a lower bottom mounting height of 13 in. (330 mm), so underride was not expected. 27
42 28 March 31, 2014 Figure 9. Final Thrie Beam Short Radius Design, TTI Thrie Beam Short Radius System [8]
43 Figure 10. Transition to Rigid Bridge Rail Details, TTI Thrie Beam Short Radius System [8] 29
44 Figure 11. Standard and CRT Post Details, TTI Thrie Beam Short Radius System [8] 30
45 Figure 12. Rail-to-Post Connection Details, TTI Thrie Beam Short Radius System [8] 31
46 Figure 13. Turned-Down Anchor Details, TTI Thrie Beam Short Radius System [8] Figure 14. Curved Nose Thrie Beam Section, TTI Thrie Beam Short Radius System [8] 32
47 2.2.2 MwRSF Short-Radius Project The Midwest Roadside Safety Facility (MwRSF) also attempted to develop a crashworthy system according to the TL-3 test criteria presented in NCHRP Report No. 350 [9, 12-13], as shown in Figure 15, and subsequently tested the system to the criteria presented in MASH [14]. The final design tested in compliance with MASH is shown in Figures 16 through 34. The short radius system was based on previous research on the NCHRP Report No. 350 tested thrie beam bullnose system and was constructed using curved thrie beam. Rectangular CRT posts were used to support the rail on both the primary and secondary sides of the roadway. The curved nose piece initially had a 7 ft 9¾ in. (2,381 mm) radius, which was later changed to 8 ft 11⅜ in. (2,727 mm) when a parabolic flare was added to the system. Early tests utilized sloped terrain behind the system to replicate real-world conditions with roadside slopes, but the slopes were removed due to the increased risk of vaulting and artificial increase in instability due to interaction with the back side of the sloped cutout during testing. A total of six tests were conducted in compliance with NCHRP Report No. 350 TL-3 test criteria [9, 12-13], and two tests were conducted in compliance with MASH TL-3 test criteria [14]. Impact conditions for each test are described in Tables 11 and 13. Only one test was determined to be successful, which consisted of a 2000P pickup truck impacting the system with the centerline of the truck aligned with a tangent line to the bridge rail. The remaining tests, primarily consisting of angled impacts with 2000P, 820C, and 2270P vehicles into the center of the nose, failed due to vaulting, rollover, or underride. Researchers concluded that while the system performed very well overall despite the failure to comply with the evaluation criteria, it would likely be acceptable according to TL-2 impact conditions. However, the system was excessively large on the primary and secondary road sides and undesirable for a lower performance level, and no further testing was conducted. 33
48 34 March 31, 2014 Figure 15. Preliminary Thrie Beam Short Radius Design, MwRSF Short Radius System [12, 9]
49 35 March 31, 2014 Figure 16. Final Thrie Beam Short Radius Design, MwRSF Short Radius Design [14]
50 36 March 31, 2014 Figure 17. Primary Side Post Layout, MwRSF Short Radius Design [14]
51 37 March 31, 2014 Figure 18. Secondary Side Post Layout, MwRSF Short Radius Design [14]
52 38 March 31, 2014 Figure 19. Primary Side Cable Anchorage Details, MwRSF Short Radius Design [14]
53 39 March 31, 2014 Figure 20. Secondary Side Cable Anchorage Details, MwRSF Short Radius Design [14]
54 40 March 31, 2014 Figure 21. Cable Anchorage Component Details, MwRSF Short Radius Design [14]
55 41 March 31, 2014 Figure 22. Tension Cable and Anchor Plate Used in Curved Nose Piece, MwRSF Short Radius Design [14]
56 42 March 31, 2014 Figure 23. Post Naming Conventions and Rail Heights, MwRSF Short Radius Design [14]
57 43 March 31, 2014 Figure 24. Foundation Tube Details, MwRSF Short Radius Design [14]
58 44 March 31, 2014 Figure 25. MGS BCT and MGS CRT Post Details, MwRSF Short Radius Design [14]
59 45 March 31, 2014 Figure 26. BSR and Thrie Beam Post Details, MwRSF Short Radius Design [14]
60 46 March 31, 2014 Figure 27. Post Details, MwRSF Short Radius Design [14]
61 47 March 31, 2014 Figure 28. Stiff Bridge Rail Details, MwRSF Short Radius Design [14]
62 48 March 31, 2014 Figure 29. Stiff Bridge Rail Post Details, MwRSF Short Radius Design [14]
63 49 March 31, 2014 Figure 30. Rail Slot Details, MwRSF Short Radius Design [14]
64 50 March 31, 2014 Figure 31. Rail Slot Details, MwRSF Short Radius Design [14]
65 51 March 31, 2014 Figure 32. Thrie Beam Bend Details, MwRSF Short Radius Design [14]
66 52 March 31, 2014 Figure 33. Thrie Beam Bend Details, MwRSF Short Radius Design [14]
67 53 March 31, 2014 Figure 34. Thrie Beam Bend Details, MwRSF Short Radius Design [14]
68 2.3 Bullnose Systems Tested Prior to NCHRP Report No. 230 Bullnose system designs vary widely, but all utilized W-beam or thrie beam as the primary rail element. One of the oldest crash-tested bullnose designs was the asymmetrical Minnesota W-beam bullnose [15]. The system resembled a parabolically-flared W-beam guardrail system located upstream of a median hazard that was connected to an identical, parabolically-flared system shielding the hazard from the opposite direction of travel. Flares were transitioned over approximately 2⅓ sections of 12-ft 6-in. (3,810-mm) W-beam. A single curved W-beam rail section connected the flared rail on one side of the system to the straight rail on the other side. The system was tested in the early 1970s before NCHRP Report 230 was published. Tests consisted of a 4,500-lb (2,041-kg) sedan and a 2,290-lb (1,039-kg) small car both impacting at approximately 60 mph (97 km/h) and 0 degrees relative to the nose of the system, with the centerline of the vehicle aligned with the center point of the radius. Both tests were determined to be satisfactory. All of the remaining bullnose systems tested to NCHRP Report No. 230 test criteria were symmetrical. One system design utilized a W-beam guardrail with a 4 ft 6 in. (1,372 mm) radius and a 10-degree flare from the nose, and was successfully tested by the California Department of Transportation (Caltrans) after extensive revisions to the initial design [16]. A novel crumpling bullnose system with very sharp front-end profile was evaluated by TTI for the Colorado Department of Transportation [17]. The crumpling bullnose system consisted of W-beam rail flattened at the first four post locations, with staggered post locations to control W-beam buckling. A flattened, curved, buffer nose piece was attached at the front of the system to act as the impact head, eliminating the need for any curved W-beam rail segments. Four successful end-on crash tests were conducted into variations of the flattened-rail system, although one crash result was marginal due to occupant compartment deformation. 54
69 55 March 31, 2014 A third W-beam bullnose system design was tested and modified by the Southwest Research Institute (SwRI), incorporating a curved frontal W-beam nose section, a curved W- beam transition section, and straight sections of W-beam downstream from the nose [18]. Cable anchors, ground struts, foundation tubes, post sizes, spacings, and orientations, and rail slots were extensively modified during the development of the W-beam bullnose system. The system was successfully tested according to NCHRP Report No. 230 with 4,500-lb (2,041-kg) sedans and 1,800-lb (816-kg) small cars. A total of 16 tests were conducted on design modifications before the system was determined to be crashworthy according to NCHRP Report No. 230 performance criteria. 2.4 Bullnose Systems Tested to NCHRP Report No. 350 MwRSF conducted a series of tests on a bullnose system according to NCHRP Report No. 350 between 1997 and 2010 [19-24]. The crash test matrix required to successfully test the bullnose system was similar to the required short-radius crash tests, as shown in Figure 35. The initial concept design of the bullnose system was similar to the design tested and evaluated by SwRI according to NCHRP Report No. 230 test criteria. The system was comprised of a 12 ft 6 in. (3,810 mm) curved and slotted thrie beam section which formed the nose, a 12 ft 6 in. (3,810 mm) curved and slotted transition thrie beam section, and two 12 ft 6 in. (3,810 mm) straight thrie beam sections parallel to the roadways on the respective sides. Initially, the 2000P pickup truck test vehicle vaulted the system when the system was struck at a 0-degree angle, and the slot tabs were shortened. In subsequent tests the 2000P vehicle ruptured through the rail. The design was modified to include cables in the nose section of thrie beam to facilitate capture after the rail tore through the slot tabs. Further tests with the 2000P vehicle into the critical impact point (NCHRP Report No. 350 test no. 3-35) resulted in vehicular launching. Researchers determined that the groundline
70 Figure 35. Required Bullnose Crash Tests According to NCHRP Report No. 350 strut connecting the first and second posts along each side of the system facilitated vehicle launching by lifting the vehicle and allowing the rail to pass beneath the vehicle s tire on the impacting corner. After further modifying the system, including eliminating the ground line strut, modifying several soil tubes, and reducing post spacing, the system successfully passed test NCHRP Report No. 350 TL-3 test no impact conditions consisting of a 2000P vehicle impacting at 20 degrees and 62.1 mph (100.0 km/h) at the critical impact point (CIP) of the system. Subsequently, the system was tested in accordance with to TL-3 test no impact conditions, consisting of an 820C small car impacting the center of the nose of the system with a ¼-point offset at 62.1 mph (100 km/h) and 100 degrees, was also successful. 56
71 2.5 Relationship Between Bullnose and Short Radius Guardrail Systems March 31, 2014 Historical short radius systems tested according to criteria established before NCHRP Report 350 experienced fewer test failures than later systems did. Bullnose systems, due to the relevance and frequency of need, received significant attention and development. Short-radius guardrail systems are critical, but the size and scope of the problem and funds required to develop a successful system has hampered successful system development. Rail radii used in these bullnose systems were similar to the radii used in short radius systems. Key system features such as breakaway posts, rail flares, and intermediate and end terminal cable anchors were used for both short-radius and bullnose barriers. The major differences between bullnose and short radius guardrail systems are that bullnose systems were typically symmetrical and encompassed a 180-degree bend, compared to short radius systems which more commonly encompassed approximately 90 degrees. In addition, many bullnose barriers are used in divided medians of roadways with similar traffic volumes and speeds for both directions of travel. Thus the entire bullnose system was tested to one set of performance criteria. Short-radius systems utilize a primary, higher-speed and higher-traffic volume side, and a secondary, lower-speed and lower-traffic volume side, which may not encompass the same levels of protection. Both bullnose and short radius systems evolved from W-beam to thrie beam guardrail. Typical end anchorages, such as BCT or MGS end anchorages [25], were modified by eliminating bearing struts and using different foundation tube sizes. Traditional CRT posts, which were sufficient for vehicle redirection for the historical systems according to criteria presented in NCHRP Report 230 crash test criteria or earlier reports, were sometimes modified to include additional or larger transverse holes, varied embedments, and different lengths. 57
72 Furthermore, rail slots were added to thrie beam bullnose and short radius systems tested at MwRSF to reduce rail bending strength and improve vehicle capture. 2.6 Short Radius Systems with Larger Radii Currently, there have been no reported full-scale crash tests to NCHRP Report Nos. 230 or 350 or MASH of short-radius systems with radii larger than 16 ft (4,877 mm). A summary of the radii of tested systems, the test result, and reference test criteria is shown in Table 15. Although no systems have been crash-tested with a radius larger than 16 ft (4,877 mm), the FHWA Technical Advisory permitted the installation of short radius systems with radii as large as 35 ft (10.7 m) [7], as shown in Figure 36. Limited guidance is available to assess realworld impact performance of these large-radius systems. Several states have drafted standards for larger radii installations based on the recommendations provided by FHWA, many times in response to a need to accommodate large vehicles turning from secondary roadways onto primary roadways. Washington and Wisconsin DOT standards for larger-radius systems are shown in Figure 37 and Figures 37 through 39, respectively. Examples of locations in which guardrail systems with radii larger than 16 ft (4.9 m) are needed are shown in Figure
73 Table 15. Summary of Short Radius and Bullnose Documented Testing by Radius Reference Number System Type Radius of Nose Piece ft (m) Evaluation Criteria March 31, Short Radius 8.5 (2.6) NCHRP Report No. 230 P 6 Short Radius 8 (2.4) NCHRP Report No. 230 P 11 Short Radius 16 (5) NCHRP Report No. 230 P 8 Short Radius 16 (5) NCHRP Report No. 230 P 9, Short Radius 9 (2.7) NCHRP Report No. 350 F 14 Short Radius 9 (2.7) MASH F 15 Bullnose 5 (1.5) Historical/Unknown P 16 Bullnose 4.6 (1.4) NCHRP Report No. 230 P 17 Bullnose 0* NCHRP Report No. 230 P 18 Bullnose 5 (1.5) NCHRP Report No. 230 P Bullnose 5.18 (1.58) NCHRP Report No. 350 P * Curved plate formed impact head. Rail was perpendicular to vehicle at impact. Pass/ Fail 59
74 60 March 31, 2014 Figure 36. Acceptable Short Radius Guardrail System Designs, FHWA Technical Memorandum [7]
75 61 March 31, 2014 Figure 37. Washington State Standards for Short Radius Guardrail at Intersecting Roadways [26]
76 62 March 31, 2014 Figure 38. Wisconsin State Standards for Short Radius Guardrail at Intersecting Roadways
77 63 March 31, 2014 Figure 39. Wisconsin State Standards for Short Radius Guardrail at Intersecting Roadways


78 Figure 40. Example Applications for Systems with Radii Larger than 16 ft (4.9 m) 64
79 3 SELECTION OF SHORT RADIUS GUARDRAIL SYSTEM 65 March 31, 2014 No TL-3 short-radius systems have been approved to either MASH or NCHRP Report No Therefore, the researchers evaluated systems successfully tested according to NCHRP Report No. 230 which could be capable of capturing errant vehicles with radii of approximately 70 ft (21.3 m). Researchers evaluated three candidate W-beam short radius systems which showed satisfactory crashworthiness performance [10-11]: TTI nested W-beam; Washington; and Yuma County short-radius systems. The TTI W-beam short radius design was rejected because the configuration was both difficult to construct and utilized hardware which was non-standard for Wisconsin DOT. In addition, a substitute anchor would be required in lieu of the turndown anchor used in the tested system, which has been shown to be hazardous to impacting vehicles. Furthermore, the tubular rail approach transition to stiff bridge rail was undesirable, and other bridge approach transition designs would be preferred. Researchers determined that the modifications to the system which would be required to make the TTI design more practical for Wisconsin DOT were beyond the scope of this study effort. The remaining Washington and Yuma County W-beam short radius guardrail systems were compared to determine which system was more likely to perform acceptably and would be a better candidate for larger radii. Both systems had a top mounting height of 27 in. (686 mm), and both systems had an approximately 10:1 flare along the primary side of the system. The guardrail to stiff bridge transition was tested and determined to be satisfactory for both systems, and both utilized an upstream two-cable anchoring system on the secondary roadway side. However, the Washington W-beam short radius system was only tested with sedan and small car vehicles, whereas the Yuma County short radius guardrail system was tested with a 5,400-lb (2,449-kg) pickup truck. The pickup truck impact is more comparable with TL-2 test
80 conditions presented in NCHRP Report No. 350 than the NCHRP Report No. 230 sedan impact. Because crash testing was not within the scope of this research project, and because simulated impacts were planned using a pickup truck computer simulation model, the Yuma County system was better-suited for validation of a baseline system and system modifications, and would likely lead to better prediction of system performance with radii as large as 70 ft (21 m). Furthermore, TTI conducted a study evaluating the performance of the Yuma County system, and researchers determined that the system would likely have passed NCHRP Report No. 350 TL-2 impact conditions [27]. Without a system approved at TL-3 impact conditions to either NCHRP Report No. 350 or MASH, researchers determined that the Yuma County short radius system that was approved under TL-2 impact conditions was the most desirable. Therefore, the Yuma County short radius guardrail system was selected for further consideration and modeling with LS-DYNA [28]. The drawings provided in the original Yuma County short radius guardrail analysis report are shown in Figures 41 through 43. System photographs are shown in Figure 44. An excellent drawing set with some modifications to the original PL-1 Yuma County system can be found in Appendix A. 66
81 67 March 31, 2014 Figure 41. Construction Drawings, Yuma County Short Radius Guardrail System [6]
82 68 March 31, 2014 Figure 42. Cable Anchor and Foundation Details, Yuma County Short Radius Guardrail System [6]
83 Figure 43. End Terminal Details, Yuma County Short Radius Guardrail System [6] 69

84 Figure 44. Developmental System Photographs, Test Nos. YC-1 through YC-3 [6] 70
85 4 BASELINE SIMULATIONS MODEL COMPOSITION 71 March 31, 2014 Baseline models of the Yuma County short-radius system were modeled using LS- DYNA. Based on the literature review, angled impacts into the midpoint of the radius were historically the most strenuous impact conditions. Two angled impacts into the midpoint of the radius using pickup trucks were modeled: test nos. YC-3 and YC-4. The baseline models were used to create validated initial models, which could be extended to larger-radius systems. 4.1 Summary of System Components and Computer Simulation Models The Yuma County short radius guardrail system that was crash tested in test no. YC-3 consisted of three sub-systems: (1) Upstream Anchor: one upstream-end terminal system consisting of one 12-ft 6-in. (3,810-mm) section of W-beam guardrail, one cable anchor assembly including two spliced anchor cables, two BCT posts and soil foundation tubes with two ⅝-in. (16- mm) diameter post bolts, nuts, and washers, and one end buffer piece to attenuate the severity of secondary-side head-on crashes. (2) Radius: one 12 ft 6 in. (3,810 mm) section of W-beam rail with a radius of 8 ft (2.4 m), and four 6 in. x 8 in. x 72 in. (152 mm x 203 mm x 1,829 mm) CRT posts with two ⅝-in. (16-mm) diameter post bolts, nuts, and washers. Two CRT posts were installed behind the radius and were freestanding. (3) Downstream Transition to Stiff Bridge Rail: 18 ft 9 in. (5,715 mm) of straight W- beam guardrail, consisting of 6-ft 3-in. (1,905-mm) and 12-ft 6-in. (3,810-mm) sections of W-beam guardrail. Two 6-in. x 8-in. x 72 in. (152 mm x 203 mm x 1,829-mm) timber posts with 6 in. x 8 in. x 14¼ in. (152 mm x 203 mm x 362 mm) blockouts, one 8 in. x 8 in. x 72 in. (203 mm x 203 mm x 1,829 mm) intermediate transition post with a 6 in. x 8 in. x 14¼ in. (152 mm x 203 mm x 362 mm) blockout and two 10 in. x 10 in.
86 72 March 31, 2014 x 78 in. (254 mm x 254 mm x 1,981 mm) transition posts with 6 in. x 8 in. x 14¼ in. (152 mm x 203 mm x 362 mm) blockouts supported the rail. An MC8x22.8 by 10 ft 5 in. long (MC203x33.9 by 3,175 mm long) C-channel rail stiffener was used to conjoin the downstream 3 posts in the system, and the rail was attached to the posts with ⅝-in. (16-mm) diameter post bolts, nuts, and washers. 4.2 Modifications for Additional Simulations The additional baseline model of test no. YC-4 was similar to the simulation of test no. YC-3, except for the addition of one straight 12-ft 6-in. (3,810-mm) section of W-beam guardrail between the end anchorage and upstream end of the radius. This additional section of W-beam was supported by 6 in. x 8 in. (152 mm x 203 mm) CRT posts. An additional simulation of a modified system similar to the system in test no. YC-4 was also conducted. The W-beam guardrail was raised to a top mounting height of 31 in. (787 mm) and an MGS end anchorage with groundline strut was substituted for the two-cable, spliced end anchorage. This system was not tested, and was used as a control example to determine what effect that raising guardrail height would have on system performance. 4.3 Previously Validated Models of System Components Models of several Yuma County short-radius system components were used from previous research efforts involving simulations of guardrail systems, including soil and foundation tubes, the guardrail, splices, and post bolts, nuts, and washers [e.g., 25]. In addition, an anchor cable model suitable for use in MGS and BCT cable anchors had been developed previously and were considered validated [25, 29]. BCT posts at the end anchorages utilized 6 in. x 8 in. x 72 in. (152 mm x 203 mm x 1,829 mm) soil foundation tubes. The soil tubes were modeled with shell elements with 0.70-in. (18- mm) long diagonals, and in. (1.5-mm) thickness. The BCT bearing plate was modeled

87 with rigid brick elements. Post-to-rail attachment bolts were modeled using shell elements for the round head, to improve post-to-rail contacts, and solid elements for the shanks, washers, and nuts. The components of the bolts were rigid and tied together. The use of a rigid material model was justified by examining previous testing conducted at MwRSF, which indicated that very little, if any, damage occurred to the bolts during impacts. Additionally, when blockouts were used, blockouts did not separate from the posts and either fractured or rotated around the bolt shanks, as shown in Figure 45. Figure 45. Fractured CRT Posts without Bolt Damage [14] W-beam guardrail was modeled with 12-gauge (2.6-mm thick) shell elements. Most of rail was modeled with 0.82-in. (21-mm) diagonal, rectangular shell elements. A finer mesh with 0.24-in. (6.0-mm) element diagonals was used around the post-to-rail attachment slots to improve attachment contacts and local rail deformation. Rail splices have been modeled as overlapping sections of W-beam guardrail using elements with merged nodes [e.g., 9, 25]. By overlapping elements, the splices had an approximately two-times increase in both tensile strength and bending stiffness. Crack propagation and rail slippage at splices were not modeled in these simulations. 73
88 4.4 Components Validated for Use in Model Wood CRT Posts Baseline Models Computer simulation models of 6 in. x 8 in. x 72 in. (152 mm x 203 mm x 1,829 mm) CRT posts used in the study were generated and compared to physical test data. Two material models were selected to represent the CRT post, based on previous testing and modeling of wood posts [25]. These post models were compared to 90-degree (strong-axis), 45-degree, and 0- degree (weak-axis) impacts of CRT posts in rigid foundation tubes from previous research [23]. Post models were simulated using LS-DYNA. The two material models consisted of an isotropic plastic-kinematic model (MAT_13), and a piecewise linear plasticity model (MAT_24). Material parameters in metric units are summarized in Table 16. Impact conditions of the CRT post simulations are shown in Figure 46, and time-sequential images of 0-degree (strong-axis) and 90-degree (weak-axis), MAT_13 simulations and tests in metric units are shown in Figures 53 and 54, respectively. Acceleration data was filtered using a CFC60 filter and analyzed to estimate post impact forces for both simulations and physical tests, in accordance with the Society of Automotive Engineers (SAE) J211 [31]. Force and energy versus displacement plots are shown in Figures 47 through 52. A comparison of the peak forces and energies at 8 in. (203 mm) of deflection for the simulations and bogie tests is shown in Table 17. Table 16. Summary of Material Parameters Used in CRT Posts Material Isotropic Elastic Failure (MAT_13) Piecewise Linear Plasticity (MAT_24) Young s Modulus (GPa) Density (kg/mm 3 ) Poison s Ratio Yield Stress (MPa) Tangent Modulus (GPa) Effective Plastic Strain at Failure (10-7 ) (10-7 )

89 Figure 46. LS-DYNA Models of CRT Posts in Rigid Sleeves, 90, 45, and 0-Degree Orientations 75
90 Energy (kj) MNCRT-1 MNCRT-2 MNCRT-3 MAT_13 Model MAT_24 Model 30 Force (kn) Deflection (mm) Figure 47. Force vs. Deflection, CRT Post at 90 deg in Rigid Sleeve, Models and Bogie Tests MNCRT-1 MNCRT-2 MNCRT-3 MAT_13 Model MAT_24 Model Deflection (mm) Figure 48. Energy vs. Deflection, CRT Post at 90 deg in Rigid Sleeve, Models and Bogie Tests 76
91 Energy (kj) MNCRT-4 MNCRT-5 MNCRT-6 MAT_13 Model MAT_24 Model Force (kn) Deflection (mm) Figure 49., Force vs. Deflection, CRT Post at 45 deg in Rigid Sleeve, Models and Bogie Tests MNCRT-4 MNCRT-5 MNCRT-6 MAT_13 Model MAT_24 Model Deflection (mm) Figure 50. Energy vs. Deflection, CRT Post at 45 deg in Rigid Sleeve, Models and Bogie Tests 77
92 Energy (kj) March 31, MNCRT-7 MNCRT-8 MNCRT-9 MAT_13 Model MAT_24 Model 40 Force (kn) Deflection (mm) Figure 51. Force vs. Deflection, CRT Post at 0 deg in Rigid Sleeve, Models and Bogie Tests MNCRT-7 MNCRT-8 MNCRT-9 MAT_13 Model MAT_24 Model Deflection (mm) Figure 52. Energy vs. Deflection, CRT Post at 0 deg in Rigid Sleeve, Models and Bogie Tests 78

 0.018 sec 0.")


93 0.000 sec sec sec sec Crack initiated (front side) Crack initiated (back side) sec sec Tension side of CRT hole ruptured Crack initiated (front side) sec sec Complete rupture Complete rupture Figure 53. Time-Sequential Images, Simulation and Test No. MNCRT-2 79


94 0.000 sec sec sec sec Crack initiated (front side) Crack initiated (back side) sec sec Widespread delamination, splitting, cracking Complete rupture sec sec Near-complete rupture Post rebounds off of impact head Figure 54. Time-Sequential Images, Simulation and Test No. MNCRT-4 80
95 Table 17. Comparison of Results, Tests and Simulations Observation Average Peak Force 90-Degree 45-Degree 0-Degree Energy through 8 in. (203 mm) of Deflection Average Peak Force Energy through 8 in. (203 mm) of Deflection Average Peak Force Energy through 8 in. (203 mm) of Deflection kip kn kip-in. kj kip kn kip-in. kj kip kn kip-in. kj Physical Tests MAT_ MAT_ The strong-axis force versus deflection and energy-absorption versus deflection curves for the simulated CRT posts were comparable to the physical tests. The physical test data demonstrated a wide scatter in wood strengths, and average maximum peak forces calculated from bogie acceleration data in 90-degree, 45-degree, and 0-degree post orientations were 10.3 kip, 8.9 kip, and 9.1 kip (45.7, 39.4, and 40.3 kn), respectively. In general, the modeled posts were weaker when impacted perpendicular to the weak axis than the wood posts in the physical tests. Simulated posts dissipated less energy through 8 in. (203 mm) of deflection, and had lower peak forces than posts in the physical tests. Simulated posts also generally fractured before posts in the physical test in weak-axis impacts. However, when impacted in 90-degree or 45-degree impacts, peak forces, average forces, and energy levels through 8 in. (203 mm) deflection closely matched test data averages. Most posts which deflected and fractured during short-radius impact simulations were loaded with angles between 90 and 0 degrees. The MAT_13 material model was determined to be better-suited for estimating both peak loads and energy than the MAT_24 model, and was selected for further investigation. An automatic general contact type was utilized for post-to-impact head contacts. Additional simulations using an automatic single surface contact type provided identical results. However, after the post fractured and elements near the CRT holes eroded, the upper piece of the 81
96 Force (kn) March 31, 2014 post rotated backwards and dropped downward, causing elements on the back sides of the upper and lower posts to overlap without developing contact forces. An eroding single surface contact type was substituted for the single-surface and general contact types previously used, to allow contact forces to develop between the upper and lower faces of the fractured posts. The force versus deflection curve for one of the orientations is shown in Figure 55. The contact force curves for the two contact types were nearly indistinguishable for all impact orientations, despite visual differences in the post fracture, as shown in Figure 56. In addition, the eroding single surface contact type increased complexity and processing time by approximately 15%. Simulations of the full-scale crash test using the eroding single surface contact definition terminated due to numerical errors associated with the eroding single surface contact. Thus, researchers utilized automatic single surface contacts for the remaining full-scale impact simulations MNCRT-1 MNCRT-2 MNCRT-3 General/Auto Single Surface Contact Eroding Single Surface Contact Displacement (mm) Figure 55. Comparison of Force vs. Deflection of CRT Post in 90-Degree Orientation, General/Automatic Single Surface and Eroding Single Surface Contact Types 82
.")

97 (a) (b) Figure 56. Comparison between (a) General/Automatic Single Surface and (b) Eroding Single Surface Contact Types at Same Instant in Time Mesh Sensitivity A fine mesh was initially used to model the CRT post. Brick elements had typical edge lengths of 0.50-in. (12.7 mm). A more feasible mesh size of the posts utilized brick elements with 1.00-in. (25.4-mm) edge lengths. The posts were modeled with both mesh sizes and the results were compared. The post with a coarser mesh was determined to be 2% stronger than the finer mesh during strong-axis impacts and 7% weaker during weak-axis impacts. However, the coarse mesh post dissipated more energy during strong and weak-axis impacts than the fine mesh post. 83
98 Post Calibration through Dimensional Variation March 31, 2014 Maximum impact loads during weak-axis impacts were lower than the average peak force and energy dissipation calculated from physical testing. Researchers proposed an idea to evaluate the performance of the posts using a surrogate post size to significantly increase the weak-axis impact strength without adversely affecting the strong-axis post strength by linearly scaling the width of the post. Weak axis dimensions were increased by 10%, 20%, 30%, and 40%, with resulting widths of 6.6 in., 7.2 in., 7.8 in., and 8.4 in. (168 mm, 183 mm, 198 mm, and 213 mm). The surrogate post models were simulated and compared to the results of both the 0.5-in. and 1- in. (13-mm and 25-mm) post meshes. Models of the meshes are shown in Figure 57. Results of the simulations are shown in Figures 58 through 63. Figure 57. Post Size Comparison, (a) Fine, (b) Coarse, and (c) Surrogate Meshes 84
99 Energy (kip-in.) March 31, 2014 Force (kip) MNCRT-1 MNCRT-2 MNCRT-3 Baseline Fine Mesh Baseline Coarse Mesh 10% Wider 20% Wider 30% Wider 40% Wider Deflection (in.) Figure 58. Force vs. Deflection, 90-Degree Impact, Tests and Surrogate Models MNCRT-1 MNCRT-2 MNCRT-3 Baseline Fine Mesh Baseline Coarse Mesh 10% Wider 20% Wider 30% Wider 40% Wider Deflection (in.) Figure 59. Energy vs. Deflection, 90-Degree Impact, Tests and Surrogate Models 85
100 20 Force (kip) Energy (kip-in.) MNCRT-4 MNCRT-5 MNCRT-6 Baseline Fine Mesh Baseline Coarse Mesh 10% Wider 20% Wider 30% Wider 40% Wider Deflection (in.) Figure 60. Force vs. Deflection, 45-Degree Impact, Tests and Surrogate Models MNCRT-4 MNCRT-5 MNCRT-6 Baseline Fine Mesh Baseline Coarse Mesh 10% Wider 20% Wider 30% Wider 40% Wider Deflection (in.) Figure 61. Energy vs. Deflection, 45-Degree Impact, Tests and Surrogate Models 86
101 Energy (kip-in.) March 31, Force (kip) MNCRT-7 MNCRT-8 MNCRT-9 Baseline Fine Mesh Baseline Coarse Mesh 10% Wider 20% Wider 30% Wider 40% Wider Deflection (in.) Figure 62. Force vs. Deflection, 0-Degree Impact, Tests and Surrogate Models MNCRT-7 MNCRT-8 MNCRT-9 Baseline Fine Mesh Baseline Coarse Mesh 10% Wider 20% Wider 30% Wider 40% Wider Deflection (in.) Figure 63. Energy vs. Deflection, 0-Degree Impact, Tests and Surrogate Models 87
102 88 March 31, 2014 Based on the results of the surrogate model evaluation, it was determined that the optimal post shape utilized a 15% increase in weak-axis width. This selection was estimated to represent the upper bound of post strengths in the strong-axis direction, above-average strength in a 45- degree direction, and below average strength in the weak-axis direction. Although the post model was overly-strong in strong-axis impacts when placed in a rigid soil foundation tube, a subsequent evaluation evaluating the post interaction with the soil was determined to be representative of test data, as discussed in Section A separate orthotropic material model, MAT_22, was also selected for evaluation. Unfortunately, the model was unstable and failed to run to completion in any impact direction simulation. After the simulated vehicle struck the post with the orthotropic material, the post vibrated rapidly and experienced significant hourglassing. The primary purpose of the research project was to evaluate short radius modifications and not to develop a new post material model, so researchers abandoned the orthotropic material model and MAT_13 was used for the remainder of the project Post-and-Soil Interaction Modeling Post-and-soil interactions have frequently been modeled using rigid soil rotation tubes and non-linear translational spring elements in the lateral and longitudinal directions at MwRSF. Although a more representative modeled interaction is desirable, this practice has been used extensively and has been validated in previous studies [25]. Recent component tests consisting of 6-in. x 8-in. x 72-in. (152-mm x 203-mm x 1,829- mm) CRT posts embedded in coarse crushed limestone soil were conducted at the University of Nebraska-Lincoln [23]. A similar CRT study using posts also installed in highly compacted, coarse crushed limestone to simulate stronger soil conditions was conducted to compare soil strength test results [24]. Results of the two test series were compared to the simulation results
103 Energy (kip-in.) March 31, 2014 using the surrogate CRT mode with 15% wider section, and are shown in Figures 64 through 67. Note that the simulated post did not fracture during the strong-axis impact UBSPB-1 (Heavily Compacted) UBSPB-2 (Heavily Compacted) UBSP-14 (Lightly Compacted) Simulation 10 Force (kip) Deflection (in.) Figure 64. Strong-Axis Impact Bogie Acceleration Force vs. Displacement, Tests and Simulation UBSPB-1 (Heavily Compacted) UBSPB-2 (Heavily Compacted) UBSP-15 (Lightly Compacted) Simulation Deflection (in.) Figure 65. Strong-Axis Impact Bogie Energy vs. Displacement, Test and Simulation 89
104 Energy (kip-in.) March 31, UBSPB-3 (Heavily Compacted) UBSPB-4 (Heavily Compacted) UBSP-17 (Lightly Compacted) Simulation 8 Force (kip) Deflection (in.) Figure 66. Weak-Axis Impact Bogie Acceleration Force vs. Displacement, Tests and Simulation UBSPB-3 (Heavily Compacted) UBSPB-4 (Heavily Compacted) UBSP-17 (Lightly Compacted) Simulation Deflection (in.) Figure 67. Weak-Axis Impact Bogie Acceleration Force vs. Displacement, Tests and Simulation The simulated CRT post in soil model had below-average inertial peak force, but the sustained soil rotation was representative of an average between strongly- and weaklycompacted soil strengths for deflections greater than 6 in. (152 mm). Despite the wide force 90
105 range exhibited by the posts in soil, the simulated force sustained during rotation through the soil was within the range of soil strengths observable from the physical tests. Therefore, the model of 15% wider posts in soil was determined to be an acceptable approximation for use in a shortradius guardrail simulation. 4.5 Components Without Validation Some components did not have comparable physical test data with which to compare the simulation models. Examples of these components included the 8 in. x 8 in. x 72 in. (203 mm x 203 mm x 1,829 mm) solid timber post and the 10 in. x 10 in. x 78 in. (254 mm x 254 mm x 1,981 mm) solid timber posts. There may be differences in physical test fracture forces, deflections, and energies that are not represented using the current wood post material model. Since there were no additional data to calibrate these pot models, the MAT_013 timber material model and nominal post dimensions were not modified. The fracture zone of the timber posts was identical to that used for the CRT posts. Other components without physical test data with which to compare simulation results to include the MC8x22.8 (MC203x33.9) rail stiffener. The stiffener was a standard section with flange and web, so the section was plotted using computer-aided drafting (CAD) and the midsurface of the structural section was extracted. That midsection was meshed with shell elements and the material applied to the section was consistent with ASTM A36 steel. Lastly, a short section of concrete bridge parapet was used to anchor the approach guardrail transition in the full-scale crash test. However, the vehicle never struck the bridge rail, and the furthest-downstream 10 in. x 10 in. (254 mm x 254 mm) transition post did not deflect in test nos. YC-3 or YC-4. As a result, the effect of the bridge rail in these tests was solely to maintain tension at the end of the W-beam rail. Therefore, the end of the W-beam transition to bridge rail was rigidly fixed. 91
106 The buffer section on the upstream end of the rail was utilized in the test, but did not contribute to the structural rigidity or deflection of the system. Thus, the buffer section was neglected in all short-radius guardrail models. 4.6 Details and Construction of Full-Scale Crash Models Three models of the Yuma County short radius guardrail system were created. One model of the system was intended to replicate the system design and impact conditions of test no. YC-3, as shown in Figures 68 and 69. The second model was used to simulate test no. YC-4; for this model, an additional 12 ft 6 in. (3,810 mm) section of W-beam guardrail with two non-blocked CRT posts was included between the end anchor and the start of the radius, and is discussed in Section The third model raised the guardrail mounting height used in the simulation of test no. YC-4 to 31 in. (787 mm). The system utilized MGS CRT post models in lieu of standard CRT post models, and substituted a standard ground-line strut-and-yoke assembly in place of the spliced, two-cable end anchor model utilized in simulations of test nos. YC-3 and YC Test No. YC-3 The model of test no. YC-3 is shown in Figures 68 and 69. Based on available drawings of the approximate impact point of the vehicle in test no. YC-3, the left side of the vehicle was aligned with the center point of post no. 3, as shown in Figure 68. To be consistent with the system construction, the model was comprised of three distinct sub models: (1) the anchorage system; (2) the radius; and (3) the transition. The three sections are discussed in greater detail in following sections. 92


107 Secondary Roadway Primary Roadway Figure 68. Model of Crash Test No. YC-3 with Post Numbers Shown 93


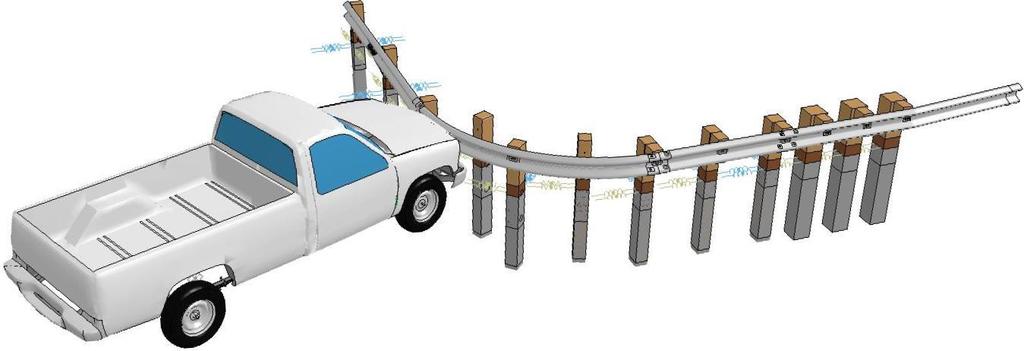
108 Figure 69. Model of Crash Test No. YC-3 94
 top mounting heights set in rigid foundation tubes, similar to the MGS BCT posts described in Reference 25.")
109 End Anchorage The end anchorage model used in the simulation of test no. YC-3 is shown in Figure 70. The end anchorage system was comprised of two BCT posts with 28-in. (711-mm) top mounting heights set in rigid foundation tubes, similar to the MGS BCT posts described in Reference 25. Pairs of soil springs were attached at the top of the soil tube in each of the front, back, left, and right directions to simulate the soil forces and moments to improve estimates of small permanent deflections. Post bolts attaching the rail to the posts were not tensioned, and were modeled using three parts: a rigid, solid-element shank and nut; a rigid, solid-element washer; and a rigid, shellelement bolt head. Shell elements were used on the bolt head to improve contact with the rail. The W-beam was modeled with shell elements with a 12-gauge (2.6-mm) thickness, and used a relatively coarse mesh for the majority of the rail, and a fine mesh around slots and bolt holes as previously described. The cable anchor bracket which was attached to the W-beam, both swaged cable end terminations, and the nuts and associated washers attached to those swaged end fittings were comprised of rigid, solid elements. The spliced BCT cables were comprised of beam elements, as previously described, with an approximated splice location 6 in. (152 mm) above ground level. The spliced section of the cable was modeled with duplicate beam elements. Figure 70. Model of Modified BCT End Anchorage, Model of Test No. YC-3 95

110 Radius The model of the radius section is shown in Figure 71. The radius was comprised of four CRT posts, two of which were attached to the rail, and two of which were freestanding behind the system. Posts were placed in soil tubes using the soil spring approximation method. Each CRT post was partitioned into three sections: a non-fracturing portion of the post located below ground; the fracture region, extending from 5.25 in. (133 mm) above ground to 20.5 in. (520 mm) below ground; and a non-fracturing portion above ground that connected to the rail. All three sections utilized the *MAT_13 material previously validated. Only the fracture region utilized failure criteria, which permitted fracture via element erosion. Post-to-rail connections were identical to those used in the anchorage system. Figure 71. Model of Radius, Model of Test No. YC-3 (Fracture Region Highlighted) 96
111 Transition to Stiff Bridge Rail The modeled transition to stiff bridge rail is shown in Figure 72. The transition to stiff bridge rail was modeled with two 6 in. x 8 in. x 72 in. (152 mm x 203 mm x 1,829 mm) solid element posts, one 8 in. x 8 in. x 72 in. (203 mm x 203 mm x 1,829 mm) solid element post, and three 10 in. x 10 in. x 78 in. (254 mm x 254 mm x 1,981 mm) solid element posts. Each of the transition section posts was modeled with a solid element, 6 in. x 8 in. x 14¼ in. (152 mm x 203 mm x 362 mm), blockout. It was estimated that the fracture region of these posts was similar to the fracture region of the CRT posts. Elements above and below the fracture region were not defined with element erosion criteria for two reasons: typically, these regions sustain little to no damage; and compressive stresses beyond plastic strain limits in LS-DYNA can cause element erosion which is non-physical. Each solid element post was placed in a soil foundation tube and attached to soil approximation springs. Since neither the 8-in. x 8-in. (203-mm x 203-mm) or 10-in. x 10-in. (254-mm x 254-mm) posts had strong or weak axes, soil springs were prescribed with the same force-deflection curve in all directions. The soil spring force curves for the 8-in. (203-mm) square post were identical to the weak-axis CRT force curve, and the 10-in. (254-mm) square post used a modified CRT weak-axis force curve scaled using two equations: ( ) ( ) Post-to-rail attachments were similar to the end anchorage and CRT posts, but were lengthened to accommodate the blockouts. A 10:1 was applied to the rail downstream of the last timber post. An MC8x22.8 (MC203x33.9) stiffening channel was modeled between the rail and blockouts extending between the end of the W-beam guardrail to the midspan between the 10-in. 97
, respectively. Figure 72. Transition Section, Model of Test No. YC-3 4.6.1.")


112 (254-mm) and 8-in. (203-mm) square posts. Flange and web thickness were 0.50 in. (12.7 mm) and in. (10.80 mm), respectively. Figure 72. Transition Section, Model of Test No. YC Model Assembly The models of the end anchor, radius, and transition to stiff bridge rail were fastened together by merging nodes of the ends of each rail section. Splices were modeled by duplicating elements near the splice locations and merging the nodes of those duplicated elements. In this way, the stiffness of the rail was approximately increased by a factor of 2, rather than a factor of 4 that would occur if the thickness of the splice was doubled. The tensile stiffness of the rail 98
113 99 March 31, 2014 would also be approximated using this method. Because there were no observations of W-beam tearing in the Yuma County short-radius guardrail test report [6], no element erosion criteria were applied to the models of the rail Modifications for Simulation of Test No. YC-4 The system in test no. YC-4 was nearly identical to the system in test no. YC-3. The only change to the system was the lengthening of the system upstream of the radius by adding an additional 12 ft 6 in. (3,810 mm) long section of W-beam and two additional 6 in. x 8 in. x 72 in. (152 mm x 203 mm x 1,829 mm) CRT posts adjacent to the upstream modified BCT end anchorage. The posts, rail, rail slots and splice holes, soil tubes, soil springs, and post bolts were modeled similarly to the components of the radius, except that the rail was straight instead of curved. The model of the system tested in test no. YC-4 is shown in Figure 73. The model of the truck in the simulation of test no. YC-4 was identical to the model in the simulation of test no. YC Modifications for Simulation of 31-in. (787-mm) Tall System In order to gauge the effectiveness of a 31-in. (787-mm) tall guardrail installation on the performance of the Yuma County short radius guardrail system, the height of the Yuma County system was raised 4 in. (102 mm) to a top guardrail mounting height of 31 in. (787 mm), as shown in Figure 74. To accommodate the increased rail height and decreased post embedment depth, 4 in. (102 mm) was removed from the bottom of the CRT, BCT, and transition posts, and added to the upper portions of the posts. The holes were therefore shifted downward on the posts by 4 in. (102 mm) to become MGS CRT and MGS BCT posts. Transition post nos. 7 through 9 were lengthened from 72 in. (1,829 mm) to 76 in. (1,930 mm), and post nos. 10 through 12 were lengthened from 78 in. (1,981 mm) to 82 in. (2,083 mm) such that the embedment depth of the transition posts was not changed with increased rail height. In addition to modifying the posts, an
![MGS BCT end anchorage [25] was included on the upstream end of the system in lieu of the two-cable modified BCT end](/docs-images/84/90846852/images/114-1.jpg "anchorage. Secondary Roadway Primary Roadway Figure 73. Model of System in Test No.")
114 MGS BCT end anchorage [25] was included on the upstream end of the system in lieu of the two-cable modified BCT end anchorage. Secondary Roadway Primary Roadway Figure 73. Model of System in Test No. YC-4 with Post Numbers Shown 100
 Tall, Modified System Derived from Details of Test No.")
115 Secondary Roadway Primary Roadway Figure 74. Model of 31-in. (787-mm) Tall, Modified System Derived from Details of Test No. YC-4 with Post Numbers Shown 101
116 4.7 Vehicle Models The vehicles used in test nos. YC-3 and YC-4 were 1984 Ford pickup trucks weighing approximately 5,380 lb (2,440 kg). A Chevrolet C2500 vehicle model [30] was modified for use simulating test nos. YC-3 and YC-4, as well as the 31-in. (787-mm) tall, modified YC-4 system. Modifications included refining the mesh of almost all major components and replacing the suspension system, including tires, with a more detailed model. A total of 991 lb (450 kg) was added to the vehicle, distributed between components including the frame, engine, engine supports, and suspension, and a node at the center-of-gravity (CG). The modified vehicle model weighed approximately 5,401 lb (2,450 kg). The 21-lb (9.5-kg) difference in truck mass only differed from the actual mass by 0.4%. The additional mass and energy was not believed to have a significant effect on initial system deflection or performance. The modified vehicle and a 1984 Ford Pickup truck similar to the test vehicle are shown in Figure Modeling Difficulties As full-scale models of the Yuma county system tests were simulated, a number of numerical problems were observed which warranted further consideration. Frequently, the shell element edge boundaries of the W-beam penetrated between the nodes of the solid element blockouts and posts, as well as the guardrail post bolts. Examples of these penetrations are shown in Figures 76 and 77. The mesh penetrations led to both model instabilities and unrealistic results. When the shell elements of the mesh penetrated through the mesh of the guardrail post bolts, the exterior nodes of the bolts which were in contact definitions with the rail subsequently snag on the rail. As a result, the rail could not release from the post bolt after penetration, forcing the post to track the trajectory of the rail after impact, and weighing down on the deformed rail. Likewise, when the rail penetrated into the solid element faces of the post, the rail snagged on the outer nodes of 102


117 Figure 75. Ballasted 2500 Model and Example 1984 Ford Pickup Similar to Test Vehicle [32] 103


118 Figure 76. Shell Element Edge Penetration Behind Bolt Head Figure 77. Shell Edge Penetration between Solid Elements of Posts 104

119 the blockouts and posts, which were not prescribed with element erosion criteria. The snagging applied forces to the interior of the post mesh and restricted post release from the rail. Two approaches were used to solve these problems. The solid and shell elements of the post bolts and post bolt heads, respectively, were lined with beam elements along the axis of the bolt. A null material was prescribed to the beam elements, with a contact thickness of in. (0.2 mm), to prevent both excess mass and a larger contact surface from altering the results. Because shell elements typically have better contact interaction with beam elements than with solids, this interaction prevented edge of the rail from penetrating into the bolts. The beam element wrap method is shown in Figure 78. Figure 78. Beam Element Wrap around Bolt Head and Shank To prevent the W-beam rail from penetrating into the solid element posts and blockouts, contact tolerances and contact penalty forces were increased, and the top and bottom rail edges 105
120 were shifted to a node-to-surface contact type with the posts and blockouts. As a result, the rail penetration into the solid elements was mostly eliminated. The length of the stiffening C-channel was observed to strongly affect simulation outcome during the simulation of test no. YC-4. Based on system construction drawings, it was unclear where the end of the stiffening C-channel was located, with respect to the stiffness transition. Two simulations were conducted to investigate what effect, if any, the location of the end of the stiffening channel had on vehicle capture or redirection: at the midspan between post nos. 9 and 10, or at post no. 10. When the C-channel extended to the midspan between post nos. 9 and 10, the vehicle was captured. But when the C-channel was terminated at post no. 10, the rail twisted after post no. 9 fractured and allowed the truck to vault over the rail. Therefore it was believed, based on C-channel length and simulation results, that the stiffening C-channel used in test nos. YC-3 and YC-4 extended to the midspan between post nos. 9 and 10. A time-sequential comparison of the vaulting and capture events is shown in Figure
 (b) Figure 79.")
121 March 31, sec sec sec sec sec sec sec sec (a) (b) Figure 79. Effect of Stiffening C-Channel Length (a) Channel Terminates at Post (b) Channel Terminates at Midspan 107
122 5 SIMULATION OF YUMA COUNTY SHORT RADIUS GUARDARIL SYSTEM 5.1 Test No. YC-3 Simulation and Full-Scale Test The simulated truck impacted the model of the system in test no. YC-3 at 45 mph (72 km/h) and with an orientation of 20 degrees relative to the roadway, and 25.5 degrees relative to the flared guardrail system. Time-sequential images of the impact are shown in Figures 80 through 83. A comparison summary of the test and simulation post fracture times, corresponding encompassing the onset of cracking, crack propagation, and complete fracture, is shown in Table 18. Because post fracture times were not known from test sequentials, and the original crash test videos were not available, the fracture window for posts in the crash test had very low precision. It was uncertain based on the results of the test report [6] and subsequent examination by TTI [27] how the spliced anchor cable released from post no. 2 in test no. YC-3. In the test, the load transmitted from the rail through the BCT cable caused the end post (post no. 1) to fracture due to an eccentric twisting load. However, this phenomenon was not easily modeled in LS- DYNA. BCT model instabilities contributed to models terminating prematurely. In other models, the truck vaulted the system when post no. 1 did not fracture and the W-beam remained attached to both end posts. Subsequent modifications including weakening the cable connection to post no. 2 did not prevent these problems, because the tensile load in the secondary BCT cable was very low. Instead of fracturing the end BCT post, the truck was brought to a controlled stop in contact with the system. Since test no. YC-3 was only used to assist in the validation of the system for larger radii, and the simulation and full-scale test were similar until loads were transmitted to the unusual spliced-cable anchor, further improvements to the model were not pursued. 108


123 Secondary Pre-Impact Primary Pre-Impact 45 ms 45 ms 135 ms 135 ms 195 ms 195 ms Figure 80. Time-Sequential Photographs, Simulation of Test No. YC-3 109


124 280 ms 280 ms 400 ms 400 ms 525 ms 525 ms 675 ms 675 ms Figure 81. Time-Sequential Photographs, Simulation of Test No. YC-3 110


125 0 ms 0 ms 45 ms 45 ms 125 ms 125 ms 195 ms 195 ms Figure 82. Time-Sequential Photographs, Simulation of Test No. YC-3 111


126 280 ms 280 ms 400 ms 400 ms 525 ms 525 ms 675 ms 675 ms Figure 83. Time-Sequential Photographs, Simulation of Test No. YC-3 112

127 113 March 31, 2014 Figure 84. Time-Sequential Photographs of Test No. YC-3 [6]

128 Figure 85. Time-Sequential Photographs of Test No. YC-3 [6] 114
129 Table 18. Comparison of Post Fracture Times, Simulation and Test No. YC-3 Post No. Fracture Time Range (ms) Test Simulation 1 Unknown Did Not Fracture * Did Not Fracture F F * post out of view; fracture time estimated March 31, 2014 After the simulated pickup truck impacted the system, the top corrugation of the rail initially crushed and flattened around the front bumper. At approximately 10 ms after impact, the truck impacted post no. 4, deflecting it backward slightly at ground level and fracturing the post. The simulated vehicle continued forward and yawed counter-clockwise. Post no. 2 cracked at approximately 165 ms, and the post remained attached to the rail after it completely fractured at 175 ms. A plastic hinge formed in the rail at the end of the stiffening channel at post no. 8 at approximately 420 ms. However, because post no. 1 did not fracture the vehicle yawed with the front end toward the upstream anchor, and subsequent impact between the right-rear tires and the stiffness transition brought the vehicle to a complete stop. The flattened top corrugation remained engaged the top of the bumper throughout impact as the rail crushed the bumper upward and inward. Despite the low precision of the post fracture times in the test, nearly every simulated post fractured within the indicated range identified corresponding to post fracture in the test. Overall correlation of the fracture times was acceptable, which suggested that post no. 1 fractured relatively late in the impact event, probably between and sec. However, in 115
130 the simulation, post no. 8 did not fracture, although fracture occurred in the test. This may be due to a combination of factors, including a slight variation in the vehicle s impact location in the simulation compared to the test, the simplified cable connection to the BCT soil foundation tube at post no. 2, below-average wood quality for the 10 in. x 10 in. (254 mm x 254 mm) post, or differences in the test vehicle such as pitch, roll, and yaw moments of inertia, which could have promoted increased loading downstream of the transition to stiff bridge rail sufficient to induce fracture of post no. 8. Nonetheless, the model appeared to perform acceptably through 310 ms, and was considered conditionally validated based on similar post fracture times, comparison of truck trajectories, and rail deformations in sequential photographs. 5.2 Test No. YC-4 Simulation and Full-Scale Test The model of test no. YC-4 was nearly identical to the model of test no. YC-3, except that an additional 12 ft 6 in. (3,810-mm) long section of W-beam and two additional 6 in. x 8 in. x 72 in. (152 mm x 203 mm x 1,829-mm) CRT were included upstream of the curved radius section. The impacting vehicle and impact location were the same as those used in the model of test no. YC-3. Time-sequential photographs of the crash are shown in Figures 86 through 89. A summary table of approximate post fracture times identified in the test and simulation is shown in Table 19. System and vehicle damage results were judged similar for the test and simulation. Post nos. 1, 2, and 10 did not fracture in either the simulation or the physical test, and most post crack initiations and complete fractures in the model were within the correct time intervals identified in the full-scale test from sequential photographs. As with test no. YC-3, film and photography from the test was limited, which reduced the precision of post fracture timing. 116


131 Secondary Primary 0 ms 0 ms 70 ms 70 ms 190 ms 190 ms 280 ms 280 ms Figure 86. Time-Sequential Images, Simulation of Test No. YC-4 117


132 430 ms 430 ms 550 ms 550 ms 640 ms 640 ms 950 ms 950 ms Figure 87. Time-Sequential Images, Simulation of Test No. YC-4 118


133 0 ms 0 ms 70 ms 70 ms 190 ms 190 ms 280 ms 280 ms Figure 88. Time-Sequential Images, Simulation of Test No. YC-4 119


134 430 ms 430 ms 550 ms 550 ms 640 ms 640 ms 950 ms 950 ms Figure 89. Time-Sequential Images, Simulation of Test No. YC-4 120

135 121 March 31, 2014 Figure 90. Time-Sequential Photographs of Test No. YC-4 [6]
136 Table 19. Comparison of Post Fracture Times, Test No. YC-4 and Simulation Post No. Fracture Time (ms) Test (range) Simulation 1 Did not fracture Did not fracture 2 Did not fracture Did not fracture Did not fracture Did not fracture F F March 31, 2014 The stopping distance of the truck in the test was 12 ft (3.7 m) measured between the approximate impact location and the final vehicle CG location, as shown in Figure 91. The stopping distance of the truck in the simulation, measured from the initial impact point to the final CG position of the vehicle at 1.0 sec, was ft (3.95 m). The final position of the pickup truck model was approximately 7% further downstream (measured parallel to the primary roadway) than the test vehicle. Measurement to vehicle final position in the test is sometimes subjective, and may incorporate significant unstated error. During the test, after reaching a maximum deflection, the truck rebounded and translated backward away from the rail. During the simulation, the tail slap into the transition arrested vehicle motion, and it did not rebound longitudinally. Thus, the maximum deflection of the truck may be very similar to the deflection observed in the simulation, since system damage, rail damage, and final deflected rail geometry were similar. 122

 Photograph [6] (c)")
137 (a) (b) (c) Figure 91. Final Vehicle Position after Crash (a) Reported [6] (b) Photograph [6] (c) Simulation 123
138 Unfortunately, more rigorous methods for evaluating the accuracy of the simulation in test no. YC-4 were not available. General similarities in system damage, stopping location, deformed system geometry, and vehicle crush damage indicated that the model of test no. YC-4 was considered representative of the full-scale crash test. 5.3 Modified 31-in. Yuma County System Simulation The 31-in. (787-mm) tall short-radius guardrail system, which was a modified version of the model of the system in test no. YC-4, was simulated with an identical impact point test nos. YC-3 and YC-4. As previously stated, the modified BCT terminal with two spliced anchor cables was removed and replaced with an MGS end anchorage, the rail height was increased, and typical BCT posts were replaced with MGS BCT posts [13]. Sequential photographs of the simulation are shown in Figures 92 through 95. It was observed that initial bumper height and bumper-to-rail interactions were critical for this simulation; thus, the front bumper was colored red in the time-sequential photographs to distinguish the bumper from the guardrail. At approximately 260 ms after impact, the guardrail engaged the radiator and grill, and became interlocked when the fenders crushed inward. Following rail engagement with the grill and fender, the vehicle was safely and smoothly brought to a controlled stop. This contrasted with the unstable interaction observed in the simulation of test no. YC-4, in which only the top rail corrugation interacted with the test vehicle. At maximum deflection, the guardrail was engaged with the right-front wheel, and may not have captured a similar vehicle with slightly more initial kinetic energy at impact. Unlike other systems with the rail mounted at 27 in. (686 mm), the short-radius system mounted at 31 in. (787 mm) was resistant to vaulting because the bumper restricted the rail from dropping. After impact, the bottom corrugation of the rail was crushed and the rail slid upward to 124


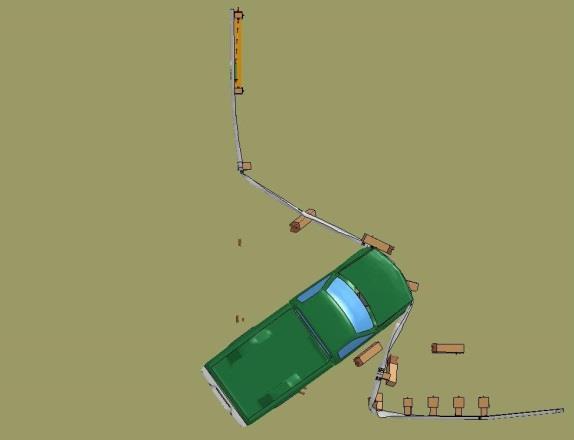


139 Secondary Primary 0 ms 0 ms 100 ms 100 ms 280 ms 280 ms 370 ms 370 ms Figure 92. Time-Sequential Photographs, 31-in. (787-mm) Modification to Test No. YC-4 125


 Modification")
140 490 ms 490 ms 700 ms 700 ms 980 ms 980 ms Figure 93. Time-Sequential Photographs, 31-in. (787-mm) Modification to Test No. YC-4 126

 Modification to")
141 0 ms 100 ms 280 ms Figure 94. Time-Sequential Photographs, 31-in. (787-mm) Modification to Test No. YC-4 127


142 430 ms 520 ms 700 ms Figure 95. Time-Sequential Photographs, 31-in. (787-mm) Modification to Test No. YC-4 128
143 129 March 31, 2014 engage the headlight, grill, radiator, and hood locations. Subsequent downward forces on the rail did not cause the rail to slide below the front bumper. The 31-in. (787-mm) tall, modified Yuma County short-radius guardrail system performed as well as or better than the 27-in. (686-mm) tall Yuma County short-radius guardrail system when subjected to a 5,401-lb (2,450-kg) pickup truck at 45 mph (72 km/h) and 25.5 degrees (which included the flare from the bridge rail). Although post debris did accumulate in front of and around the vehicle during capture, the vehicle did not vault nor show the propensity to vault during the simulation. The vehicle was brought to a controlled stop with no occupant compartment penetrations nor excessive ridedown decelerations or OIV values. Despite the excellent performance of the modified Yuma County short radius system with a 31-in. (787-mm) mounting height, the taller system has not been tested with a small car to assess underride performance. Short-radius guardrail systems have consistently demonstrated critical instability when impacted with small cars and pickup trucks. Full-scale crash test failures included small car underrides and pickup truck overrides. Although the simulated 31-in. (787- mm) tall system reduced the propensity for pickup truck overrides, there is significant concern that the system would fail to safely capture a small car. No full-scale tests have been conducted on a W-beam short-radius guardrail system with a top mounting height of 31 in. (787 mm). 5.4 Discussion The Yuma County short radius model was validated by comparing simulation results to very limited test data. Despite the low precision for the few available metrics, system damage, stopping location, and limited photographic evidence were compared to simulation data. The simulations of test nos. YC-3 and YC-4 were determined to be representative of the full-scale crash tests conducted on the Yuma County short radius guardrail system through 310 ms for the system in test no. YC-3, because post no. 1 did not fracture, and throughout the event for the
144 system in test no. YC-4. A third simulation evaluating the performance of the system raised to a top mounting height of 31 in. (787 mm) was also evaluated, although no physical test data was available to assess the accuracy of the simulation. The 31-in. (787-mm) tall guardrail system appeared to capture the impacting truck in a more stable and reliable manner than was observed when the system had a 27-in. (686-mm) mounting height. However, it is not recommended that the Yuma County short radius guardrail system be constructed with a top mounting height of 31 in. (787 mm) without full-scale crash testing using a small car to assess underride potential. The 27-in. (686-mm) mounting height guardrail system was determined to be at the lower limit of stability for vehicle redirection. The rail remained engaged with the bumper throughout the impact event in the simulation of test no. YC-4, but the interaction was unstable. The system, as tested, could potentially perform differently with a lighter truck, if impacted in accordance with NCHRP Report No
145 131 March 31, SYSTEM DETAILS FOR SIMULATED LARGER-RADII SYSTEMS The Wisconsin Department of Transportation (DOT) requested simulations of shortradius guardrail systems with radii as large as 70 ft (21 m). Only curved sections of guardrail encompassing 90-degree intersections were considered. The radius was terminated on the upstream and downstream ends at post locations to simplify rail bend requirements. These two factors discretized the number of guardrail-and-radius combinations to be simulated, based on discrete 6 ft 3 in. (1,905 mm) post spans. Three larger radii were selected for study: 23 ft 10½ in. (7,277 mm), 47 ft 9 in. (14,554 mm), and 71 ft 7½ in. (21,831 mm), corresponding to 6, 12, and 18 CRT posts installed along the radius, respectively. For simplicity, the radii are rounded to the nearest foot (0.3 m), and are heretofore referenced as 24-ft (7.3-m), 48-ft (15-m), and 72-ft (22-m) radii, respectively. Each model contained one end anchorage system, one transition to stiff bridge rail, and one curved guardrail section. Schematic drawings of the Yuma County short radius system and three larger-radius systems simulated are shown in Figure 96. Finite element models of the systems are shown in Figures 97 through 99. Two system heights were initially considered: a 27-in. (686-mm) tall guardrail top mounting height, similar to the system tested in Yuma County short-radius guardrail test nos. YC-1 through YC-7; and a 31-in. (787-mm) tall system based on the modified test no. YC-4 simulation. Because the 27-in. (686-mm) tall system demonstrated a propensity for override, a taller system was believed to reduce the risk of override and would be useful for investigating the performance limit of the system when override and vaulting did not occur. Free-standing CRT posts placed behind the nose of the radius were eliminated for all increased-radius designs. Multiple posts were engaged to the curved radius rail for every increased-radius system considered. Any free-standing CRT posts utilized on these larger radii, if
146 Figure 96. Schematic Drawings of Short Radius Simulation Models 132

147 Secondary Roadway Primary Roadway Figure 97. Simulation Model with Post Numbers, 24-ft (7.3-m) Radius 133
")
148 Secondary Roadway Primary Roadway Figure 98. Simulation Model with Post Numbers, 48-ft (15-m) Radius 134
")
149 Secondary Roadway Primary Roadway Figure 99. Simulation Model with Post Numbers, 72-ft (22-m) Radius 135
150 136 March 31, 2014 placed at the midspans between posts, could nearly double the required number of CRT posts for a single short-radius system installation, which would be both costly and difficult. These posts could also contribute to additional debris and adversely affect vehicle stability. In addition, the freestanding CRT posts were removed from recommended system details by researchers at TTI [27] based on component testing energy levels and estimated increased truck deflections. Critical system elements, such as CRT post sizes and spacing, were not altered. The transition section also remained unchanged because it had already demonstrated crashworthy performance during impacts similar to TL-2 transition tests. Post locations, post-to-rail connections, rail shape and material parameters, and impact locations were identical for 27-in. (686-mm) and 31-in. (787-mm) tall short radius system variations of each radius size. The additional mass that was added to the C2500 model was removed, such that the weight of the vehicle was approximately 4,409 lb (2,000 kg). For the 31-in. (787-mm) tall system, MGS CRT posts were utilized in lieu of standard CRT posts. MGS CRT posts are similar to standard CRTs, with the exception that the embedment depth is reduced by 4 in. (102 mm), the height of the top of the post was increased to 32 in. (813 mm), and the two CRT holes were shifted downward 4 in. (102 mm) such that the center of the top hole was still located at the ground line [13]. Standard 27-in. (686-mm) tall W-beam end anchorages and MGS end anchorages were used for all 27-in. (686-mm) and 31-in. (787-mm) tall simulations, respectively, in lieu of the two-cable system tested during Yuma County short-radius guardrail test nos. YC-1 through YC- 7. The two-cable system simulated in the model of test no. YC-4 performed similarly to the strut and yoke assembly in the 31-in. (787-mm) top mounting height, modified YC-4 system simulation. Researchers at TTI similarly recommended substitution of the two-cable end anchorage assembly for a single-cable anchorage with a channel strut [27]. The MGS end
151 anchorage was similar to the strut-and-yoke system utilized on the 27-in. (787-mm) tall W-beam end anchorage, except that the rail height was increased, the BCT cable anchor cable was shifted to accommodate the increased distance between the cable anchor bracket and the rail, and MGS BCT posts were substituted for standard BCT posts. MGS BCT posts were similar to standard BCT posts, except that the embedment depth in the soil foundation tubes was decreased by 4 in. (102 mm), the top of the post was mounted at approximately 32 in. (813 mm), and the BCT hole was shifted downward by 4 in. (102 mm) such that it was at the same elevation as a BCT post used with the 27-in. (686-mm) tall system. For all simulations, NCHRP Report No. 350 TL-2 impact conditions were selected to evaluate the rail propensity for override. Specifically, each simulation involved a pickup truck model impacting at 45 mph (72 km/h) and 25 degrees relative to the roadway, respectively. These impact conditions were selected based on the difficulty of passing this particular test scenario historically. Of the 23 tests conducted with impact angles greater than or equal to 15 degrees on shortradius systems with NCHRP Report No. 230 or 350 or MASH impact conditions, ten tests, or 43% of impacts, passed evaluation criteria. Three of the passing tests, or 30%, were considered marginal. By eliminating angled impacts near the stiff bridge rail transitions, only six of 19 tests, or 32%, passed evaluation criteria, and half of those tests were considered marginal. In contrast, five of nine tests conducted with angles less than 15 degrees, or 56%, successfully passed evaluation criteria. These low-angle tests included three failed thrie beam short-radius tests conducted at MwRSF, and the only successful NCHRP Report No. 350 TL-3 thrie beam short radius test conducted to date [12-14]. 137
152 7 NUMERICAL SIMULATIONS OF SYSTEMS WITH 24-FT (7.3-M) RADII Impacts with the 27-in. (686-mm) and 31-in. (787-mm) short radius guardrail systems with 24-ft (7.3-m) radii were simulated by aligning the centerline of the truck with the third, fourth, fifth, sixth, and seventh posts, in addition to the midspans between the third and fourth, fourth and fifth, fifth and sixth, sixth and seventh, and seventh and eighth posts, respectively. Post numbers are shown in Figure 97. Results of the simulations are evaluated in Chapter Systems with 27-in. (686-mm) Top Mounting Height The 27-in. (686-mm) tall, 24-ft (7.3-m) radius short radius system was simulated using a 4,409-lb (2,000-kg) pickup truck impacting at 45 mph (72 km/h) and 25 degrees, relative to a tangent line to the bridge rail. Because results with standard CRT posts indicated unacceptable performance of the curved guardrail system, 8-in. (203-mm) timber blockouts were added to the posts in an attempt to maintain the rail height after impact Systems without Blockouts Attached to Radius Posts The pickup truck vaulted the system at every impact location selected with a 27-in. (686- mm) mounting height, when blockouts were not utilized. Typically, three or four posts fractured near impact before the rail slid below the bumper and the vehicle vaulted over the rail. The vehicle s bumper impacted and flattened the top corrugation of the guardrail, which permitted the bottom corrugation to twist below the bumper and engage the wheels. Rail twist was increased by a prolonged attachment between the posts and rail after post fracture, which tended to twist the top of the rail backward and away from impact and accentuating bottom rail corrugation deflection below the bumper. Results of the simulations are shown in Figures 100 through


 Tall, 24-ft")


153 Secondary Primary Impact at Post No. 3 Impact at Midspan between Post Nos. 3 and 4 Impact at Post No. 4 Impact at Midspan between Post Nos. 4 and 5 Figure 100. Images of Impacts with 27-in. (686-mm) Tall, 24-ft (7.3-m) Radius Systems without Blockouts Attached to Posts on Radius 139


 Tall, 24-ft")


154 Secondary Primary Impact at Post No. 5 Impact at Midspan between Post Nos. 5 and 6 Impact at Post No. 6 Impact at Midspan between Post Nos. 6 and 7 Figure 101. Images of Impacts with 27-in. (686-mm) Tall, 24-ft (7.3-m) Radius Systems without Blockouts Attached to Posts on Radius 140
 Radius Systems without Blockouts Attached to Posts on Radius Although it was expected that some of the impact locations would contribute to failure due to vaulting, the")

![Previous research indicated blockouts may retain the rail at the impact height [33]. Also, posts with blockouts released more quickly from the guardrail than non-blocked posts. 7.](/docs-images/84/90846852/images/155-3.jpg "1.2 Systems with Blockouts Attached to Radius Posts The 24-ft (7.3-m) radius system was modified by adding 8-in.")
155 Secondary Primary Impact at Post No. 7 Impact at Midspan between Post Nos. 7 and 8 Figure 102. Images of Impacts with 27-in. (686-mm) Tall, 24-ft (7.3-m) Radius Systems without Blockouts Attached to Posts on Radius Although it was expected that some of the impact locations would contribute to failure due to vaulting, the number of overrides and the low system damage prior to vaulting was concerning. It was determined that reduction in rail height due to post deflection and twisting may be mitigated, in part, by adding blockouts to the CRT posts. Previous research indicated blockouts may retain the rail at the impact height [33]. Also, posts with blockouts released more quickly from the guardrail than non-blocked posts Systems with Blockouts Attached to Radius Posts The 24-ft (7.3-m) radius system was modified by adding 8-in. (203-mm) timber blockouts to the front sides of each post along the radius. The posts were shifted backward to maintain the same rail attachment locations. Summary images of the performance are shown in Figures 103 and


 Tall,")
 Radius")

156 Secondary Primary Impact at Post No. 3 Impact at Post No. 4 Impact at Post No. 5 Impact at Post No. 6 Figure 103. Images of Impacts with 27-in. (686-mm) Tall, 24-ft (7.3-m) Radius Systems with Blockouts Attached to Radius Posts 142
 Radius Systems with Blockouts Attached to Radius Posts Results were improved over the non-blocked system, but only one impact condition resulted in acceptable vehicle capture.")

157 Secondary Primary Impact at Post No. 7 Figure 104. Images of Impacts with 27-in. (686-mm) Tall, 24-ft (7.3-m) Radius Systems with Blockouts Attached to Radius Posts Results were improved over the non-blocked system, but only one impact condition resulted in acceptable vehicle capture. Five to seven posts were fractured prior to vaulting at each impact location. As with the simulation of the unblocked system, sustained post attachment to the rail and tire interaction with post debris contributed to vaulting, in addition to the rail flattening and sliding below the bumper without engaging the grill, radiator, or headlights. 7.2 Systems with 31-in. (787-mm) Top Mounting Height Impacts at 45 mph (72 km/h) The 31-in. (787-mm) tall barriers captured the pickups for each impact at or downstream of post no. 6, as shown in Figures 104 through 106. If one BCT post fractured during impact, simulation analysis was terminated because the end anchorage model was no longer considered validated, even if it appeared likely that the pickup would be captured. Four of the ten simulations acceptably captured the pickup. The major difference contributed by the taller system was that, after engaging the bumper, the rail slid upward and became interlocked with the headlight location, grill, and radiator. This interlock improved vehicle stability and reduced the vaulting tendency, even when the truck interacted with debris. The truck was captured at each impact location downstream of post no. 6 at NCHRP Report No. 350 TL-2 impact conditions. 143


158 Secondary Primary Impact at Post No. 3 Impact at Midspan between Post Nos. 3 and 4 Impact at Post No. 4 Impact at Midspan between Post Nos. 4 and 5 Figure 105. Images of Impacts with 31-in. (787-mm) Tall, 24-ft (7.3-m) Radius Systems at 45 mph (72 km/h) 144


159 Secondary Primary Impact at Post No. 5 Impact at Midspan between Post Nos. 5 and 6 Impact at Post No. 6 Impact at Midspan between Post Nos. 6 and 7 Figure 106. Images of Impacts with 31-in. (787-mm) Tall, 24-ft (7.3-m) Radius Systems at 45 mph (72 km/h) 145
 Tall, 24-ft (7.3-m) Radius Systems at 45 mph (72 km/h) 7.2.2 Impacts at 50 mph (80 km/h) Based on the successful performance of the 31-in.")


160 Secondary Primary Impact at Post No. 7 Impact at Midspan between Post Nos. 7 and 8 Figure 107. Images of Impacts with 31-in. (787-mm) Tall, 24-ft (7.3-m) Radius Systems at 45 mph (72 km/h) Impacts at 50 mph (80 km/h) Based on the successful performance of the 31-in. (787-mm) tall short radius system at TL-2 impact conditions, impacts at each post location were simulated again with a 50-mph (80 km/h) impact speed to determine the maximum capacity of the system. Summary images of the performance are shown in Figure 108. Each impact simulated between post nos. 4 and 7 resulted in the simulated vehicle gating through the system. Simulation data analysis, including evaluation of accelerations and forces, was terminated in each simulation after the downstream BCT post fractured. As stated, an MGS end anchorage was adapted to simulate the performance of the curved guardrail end anchorage. The model of the MGS end anchorage system has not been validated when an impact resulted in fracture of one BCT post, but the BCT cable remained engaged with the upstream BCT post. 146


")
")


161 Secondary Primary Impact at Post No. 3 Impact at Post No. 4 Impact at Post No. 5 Impact at Post No. 6 Figure 108. Images of Impacts with 31-in. (787-mm) Tall, 24-ft (7.3-m) Radius Systems at 50 mph (80 km/h) 147
162 148 March 31, 2014 It is possible that additional straight segments of W-beam guardrail with MGS CRT posts installed on the secondary side of the system at upstream end of the radius could result in some impact locations with acceptable capture. Additional posts on the secondary side of the roadway could be investigated in a subsequent simulation or full-scale crash testing study. 7.3 Discussion The short-radius guardrail system with 24-ft (7.3-m) radius and 27-in. (686-mm) top rail height did not perform similarly to the Yuma County system. Whereas a 25-degree impact on the nose of the Yuma Co. system was determined to be acceptable and satisfactorily captured the vehicle, impacts into the larger radius resulted in unacceptable vaulting and penetration. By adding blockouts, rail performance improved and the pickup truck was captured in one simulation, but vaulting still occurred during impact at four other post locations. Increasing the top rail mounting height from 27 in. (686 mm) to 31 in. (787 mm) resulted in acceptable capture of the simulated vehicle at or downstream from post no. 6. There was no tendency to vault observed in any simulation with a top rail mounting height of 31 in. (787 mm). The taller mounting height was also associated with increased deflections and lower vehicle accelerations, which may contribute to pocketing for impacts near the transition, and may increase the extent of system repairs required after an impact. The system has not been evaluated using passenger cars, which was outside of the scope of the current study. There is some concern that a passenger car could underride or experience roof or windshield crush after impact with the guardrail mounted with a top height of 31 in. (787 mm). Nonetheless, the 31-in. (787-mm) top mounting height significantly improved rail interlock with the impacting truck. The maximum capacity of the system was exceeded for impacts occurring at 50 mph (80 km/h), resulting in vehicle penetration behind the rail. Thus, the system capacity is limited to 45 mph (72 km/h) impacts.
163 8 NUMERICAL SIMULATIONS OF SYSTEMS WITH 48-FT (15-M) RADII Impacts with the 27-in. (686-mm) and 31-in. (787-mm) short radius guardrail systems with 48-ft (15-m) radii were simulated by aligning the centerline of the truck with the third, fourth, fifth, sixth, seventh, eighth, ninth, tenth, eleventh, twelfth, and thirteenth posts. Post numbers are shown in Figure 98. Results of the simulations are evaluated in Chapter Systems with 27-in. Top Mounting Height The 27-in. (686-mm) tall, 48-ft (15-m) radius short radius system was simulated according to TL-2 impact using a 4,409-lb (2,000-kg) pickup truck impacting at 45 mph (72 km/h) and 25 degrees, relative to a tangent line to the bridge rail. After initial results with standard CRT posts indicated unacceptable performance of the curved guardrail system, 8-in. (203-mm) timber blockouts were added to the posts in an attempt to maintain the rail height after impact Systems Without Blockouts Attached to Radius Posts The pickup truck vaulted the system at every impact location selected with a 27-in. (686- mm) mounting height, when blockouts were not utilized, as shown in Figures 109 through 111. Typically, four posts were fractured during impact before the vehicle overrode the guardrail. The best system performance occurred upstream of the center of the radius, where dynamic deflection was the largest before the vaulting occurred. Fractured post debris, posts which remained attached to the rail, flattening of the top corrugation of the W-beam, and rail twist contributed to vaulting. 149


164 Secondary Primary Impact at Post No. 3 Impact at Post No. 4 Impact at Post No. 5 Impact at Post No. 6 Figure 109. Images of Impacts with 27-in. (686-mm) Tall, 48-ft (15-m) Radius Systems without Blockouts Attached to Posts on Radius 150


 Tall, 48-ft")


165 Secondary Primary Impact at Post No. 7 Impact at Post No. 8 Impact at Post No. 9 Impact at Post No. 10 Figure 110. Images of Impacts with 27-in. (686-mm) Tall, 48-ft (15-m) Radius Systems without Blockouts Attached to Posts on Radius 151

 Radius Systems without Blockouts Attached to Posts on Radius 8.1.")
 radius, blockouts were added to the CRT posts to retain the rail height after impact and")
166 Secondary Primary Impact at Post No. 11 Impact at Post No. 12 Impact at Post No. 13 Figure 111. Images of Impacts with 27-in. (686-mm) Tall, 48-ft (15-m) Radius Systems without Blockouts Attached to Posts on Radius Systems with Blockouts Attached to Radius Posts Similar to the results of the 24-ft (7.3-m) radius, blockouts were added to the CRT posts to retain the rail height after impact and facilitate quicker post release from the rail after fracture. Simulations of the 27-in. (686-mm) tall, 48-ft (15-m) radius guardrail system with 8-in. (203- mm) blockouts are shown in Figures 112 through


")


167 Secondary Primary Impact at Post No. 3 Impact at Post No. 4 Impact at Post No. 5 Impact at Post No. 6 Figure 112. Images of Impacts with 27-in. (686-mm) Tall, 48-ft (15-m) Radius Systems with Blockouts Attached to Radius Posts 153


 Tall,")


168 Secondary Primary Impact at Post No. 7 Impact at Post No. 8 Impact at Post No. 9 Impact at Post No. 10 Figure 113. Images of Impacts with 27-in. (686-mm) Tall, 48-ft (15-m) Radius Systems with Blockouts Attached to Radius Posts 154

 Tall, 48-ft (15-m) Radius Systems")


169 Secondary Primary Impact at Post No. 11 Impact at Post No. 12 Impact at Post No. 13 Figure 114. Images of Impacts with 27-in. (686-mm) Tall, 48-ft (15-m) Radius Systems with Blockouts Attached to Radius Posts The system performance improved after blockouts were added. Five of the eight simulated impacts at post locations occurring downstream of post no. 5 resulted in capture. Impacts at post nos. 8, 9, and 10, which spanned between the centerpoint of the radius to two posts downstream, resulted in override and vaulting. 155
170 8.2 Systems with 31-in. (787-mm) Top Mounting Height Impacts at 45 mph (72 km/h) Results of the simulations are shown in Figures 115 through 117. Each impact downstream of post no. 6 resulted in vehicle capture, and impacts at or upstream from post no 6 resulted in at least one BCT post fracture and could result in gating during a crash. After engaging the bumper, the rail flattened and slid upward and became interlocked with the headlight, grill, and radiator locations. This interlock improved vehicle stability and reduced the tendency to vault, even when the truck interacted with post debris. Between 8 and 12 posts fractured during each impact within the radius. The truck was captured upstream of post no. 13, and no impacts resulted in redirection Impacts at 50 mph (80 km/h) The 31-in. (787-mm) tall short radius system was also simulated at a higher impact speed of 50 mph (80 km/h) based on the successful performance of the system at 45 mph (72 km/h). Summary images of the performance are shown in Figures 118 through 120. At least one BCT post fractured for each simulated impact location upstream of post no. 8. The vehicle was captured at and downstream from post no. 8. By the end of the simulations, a minimum of 10 posts fractured for each impact location between post nos. 7 and 11, and as many as 15 posts may fracture before vehicles come to a complete stop. The vehicle was not redirected at any impact location; each simulated impact resulted in either gating or capture. 156


")

171 Secondary Primary Impact at Post No. 3 Impact at Post No. 4 Impact at Post No. 5 Impact at Post No. 6 Figure 115. Images of Impacts with 31-in. (787-mm) Tall, 48-ft (15-m) Radius Systems at 45 mph (72 km/h) 157


")
 Radius")
")
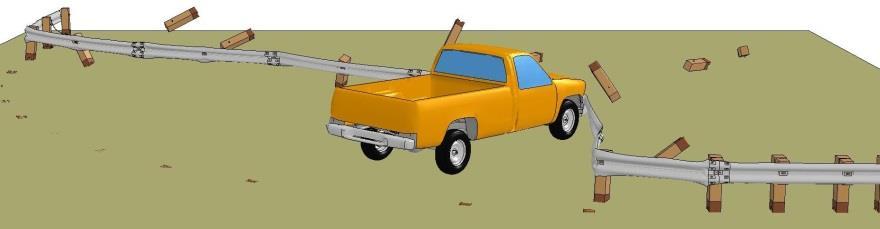
172 Secondary Primary Impact at Post No. 7 Impact at Post No. 8 Impact at Post No. 9 Impact at Post No. 10 Figure 116. Images of Impacts with 31-in. (787-mm) Tall, 48-ft (15-m) Radius Systems at 45 mph (72 km/h) 158


 Tall, 48-ft")
 159")
173 Secondary Primary Impact at Post No. 11 Impact at Post No. 12 Impact at Post No. 13 Figure 117. Images of Impacts with 31-in. (787-mm) Tall, 48-ft (15-m) Radius Systems at 45 mph (72 km/h) 159


")
 Radius")
")
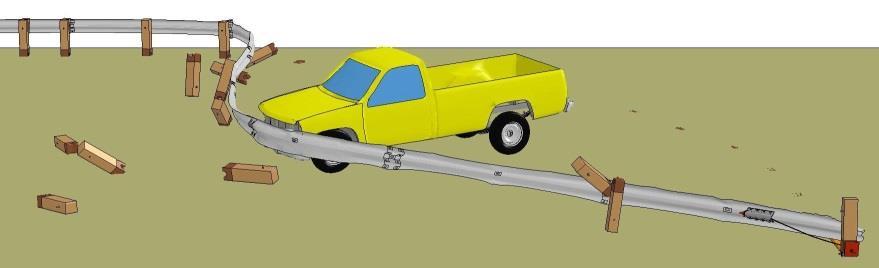
174 Secondary Primary Impact at Post No. 3 Impact at Post No. 4 Impact at Post No. 5 Impact at Post No. 6 Figure 118. Images of Impacts with 31-in. (787-mm) Tall, 48-ft (15-m) Radius Systems at 50 mph (80 km/h) 160


")
 Radius")
")
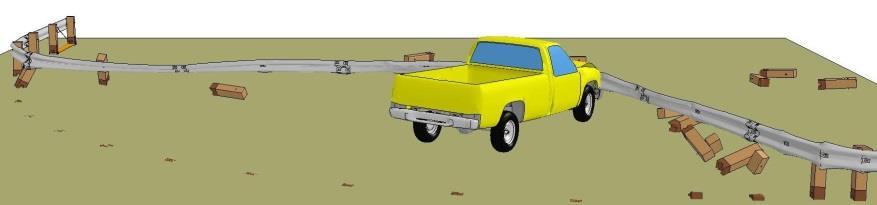
175 Secondary Primary Impact at Post No. 7 Impact at Post No. 8 Impact at Post No. 9 Impact at Post No. 10 Figure 119. Images of Impacts with 31-in. (787-mm) Tall, 48-ft (15-m) Radius Systems at 50 mph (80 km/h) 161

 Tall, 48-ft (15-m) Radius Systems at 50 mph")


 tall curved-guardrail resulted in vehicle")

176 Secondary Primary Impact at Post No. 11 Impact at Post No. 12 Impact at Post No. 13 Figure 120. Images of Impacts with 31-in. (787-mm) Tall, 48-ft (15-m) Radius Systems at 50 mph (80 km/h) 8.3 Discussion Higher guardrail installation heights contributed to improved capture and a reduced vaulting propensity for impacts with 2000P pickup truck vehicles. No simulations involving nonblocked 27-in. (686-mm) tall curved-guardrail resulted in vehicle capture or redirection, whereas five simulations of 27-in. (686-mm) tall systems with blockouts conducted at 45 mph (72 km/h) and 25 degrees captured the simulated vehicle. In comparison, nine of the 11 simulations 162
177 conducted at 45 mph (72 km/h) and 25 degrees into a non-blocked, 31-in. (787-mm) tall system successfully captured or redirected the vehicle, and the remaining two simulations involved the end terminal gating to allow the vehicle to pass by. Increased rail heights improved rail engagement with the bumper and decreased rail twisting tendencies which promoted vaulting at lower guardrail heights. Vaulting and override times recorded for each impact indicated that impacts near the centerpoint of the radius demonstrated the greatest instability. Impacts at post no. 10 resulted in vaulting at 82 and 135 ms for 27-in. (686-mm) tall systems without and with blockouts, respectively. Between post nos. 8 and 10, the duration of rail engagement with the bumper was less than 300 ms for systems with blockouts, and less than 130 ms for systems without blockouts. These impact locations may be critical to the performance of this system. Passenger car impacts were not within the scope of the current study. Passenger cars may experience underride or roof or windshield crush after impact with the guardrail with a top height of 31 in. (787 mm). Additional simulations and full-scale testing may be necessary to determine the underride propensity. Nonetheless the 31-in. (787-mm) tall guardrail system adequately captured the pickup truck for most impacts occurring at 45 mph (72 km/h), and all impacts at or downstream from post no. 8. To capture the vehicle upstream from post no. 8, additional straight sections of guardrail to the upstream end of the radius between the end anchor and the end of the radius may be beneficial. If additional anchoring capacity is required, two end anchorages could be used: one at the upstream end of the radius and another anchorage installed upstream of the radius, with additional straight W-beam guardrail installed between the anchors. 163
178 164 March 31, NUMERICAL SIMULATIONS OF SYSTEMS WITH 72-FT (22-M) RADII Impacts with the 27-in. (686-mm) and 31-in. (787-mm) short radius guardrail systems with 72-ft (22-m) radii were simulated by aligning the centerline of the truck with the center of post nos. 4, 5, 7, 9, 11, 13, 15, 17, and 19. Post numbers are shown in Figure 99. Results of the simulations are evaluated in Chapter Systems with 27-in. Top Mounting Height The 27-in. (686-mm) tall short-radius system was simulated according to TL-2 impact using a 4,409-lb (2,000-kg) pickup truck impacting at 45 mph (72 km/h) and 25 degrees, relative to a tangent line to the bridge rail. After results with standard CRT posts indicated unacceptable performance of the short radius, 8-in. (203-mm) timber blockouts were added to the posts in an attempt to maintain the rail height after impact Systems Without Blockouts At most impact locations, the pickup truck model overrode and vaulted the short-radius system, as shown in Figures 121 through 123. The truck was redirected during impact at post no. 19. During impact at post no. 9, which was slightly upstream from impact, the system captured the vehicle and slowed it to a controlled stop. Fractured post debris, posts which remained attached to the rail, and flattening of the upper rail corrugation and rail twisting, and subsequent rail slip below the bumper were the most common contributors to vaulting. Of the three radii simulated, 24, 48, and 72 ft (7.3, 15, and 22 m), posts remaining attached to the rail had the least effect on vehicle capture with the 72 ft (22 m) radius Systems with Blockouts Attached to Radius Posts An effort was made to reduce the risk of override by placing 8-in. (203-mm) blockouts between the posts and guardrail. Simulation results are shown in Figures 124 through 126. Blockouts improved system performance compared to the unblocked system, with four


179 Secondary Primary Impact at Post No. 4 Impact at Post No. 5 Impact at Post No. 7 Impact at Post No. 9 Figure 121. Images of Impacts with 27-in. (686-mm) Tall, 72-ft (22-m) Radius Systems without Blockouts Attached to Posts on Radius 165


180 Secondary Primary Impact at Post No. 11 Impact at Post No. 13 Impact at Post No. 15 Impact at Post No. 17 Figure 122. Images of Impacts with 27-in. (686-mm) Tall, 72-ft (22-m) Radius Systems without Blockouts Attached to Posts on Radius 166


 Tall, 72-ft (22-m) Radius Systems with Blockouts")
181 Secondary Primary Impact at Post No. 19 Figure 123. Images of Impacts with 27-in. (686-mm) Tall, 72-ft (22-m) Radius Systems without Blockouts Attached to Posts on Radius Impact at the Post No. 4 Impact at Post No. 5 Figure 124. Images of Impacts with 27-in. (686-mm) Tall, 72-ft (22-m) Radius Systems with Blockouts Attached to Radius Posts 167


 Tall,")


182 Secondary Primary Impact at Post No. 7 Impact at Post No. 9 Impact at Post No. 11 Impact at Post No. 13 Figure 125. Images of Impacts with 27-in. (686-mm) Tall, 72-ft (22-m) Radius Systems with Blockouts Attached to Radius Posts 168


183 Secondary Primary Impact at Post No. 15 Impact at Post No. 17 Impact at Post No. 19 Figure 126. Images of Impacts with 27-in. (686-mm) Tall, 72-ft (22-m) Radius Systems with Blockouts Attached to Radius Posts simulations resulting in acceptable system capture and one simulation resulting in redirection of the truck near the stiff bridge rail transition. 169
184 9.2 Systems with 31-in. (787-mm) Top Mounting Height Impacts at 45 mph (72 km/h) As observed with the 24-ft (7.3-m) and 48-ft (15-m) radii simulations, the 31-in. (787- mm) tall barriers were better able to capture or redirect the impacting pickup truck model, as shown in Figures 127 through 129. After engaging the bumper, the rail flattened and slid upward and became interlocked with the headlights, grill, and radiator locations. This interlock improved vehicle stability and reduced the tendency to vault, even when the truck interacted with post debris. Impacts downstream of post no. 7 resulted in acceptable vehicle capture or redirection when impacted at 45 mph (72 km/h) and 25 degrees, and impacts at or upstream of post no. 7 allowed the vehicle to gate through the upstream end of the system Impacts at 50 mph (80 km/h) The 31-in. (787-mm) tall short radius system was simulated using a higher impact speed based on the successful performance of the system at 45 mph (72 km/h). Summary images of the performance are shown in Figures 130 and 131. Although the rail generally engaged the bumper at an acceptable height to capture the vehicle and no vaulting tendency was observed, the system either did not have sufficient capacity to redirect an errant vehicle impacting anywhere upstream of post no. 8, or results were inconclusive. Impact at post no. 11 resulted in unexpected fracture of the downstream BCT anchor post. 170


 Tall,")

185 Secondary Primary Impact at the Midspan between Post Nos. 3 and 4 Impact at Post No. 4 Impact at Post No. 5 Impact at Post No. 7 Figure 127. Images of Impacts with 31-in. (787-mm) Tall, 72-ft (22-m) Radius Systems at 45 mph (72 km/h) 171


 Tall, 72-ft")
")
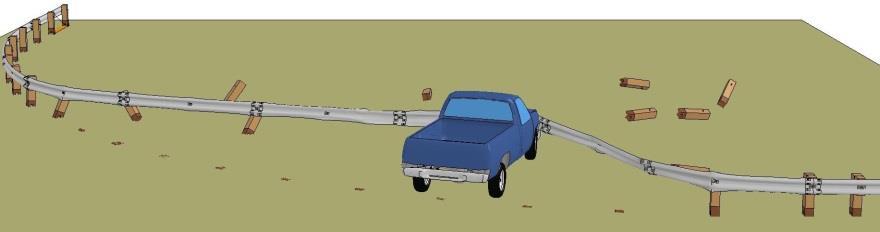
186 Secondary Primary Impact at Post No. 9 Impact at Post No. 11 Impact at Post No. 13 Impact at Post No. 15 Figure 128. Images of Impacts with 31-in. (787-mm) Tall, 72-ft (22-m) Radius Systems at 45 mph (72 km/h) 172

 Tall, 72-ft (22-m) Radius Systems at 45 mph")

187 Secondary Primary Impact at Post No. 17 Impact at Midspan between Post Nos. 7 and 8 Figure 129. Images of Impacts with 31-in. (787-mm) Tall, 72-ft (22-m) Radius Systems at 45 mph (72 km/h) Impact at Post No. 5 Figure 130. Images of Impacts with 31-in. (787-mm) Tall, 72-ft (22-m) Radius Systems at 50 mph (80 km/h) 173


")
 Radius")
")
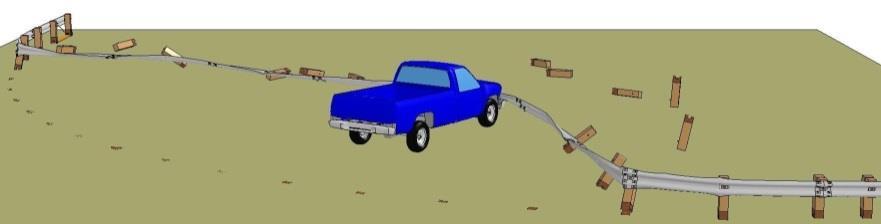
188 Secondary Primary Impact at Post No. 7 Impact at Post No. 9 Impact at Post No. 11 Impact at Post No. 13 Figure 131. Images of Impacts with 31-in. (787-mm) Tall, 72-ft (22-m) Radius Systems at 50 mph (80 km/h) 174


189 Secondary Primary Impact at Post No. 15 Impact at Post No. 17 Impact at Post No. 19 Figure 132. Images of Impacts with 31-in. (787-mm) Tall, 72-ft (22-m) Radius Systems at 50 mph (80 km/h) 9.3 Discussion The 27-in. (686-mm) tall guardrail systems with a 72 ft (22 m) radius, with and without 8-in. (203-mm) timber blockouts, did not contain the impacting vehicle for each impact condition. For impacts at or downstream from post no. 7, or the beginning of the LON, two simulations of systems without blockouts resulted in acceptable capture or redirection of the 175
190 pickup truck, and four simulations with blockouts resulted in acceptable capture or redirection. The average energy dissipated prior to termination of the analysis was 47 percent for the nonblocked system, and 87 percent for the system with blockouts. This corresponded to better rail engagement with the front end of the truck, and was evidence that the blockouts assisted in retaining the rail height after impact. Increasing the top rail mounting height from 27 in. (686 mm) to 31 in. (787 mm) resulted in acceptable capture of the simulated vehicle at or downstream from post no. 7. There was no tendency to vault observed in any simulation with a top rail mounting height of 31 in. (787 mm). However, the system has not been evaluated using passenger cars, which was outside of the scope of the current study. There is some concern that a passenger car could underride or experience roof or windshield crush after impact with the guardrail mounted with a top height of 31 in. (787 mm). Further analysis, including simulation or full-scale crash testing, may be required to confirm or rebut these concerns. Systems with 31-in. (787-mm) top mounting heights approached maximum capacity with 50 mph (80 km/h) impact speeds. Increased impact speeds may be beyond the performance capacity of this system. Additional sections of straight W-beam guardrail which spans between the upstream anchor and the upstream end of the radius may shift the beginning of the LON upstream from the modeled location. With radii as large as 72 ft (22 m), it may be desired to span less than one entire 90- degree radius, either due to oblique intersection between two different roadways or to minimize the exposed area of guardrail installed. In these circumstances, the beginning of the LON should be determined, and a minimum of 8 posts upstream of the beginning of the LON should be used for roadways with speed limits of 45 mph (72 km/h), as shown in Figure 133. Location of the 176
191 Beginning of the LON for Non-Perpendicular Intersections. For roads with speed limits of 50 mph (80 km/h), at least 10 posts should be installed upstream of the beginning of the LON. Figure 133. Location of the Beginning of the LON for Non-Perpendicular Intersections 177
192 10.1 Summary of Results 10 EVALUATION OF SIMULATION RESULTS 178 March 31, 2014 Results of the simulations with radii equal to 24, 48, and 72 ft (7.3, 15, and 22 m) at NCHRP Report No. 350 TL-2 impact conditions were examined in detail. A tabulated summary of pertinent simulation results is shown in Tables 20 through 25. Simulation termination times were determined when the rail was no longer in contact with the bumper (i.e., upon vaulting), when the vehicle came to a stop, or when the termination time was reached. Simulations with 27-in. (686-mm) tall mounting heights frequently resulted in the light truck vaulting over the system. The 27-in. (686-mm) tall, unblocked systems with radii of 24, 48, and 72 m (7.3, 15, and 22 m) captured or redirected the vehicle in 0, 0, and 20 percent of simulations, respectively. The 27-in. (686-mm) tall, blocked systems with radii of 24, 48, and 72 m (7.3, 15, and 22 m) captured or redirected the vehicle in 20, 45, and 40 percent of simulations, respectively. Each impact resulting in vehicle capture progressed through three phases: (1) forces predominantly transferred through membrane tension starting immediately after impact; (2) mixed membrane tension and guardrail pocketing forces; (3) and forces predominantly transferred through guardrail pocketing, as shown in Figure 134. Membrane tension is developed when a feature is impacted or deflected, and surface tension tangential to the face of the guardrail resists the deflection. Membrane tension forces are analogous to the restoring forces applied by bubbles or rubber bands when they are deformed. As a result, membrane tension forces remain relatively constant, regardless of post deflection or disengagement. In contrast, when a pocket is formed in the guardrail in front of a vehicle, rail tension is primarily transferred to adjacent posts, and rail forces are mostly localized. Pockets are associated with large angular deflections of the rail. As a result, rail tension is transmitted to the
193 179 March 31, 2014 Table 20. Simulation Analysis Summary for 24-ft (7.3-m) Radius Systems Impact Location Rail Height (in.) Blockouts? Speed Angle mph (km/h) (deg) Result Analysis End Time (ms) Reason for Terminating Analysis Anchor Posts Fracture Times Posts on Radius Fractured/ Deflected Transition Posts Fractured/ Deflected Speed at End of Analysis mph (km/h) Longitudinal Displacement at End of Analysis ft-in. (mm) Lateral Displacement at End of Analysis ft-in. (mm) Post 3 27 (686) No 45 (72) 25 Fail - override 71 ms Override 75 ms (62) 4 ft-1 in. (1246) 1 ft-7 in. (477) Midspan (686) No 45 (72) 25 Fail - override 75 ms Override 84 ms (63) 4 ft-4 in. (1319) 1 ft-7 in. (492) Post 4 27 (686) No 45 (72) 25 Fail - override 137 ms Override (56) 7 ft-6 in. (2274) 2 ft-10 in. (873) Midspan (686) No 45 (72) 25 Fail - override 91 ms Override (63) 5 ft-2 in. (1585) 1 ft-10 in. (569) Post 5 27 (686) No 45 (72) 25 Fail - override 377 ms Override (41) 17 ft-2 in. (5241) 7 ft-1 in. (2159) Midspan (686) No 45 (72) 25 Fail - override 88 ms Override (64) 5 ft-1 in. (1545) 1 ft-10 in. (569) Post 6 27 (686) No 45 (72) 25 Fail - override 151 ms Override (58) 8 ft-5 in. (2553) 3 ft-1 in. (939) Midspan (686) No 45 (72) 25 Fail - override 113 ms Override (62) 6 ft-5 in. (1946) 2 ft-3 in. (695) Post 7 27 (686) No 45 (72) 25 Fail - override 53 ms Override (66) 3 ft-2 in. (960) 1 ft-2 in. (349) Midspan (686) No 45 (72) 25 Fail - override 77 ms Override (64) 4 ft-6 in. (1367) 1 ft-7 in. (473) Post 3 27 (686) Yes 45 (72) 25 Fail - override 72 ms Override 77 ms (61) 4 ft-1 in. (1242) 1 ft-7 in. (474) Post 4 27 (686) Yes 45 (72) 25 Fail - override 193 ms Override (47) 9 ft-8 in. (2956) 3 ft-8 in. (1119) Post 5 27 (686) Yes 45 (72) 25 Captured 686 ms End of Sim (15) 22 ft-9 in. (6930) 9 ft-8 in. (2953) Post 6 27 (686) Yes 45 (72) 25 Fail - override 181 ms Override (55) 9 ft-7 in. (2932) 3 ft-8 in. (1106) Post 7 27 (686) Yes 45 (72) 25 Fail - override 156 ms Override (54) 8 ft-6 in. (2603) 3 ft-1 in. (949) Post 3 31 (787) No 45 (72) 25 Gated 67 ms Gated 67, 336 ms (61) 3 ft-10 in. (1162) 1 ft-5 in. (437) Midspan (787) No 45 (72) 25 Gated 73 ms Gated 73, 333 ms (62) 4 ft-2 in. (1260) 1 ft-6 in. (468) Post 4 31 (787) No 45 (72) 25 Gated 179 ms Gated 179, 498 ms (52) 9 ft-2 in. (2785) 3 ft-6 in. (1078) Midspan (787) No 45 (72) 25 No Conclusion 178 ms End of Sim 178 ms (56) 9 ft-5 in. (2859) 3 ft-6 in. (1061) Post 5 31 (787) No 45 (72) 25 No Conclusion 385 ms End of Sim 385 ms (42) 17 ft-3 in. (5269) 7 ft-5 in. (2252) Midspan (787) No 45 (72) 25 Captured 619 ms End of Sim (36) 25 ft-10 in. (7871) 11 ft-10 in. (3619) Post 6 31 (787) No 45 (72) 25 Captured 674 ms End of Sim (19) 23 ft-9 in. (7236) 11 ft-0 in. (3362) Midspan (787) No 45 (72) 25 Captured 678 ms End of Sim (20) 23 ft-9 in. (7247) 10 ft-2 in. (3110) Post 7 31 (787) No 45 (72) 25 Captured 650 ms End of Sim (15) 24 ft-0 in. (7306) 10 ft-4 in. (3141) Midspan (787) No 45 (72) 25 Captured 583 ms End of Sim (11) 20 ft-4 in. (6201) 7 ft-9 in. (2371) Post 3 31 (787) No 50 (80) 25 Gated 59 ms Gated 59, 155 ms (69) 3 ft-8 in. (1111) 1 ft-9 in. (525) Post 4 31 (787) No 50 (80) 25 No Conclusion 125 ms End Post Fracture 125 ms (62) 7 ft-3 in. (2215) 3 ft-5 in. (1035) Post 5 31 (787) No 50 (80) 25 Gated 246 ms Gated 246, 318 ms (56) 13 ft-5 in. (4079) 6 ft-6 in. (1972) Post 6 31 (787) No 50 (80) 25 Gated 397 ms Gated 397, 673 ms (48) 19 ft-9 in. (6008) 10 ft-1 in. (3072) Post 7 31 (787) No 50 (80) 25 No Conclusion 521 ms End Post Fracture 521 ms (34) 24 ft-7 in. (7493) 12 ft-3 in. (3738)
194 180 March 31, 2014 Table 21. Simulation Analysis Summary for 24-ft (7.3-m) Radius Systems (cont) % of Initial % of Initial % of Initial % of Initial % of Initial % of Initial % of Initial % of Initial Initial 50 ms Initial 100 ms Impact Rail Height Speed Angle Energy Energy Energy Energy Energy Energy Energy Energy Blockouts? Deceleration Deceleration Location (in.) mph (km/h) (deg) Dissipated, Dissipated, Dissipated, Dissipated, Dissipated, Dissipated, Dissipated, Dissipated, (g's) (g's) 50 ms 75 ms 100 ms 150 ms 200 ms 300 ms 400 ms End of Event Post 3 27 (686) No 45 (72) % 29% 30% % Midspan (686) No 45 (72) N/A 19% 24% % Post 4 27 (686) No 45 (72) % 23% 29% % Midspan (686) No 45 (72) N/A 17% 20% % Post 5 27 (686) No 45 (72) % 25% 27% 36% 50% 62% - 68% Midspan (686) No 45 (72) N/A 17% 19% % Post 6 27 (686) No 45 (72) % 20% 24% 35% % Midspan (686) No 45 (72) % 22% 25% % Post 7 27 (686) No 45 (72) N/A 16% % Midspan (686) No 45 (72) N/A 15% 23% % Post 3 27 (686) Yes 45 (72) % 31% 32% 38% % Post 4 27 (686) Yes 45 (72) % 29% 35% 48% % Post 5 27 (686) Yes 45 (72) % 28% 30% 38% 49% 64% 77% 96% Post 6 27 (686) Yes 45 (72) % 25% 29% 37% % Post 7 27 (686) Yes 45 (72) % 20% 24% 42% % Post 3 31 (787) No 45 (72) % 32% 36% 49% 58% 67% - 75% Midspan (787) No 45 (72) % 28% 34% 42% 51% 61% - 66% Post 4 31 (787) No 45 (72) % 28% 36% 46% 50% 62% 72% 78% Midspan (787) No 45 (72) % 26% 33% 35% 42% 57% - 67% Post 5 31 (787) No 45 (72) % 27% 29% 37% 49% 61% 69% 86% Midspan (787) No 45 (72) % 23% 31% 43% 45% 53% 57% 76% Post 6 31 (787) No 45 (72) % 26% 35% 39% 44% 57% 72% 93% Midspan (787) No 45 (72) % 27% 30% 41% 48% 62% 74% 93% Post 7 31 (787) No 45 (72) % 25% 29% 40% 45% 58% 68% 96% Midspan (787) No 45 (72) % 27% 32% 40% 55% 70% 82% 98% Post 3 31 (787) No 50 (80) % 32% 33% % Post 4 31 (787) No 50 (80) % 28% 34% 42% 45% 58% 66% 85% Post 5 31 (787) No 50 (80) % 25% 27% 38% 46% 58% - 64% Post 6 31 (787) No 50 (80) % 24% 30% 34% 44% 57% 65% 76% Post 7 31 (787) No 50 (80) % 20% 26% 32% 38% 51% 65% 90% NOTE: - Analysis terminated; data was not collected
195 181 March 31, 2014 Table 22. Simulation Analysis Summary for 48-ft (15-m) Radius Systems Impact Location Rail Height (in.) Blockouts? Speed Angle mph (km/h) (deg) Result Analysis End Time (ms) Reason for Terminating Analysis Anchor Posts Fracture Times Posts on Radius Fractured/ Deflected Transition Posts Fractured/ Deflected Speed at End of Analysis mph (km/h) Longitudinal Displacement at End of Analysis ft-in. (mm) Lateral Displacement at End of Analysis ft-in. (mm) Post 4 27 (686) No 45 (72) 25 Fail - override 94 ms Override 94 ms (58) 5 ft-2 in. (1586) 2 ft-0 in. (611) Post 5 27 (686) No 45 (72) 25 Fail - override 113 ms Override (59) 6 ft-3 in. (1899) 2 ft-5 in. (729) Post 6 27 (686) No 45 (72) 25 Fail - override 128 ms Override (55) 6 ft-11 in. (2107) 2 ft-8 in. (815) Post 7 27 (686) No 45 (72) 25 Fail - override 224 ms Override (50) 11 ft-5 in. (3473) 4 ft-4 in. (1325) Post 8 27 (686) No 45 (72) 25 Fail - override 128 ms Override (58) 7 ft-1 in. (2162) 2 ft-7 in. (780) Post 9 27 (686) No 45 (72) 25 Fail - override 129 ms Override (58) 7 ft-2 in. (2185) 2 ft-6 in. (772) Post (686) No 45 (72) 25 Fail - override 82 ms Override (63) 4 ft-9 in. (1457) 1 ft-8 in. (508) Post (686) No 45 (72) 25 Fail - override 100 ms Override (60) 5 ft-9 in. (1757) 1 ft-11 in. (595) Post (686) No 45 (72) 25 Fail - override 118 ms Override (59) 6 ft-9 in. (2056) 2 ft-2 in. (668) Post (686) No 45 (72) 25 Fail - override 135 ms Override (58) 7 ft-8 in. (2345) 2 ft-4 in. (707) Post 4 27 (686) Yes 45 (72) 25 Gated 120 ms Gated 120, 516 ms (55) 6 ft-4 in. (1933) 2 ft-5 in. (744) Post 5 27 (686) Yes 45 (72) 25 Fail - override 178 ms Override 178 ms (50) 8 ft-12 in. (2743) 3 ft-5 in. (1053) Post 6 27 (686) Yes 45 (72) 25 Captured 685 ms End of Sim (17) 22 ft-7 in. (6895) 9 ft-8 in. (2954) Post 7 27 (686) Yes 45 (72) 25 Captured 684 ms End of Sim (15) 22 ft-7 in. (6882) 10 ft-0 in. (3036) Post 8 27 (686) Yes 45 (72) 25 Fail - override 276 ms Override (43) 13 ft-3 in. (4034) 5 ft-0 in. (1515) Post 9 27 (686) Yes 45 (72) 25 Fail - override 149 ms Override (56) 8 ft-0 in. (2440) 2 ft-10 in. (867) Post (686) Yes 45 (72) 25 Fail - override 135 ms Override (59) 7 ft-5 in. (2270) 2 ft-6 in. (770) Post (686) Yes 45 (72) 25 Captured 681 ms End of Sim (14) 25 ft-1 in. (7647) 6 ft-4 in. (1925) Post (686) Yes 45 (72) 25 Captured 685 ms Captured (5) 23 ft-10 in. (7268) 4 ft-8 in. (1433) Post (686) Yes 45 (72) 25 Captured 575 ms End of Sim (9) 20 ft-9 in. (6323) 2 ft-10 in. (858) Post 4 31 (787) No 45 (72) 25 No Conclusion 104 ms End of Sim 104 ms (57) 5 ft-7 in. (1714) 2.1 ft-0 in. (649) Post 5 31 (787) No 45 (72) 25 No Conclusion 159 ms End of Sim 159 ms (54) 8 ft-4 in. (2540) 3 ft-3 in. (979) Post 6 31 (787) No 45 (72) 25 No Conclusion 278 ms End of Sim 278 ms (49) 13 ft-8 in. (4160) 5 ft-6 in. (1675) Post 7 31 (787) No 45 (72) 25 Captured 681 ms End of Sim (23) 23 ft-3 in. (7093) 11 ft-1 in. (3375) Post 8 31 (787) No 45 (72) 25 Captured 593 ms Numerical Instability (28) 22 ft-6 in. (6861) 10 ft-6 in. (3188) Post 9 31 (787) No 45 (72) 25 Captured 598 ms Numerical Instability (29) 23 ft-7 in. (7196) 9 ft-7 in. (2918) Post (787) No 45 (72) 25 Captured 683 ms End of Sim (28) 25 ft-10 in. (7873) 9 ft-1 in. (2767) Post (787) No 45 (72) 25 Captured 682 ms End of Sim (19) 24 ft-4 in. (7405) 8 ft-4 in. (2535) Post (787) No 45 (72) 25 Captured 685 ms End of Sim (16) 23 ft-11 in. (7285) 6 ft-9 in. (2051) Post (787) No 45 (72) 25 Captured 692 ms End of Sim (34) 26 ft-10 in. (8177) 8 ft-3 in. (2508) Post 6 31 (787) No 50 (80) 25 No Conclusion 228 ms Numerical Instability 228 ms (60) 12 ft-8 in. (3861) 5 ft-10 in. (1785) Post 7 31 (787) No 50 (80) 25 No Conclusion 381 ms End of Sim 381 ms (49) 18 ft-9 in. (5718) 9 ft-1 in. (2757) Post 8 31 (787) No 50 (80) 25 Captured 680 ms End of Sim (31) 27 ft-7 in. (8412) 14 ft-8 in. (4461) Post 9 31 (787) No 50 (80) 25 Captured 684 ms End of Sim (29) 28 ft-4 in. (8635) 15 ft-5 in. (4702) Post (787) No 50 (80) 25 Captured 684 ms End of Sim (25) 28 ft-8 in. (8743) 13 ft-2 in. (4005) Post (787) No 50 (80) 25 Captured 685 ms End of Sim (28) 28 ft-6 in. (8696) 12 ft-8 in. (3866) Post (787) No 50 (80) 25 Captured 603 ms Numerical Instability (24) 25 ft-8 in. (7833) 11 ft-0 in. (3352) Post (787) No 50 (80) 25 Captured 484 ms Numerical Instability (28) 21 ft-9 in. (6641) 8 ft-8 in. (2629)
196 182 March 31, 2014 Table 23. Simulation Analysis Summary for 48-ft (15-m) Radius Systems (cont) % of Initial % of Initial % of Initial % of Initial % of Initial % of Initial % of Initial % of Initial Initial 50 ms Initial 100 ms Impact Rail Height Speed Angle Energy Energy Energy Energy Energy Energy Energy Energy Blockouts? Deceleration Deceleration Location (in.) mph (km/h) (deg) Dissipated, Dissipated, Dissipated, Dissipated, Dissipated, Dissipated, Dissipated, Dissipated, (g's) (g's) 50 ms 75 ms 100 ms 150 ms 200 ms 300 ms 400 ms End of Event Post 4 27 (686) No 45 (72) % 31% 37% % Post 5 27 (686) No 45 (72) % 26% 31% % Post 6 27 (686) No 45 (72) % 29% 33% % Post 7 27 (686) No 45 (72) % 25% 31% 41% 49% % Post 8 27 (686) No 45 (72) % 25% 28% % Post 9 27 (686) No 45 (72) % 27% 29% % Post (686) No 45 (72) % 22% % Post (686) No 45 (72) % 24% 31% % Post (686) No 45 (72) % 21% 27% % Post (686) No 45 (72) % 20% 27% % Post 4 27 (686) Yes 45 (72) % 34% 38% 46% 53% 72% 80% 88% Post 5 27 (686) Yes 45 (72) % 30% 35% 49% 54% % Post 6 27 (686) Yes 45 (72) % 31% 36% 49% 54% 67% 78% 95% Post 7 27 (686) Yes 45 (72) % 29% 35% 43% 51% 68% 78% 95% Post 8 27 (686) Yes 45 (72) % 31% 34% 44% 50% % Post 9 27 (686) Yes 45 (72) % 29% 34% % Post (686) Yes 45 (72) % 26% 33% % Post (686) Yes 45 (72) % 27% 35% 39% 49% 64% 72% 96% Post (686) Yes 45 (72) % 24% 32% 39% 49% 58% 74% 100% Post (686) Yes 45 (72) % 24% 30% 42% 46% 69% 89% 98% Post 4 31 (787) No 45 (72) % 33% 37% 45% 54% 69% 77% 92% Post 5 31 (787) No 45 (72) % 28% 35% 42% 46% 57% 66% 86% Post 6 31 (787) No 45 (72) % 27% 33% 39% 45% 56% 67% 83% Post 7 31 (787) No 45 (72) % 32% 36% 48% 56% 62% 75% 90% Post 8 31 (787) No 45 (72) % 32% 36% 45% 51% 59% 70% 85% Post 9 31 (787) No 45 (72) % 29% 33% 44% 45% 62% 71% 84% Post (787) No 45 (72) % 27% 33% 42% 46% 64% 74% 85% Post (787) No 45 (72) % 27% 35% 41% 50% 63% 77% 93% Post (787) No 45 (72) % 29% 36% 44% 52% 61% 78% 95% Post (787) No 45 (72) % 22% 29% 42% 48% 65% 75% 78% Post 6 31 (787) No 50 (80) % 25% 32% 37% 41% 48% 58% 69% Post 7 31 (787) No 50 (80) % 28% 34% 42% 49% 58% 63% 85% Post 8 31 (787) No 50 (80) % 28% 32% 39% 46% 60% 72% 85% Post 9 31 (787) No 50 (80) % 26% 30% 39% 44% 53% 64% 87% Post (787) No 50 (80) % 26% 29% 39% 44% 56% 65% 91% Post (787) No 50 (80) % 26% 31% 39% 48% 56% 69% 88% Post (787) No 50 (80) % 22% 30% 38% 45% 60% 74% 91% Post (787) No 50 (80) % 20% 28% 37% 46% 67% 81% 88% NOTE: - Analysis terminated; data was not collected
197 183 March 31, 2014 Table 24. Simulation Analysis Summary for 72-ft (22-m) Radius Systems Impact Location Rail Height (in.) Blockouts? Speed Angle mph (km/h) (deg) Result Data Analysis End Time (ms) Reason for Terminating Analysis Anchor Posts Fracture Times Posts on Radius Fractured/ Deflected Transition Posts Fractured/ Deflected Speed at End of Analysis mph (km/h) Longitudinal Displacement at End of Analysis ft-in. (mm) Lateral Displacement at End of Analysis ft-in. (mm) Post 4 27 (686) No 45 (72) 25 Fail - override 96 Override 333 ms (56) 5 ft-2 in. (1586) 2 ft-0 in. (618) Post 5 27 (686) No 45 (72) 25 Fail - override 200 Override (40) 9 ft-4 in. (2844) 3 ft-8 in. (1107) Post 7 27 (686) No 45 (72) 25 Fail - override 397 Override (28) 15 ft-4 in. (4683) 6 ft-2 in. (1880) Post 9 27 (686) No 45 (72) 25 Captured 685 End of Sim (12) 21 ft-3 in. (6470) 9 ft-0 in. (2755) Post (686) No 45 (72) 25 Fail - override 123 Override (58) 6 ft-9 in. (2058) 2 ft-5 in. (727) Post (686) No 45 (72) 25 Fail - override 78 Override (62) 4 ft-6 in. (1366) 1 ft-7 in. (479) Post (686) No 45 (72) 25 Fail - override 99 Override (60) 5 ft-8 in. (1728) 1 ft-10 in. (568) Post (686) No 45 (72) 25 Fail - override 121 Override (58) 6 ft-11 in. (2101) 2 ft-1 in. (644) Post (686) No 45 (72) 25 Redirected 338 End of Sim (41) - - Post 4 27 (686) Yes 45 (72) 25 Fail - override 84 Override 84 ms (55) 4 ft-7 in. (1401) 1 ft-9 in. (537) Post 5 27 (686) Yes 45 (72) 25 Fail - override 470 Override (24) 15 ft-6 in. (4736) 6 ft-5 in. (1949) Post 7 27 (686) Yes 45 (72) 25 Captured 688 End of Sim (14) 20 ft-11 in. (6385) 9 ft-1 in. (2777) Post 9 27 (686) Yes 45 (72) 25 Fail - override 553 Override (23) 19 ft-9 in. (6026) 8 ft-6 in. (2585) Post (686) Yes 45 (72) 25 Fail - override 490 Override (29) 19 ft-8 in. (5984) 6 ft-7 in. (2005) Post (686) Yes 45 (72) 25 Fail - override 536 Override (26) 19 ft-0 in. (5798) 8 ft-7 in. (2618) Post (686) Yes 45 (72) 25 Captured 688 End of Sim (21) 25 ft-0 in. (7618) 5 ft-5 in. (1646) Post (686) Yes 45 (72) 25 Redirected 692 End of Sim (20) - - Post (686) Yes 45 (72) 25 Redirected 665 End of Sim (30) - - Post 4 31 (787) No 45 (72) 25 No Conclusion 82 End of Sim 82 ms (57) 4 ft-6 in. (1384) 1 ft-9 in. (528) Post 5 31 (787) No 45 (72) 25 No Conclusion 153 End of Sim 153 ms (50) 7 ft-9 in. (2356) 3 ft-0 in. (916) Post 7 31 (787) No 45 (72) 25 No Conclusion 631 End of Sim 631 ms (22) 22 ft-0 in. (6716) 9 ft-8 in. (2948) Post 9 31 (787) No 45 (72) 25 Captured 687 End of Sim (22) 23 ft-5 in. (7129) 11 ft-4 in. (3447) Post (787) No 45 (72) 25 Captured 689 End of Sim (18) 23 ft-7 in. (7190) 9 ft-8 in. (2937) Post (787) No 45 (72) 25 Captured 695 End of Sim (18) 23 ft-9 in. (7249) 8 ft-3 in. (2506) Post (787) No 45 (72) 25 Captured 693 End of Sim (14) 23 ft-3 in. (7083) 6 ft-7 in. (2004) Post (787) No 45 (72) 25 Captured 653 End of Sim (20) 23 ft-11 in. (7290) 2 ft-4 in. (710) Post (787) No 45 (72) 25 Redirected 433 Numerical Instability (30) - - Post 5 31 (787) No 50 (80) 25 Gated 142 Gated 142, 441 ms (61) 8 ft-0 in. (2446) 3.9 ft-0 in. (1179) Post 7 31 (787) No 50 (80) 25 No Conclusion 277 End of Sim 277 ms (52) 14 ft-6 in. (4417) 6 ft-9 in. (2048) Post 9 31 (787) No 50 (80) 25 Captured 689 End of Sim (28) 27 ft-7 in. (8411) 14 ft-1 in. (4288) Post (787) No 50 (80) 25 No Conclusion 556 End of Sim 556 ms (34) 24 ft-11 in. (7592) 11 ft-11 in. (3633) Post (787) No 50 (80) 25 Captured 695 End of Sim (29) 28 ft-2 in. (8591) 13 ft-6 in. (4118) Post (787) No 50 (80) 25 Captured 689 End of Sim (26) 26 ft-4 in. (8019) 13 ft-5 in. (4079) Post (787) No 50 (80) 25 Captured 692 End of Sim (15) 27 ft-0 in. (8240) 7 ft-11 in. (2423) Post (787) No 50 (80) 25 Redirected 689 End of Sim (10) - -
198 184 March 31, 2014 Table 25. Simulation Analysis Summary for 72-ft (22-m) Radius Systems (cont) % of Initial % of Initial % of Initial % of Initial % of Initial % of Initial % of Initial % of Initial Initial 50 ms Initial 100 ms Impact Rail Height Speed Angle Energy Energy Energy Energy Energy Energy Energy Energy Blockouts? Deceleration Deceleration Location (in.) mph (km/h) (deg) Dissipated, Dissipated, Dissipated, Dissipated, Dissipated, Dissipated, Dissipated, Dissipated, (g's) (g's) 50 ms 75 ms 100 ms 150 ms 200 ms 300 ms 400 ms End of Event Post 4 27 (686) No 45 (72) % 35% 40% % Post 5 27 (686) No 45 (72) % 35% 43% 58% % Post 7 27 (686) No 45 (72) % 34% 41% 53% 65% 79% - 85% Post 9 27 (686) No 45 (72) % 32% 42% 52% 60% 69% 81% 97% Post (686) No 45 (72) % 29% 32% % Post (686) No 45 (72) % 27% % Post (686) No 45 (72) % 26% % Post (686) No 45 (72) % 23% 31% % Post (686) No 45 (72) % 20% 26% 39% 46% 62% - 69% Post 4 27 (686) Yes 45 (72) % 39% 46% 55% 72% 85% - 86% Post 5 27 (686) Yes 45 (72) % 37% 43% 57% 71% 85% 89% 89% Post 7 27 (686) Yes 45 (72) % 35% 42% 53% 64% 75% 81% 96% Post 9 27 (686) Yes 45 (72) % 36% 40% 52% 59% 69% 79% 90% Post (686) Yes 45 (72) % 34% 35% 43% 54% 69% 78% 84% Post (686) Yes 45 (72) % 29% 39% 52% 60% 73% 82% 87% Post (686) Yes 45 (72) % 29% 38% 47% 57% 66% 76% 92% Post (686) Yes 45 (72) % 25% 33% 43% 54% 66% 73% 92% Post (686) Yes 45 (72) % 22% 28% 40% 49% 64% 73% 83% Post 4 31 (787) No 45 (72) % 35% 40% 50% 64% 78% 87% 98% Post 5 31 (787) No 45 (72) % 35% 42% 51% 57% 75% 82% 96% Post 7 31 (787) No 45 (72) % 33% 40% 49% 57% 69% 74% 91% Post 9 31 (787) No 45 (72) % 33% 40% 50% 57% 62% 72% 91% Post (787) No 45 (72) % 34% 35% 43% 53% 64% 77% 94% Post (787) No 45 (72) % 29% 35% 46% 53% 66% 79% 94% Post (787) No 45 (72) % 27% 36% 44% 55% 68% 82% 96% Post (787) No 45 (72) % 26% 35% 45% 55% 68% 76% 93% Post (787) No 45 (72) % 21% 28% 42% 49% 66% 79% 83% Post 5 31 (787) No 50 (80) % 30% 36% 42% 51% 69% 75% 81% Post 7 31 (787) No 50 (80) % 30% 36% 42% 50% 60% 59% 84% Post 9 31 (787) No 50 (80) % 31% 37% 45% 49% 59% 69% 88% Post (787) No 50 (80) % 30% 32% 39% 46% 57% 65% 84% Post (787) No 50 (80) % 30% 33% 42% 48% 60% 69% 87% Post (787) No 50 (80) % 29% 35% 45% 51% 60% 74% 90% Post (787) No 50 (80) % 24% 33% 43% 49% 62% 75% 97% Post (787) No 50 (80) % 23% 30% 39% 49% 70% 83% 99% NOTE: - Analysis terminated; data was not collected
199 Secondary Secondary Secondary (a) Primary Primary Primary (b) (c) Figure 134. Phases in Vehicle Capture for 24, 48, and 72-ft (7.3, 15, and 22-m) Radii (a) Membrane Tension (b) Mixed Membrane Tension and Pocketing (c) Fully-Developed Pocket posts as a shear load and buckles form in the rail. After posts deflect or fracture, rail tension is temporarily reduced as another buckle is formed at the adjacent post, as shown in Figure 135. Criteria were established to provide a quantitative comparison between the three phases observed during vehicle capture: Beginning of Phase II: guardrail deflected to at least 30 degrees to tangent line at radius Beginning of Phase III: the included angle of the 135 degrees 185
200 Figure 135. Progression of Rail Damage for Curved Guardrail 186
 top mounting heights is shown in Tables 26 through 28. Results were similar for successful simulations of the 27-in. (686-mm) tall systems. (a) (b) Figure 136.")
201 The criteria for determining the transitions between phases is shown in Figure 136. The duration of each phase for impacts involving systems with 31-in. (787-mm) top mounting heights is shown in Tables 26 through 28. Results were similar for successful simulations of the 27-in. (686-mm) tall systems. (a) (b) Figure 136. Criteria for Identifying (a) Beginning and (b) End of Transition Between Membrane Tension and Guardrail Pocketing Table 26. Phase Transitions for 45-mph (72-km/h), 25-degree Impacts into 24-ft (7.3-m) Radius Systems Post No. Phase I Membrane Phase II Mixed Tension and Pocketing Phase III Pocketing Tension Interval Duration Interval Duration ms 40 ms - BCTF 27 ms Mid ms 35 ms - BCTF 38 ms ms 40 ms - BCTF 139 ms Mid ms 40 ms - BCTF 138 ms ms ms 85 ms 135 ms - End 250 ms Mid ms ms 85 ms 135 ms - End 485 ms ms ms 140 ms 185 ms - End 490 ms Mid ms ms 65 ms 150 ms - End 530 ms ms ms 105 ms 160 ms - End 490 ms Mid ms ms 110 ms 155 ms - End 430 ms BCTF Analysis of simulation results terminated due to BCT post fracture --- Pocket was not fully formed before analysis ended 187
202 Table 27. Phase Transitions for 45-mph (72-km/h), 25-degree Impacts into 48-ft (15-m) Radius Systems Phase I Phase II Phase III Post No. Membrane Mixed Tension and Pocketing Pocketing Tension Interval Duration Interval Duration ms 80 ms - BCTF 24 ms ms 85 ms - BCTF 74 ms ms 100 ms - BCTF 178 ms ms ms 235 ms 325 ms - End 355 ms ms ms 230 ms 320 ms - End 275 ms* ms ms 215 ms 300 ms - End 300 ms* ms ms 225 ms 325 ms - End 360 ms ms ms 215 ms 305 ms - End 375 ms ms ms 220 ms 315 ms - End 370 ms ms ms 70 ms 230 ms - End 460 ms BCTF Analysis of simulation results terminated due to BCT post fracture --- Pocket was not fully formed before analysis ended * Instability caused simulation to terminate early Table 28. Phase Transitions for 45-mph (72-km/h), 25-degree Impacts into 72-ft (22-m) Radius Systems Phase I Phase II Phase III Post No. Membrane Mixed Tension and Pocketing Pocketing Tension Interval Duration Interval Duration ms (End) ms 115 ms - BCTF 38 ms ms ms 390 ms 525 ms - End 106 ms ms ms 505 ms 675 ms - End 12 ms ms ms 455 ms 590 ms - End 99 ms ms 150 ms - End 545 ms ms 175 ms - End 518 ms ms 330 ms - End 323 ms BCTF Analysis of simulation results terminated due to BCT post fracture --- Pocket was not fully formed before analysis ended An analysis of Tables 26 through 28 indicated that there was a nearly linear ratio of the increase in duration of Phase I (membrane tension) with increased radius size. The average durations of Phase I membrane tensions were 49, 92, and 147 ms for 24-, 48-, and 72-ft (7.3-, 15-, and 22-m) radii. By doubling or tripling the 24-ft (7.3-m) radius to 48 ft (15 m) or 72 ft (22 188
203 189 March 31, 2014 m), the duration of Phase I increased by factors of 1.88 and 3.00, respectively. Likewise the ratios of Phase I duration to radius size were 2.04, 1.92, and 2.04 ms/ft (6.70, 6.30, and 6.70 ms/m), respectively. In contrast, the duration of Phase II, or transition between which were predominantly membrane tension capture forces to predominantly guardrail pocketing capture forces, more closely resembled a quadratic relationship. The significance of these findings should be explored in future studies. Overrides occurring downstream of the LON of the 27-in. (686-mm) tall systems were analyzed with respect to the three phases of guardrail deformation and capture noted above. For systems without blockouts, short-radius overrides occurred in disproportionately greater frequencies during Phase I deflections than for Phases II or III. Only one override was observed during Phase III guardrail deformation for 27-in. (686-mm) tall systems, for a 24-ft (7.3-m) radius system, although 80% of the failures occurring downstream of the LON of the 72-ft (22- m) radius system occurred during Phase I capture. All of the overrides observed involving the 27-in. (686-mm) tall system with blockouts occurred during the Phase II transition, regardless of radius size. Every impact in which a complete guardrail pocket was formed (i.e., the guardrail formed an included angle of less than 135 degrees around the vehicle, or Phase III deformation) involving a system with blockouts also resulted in vehicle capture. These results indicate that blockouts increased both the duration of acceptable guardrail contact with the vehicle and the likelihood of successful capture. Guardrail LONs are discussed in Section The process of rail tension rise, post deflection and fracture, and buckle formation and subsequent decrease in rail tension contributed to a stepwise plot of velocity vs. time. One plot of a successful impact occurring with all three radii at approximately the same impact location near the nose for each simulation is shown in Figure 137. For 24-ft (7.3-m) radii impacted at the midspan between post nos. 5 and 6, visible step-like changes in speed occurring near 100, 280,

204 and 460 ms, followed by periods in which speeds were relatively constant. The lags in speed reduction were related to the development of buckles in the guardrail and subsequent low rail tension, followed by increased tension prior to post fractures during times of vehicle slowing. Smaller step-like transitions in speed occurred during the 48-ft (15-m) radius system impacted at post no. 8 as well. Figure 137. Vehicle Speed Comparison for Impacts near Center of Radius, 45 mph (72 km/h) The rate of change of vehicle speed was greatest during Phase I capture and predominantly constant regardless of radius size. Rates of change of velocity decreased for Phases II and III capture. The 72-ft (22-m) radius system impacted at post no. 11 experienced smaller and less discernable speed perturbations because the phase transitions were much more gradual, and the effect of individual post fractures was not as distinctive. As radius size increased, the duration of time in which membrane tension dominated guardrail capture increased. In addition, the duration of acceptable contacts, as well as number of 190
205 successful vehicle captures, increased for all radii for 27-in. (686-mm) tall systems. Phase transitions between predominantly membrane tension to predominantly guardrail pocketing forces were extended and became more gradual with increased radius size as well. Overall, increased radii performed better, on average, than smaller radii for most impact conditions. Also, blockouts significantly improved curved guardrail performance with a 27-in. (686-mm) tall top mounting height Maximum Practical Speeds for Short-Radius Guardrails The maximum practical impact speed which will capture the majority of light truck impacts was estimated by examining the energy dissipated at the end of each simulations. Recall that analysis was terminated either when the system gated, the rail slipped below the bottom of the vehicle s front bumper, the termination time was reached, or the vehicle came to rest. For impacts occurring within the LON, in which the barrier could potentially capture or redirect a vehicle instead of gating, the maximum practical speed for non-blocked, 27-in. (686-mm) tall short radius guardrail ranged between 19 mph (31 km/h) and 22 mph (35 km/h) for radii of 24 ft (7.3 m) and 72 ft (22 m), respectively. When blockouts were added to the system, the acceptable impact speeds ranged between 29 mph (47 km/h) and 41 mph (66 km/h) for radii of 24 ft (7.3 m) and 72 ft (22 m), respectively. Impact speeds less than or equal to those indicated should result in vehicle capture, based on simulation results. Based on system capacities and damage, it was estimated that the maximum impact speeds applicable for systems with 31-in. (787-mm) mounting heights were 45 mph (72 km/h) for systems with radii less than 45 ft (14 m) and 50 mph (80 km/h) for systems with radii greater than or equal to 45 ft (14 m). The maximum practical speeds and beginning of the LON of the 27-in. (686-mm) and 31-mm (787-mm) tall systems are shown in Table
206 Table 29. Summary of Maximum Practical Speeds and Beginning of LON System Configuration 27-in. (686-mm) Tall No Blockouts 27-in. (686-mm) Tall Blockouts 31-in. (686-mm) Tall No Blockouts March 31, 2014 NOTE: Post locations for 24, 48, and 72-ft (7.3, 15, and 22-m systems) are shown in Figures 97 through Critical Impact Locations For all systems with 27-in. (686-mm) top rail height, the most severe impact occurred between the centerpoint of the nose and two posts downstream of the centerpoint, based on vaulting frequencies of the 27-in. (686-mm) tall systems. Vehicles which impacted up to two post spans upstream from the centerpoint of the nose remained engaged with the rail for a longer amount of time or were captured and brought to a controlled stop, as compared to vehicles impacting at or slightly downstream from the centerpoint of the nose. Although NCHRP Report 350 test conditions require vehicle impact with the center of the nose of a short-radius system, generally these test conditions have a line layout in which the centerline of the test vehicle is aligned with the centerpoint of the nose. The simulation modeling performed in this research suggested that impacts slightly downstream of the center of the radius may prove more difficult for all guardrail radii. Max Practical Speed mph (km/h) 19 mph (30 km/h) 29 mph (47 km/h) 10.4 Causes of Vaulting and Penetration 24-ft (7.3-m) Radius 48-ft (15-m) Radius 72-ft (22-m) Radius Max Practical Max Practical Beginning of Beginning of Speed Speed LON LON mph (km/h) mph (km/h) Post No mph 23 mph Post No. 6 (35 km/h) (38 km/h) Post No mph 41 mph Post No. 6 (42 km/h) (66 km/h) 45 mph 45 mph Post No. 7 (72 km/h) (72 km/h) 45 mph (72 km/h) Post No mph (80 km/h) Post No mph (80 km/h) Beginning of LON Post No. 7 Post No. 7 Post No. 9 Post No. 9 Guardrail twisting and sliding beneath the impacting vehicle s bumper contributed to barrier override and vaulting. A comparison of the engagement of the vehicle s front end with 192
207 the rail with 27-in. (686-mm) and 31-in. (787-mm) tall guardrail curved systems is shown in Figures 138 and 139. Immediately after impact with a 27-in. (686-mm) tall guardrail, the top corrugation flattened and the bottom corrugation protruded beneath the bumper. As a result, the rail engagement with the bumper was unstable. Rail twisting occurred when posts rotated or fractured and were deflected backward before disengaging from the rail, and tended to accentuate rail slippage below the bumper. In addition, simulated pickup vehicles were more likely to vault during intermittent periods of low tension in the guardrail after post fractures. In contrast, during impact with 31-in. (787-mm) tall systems, the bumper initially interacted with the bottom corrugation and the top corrugation protruded over the bumper. Because the region of the vehicle corresponding to the grill, radiator, and headlights was both recessed from the bumper and relatively broad and deformable, the rail tended to stably interact with the front of the vehicle and become interlocked. Although posts rotated or fractured, and some posts remained attached to the rail, due to bumper interaction the rail remained contact with the front of the vehicle until the vehicle came to rest. Tire interaction with post debris also contributed to some vaulting overrides in the simulations. After posts fractured, posts which slid beneath the vehicle s wheels contributed to suspension compression and vehicle uplift. For example, during simulations of the 27-in. (686- mm) tall systems at and slightly downstream from the centerpoint of the radius for all radii, tire interaction with post debris contributed to vaulting. The orientation of the vehicle and impact direction caused fractured posts to fall directly in front of the front wheels, where they were overridden. Similar rail overrides due to debris interaction were noted during full-scale testing of the MwRSF TL-3 short-radius system [12-14]. Sequential images of impact at post no. 9 with a 27-in. (686-mm) tall system with a 48-ft (15-m) radius with blockouts are shown in Figure


208 Figure 138. Upper Corrugation Flattening and Twisting Below Vehicle, 27-in. (686-mm) Rail Height 194


 Rail Height")
209 Figure 139. Lower Corrugation Flattening and Interlocking with Vehicle, 31-in. (787-mm) Rail Height (bumper colored red for clarity) 195
210 10.5 Additional Concerns Because the 27-in. (686-mm) guardrail mounting height is impractical for most radii of interest, researchers believed that a taller guardrail mounting height was necessary to ensure acceptable interaction with light truck vehicles. For a 31-in. (787-mm) top rail height, passenger cars may underride the short radius systems if impacted with similar impact conditions. Without full-scale testing or simulation data, it is advised to proceed cautiously if a 31-in. (787-mm) tall rail height is utilized. All short-radius guardrail designs, which have been approved according to criteria presented in NCHRP Report No. 230, were 27-in. (686-mm) tall. Taller short-radius systems have been installed. For example, researchers at Caltrans discussed Minnesota DOT s experience installing 29-in. (737-mm) W-beam bullnose systems in 1965 near the Minneapolis-St. Paul area [16]. The design was not tested to contemporary standards, but crash data collected by the Minnesota DOT indicated an overall acceptable performance between 1965 and 1970 [34]. Subsequent tests of the MN bullnose design conducted at TTI in 1975 utilized 27-in. (686-mm) tall W-beam for compliance testing with NCHRP Report 230 [15]. No W-beam short-radius system has been crash tested specifically for compliance with NCHRP Report No. 350 or MASH. Of the failed short-radius guardrail tests, two testing agencies examined thrie beam short radius guardrail designs with a top rail height of at least 31 in. (787 mm): TTI [8] and MwRSF [12-14]. Both agencies began testing according to NCHRP Report No. 350 TL-3 impact conditions, but they to abandon further research and development due to lack of funds and frequent test failures. Small car underride occurred to some degree during tests with both systems. However, underride potential may be reduced when impacted with TL-2 impact conditions. 196

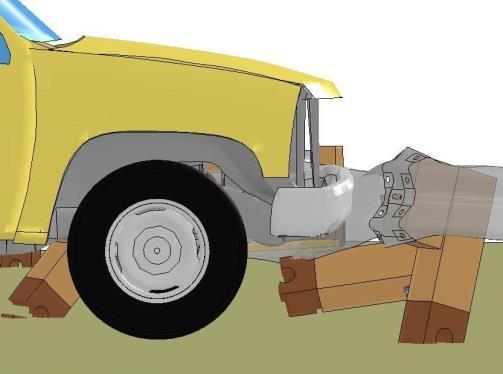


211 Figure 140. Wheel Interaction with Post Debris, 45 mph (72 km/h) impact with 27-in. (686-mm) Tall, 48-ft (15-m) Radius System with Blockouts at Post No
212 198 March 31, 2014 Whereas thrie beam short-`radius systems failed multiple crash tests, a thrie beam bullnose system was successfully tested according to NCHRP Report No. 350 TL-3 impact conditions. The major difference between thrie beam bullnose and thrie beam short-radius guardrail is that, during head-on impacts, deflected guardrails in bullnose systems frequently undergo a nearly 180-degree bend over short radii of curvature. Because of this, redirective forces are transmitted through compressive resistance of the rails, and multiple, intermediate bends are formed, which retains rail tensions throughout impact. For short-radius systems, the angles between the primary and secondary roadway sides are typically less than 180 degrees, and the rails are loaded in a combination of tension and bending. Buckles and kinks form at post locations, but no intermediate buckles develop between adjacent post spans. Thus, little to no compressive loading occurs in short-radius guardrails, and the energy absorbed by the rail is decreased. The 31-in. (787-mm) tall curved guardrail systems simulated have a potential for small car underride when impacted near a perpendicular orientation. There are fewer concerns that small cars will fail to be redirected or adequately captured by taller rails when impacts approach tangential to the rail. Recent testing of the MGS at very large flare rates indicated that for impact angles as high as 31 degrees into a 31-in. (787-mm) tall system, small cars did not underride beneath the guardrail [37]. Later tests conducted at MwRSF using an MGS guardrail with a 36- in. (914-mm) top mounting height successfully redirected an 1100C small car impacting with MASH TL-3 impact conditions [38]. Although small cars may be more susceptible to underride for near-perpendicular impacts into rails with a 31-in. (787-mm) top mounting height, acceptable performance has been demonstrated for less severe impacts. Thus, for radii as large as 72 ft (22 m), the 31-in. (787-mm) tall curved guardrail system may perform acceptable for most small car impacts occurring within the clear zone. Smaller radii may not perform as well as larger radii.
213 A proposed solution to reduce the risk of small car underride and retain the benefits of higher rail height for guardrail installed at intersecting roadways is to raise the guardrail by 2 in. (51 mm) to a top rail mounting height of 29 in. (737 mm). There is little historical precedent to estimate the ability of a 29-in. (737-mm) tall system to redirect both passenger cars and light trucks. However, because even 31-in. (787-mm) tall thrie beam short radius systems, which have bottom corrugation heights of approximately 13 in. (330 mm), still caused passenger car underride, researchers do not recommend installation of 31-in. (787-mm) tall W-beam short radius systems until crash testing can verify the crashworthiness of this system. Another proposed solution to reduce the system deflection was to use half-post spacing. Although this solution may pose benefits in reduced dynamic deflection and better engagement with the pickup, half-post spacing may be excessively stiff for small car impacts and could cause occupant risk criteria to be violated or may promote underride. Further research and full-scale crash testing is recommended before reducing the post spacing of CRT posts on or adjacent to the radius. 199
214 11 CURVED GUARDRAIL EFFECTIVENESS EVALUATION 200 March 31, 2014 The performance of curved guardrail systems was determined, but it was uncertain as to what percentage of real-world crashes would be captured with these systems based on system performance limits. Researchers utilized the maximum practical impact speeds determined for each larger-radius, curved guardrail system to estimate the percentage of real-world crashes which researchers expected the curved guardrail systems to accommodate, using speed distributions on 45-mph (72-km/h) roadways. Distributions were obtained from a database of run-off-road (ROR) crashes assembled during completion of NCHRP Projects and 17-11, which tabulated vehicle speed at roadside departure and at up to four unique impact locations, as well as CG trajectory angles, vehicle heading angles, and hazard locations [36]. A total of 186 crashes occurring on 45-mph (72-km/h) roadways were extracted and analyzed. The and crash database overrepresented severe crashes. As a result, crash scaling factors extracted from SAS were applied to estimate globally-representative conditions as well. Problems with scale factors were noted, including that 4% of the crashes had weighting factors greater than 4,000, and several more above 2,000, whereas 55% of crashes had weighting factors less than 100. Therefore, the seven highest and lowest weighted crashes were excluded as outliers in both unweighted and weighted databases, to give adjusted data sets. As a result, the adjusted, non-weighted database was considered to be representative of severe crashes, and the adjusted, weighted database was considered to be representative of most crashes occurring on 45-mph (72 km/h) roadways. The adjusted and non-adjusted distributions of roadway departure speeds and departure IS values are shown in Figures 141 and 142, respectively. Departure speeds frequently exceeded the nominal posted speed limit (PSL) in all data sets. Roadway departure speeds of 45 and 50 mph (72 and 80 km/h) represented the 58 th and 68 th percentile of severe crashes and the 72 nd and 83 rd percentiles of all crashes, respectively.
215 % Greater Than March 31, 2014 % Greater Than 100% 90% 80% 70% 60% 50% 40% 30% 20% 10% Non-Weighted Before Adjustment Non-Weighted After Adjustment Weighted Before Adjustment Weighted After Adjustment NCHRP Report No. 350 TL-2 0% Speed (mph) Figure 141. Departure Speed Distribution Comparison for 45-mph (72-km/h) Roadways using NCHRP Report No. 665 Data [36] 100% 90% 80% 70% 60% 50% 40% 30% 20% 10% 0% Non-Weighted Before Adjustment Non-Weighted After Adjustment Weighted Before Adjustment Weighted After Adjustment NCHRP Report No. 350 TL IS Value (kj) Figure 142. Roadway Departure IS-Value Distribution Comparisons for 45-mph (72-km/h) Roadways using NCHRP Report No. 665 Data [36] To estimate the percentage of impacting vehicles which would be captured by each curved guardrail design, the maximum practical capture speed for each simulated system was 201
216 compared to the departure speed and IS-value distributions shown in Figures 141 and 142, as well as total vehicle energy at departure. Results of the analysis are shown in Error! Not a valid bookmark self-reference.. By evaluating only the impact speeds, passenger car impacts could be overweighted; thus the capture percentage calculated comparing vehicle real-world vehicle departure speeds and maximum practical system impact speeds was believed to underestimate the percentage of vehicle captures. Likewise, by only considering IS-value, the NCHRP Report No. 350 impact conditions are overweighted due to the 25-degree impact angle. Still, impact angle may be less critical during impact with curved guardrail systems within the radius and downstream of the LON, since the vehicle will be completely captured and come to a stop. Thus, evaluation based on IS-value was believed to overestimate the percentage of impacting vehicles captured, and would likely represent the upper bound of possible system performance. The average performance of the system was therefore correlated with the total vehicle energy at the point of departure, which factored in both vehicle size and speed. Most vehicles with less energy at impact than what was simulated would likely be captured, whereas some vehicles with more energy at impact than was simulated would likely penetrate behind the system. This is predominantly true for smaller-radius systems with limited secondary and primary side tangent guardrail lengths. Using the adjusted and data to represent severe (non-weighted) and global (weighted) crash conditions, the average estimated capture percentages were plotted for systems with 24-, 48-, and 72-ft (7.3-, 15-, and 22-m) radii, as shown in. The plots did not take into account the potential reduction in capture frequency due to small car underride, but it is still believed to be reasonably accurate, in part because impact speeds may be much lower than departure speeds; thus the analysis may be considered conservative. 202
217 Estimated Percentage of Vehicles Captured Table 30. Percentage of Crashes Captured by Curved Guardrail Designs March 31, 2014 Curved Guardrail Configuration 27 in. (686 mm) Tall No Blockouts 27 in. (686 mm) Tall With Blockouts 31 in. (787 mm) Tall With Blockouts Radius 24 ft (7.3 m) 48 ft (15 m) 72 ft (22 m) 24 ft (7.3 m) 48 ft (15 m) 72 ft (22 m) 24 ft (7.3 m) 48 ft (15 m) 72 ft (22 m) Maximum Practical Speed 19 mph (30 km/h) 22 mph (35 km/h) 23 mph (38 km/h) 29 mph (47 km/h) 26 mph (42 km/h) 41 mph (66 km/h) 45 mph (72 km/h) 50 mph (80 km/h) 50 mph (80 km/h) Maximum IS Value 9.1 kip-ft (12.3 kj) 12.8 kip-ft (17.3 kj) 14.4 kip-ft (19.5 kj) 22.4 kip-ft (30.4 kj) 17.6 kip-ft (23.9 kj) 44.8 kip-ft (60.7 kj) 53.3 kip-ft (72.3 kj) 65.8 kip-ft (89.2 kj) 65.8 kip-ft (89.2 kj) NCHRP Report 665 Database [36] Capture Percentage Capture Percentage Capture Percentage Based on Speed Based on Energy Based on IS Value (Lower Bound) (Expected Average) (Upper Bound) 2% Non-Adjusted 16% Adjusted 23% Non-Adjusted 37% Adjusted 42% Non-Adjusted 49% Adjusted 8.5% Non-Adjusted 26% Non-Adjusted 45% Non-Adjusted 22% Adjusted 40% Adjusted 52% Adjusted 11% Non-Adjusted 28% Non-Adjusted 46% Non-Adjusted 24% Adjusted 41% Adjusted 53% Adjusted 22% Non-Adjusted 34% Non-Adjusted 52% Non-Adjusted 34% Adjusted 48% Adjusted 59% Adjusted 16% Non-Adjusted 30% Non-Adjusted 49% Non-Adjusted 28% Adjusted 44% Adjusted 55% Adjusted 44% Non-Adjusted 54% Non-Adjusted 70% Non-Adjusted 55% Adjusted 65% Adjusted 75% Adjusted 51% Non-Adjusted 61% Non-Adjusted 76% Non-Adjusted 62% Adjusted 71% Adjusted 82% Adjusted 61% Non-Adjusted 72% Non-Adjusted 86% Non-Adjusted 71% Adjusted 81% Adjusted 91% Adjusted 61% Non-Adjusted 72% Non-Adjusted 86% Non-Adjusted 71% Adjusted 81% Adjusted 91% Adjusted 100% 90% 80% 70% 60% 50% 40% 30% 20% 10% 0% 27-in. (686-mm) Tall Systems without Blockouts, 24-ft (7.3-m) Radii 27-in. (686-mm) Tall Systems without Blockouts, 48-ft (15-m) Radii 27-in. (686-mm) Tall Systems without Blockouts, 72-ft (22-m) Radii 27-in. (686-mm) Tall Systems with Blockouts, 48-ft (15-m) Radii 27-in. (686-mm) Tall Systems with Blockouts, 24-ft (7.3-m) Radii Adjusted Non-Weighted Adjusted Weighted in. (686-mm) Tall Systems with Blockouts, 72-ft (15-m) Radii NCHRP 350 TL-2 Test Conditions and 31-in. (787-mm) Tall Systems with 24-ft (7.3-m) Radii 31-in. (787-mm) Tall Systems with 48- and 72-ft (15- and 22-m) Radii Departure Speed (mph) Figure 143. Distribution of Vehicle Speeds and Expected Lower Bound of Capture Frequency 203
218 Estimated Percentage of Vehicles Captured March 31, 2014 Estimated Percentage of Vehicles Captured 100% 90% 80% 70% 60% 50% 40% 30% 20% 10% 0% 27-in. (686-mm) Tall Systems without Blockouts, 24-ft (7.3-m) Radii 27-in. (686-mm) Tall Systems without Blockouts, 48-ft (15-m) Radii 27-in. (686-mm) Tall Systems without Blockouts, 72-ft (22-m) Radii 27-in. (686-mm) Tall Systems with Blockouts, 48-ft (15-m) Radii 27-in. (686-mm) Tall Systems with Blockouts, 24-ft (7.3-m) Radii 27-in. (686-mm) Tall Systems with Blockouts, 72-ft (15-m) Radii NCHRP 350 TL-2 Test Conditions and 31-in. (787-mm) Tall Systems with 24-ft (7.3-m) Radii Adjusted Non-Weighted Adjusted Weighted NCHRP 350 TL-2 31-in. (787-mm) Tall Systems with 48- and 72-ft (15- and 22-m) Radii IS Value at Departure (kj) Figure 144. Vehicle IS Value at Departure and Expected Upper Bound of Capture Frequency 100% 90% 80% 70% 60% 50% 40% 30% 20% 10% 0% 27-in. (686-mm) Tall Systems without Blockouts, 24-ft (7.3-m) Radii 27-in. (686-mm) Tall Systems without Blockouts, 48-ft (15-m) Radii 27-in. (686-mm) Tall Systems without Blockouts, 72-ft (22-m) Radii 27-in. (686-mm) Tall Systems with Blockouts, 48-ft (15-m) Radii 27-in. (686-mm) Tall Systems with Blockouts, 24-ft (7.3-m) Radii 27-in. (686-mm) Tall Systems with Blockouts, 72-ft (15-m) Radii NCHRP 350 TL-2 Test Conditions and 31-in. (787-mm) Tall Systems with 24-ft (7.3-m) Radii Adjusted Non-Weighted Adjusted Weighted 31-in. (787-mm) Tall Systems with 48- and 72-ft (15- and 22-m) Radii Total Vehicle Energy (kj) Figure 145. Total Vehicle Energy at Departure and Expected Average Guardrail Capture Frequency 204
219 12 SIMULATION OF SYSTEMS WITH 29-IN. (737-MM) MOUNTING HEIGHTS 12.1 Introduction The 31-in. (787-mm tall curved guardrail satisfactorily captured the simulated C2500 pickup truck for many impact conditions. In contrast, the 27-in. (686-mm) tall system rarely captured the simulated vehicle and brought it to a controlled stop. However, in recognition of the risk that may be incurred by raising the guardrail mounting height by 4 in. (102 mm), an alternative large-radii solution with a 29-in. (737-mm) top mounting height was pursued. Although no short-radius guardrail has evern been tested at a top mounting height of 29 in. (737 mm), the geometry and height of a light truck bumper relative to the guardrail indicated likelihood for vehicle redirection or capture. In addition, the lowest practical guardrail height that could still redirect or contain an impacting 2000P light truck vehicle could reduce the propensity for small cars to underride beneath the barrier and maximize overall safety performance. Based on the analysis of guardrail LON and critical impact locations of 27-in. (686-mm) tall systems impacted at 45 mph (72 km/h), simulations were conducted with 29-in. (737-mm) tall W-beam guardrail downstream from the centerpoint of each radius. Impacts upstream from the centerpoint were either less severe than impacts occurring at or downstream from the centerpoint, or resulted in vehicles gating through the end termination. In addition, because blockouts significantly improved the guardrail-to-bumper interactions, 6-in. x 8-in. x 14½-in. (152-mm x 203-mm x 362-mm) blockouts were also added to each of the CRT posts. Blockouts could retain the rail at impact height for a longer amount of time, improving truck performance, while not adversely affecting small car underride potential and reducing the risk of a vehicle s wheel interacting with deflected posts. 205
220 12.2 Generation of 29-in. (737-mm) Tall System Models The 29-in. (737-mm) tall short-radius system models were similar to the 27-in. (686-mm) guardrail models with blockouts. The rail height, transition posts, CRT and BCT posts, guardrail, and stiffening C-channel were all raised by 2 in. (51 mm), and the CRT and BCT holes were shifted downward by 2 in. (51 mm) to be in the same locations as the 27-in. (686-mm) tall system. The end anchorage BCT cable was adjusted for the increased height between the rail anchorage and the post. No other changes were made to the system models Simulation Results Systems with 24-ft (7.3-m) Radius Three simulations were conducted using the 24-ft (7.3-m) radius, corresponding to impacts at post nos. 5, 6, and 7. Impacts upstream from post no. 5 resulted in gating, and so were not critical to the performance of the system. Each impact was simulated with a 4,409-lb (2,000- kg) pickup truck impacting at 45 mph (72 km/h) and 25 degrees. Time-sequential images of the impacts are shown in Figures 146 through 148. Upon impact, the top and bottom rail corrugations flattened around the front of the impacting pickup. The top of the upper corrugation extended above the top surface of the bumper. The bumper was crushed and deflected backward, and the vehicle pitched forward, which enabled the rail to slide upward and become interlocked with the headlight, grill, and radiator locations. Because of this, the vehicle was captured in each of the simulations. System damage was consistent with impacts at both the 27-in. (686-mm) system with blockouts and 31- in. (787-mm) system without blockouts, at similar impact times Systems with 48-ft (15-m) Radius Five simulations were conducted using the 48-ft (15-m) radius, corresponding to impacts at post nos. 9, 10, 11, 12, and 13, and utilized a 4,409-lb (2,000-kg) pickup truck model 206


 Radius System with")
221 Secondary Primary Pre-Impact Pre-Impact sec sec sec sec sec sec sec sec Figure 146. Time-Sequential Images of Impact at Post No. 5, 24-ft (7.3-m) Radius System with 29-in. (737-mm) Mounting Height 207


222 Secondary Primary Pre-Impact Pre-Impact sec sec sec sec sec sec sec sec Figure 147. Time-Sequential Images of Impact at Post No. 6, 24-ft (7.3-m) Radius System with 29-in. (737-mm) Mounting Height 208


 Radius")
223 Secondary Primary Pre-Impact Pre-Impact sec sec sec sec sec sec sec sec Figure 148. Time-Sequential Images of Impact at Post No. 7, 24-ft (7.3-m) Radius System with 29-in. (737-mm) Mounting Height 209
224 impacting at 45 mph (72 km/h) and 25 degrees. Time-sequential images of the impacts are shown in Figures 149 through 153. All five impacts resulted in acceptable vehicle capture. Impact results were similar to results of the 24-ft (7.3-m) radius, because the bottom corrugation flattened and the rail lifted upward to engage the front of the truck after approximately 500 ms. The largest deflections observed in the simulations with a 48-ft (15-m) radius occurred near the center of the nose. Deflections decreased as the vehicle approached the transition to stiff bridge rail, and the pocketing propensity increased, as shown in Figures 152 and 153. However, vehicle decelerations were not excessive and were typically lower during pocketing than during the initial 50-ms of impact Systems with 72-ft (22-m) Radius Four simulations were conducted with a 72-ft (22-m) radius, corresponding to impacts at post nos. 13, 15, 17, and 19 and utilized a 4,409-lb (2,000-kg) pickup truck model impacting at 45 mph (72 km/h) and 25 degrees. As with simulations of the 24-ft (7.3-m) and 28-ft (15-m) radii, the pickup truck was captured after the upper corrugation flattened and shifted above the bumper to become interlocked with the headlight, grill, and radiator locations, at approximately 500 ms. Vehicle deflections were typically less than for impacts with smaller radii. Whereas the impacting truck was still engaged in the system and the vehicle continued to slow longitudinally for smaller-radius systems at approximately 850 ms, the pickup in the larger-radius simulations stopped all longitudinal deflection and was only yawing around the front end at the end for impacts at post nos. 13 and 15. During impact at post no. 17, the vehicle experienced very little yaw displacement, and came to rest after a pocket formed in the rail. The vehicle was redirected during impact at post no


225 Secondary Primary Pre-Impact Pre-Impact sec sec sec sec sec sec sec sec Figure 149. Time-Sequential Images of Impact at Post No. 9, 48-ft (15-m) Radius System with 29-in. (737-mm) Mounting Height 211


 Radius System")
226 Secondary Primary Pre-Impact Pre-Impact sec sec sec sec sec sec sec sec Figure 150. Time-Sequential Images of Impact at Post No. 10, 48-ft (15-m) Radius System with 29-in. (737-mm) Mounting Height 212


227 Secondary Primary Pre-Impact Pre-Impact sec sec sec sec sec sec sec sec Figure 151. Time-Sequential Images of Impact at Post No. 11, 48-ft (15-m) Radius System with 29-in. (737-mm) Mounting Height 213


228 Secondary Primary Pre-Impact Pre-Impact sec sec sec sec sec sec sec sec Figure 152. Time-Sequential Images of Impact at Post No. 12, 48-ft (15-m) Radius System with 29-in. (737-mm) Mounting Height 214


 Mounting Height 215")
229 Secondary Primary Pre-Impact Pre-Impact sec sec sec sec sec sec sec sec Figure 153. Time-Sequential Images of Impact at Post No. 13, 48-ft (15-m) Radius System with 29-in. (737-mm) Mounting Height 215


230 Secondary Primary Pre-Impact Pre-Impact sec sec sec sec sec sec sec sec Figure 154. Time-Sequential Images of Impact at Post No. 9, 72-ft (22-m) Radius System with 29-in. (737-mm) Mounting Height 216


 Mounting Height 217")
231 Secondary Primary Pre-Impact Pre-Impact sec sec sec sec sec sec sec sec Figure 155. Time-Sequential Images of Impact at Post No. 10, 72-ft (22-m) Radius System with 29-in. (737-mm) Mounting Height 217
 Radius System with 29-in.")
232 Secondary Primary Pre-Impact Pre-Impact sec sec sec sec sec sec sec sec Figure 156. Time-Sequential Images of Impact at Post No. 11, 72-ft (22-m) Radius System with 29-in. (737-mm) Mounting Height 218
 Radius System with 29-in.")
233 Secondary Primary Pre-Impact Pre-Impact sec sec sec sec sec sec sec sec Figure 157. Time-Sequential Images of Impact at Post No. 12, 72-ft (22-m) Radius System with 29-in. (737-mm) Mounting Height 219
DEVELOPMENT OF A TRANSITION BETWEEN FREE-STANDING AND REDUCED-DEFLECTION PORTABLE CONCRETE BARRIERS PHASE I
 Research Project Number TPF-5(193) Supplement #78 DEVELOPMENT OF A TRANSITION BETWEEN FREE-STANDING AND REDUCED-DEFLECTION PORTABLE CONCRETE BARRIERS PHASE I Submitted by Mojdeh Asadollahi Pajouh, Ph.D.
CRITICAL FLARE RATES FOR W-BEAM GUARDRAIL DETERMINING MAXIMUM CAPACITY USING COMPUTER SIMULATION NCHRP 17-20(3)
") CRITICAL FLARE RATES FOR W-BEAM GUARDRAIL DETERMINING MAXIMUM CAPACITY USING COMPUTER SIMULATION NCHRP 17-2(3) Submitted by Beau D. Kuipers, B.S.M.E., E.I.T. Graduate Research Assistant Ronald K. Faller,
CRITICAL FLARE RATES FOR W-BEAM GUARDRAIL DETERMINING MAXIMUM CAPACITY USING COMPUTER SIMULATION NCHRP 17-2(3) Submitted by Beau D. Kuipers, B.S.M.E., E.I.T. Graduate Research Assistant Ronald K. Faller,
Development and Implementation of the Simplified MGS Stiffness Transition
 Duplication for publication or sale is strictly prohibited without prior written permission of the Transportation Research Board Paper No. 12-3367 Development and Implementation of the Simplified MGS Stiffness
Midwest Guardrail System Without Blockouts
 Duplication for publication or sale is strictly prohibited without prior written permission of the Transportation Research Board Paper No. 13-0418 Midwest Guardrail System Without Blockouts by John D.
DEFLECTION LIMITS FOR TEMPORARY CONCRETE BARRIERS
 Midwest State s Regional Pooled Fund Research Program Fiscal Year 1998-1999 (Year 9) NDOR Research Project Number SPR-3(017) DEFLECTION LIMITS FOR TEMPORARY CONCRETE BARRIERS Submitted by Dean L. Sicking,
Evaluation of the Midwest Guardrail System Stiffness Transition with Curb
 Duplication for publication or sale is strictly prohibited without prior written permission of the Transportation Research Board Paper No. -0 Evaluation of the Midwest Guardrail System Stiffness Transition
INCREASED SPAN LENGTH FOR THE MGS LONG-SPAN GUARDRAIL SYSTEM PART III: FAILURE ANALYSIS
 Midwest States Pooled Fund Research Program Fiscal Years 2013 (Years 23) Research Project Number TPF-5(193) Supplement #56 NDOR Sponsoring Agency Code RPFP-13-MGS-3 INCREASED SPAN LENGTH FOR THE MGS LONG-SPAN
Advances in Simulating Corrugated Beam Barriers under Vehicular Impact
 13 th International LS-DYNA Users Conference Session: Automotive Advances in Simulating Corrugated Beam Barriers under Vehicular Impact Akram Abu-Odeh Texas A&M Transportation Institute Abstract W-beam
DEVELOPMENT OF A MASH TL-3 TRANSITION BETWEEN GUARDRAIL AND PORTABLE CONCRETE BARRIERS
 Duplication for publication or sale is strictly prohibited without prior written permission of the Transportation Research Board Paper No. 17-01712 DEVELOPMENT OF A MASH TL-3 TRANSITION BETWEEN GUARDRAIL
Evaluation of the Midwest Guardrail System stiffness transition with curb
 University of Nebraska - Lincoln DigitalCommons@University of Nebraska - Lincoln Civil Engineering Faculty Publications Civil Engineering 2016 Evaluation of the Midwest Guardrail System stiffness transition
PR V2. Submitted by. Professor MIDWEST Vine Street (402) Submitted to
 Submitted to") FINAL REPORT PR4893118-V2 ZONE OF INTRUSION STUDY Submitted by John D. Reid, Ph.D. Professor Dean L.. Sicking, Ph.D., P.E. Professorr and MwRSF Director MIDWEST ROADSIDE SAFETY FACILITY University of Nebraska-Lincoln
FINAL REPORT PR4893118-V2 ZONE OF INTRUSION STUDY Submitted by John D. Reid, Ph.D. Professor Dean L.. Sicking, Ph.D., P.E. Professorr and MwRSF Director MIDWEST ROADSIDE SAFETY FACILITY University of Nebraska-Lincoln
Research Project Number SPR-P1(13)M326 DEVELOPMENT OF A MASH TL-3 TRANSITION BETWEEN GUARDRAIL AND PORTABLE CONCRETE BARRIERS.
M326 DEVELOPMENT OF A MASH TL-3 TRANSITION BETWEEN GUARDRAIL AND PORTABLE CONCRETE BARRIERS.") Research Project Number SPR-P1(13)M326 DEVELOPMENT OF A MASH TL-3 TRANSITION BETWEEN GUARDRAIL AND PORTABLE CONCRETE BARRIERS Submitted by David A. Gutierrez, B.S.C.E., E.I.T. Graduate Research Assistant
Research Project Number SPR-P1(13)M326 DEVELOPMENT OF A MASH TL-3 TRANSITION BETWEEN GUARDRAIL AND PORTABLE CONCRETE BARRIERS Submitted by David A. Gutierrez, B.S.C.E., E.I.T. Graduate Research Assistant
TEST MATRICES FOR EVALUATING CABLE MEDIAN BARRIERS PLACED IN V-DITCHES
 Midwest States Regional Pooled Fund Research Program Fiscal Year 2012 (Year 22) Research Project Number TPF-5(193) Supplement #44 NDOR Sponsoring Agency Code RPFP-12-CABLE1&2 TEST MATRICES FOR EVALUATING
MINIMUM EFFECTIVE LENGTH FOR THE MIDWEST GUARDRAIL SYSTEM
 Duplication for publication or sale is strictly prohibited without prior written permission of the Transportation Research Board Paper No. 15-0484 MINIMUM EFFECTIVE LENGTH FOR THE MIDWEST GUARDRAIL SYSTEM
INCREASED SPAN LENGTH FOR THE MGS LONG-SPAN GUARDRAIL SYSTEM
 University of Nebraska - Lincoln DigitalCommons@University of Nebraska - Lincoln Mechanical (and Materials) Engineering -- Dissertations, Theses, and Student Research Mechanical & Materials Engineering,
Manual for Assessing Safety Hardware
 American Association of State Highway and Transportation Officials Manual for Assessing Safety Hardware 2009 vii PREFACE Effective traffic barrier systems, end treatments, crash cushions, breakaway devices,
1962: HRCS Circular 482 one-page document, specified vehicle mass, impact speed, and approach angle for crash tests.
 1 2 3 1962: HRCS Circular 482 one-page document, specified vehicle mass, impact speed, and approach angle for crash tests. 1973: NCHRP Report 153 16-page document, based on technical input from 70+ individuals
Continued Development of a Non-Proprietary, High-Tension, Cable End Terminal System
 University of Nebraska - Lincoln DigitalCommons@University of Nebraska - Lincoln Nebraska Department of Transportation Research Reports Nebraska LTAP 4-29-2016 Continued Development of a Non-Proprietary,
AASHTO Manual for Assessing Safety Hardware, AASHTO/FHWA Joint Implementation Plan Standing Committee on Highways September 24, 2015
 AASHTO Manual for Assessing Safety Hardware, 2015 AASHTO/FHWA Joint Implementation Plan Standing Committee on Highways September 24, 2015 Full Scale MASH Crash Tests (NCHRP 22-14(02)) Conducted several
Crash Testing Growth Common Roadside Hardware Systems Draft FHWA and AASHTO Requirements for Implementing MASH 2015
 64 th Annual Illinois Traffic Safety and Engineering Conference October 14, 2015 Crash Testing Growth Common Roadside Hardware Systems Draft FHWA and AASHTO Requirements for Implementing MASH 2015 1 https://www.youtube.com/watch?feature
SUMMARY CHANGES FOR NCHRP REPORT 350 GUIDELINES [NCHRP (02)] Keith A. Cota, Chairman Technical Committee on Roadside Safety June 14, 2007
![SUMMARY CHANGES FOR NCHRP REPORT 350 GUIDELINES [NCHRP (02)] Keith A. Cota, Chairman Technical Committee on Roadside Safety June 14, 2007](/thumbs/87/97351925.jpg "SUMMARY CHANGES FOR NCHRP REPORT 350 GUIDELINES [NCHRP (02)] Keith A. Cota, Chairman Technical Committee on Roadside Safety June 14, 2007") SUMMARY CHANGES FOR NCHRP REPORT 350 GUIDELINES [NCHRP 22-14 (02)] Keith A. Cota, Chairman Technical Committee on Roadside Safety June 14, 2007 BACKGROUND Circular 482 (1962) First full scale crash test
SUMMARY CHANGES FOR NCHRP REPORT 350 GUIDELINES [NCHRP 22-14 (02)] Keith A. Cota, Chairman Technical Committee on Roadside Safety June 14, 2007 BACKGROUND Circular 482 (1962) First full scale crash test
SAFETY PERFORMANCE OF WORK-ZONE DEVICES UNDER MASH TESTING
 SAFETY PERFORMANCE OF WORK-ZONE DEVICES UNDER MASH TESTING Schmidt, Faller, Lechtenberg, Sicking, Holloway Midwest Roadside Safety Facility Nebraska Transportation Center University of Nebraska-Lincoln
Cable-to-Post Attachments for Use in Non- Proprietary High-Tension Cable Median Barrier Phase II
 University of Nebraska - Lincoln DigitalCommons@University of Nebraska - Lincoln Nebraska Department of Transportation Research Reports Nebraska LTAP 3-24-2016 Cable-to-Post Attachments for Use in Non-
A MASH Compliant W-Beam Median Guardrail System
 0 0 0 0 0 A MASH Compliant W-Beam Median Guardrail System By A. Y. Abu-Odeh, R. P. Bligh, W. Odell, A. Meza, and W. L. Menges Submitted: July 0, 0 Word Count:, + ( figures + tables=,000) =, words Authors:
PERFORMANCE EVALUATION OF THE MODIFIED G4(1S) GUARDRAIL UPDATE TO NCHRP 350 TEST NO WITH 28" C.G. HEIGHT (2214WB-2)
 GUARDRAIL UPDATE TO NCHRP 350 TEST NO WITH 28 C.G. HEIGHT (2214WB-2)") PERFORMANCE EVALUATION OF THE MODIFIED G4(1S) GUARDRAIL UPDATE TO NCHRP 350 TEST NO. 3-11 WITH 28" C.G. HEIGHT (2214WB-2) Submitted by Karla A. Polivka, M.S.M.E., E.I.T. Research Associate Engineer Dean
PERFORMANCE EVALUATION OF THE MODIFIED G4(1S) GUARDRAIL UPDATE TO NCHRP 350 TEST NO. 3-11 WITH 28" C.G. HEIGHT (2214WB-2) Submitted by Karla A. Polivka, M.S.M.E., E.I.T. Research Associate Engineer Dean
SGR52 TOP-MOUNTED WEAK-POST GUARDRAIL ATTACHED TO CULVERT PLAN VIEW ELEVATION VIEW DETAIL B DETAIL A SHEET NO. DATE: 37 1/2" 953 (TYP) 150" 3810
 150 3810") PLAN VIEW C 150" 3810 37 1/2" 953 (TYP) A B C 8-FBB01 RWB01a FWR01 RWM04a FWR01 RWB01a RWM04a PSF01 FBX08a PSF01 FBX08a DETAIL A DETAIL B 1 of 7 12/5/2016 INTENDED USE The Top-Mounted Weak-Post Guardrail
PLAN VIEW C 150" 3810 37 1/2" 953 (TYP) A B C 8-FBB01 RWB01a FWR01 RWM04a FWR01 RWB01a RWM04a PSF01 FBX08a PSF01 FBX08a DETAIL A DETAIL B 1 of 7 12/5/2016 INTENDED USE The Top-Mounted Weak-Post Guardrail
Sponsored by Roadside Safety Research Program Pooled Fund Study
 Proving Ground Report No. 405160-10 Report Date: August 2010 EVALUATION OF EXISTING T-INTERSECTION GUARDRAIL SYSTEMS FOR EQUIVALENCY WITH NCHRP REPORT 350 TL-2 TEST CONDITIONS by Akram Y. Abu-Odeh Associate
Evaluation of Barriers for Very High Speed Roadways
 TTI: 0-6071 Evaluation of Barriers for Very High Speed Roadways ISO 17025 Laboratory Testing Certificate # 2821.01 Crash testing performed at: TTI Proving Ground 3100 SH 47, Building 7091 Bryan, TX 77807
Implementation of AASHTO s Manual for Assessing Safety Hardware (MASH) 2016
 2016") Implementation of AASHTO s Manual for Assessing Safety Hardware (MASH) 2016 Update from the Technical Committee on Roadside Safety Keith Cota, New Hampshire DOT MASH 2016 Overview Background Ballot Results/Dates
Implementation of AASHTO s Manual for Assessing Safety Hardware (MASH) 2016 Update from the Technical Committee on Roadside Safety Keith Cota, New Hampshire DOT MASH 2016 Overview Background Ballot Results/Dates
Development and Validation of a Finite Element Model of an Energy-absorbing Guardrail End Terminal
 Development and Validation of a Finite Element Model of an Energy-absorbing Guardrail End Terminal Yunzhu Meng 1, Costin Untaroiu 1 1 Department of Biomedical Engineering and Virginia Tech, Blacksburg,
Evaluation and Design of ODOT s Type 5 Guardrail with Tubular Backup
 Evaluation and Design of ODOT s Type 5 Guardrail with Tubular Backup Draft Final Report Chuck A. Plaxico, Ph.D. James C. Kennedy, Jr., Ph.D. Charles R. Miele, P.E. for the Ohio Department of Transportation
TEXAS TRANSPORTATION INSTITUTE THE TEXAS A & M UNIVERSITY SYSTEM COLLEGE STATION, TEXAS 77843
 NCHRP REPORT 350 ASSESSMENT OF EXISTING ROADSIDE SAFETY HARDWARE by C. Eugene Buth, P.E. Senior Research Engineer Wanda L. Menges Associate Research Specialist and Sandra K. Schoeneman Research Associate
METAL BEAM GUARDFENCE TRANSITION AND END TREATMENT IDENTIFICATION GUIDE
 2016 TxDOT Design Division METAL BEAM GUARDFENCE TRANSITION AND END TREATMENT IDENTIFICATION GUIDE A guide to help TxDOT employees identify metal beam guardfence transitions and end treatments for the
Technical Report Documentation Page 2. Government Accession No. 3. Recipient's Catalog No. 1. Report No. FHWA/TX-09/
 1. Report No. FHWA/TX-09/0-6071-1 4. Title and Subtitle ANALYSIS OF ROADSIDE SAFETY DEVICES FOR USE ON VERY HIGH-SPEED ROADWAYS Technical Report Documentation Page 2. Government Accession No. 3. Recipient's
Assessing Options for Improving Roadside Barrier Crashworthiness
 13 th International LS-DYNA Users Conference Session: Simulation Assessing Options for Improving Roadside Barrier Crashworthiness D. Marzougui, C.D. Kan, and K.S. Opiela Center for Collision Safety and
OPTIMIZATION OF THRIE BEAM TERMINAL END SHOE CONNECTION
 TTI: 9-1002-15 OPTIMIZATION OF THRIE BEAM TERMINAL END SHOE CONNECTION ISO 17025 Laboratory Testing Certificate # 2821.01 Pendulum testing performed at: TTI Proving Ground 3100 SH 47, Building 7091 Bryan,
Slotted Rail Guardrail Terminal
 TRANSPORTATION RESEARCH RECORD 1500 43 Slotted Rail Guardrail Terminal KING K. MAK, ROGER P. BLIGH, HAYES E. Ross, JR., AND DEAN L. SICKING A slotted rail terminal (SRT) for W-beam guardrails was successfully
MASH 2016 Implementation: What, When and Why
 MASH 2016 Implementation: What, When and Why Roger P. Bligh, Ph.D., P.E. Senior Research Engineer Texas A&M Transportation Institute June 7, 2016 2016 Traffic Safety Conference College Station, Texas Outline
safedirection.com.au Ref: PM 017/02
 DISTRIBUTOR 0 Product Manual Ref: PM 017/02 Table of Contents 1.0 Introduction... 3 2.0 The... 3 3.0 How the Functions... 4 4.0 Crash Test Performance... 4 5.0 Characteristics of Terminals... 5 5.1 Gating
VULCAN BARRIER TL-3 GENERAL SPECIFICATIONS
 VULCAN BARRIER TL-3 GENERAL SPECIFICATIONS I. GENERAL A. The VULCAN BARRIER TL-3 (VULCAN TL-3) shall be a highly portable and crashworthy longitudinal barrier especially suited for use as a temporary barrier
Crash Performance of Strong-Post W-Beam Guardrail with Missing Blockouts Carolyn E. Hampton and Hampton C. Gabler
 Crash Performance of Strong-Post W-Beam Guardrail with Missing Blockouts Carolyn E. Hampton and Hampton C. Gabler Virginia Tech Center for Injury Biomechanics, Blacksburg VA 24061 Abstract Missing blockouts
W-Beam Approach Treatment at Bridge Rail Ends Near Intersecting Roadways
 TRANSPORTATION RESEARCH RECORD 1133 51 W-Beam Approach Treatment at Bridge Rail Ends Near Intersecting Roadways M. E. BRONSTAD, M. H. RAY, J. B. MAYER, JR., AND c. F. MCDEVITT This paper is concerned with
Development of a TL-5 Vertical Faced Concrete Median Barrier Incorporating Head Ejection Criteria
 Midwest States Regional Pooled Fund Research Program Fiscal Year 2004-2005 (Year 15) Research Project Number SPR-3(017) NDOR Sponsoring Agency Code RPFP-05-01 Development of a TL-5 Vertical Faced Median
CRASH TEST OF MILE POST MARKER. T. J. Hirsch Research Engineer. and. Eugene Buth Assistant Research Engineer. Research Report Number 146-8
 CRASH TEST OF MILE POST MARKER by T. J. Hirsch Research Engineer and Eugene Buth Assistant Research Engineer Research Report Number 146-8 Studies of Field Adaption of Impact Attenuation Systems Research
MASH TEST 3-10 ON 31-INCH W-BEAM GUARDRAIL WITH STANDARD OFFSET BLOCKS
 TTI: 9-1002 MASH TEST 3-10 ON 31-INCH W-BEAM GUARDRAIL WITH STANDARD OFFSET BLOCKS ISO 17025 Laboratory Testing Certificate # 2821.01 Crash testing performed at: TTI Proving Ground 3100 SH 47, Building
PERFORMANCE EVALUATION OF THE FREE-STANDING TEMPORARY BARRIER UPDATE TO NCHRP 350 TEST NO WITH 28" C.G. HEIGHT (2214TB-2)
") PERFORMANCE EVALUATION OF THE FREE-STANDING TEMPORARY BARRIER UPDATE TO NCHRP 350 TEST NO. 3-11 WITH 28" C.G. HEIGHT (2214TB-2) Submitted by Karla A. Polivka, M.S.M.E., E.I.T. Research Associate Engineer
PERFORMANCE EVALUATION OF THE FREE-STANDING TEMPORARY BARRIER UPDATE TO NCHRP 350 TEST NO. 3-11 WITH 28" C.G. HEIGHT (2214TB-2) Submitted by Karla A. Polivka, M.S.M.E., E.I.T. Research Associate Engineer
Analysis of Existing Work-Zone Sign Supports Using Manual for Assessing Safety Hardware Safety Performance Criteria
 University of Nebraska - Lincoln DigitalCommons@University of Nebraska - Lincoln Civil Engineering Faculty Publications Civil Engineering 2011 Analysis of Existing Work-Zone Sign Supports Using Manual
PERFORMANCE EVALUATION OF THE PERMANENT NEW JERSEY SAFETY SHAPE BARRIER UPDATE TO NCHRP 350 TEST NO (2214NJ-2)
") PERFORMANCE EVALUATION OF THE PERMANENT NEW JERSEY SAFETY SHAPE BARRIER UPDATE TO NCHRP 350 TEST NO. 4-12 (2214NJ-2) Submitted by Karla A. Polivka, M.S.M.E., E.I.T. Research Associate Engineer Dean L.
PERFORMANCE EVALUATION OF THE PERMANENT NEW JERSEY SAFETY SHAPE BARRIER UPDATE TO NCHRP 350 TEST NO. 4-12 (2214NJ-2) Submitted by Karla A. Polivka, M.S.M.E., E.I.T. Research Associate Engineer Dean L.
Product Specification. ABSORB 350 TM TL-2 Non-Redirective, Gating, Crash Cushion Applied to Quickchange Moveable Barrier
 TB 000612 Rev. 0 Page 1 of 9 Product Specification ABSORB 350 TM TL-2 Non-Redirective, Gating, Crash Cushion Applied to Quickchange Moveable Barrier I. General The ABSORB 350 TM TL-2 System is a Non-Redirective,
Texas Transportation Institute The Texas A&M University System College Station, Texas
 1. Report No. FHWA/TX-07/0-5527-1 4. Title and Subtitle DEVELOPMENT OF A LOW-PROFILE TO F-SHAPE TRANSITION BARRIER SEGMENT 2. Government Accession No. 3. Recipient's Catalog No. Technical Report Documentation
VULCAN BARRIER TL-3 GENERAL SPECIFICATIONS
 VULCAN BARRIER TL-3 GENERAL SPECIFICATIONS I. GENERAL A. The VULCAN BARRIER TL-3 (VULCAN TL-3) shall be a highly portable and crashworthy longitudinal barrier especially suited for use as a temporary barrier
TRACC. Trinity Attenuating Crash Cushion
 TRACC Trinity Attenuating Crash Cushion CSP Pacific Business Unit of Fletcher Concrete & Infrastructure Limited 306 Neilson Street Onehunga, Auckland Phone: (09) 634 1239 or 0800 655 200 Fax: (09) 634
Illinois Safety Program IDOT District ATSSA Workshop
 Illinois Safety Program IDOT District ATSSA Workshop Roadway Departure & MASH DRAFT IDOT Facilitator: Dave Piper ATSSA Facilitator: Jim Thonn 1 Illinois Emphasis Area Priority Pyramid 2 Fatalities and
Form DOT F (8-72) Texas Transportation Institute The Texas A&M University System College Station, Texas
 Texas Transportation Institute The Texas A&M University System College Station, Texas") 1. Report No. FHWA/TX-02/4162-1 Technical Report Documentation Page 2. Government Accession No. 3. Recipient's Catalog No. 4. Title and Subtitle EVALUATION OF TEXAS GRID-SLOT PORTABLE CONCRETE BARRIER
1. Report No. FHWA/TX-02/4162-1 Technical Report Documentation Page 2. Government Accession No. 3. Recipient's Catalog No. 4. Title and Subtitle EVALUATION OF TEXAS GRID-SLOT PORTABLE CONCRETE BARRIER
BarrierGate. General Specifications. Manual Operations General Specifications
 BarrierGate General Specifications Manual Operations General Specifications BarrierGate GENERAL SPECIFICATIONS I. GENERAL A. The BarrierGate system (the gate) shall be designed and manufactured by Energy
Development of Turning Templates for Various Design Vehicles
 Transportation Kentucky Transportation Center Research Report University of Kentucky Year 1991 Development of Turning Templates for Various Design Vehicles Kenneth R. Agent Jerry G. Pigman University of
PERFORMANCE EVALUATION OF THE FREE-STANDING TEMPORARY BARRIER UPDATE TO NCHRP 350 TEST NO (2214TB-1)
") PERFORMANCE EVALUATION OF THE FREE-STANDING TEMPORARY BARRIER UPDATE TO NCHRP 350 TEST NO. 3-11 (2214TB-1) Submitted by Karla A. Polivka, M.S.M.E., E.I.T. Research Associate Engineer Dean L. Sicking, Ph.D.,
PERFORMANCE EVALUATION OF THE FREE-STANDING TEMPORARY BARRIER UPDATE TO NCHRP 350 TEST NO. 3-11 (2214TB-1) Submitted by Karla A. Polivka, M.S.M.E., E.I.T. Research Associate Engineer Dean L. Sicking, Ph.D.,
John Rohde, Ph.D., P.E. Associate Professor Department of Civil Engineering University of Nebraska-Lincoln
 Report # MATC-UNL: 222 Final Report 25-1121-1-222 Development of a Socketed Foundation for Cable Barrier Posts - Phase I John Rohde, Ph.D., P.E. Associate Professor Department of Civil Engineering University
Universal TAU-IIR Redirective, Non-Gating, Crash Cushion
 TB 110927 Rev. 0 Page 1 of 5 Product Specification Universal TAU-IIR Redirective, Non-Gating, Crash Cushion I. General The Universal TAU-IIR system is a Redirective, Non-Gating Crash Cushion in accordance
Development of Iowa Dot Combination Bridge Separation Barrier with Bicycle Railing
 University of Nebraska - Lincoln DigitalCommons@University of Nebraska - Lincoln Engineering Mechanics Dissertations & Theses Mechanical & Materials Engineering, Department of 8-2018 Development of Iowa
Development of a Slotted-Rail Breakaway Cable Terminal
 TRANSPORTATION RESEA RCH RECORD 1233 65 Development of a Slotted-Rail Breakaway Cable Terminal DEAN L. SICKING, ASIF B. QuRESHY, AND HAYES E. Ross, JR. Development of the Slotted-Rail Breakaway Cable Terminal
Guardrail/Bridgerail Recommendations for Very Low Volume Local Roads in Kansas
 Guardrail/Bridgerail Recommendations for Very Low Volume Local Roads in Kansas MINK Conference September 20, 2017 Ronald J. Seitz, P.E. and Tod Salfrank The Problem The Local Road System in Kansas is Very
Improving Roadside Safety by Computer Simulation
 A2A04:Committee on Roadside Safety Features Chairman: John F. Carney, III, Worcester Polytechnic Institute Improving Roadside Safety by Computer Simulation DEAN L. SICKING, University of Nebraska, Lincoln
STI Project: Barrier Systems, Inc. RTS-QMB Longitudinal Barrier. Page 38 of 40 QBOR1. Appendix F (Continued) Figure F-3
 Figure F-3") Barrier Systems, Inc. RTS-QMB Longitudinal Barrier STI Project: QBOR1 Page 38 of 40 Appendix F (Continued) Figure F-3 t=.500sec 115 meters overall 37.1 Impact Severity (kj).. 141.6 Angle (deg).. 25 Speed
Barrier Systems, Inc. RTS-QMB Longitudinal Barrier STI Project: QBOR1 Page 38 of 40 Appendix F (Continued) Figure F-3 t=.500sec 115 meters overall 37.1 Impact Severity (kj).. 141.6 Angle (deg).. 25 Speed
MASH TEST 3-37 OF THE TxDOT 31-INCH W-BEAM DOWNSTREAM ANCHOR TERMINAL
 TTI: 9-1002 MASH TEST 3-37 OF THE TxDOT 31-INCH W-BEAM DOWNSTREAM ANCHOR TERMINAL ISO 17025 Laboratory Testing Certificate # 2821.01 Crash testing performed at: TTI Proving Ground 3100 SH 47, Building
DEVELOPMENT OF A MASH TL-3 MEDIAN BARRIER GATE
 TTI: 9-1002 DEVELOPMENT OF A MASH TL-3 MEDIAN BARRIER GATE ISO 17025 Laboratory Testing Certificate # 2821.01 Crash testing performed at: TTI Proving Ground 3100 SH 47, Building 7091 Bryan, TX 77807 Research/Test
NTC. Cable Median Barrier Failure Analysis and Prevention
 Nebraska Transportation Center Report # TRP-03-275-12 Final Report 25-1121-0001-428 Cable Median Barrier Failure Analysis and Prevention Dean L. Sicking, Ph.D., P.E. Professor Department of Civil Engineering
COMPARISON OF THE IMPACT PERFORMANCE OF THE G4(1W) AND G4(2W) GUARDRAIL SYSTEMS UNDER NCHRP REPORT 350 TEST 3-11 CONDITIONS
 AND G4(2W) GUARDRAIL SYSTEMS UNDER NCHRP REPORT 350 TEST 3-11 CONDITIONS") Paper No. 00-0525 COMPARISON OF THE IMPACT PERFORMANCE OF THE G4(1W) AND G4(2W) GUARDRAIL SYSTEMS UNDER NCHRP REPORT 350 TEST 3-11 CONDITIONS by Chuck A. Plaxico Associate Research Engineer Worcester Polytechnic
Paper No. 00-0525 COMPARISON OF THE IMPACT PERFORMANCE OF THE G4(1W) AND G4(2W) GUARDRAIL SYSTEMS UNDER NCHRP REPORT 350 TEST 3-11 CONDITIONS by Chuck A. Plaxico Associate Research Engineer Worcester Polytechnic
Technical Report Documentation Page Form DOT F (8-72) Reproduction of completed page authorized
 Reproduction of completed page authorized") 1. Report No. FHWA/TX-05/0-4162-3 4. Title and Subtitle 2. Government Accession No. 3. Recipient's Catalog No. DEVELOPMENT OF LOW-DEFLECTION PRECAST CONCRETE ARRIER 5. Report Date January 2005 Technical
1. Report No. FHWA/TX-05/0-4162-3 4. Title and Subtitle 2. Government Accession No. 3. Recipient's Catalog No. DEVELOPMENT OF LOW-DEFLECTION PRECAST CONCRETE ARRIER 5. Report Date January 2005 Technical
FHWA/IN/JTRP-2000/23. Final Report. Sedat Gulen John Nagle John Weaver Victor Gallivan
 FHWA/IN/JTRP-2000/23 Final Report DETERMINATION OF PRACTICAL ESALS PER TRUCK VALUES ON INDIANA ROADS Sedat Gulen John Nagle John Weaver Victor Gallivan December 2000 Final Report FHWA/IN/JTRP-2000/23 DETERMINATION
VERIFICATION & VALIDATION REPORT of MGS Barrier Impact with 1100C Vehicle Using Toyota Yaris Coarse FE Model
 VERIFICATION & VALIDATION REPORT of MGS Barrier Impact with 1100C Vehicle Using Toyota Yaris Coarse FE Model CCSA VALIDATION/VERIFICATION REPORT Page 1 of 4 Project: CCSA Longitudinal Barriers on Curved,
High Tension Cable Barrier
 High Tension Cable Barrier (and Rumble Strips) Practices & Guidelines 2017 Tri-Party Transportation Conference Red Deer, Alberta Hal Cook, P. Eng. Design, Project Management and Training Section Technical
Development of Combination Pedestrian-Traffic Bridge Railings
 TRANSPORTATION RESEARCH RECORD 1468 41 Development of Combination Pedestrian-Traffic Bridge Railings D. LANCE BULLARD, JR., WANDA L. MENGES, AND C. EUGENE BUTH Two bridge railing designs have been developed
800 Access Control, R/W Use Permits and Drive Design
 Table of Contents 801 Access Control... 8-1 801.1 Access Control Directives... 8-1 801.2 Access Control Policies... 8-1 801.2.1 Interstate Limited Access... 8-1 801.2.2 Limited Access... 8-1 801.2.3 Controlled
Midwest Roadside Safety Facility
 Downstream End Upstream End 28 Spaces @ 75" [05] = 175'-0" [53340] 29 28 27 26 25 24 23 22 21 20 18 17 16 15 14 13 12 11 10 9 8 7 6 5 4 3 2 1 25 75" 05 (Typ.) Impact 2270P PLAN VIEW a6 a5 a4 a3 a4 a4 a4
DISTRIBUTION: Electronic Recipients List TRANSMITTAL LETTER NO. (15-01) MINNESOTA DEPARTMENT OF TRANSPORTATION. MANUAL: Road Design English Manual
 MINNESOTA DEPARTMENT OF TRANSPORTATION. MANUAL: Road Design English Manual") DISTRIBUTION: Electronic Recipients List MINNESOTA DEPARTMENT OF TRANSPORTATION DEVELOPED BY: Design Standards Unit ISSUED BY: Office of Project Management and Technical Support TRANSMITTAL LETTER NO.
DISTRIBUTION: Electronic Recipients List MINNESOTA DEPARTMENT OF TRANSPORTATION DEVELOPED BY: Design Standards Unit ISSUED BY: Office of Project Management and Technical Support TRANSMITTAL LETTER NO.
Texas Transportation Institute The Texas A&M University System College Station, Texas
 1. Report No. FHWA/TX-05/9-8132-P7 4. Title and Subtitle TL-4 CRASH TESTING OF THE F411 BRIDGE RAIL 2. Government Accession No. 3. Recipient's Catalog No. 5. Report Date October 2004 Technical Report Documentation
Guide Rail Safety Symposium
 Ministry of Transportation Guide Rail Safety Symposium MTO Provincial Roadside Safety Update Mark C. Ayton, P. Eng. Senior Engineer, Highway Design MTO Highway Standards Branch MTO Provincial Roadside
NCHRP Report 350 Test 4-12 of the Modified Thrie Beam Guardrail
 NCHRP Report 350 Test 4-12 of the Modified Thrie Beam Guardrail PUBLICATION NO. FHWA-RD-99-065 DECEMBER 1999 Research, Development, and Technology Turner-Fairbank Highway Research Center 6300 Georgetown
MASH TEST 3-21 ON TL-3 THRIE BEAM TRANSITION WITHOUT CURB
 TTI: 9-1002-12 MASH TEST 3-21 ON TL-3 THRIE BEAM TRANSITION WITHOUT CURB ISO 17025 Laboratory Testing Certificate # 2821.01 Crash testing performed at: TTI Proving Ground 3100 SH 47, Building 7091 Bryan,
W-Beam Guiderail Transition from Light to Heavy Posts
 TRANSPORTATION RESEARCH RECORD 1198 55 W-Beam Guiderail Transition from Light to Heavy Posts DONALD G. HERRING AND JAMES E. BRYDEN Two full-scale crash tests evaluated a transition between lightand heavy-post
Virginia Department of Transportation
 TEST REPORT FOR: Virginia Department of Transportation SKT SP 350 50 (15.24 m) System PREPARED FOR: Virginia Department of Transportation 1401 E. Broad St. Richmond, VA 23219 TEST REPORT NUMBER: REPORT
July 17, In Reply Refer To: HSSD/B-176A
 July 17, 2008 1200 New Jersey Avenue, SE. Washington, DC 20590 In Reply Refer To: HSSD/B-176A Mr. John Addy Hill & Smith Springvale Business and Industrial Park Bliston, Wolverhampton, West Midlands, UK,
Development of a Finite Element Model of a Motorcycle
 Development of a Finite Element Model of a Motorcycle N. Schulz, C. Silvestri Dobrovolny and S. Hurlebaus Texas A&M Transportation Institute Abstract Over the past years, extensive research efforts have
Performance Based Design for Bridge Piers Impacted by Heavy Trucks
 Performance Based Design for Bridge Piers Impacted by Heavy Trucks Anil K. Agrawal, Ph.D., P.E., Ran Cao and Xiaochen Xu The City College of New York, New York, NY Sherif El-Tawil, Ph.D. University of
July 10, Refer to: HSA-10/CC-78A
 July 10, 2003 Refer to: HSA-10/CC-78A Barry D. Stephens, P.E. Senior Vice President of Engineering ENERGY ABSORPTION Systems, Inc. 3617 Cincinnati Avenue Rocklin, California 95765 Dear Mr. Stephens: Your
CABLE BARRIER LITERATURE REVIEW
 CABLE BARRIER LITERATURE REVIEW Submitted by Brain A. Coon, M.S.C.E., P.E. Graduate Research Assistant Ronald K. Faller, Ph.D., P.E. Research Assistant Professor John D. Reid, Ph.D. Associate Professor
REPORT NO. TR-P NC SAFETY COMPLIANCE TESTING FOR FMVSS 223 REAR IMPACT GUARDS 2007 TRANSFREIGHT TECHNOLOGY NHTSA NO.
 REPORT NO. SAFETY COMPLIANCE TESTING FOR FMVSS 223 REAR IMPACT GUARDS 2007 TRANSFREIGHT TECHNOLOGY NHTSA NO. RIG 009 PREPARED BY: KARCO ENGINEERING, LLC. 9270 HOLLY ROAD ADELANTO, CALIFORNIA 92301 SEPTEMBER
June 5, In Reply Refer To: HSSD/B-178. Mr. Kevin K. Groeneweg Mobile Barriers LLC Genesee Trail Road Golden, CO Dear Mr.
 June 5, 2008 1200 New Jersey Avenue, SE. Washington, DC 20590 In Reply Refer To: HSSD/B-178 Mr. Kevin K. Groeneweg Mobile Barriers LLC 24918 Genesee Trail Road Golden, CO 80401 Dear Mr. Groeneweg: This
Impact analysis of a vertical flared back bridge rail-to-guardrail transition structure using simulation
 Finite Elements in Analysis and Design 41 (2005) 371 396 www.elsevier.com/locate/finel Impact analysis of a vertical flared back bridge rail-to-guardrail transition structure using simulation Ali O. Atahan,
June 27, In Reply Refer To: HSSD/B-176
 June 27, 2008 1200 New Jersey Avenue, SE. Washington, DC 20590 In Reply Refer To: HSSD/B-176 Mr. John Addy Hill & Smith Springvale Business and Industrial Park Bliston, Wolverhampton, West Midlands, UK,
April 22, In Reply Refer To: HSA-10/WZ-206. Mr. Jan Miller TrafFix Devices 220 Calle Pintoresco San Clemente, California Dear Mr.
 April 22, 2005 400 Seventh St., S.W. Washington, D.C. 20590 In Reply Refer To: HSA-10/WZ-206 Mr. Jan Miller TrafFix Devices 220 Calle Pintoresco San Clemente, California 92672 Dear Mr. Miller: Thank you
REPORT NUMBER: 111-MGA SAFETY COMPLIANCE TESTING FOR FMVSS NO. 111 SCHOOL BUS REARVIEW MIRRORS
 REPORT NUMBER: 111-MGA-05-003 SAFETY COMPLIANCE TESTING FOR FMVSS NO. 111 SCHOOL BUS REARVIEW MIRRORS Les Entreprises Michel Corbeil Inc. 2004 Corbeil 30 Passenger School Bus NHTSA No. C40902 PREPARED
February 8, In Reply Refer To: HSSD/CC-104
 February 8, 2008 200 New Jersey Avenue, SE. Washington, DC 20590 In Reply Refer To: HSSD/CC-04 Barry D. Stephens, P.E. Sr. Vice President Engineering Energy Absorption Systems, Inc. 367 Cincinnati Avenue
MASH Test 3-11 on the T131RC Bridge Rail
 TTI: 9-1002-12 MASH Test 3-11 on the T131RC Bridge Rail ISO 17025 Laboratory Testing Certificate # 2821.01 Crash testing performed at: TTI Proving Ground 3100 SH 47, Building 7091 Bryan, TX 77807 Test
Evaluating The Relevancy Of Current Crash Test Guidelines For Roadside Safety Barriers On High Speed Roads
 Evaluating The Relevancy Of Current Crash Test Guidelines For Roadside Safety Barriers On High Speed Roads Connie Xavier Dominique Lord Chiara Dobrovolny Roger Bligh TRB 1 st International Roadside Safety
REPORT NUMBER: 111-MGA SAFETY COMPLIANCE TESTING FOR FMVSS NO. 111 SCHOOL BUS REARVIEW MIRRORS
 REPORT NUMBER: 111-MGA-05-002 SAFETY COMPLIANCE TESTING FOR FMVSS NO. 111 SCHOOL BUS REARVIEW MIRRORS Girardin Minibus Inc. 2005 Minibus NHTSA No. C50902 PREPARED BY: MGA RESEARCH CORPORATION 5000 WARREN
CRASH TEST AND EVALUATION OF TEMPORARY WOOD SIGN SUPPORT SYSTEM FOR LARGE GUIDE SIGNS
 TTI: 9-1002-15 CRASH TEST AND EVALUATION OF TEMPORARY WOOD SIGN SUPPORT SYSTEM FOR LARGE GUIDE SIGNS ISO 17025 Laboratory Testing Certificate # 2821.01 Crash testing performed at: TTI Proving Ground 3100
SAFETY COMPLIANCE TESTING FOR FMVSS NO. 214S SIDE IMPACT PROTECTION (STATIC)
") REPORT NUMBER 214-GTL-09-002 SAFETY COMPLIANCE TESTING FOR S SIDE IMPACT PROTECTION (STATIC) MAZDA MOTOR CORPORATION 2009 MAZDA 3, PASSENGER CAR NHTSA NO. C95400 GENERAL TESTING LABORATORIES, INC. 1623
REPORT NUMBER 214-GTL-09-002 SAFETY COMPLIANCE TESTING FOR S SIDE IMPACT PROTECTION (STATIC) MAZDA MOTOR CORPORATION 2009 MAZDA 3, PASSENGER CAR NHTSA NO. C95400 GENERAL TESTING LABORATORIES, INC. 1623
CRASH TESTING OF RSA/K&C ANTI-RAM FOUNDATION BOLLARD PAD IN ACCORDANCE WITH U.S. DEPARTMENT OF STATE DIPLOMATIC SECURITY SD-STD-02.
 CRASH TESTING OF RSA/K&C ANTI-RAM FOUNDATION BOLLARD PAD IN ACCORDANCE WITH U.S. DEPARTMENT OF STATE DIPLOMATIC SECURITY SD-STD-02.01 REVISION A Prepared for RSA Protective Technologies, LLC FINAL REPORT