Investor Presentation February 2017
|
|
|
- Priscilla Mosley
- 6 years ago
- Views:
Transcription

1 Investor Presentation February 2017
2 Cautionary Statement with Respect to Forward-Looking Statements In the presentation that follows and in related comments by Hyundai Motor s management, our use of the words expect, anticipate, project, estimate, forecast, objective, plan, goal, outlook, target, pursue and similar expressions is intended to identify forward looking statements. The financial data discussed herein are presented on a preliminary basis before the audit from our Independent Auditor; final data will be included in HMC s Independent auditor s report. While these statements represent our current judgment on what the future may hold, and we believe these judgments are reasonable, actual results may differ materially due to numerous important factors. Such factors include, among others, the following : changes in economic conditions, currency exchange rates or political stability; shortages of fuel, labor strikes or work stoppages; market acceptance of the corporation s new products; significant changes in the competitive environment; changes in laws, regulations and tax rates; and the ability of the corporation to achieve reductions in cost and employment levels to realize production efficiencies and implement capital expenditures at levels and times planned by management. We do not intend or assume any obligation to update any forward-looking statement, which speaks only as of the date on which it is made. 1
3 Table of Contents Executive Summary Key Strengths for HMC Future Strategies Market Update by Region Appendix 2

4


5 Executive Summary Current Outstanding Performance Prudent Future Strategies Strong Performance through the Cycle Value Growth Balanced Sales Growth and Diversified Portfolio Structural Improvement in Core Competitiveness Volume Growth Cost Structure Improvement Superior Performance Relative to Peer Groups New Technology 4
6
7 1. Balanced Growth Global Sales Trend Global Market Share Trend 3,701 4,099 4,392 4,621 4,835 4,843 4, % 5.6% 5.7% 5.7% 5.7% 5.6% 5.5% 4.2% 4.0% Source : Company data (Retail sales excluding CKD sales) Source : IHS Brand Value Growth Quality Index Trend (Initial Quality Study) (Unit: number of problems) (Ranks among non-premium) % 19.3% Focus on Value Growth Strategy (U$ 5B in B in 16, 149% ) 24.4% 20.5% 15.6% % 11.1% % 25% 20% 15% 10% 5% 0% HMC Brand Value (Billion US$) HMC Value Growth (%) Source : Interbrand Source : J.D. Power 6

, sales in")
 +8.3% +9.")


8 2. Balanced Sales Growth through Global Manufacturing Plants 9 manufacturing plants ( ), 6 R&D facilities ( ), 14 direct sales subsidiaries ( ), sales in more than 200 countries globally (Unit: 1,000 vehicles) +8.3% +9.2% % EU 1,037 1, % China US -15.4% Korea % +1.5% % Middle East and Africa 460 India 497 4,843 4, LatAm 336 Worldwide Czech Plant Russia Plant Source: Company data (Retail sales excluding CKD sales) Turkey Plant India Plant China Plant US Plant Brazil Plant 7
9 2. Balanced Sales Growth by Diversified Business Portfolio Geographically Diversified Portfolio (%) Marketable Product Mix * (%) Hyundai Hyundai VW VW GM GM Toyota Toyota Honda Honda Domestic North America Europe China Asia (ex-china) Others A+B+C D+E+F RV Others Source: Company data for HMC 2015 Global Retail Sales, Competitor information from IHS and company data (CY2015 data) *A+B+C=Mini+Sub Compact+Compact; D+E+F=Mid-Size+Large+Luxury; RV=SUV+MPV, Others=PUP and others 8
10 3. Strong Risk Management (Improved Resilience to FX Fluctuations) Reduced FX exposures by lowering exports from Korea and improving localizations of suppliers at overseas plants Portion of Exports from Korea Plant Number of suppliers with overseas operations % 30% 30% 28% 25% 24% 23% 21% % % 70% 70% 72% 75% 76% 77% 79% % Korea Domestic & Overseas Plant Sales Export from Korea Plant 1st tier suppliers 2nd tier suppliers Source: Company data 9
11 3. Strong Risk Management (Utilization) Securing strong operating profits by maintaining high utilization over all production plants in the globe HMC Global Utilization Trend (Unit: %) 2016 Utilization by Plant (Unit: %) HMMC HAOS BHMC HMMR HMMA HMI HMB HMC Source: Company data 10
12 4. Brand Enhancement Enhancement in Brand Value (Unit: US$ in Millions) (Ranks) Awards and Accolades Date Titles Regions Models +20% % 40 +8% 39 11, % 35 12, Top rank in Auto Bild s Quality Report EU Hyundai Best Engines Award U.S. 1.4L Kappa Turbo Engine Achieved maximum 5-star safety rating from Euro NCAP N. America Car & Truck of Year Top 3 Nominees EU U.S. IONIQ G90 +24% 53 10, Star Safety Rating U.S. G80 +19% 9, Best Luxury Sedan Award U.S. G , Best Buy 2016 Brazil HB Int l Design Excellence Awards U.S. Elantra 5,033 6, SUV of the Year France Tucson Red Dot Design Award Germany IONIQ Drivers Choice Award U.S. Tucson if Design Award 2015 Germany Elantra, Tucson Car of The Year U.K. i Best Engines Award U.S. Sonata PHEV Brand value has increased an average of 16% each year, since the implementation of Modern Premium in Source: Interbrand Indian Car of the Year 2016 India Creta Star Safety Rating Award EU Tucson New Car of the Year China ix25 11


13 5. Consistent Profitability Relative to Peers HMC has shown comparable operating performance relative to competitors during the past years Consolidated Operating Margin Trend 10.0% 9.5% 8.5% 10.3% 9.4% 9.6% 8.3% 6.9% 6.0% 6.0% 6.3% 5.9% 5.4% 6.2% 6.4% 5.5% 4.9% 4.7% 6.3% 5.5% 5.8% 4.4% 4.1% 4.8% 3.3% 3.2% 6.6% 6.3% 5.8% 5.1% 5.1% 1.0% 0.2% -1.9% -19.9% ~3Q 16 Source: Public filings Note: Based on consolidated financials, Calendarized financials for Japanese Firms. 12
14
15 Sustainable Success Going Forward Key Strategies for Ongoing Growth in Earnings Consistent revenue growth and enhanced profitability to be achieved through structural improvement in product/brand value, balanced capacity expansion and cost structure improvement Value Growth Volume Growth Cost Structure Improvement New Technology New Brand Enhance Product and Brand Value Balance Capacity Expansion and New Model Launch Higher Cost Competitiveness Develop Independent and Distinctive Technology Launch New Brand as a Driver for Growth 14
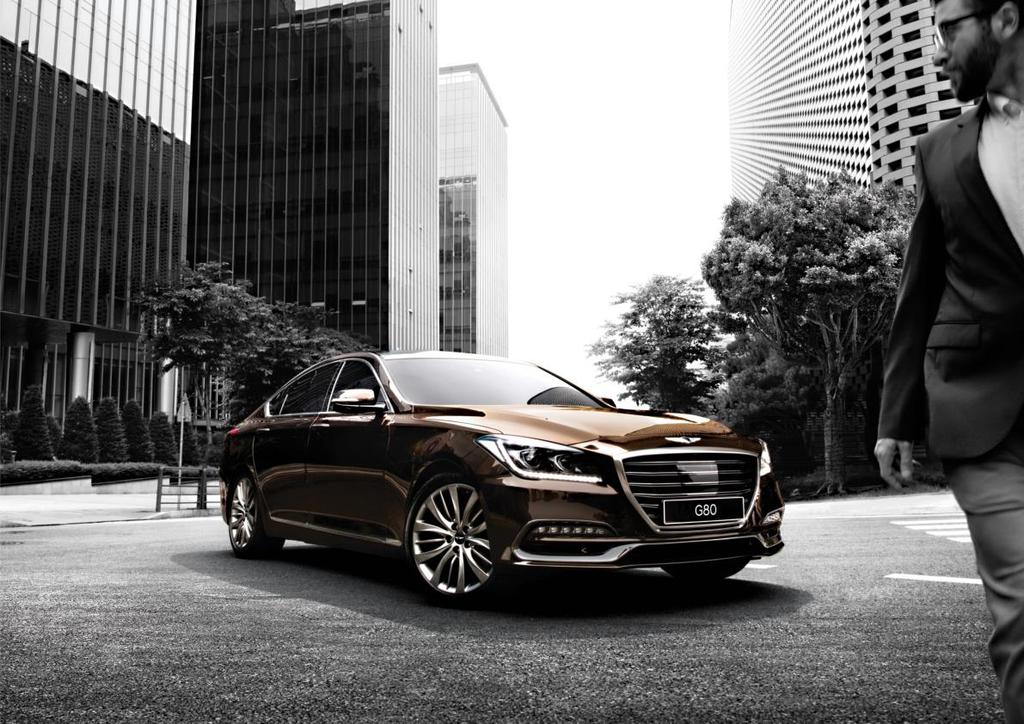
16 1. Value Growth (Product Competitiveness) Tucson and Genesis with outstanding specification received excellent remarks from customers Tucson (Sub-compact SUV) Specification Hyundai Tucson (16MY) Honda CR-V (16MY) VW Tiguan (16MY) Displacement 1.6T 2.4L 2.0L Max. Power 5,500 6,400 5,100 Mileage (City/Highway) 26mpg / 32mpg 26mpg / 33mpg 21mpg / 26mpg Safety (Small Overlap) Top Safety Pick Plus (Good) Top Safety Pick Plus (Good) - (Marginal) MSRP USD 22,700 ~ 27,550 USD 23,745 ~ 32,095 USD 24,890 ~ 36, US Sales (Growth) 89,713 (YoY 41% ) 357,335 (YoY 3% ) 43,638 (YoY 22% ) G80 (Mid-luxury sedan) Specification Genesis G80 (16MY) Audi A6 (16MY) BMW 5 Series (16MY) Displacement 3.8L 3.0L 3.0L Max. Power Mileage (City/Highway) 18mpg / 29mpg 20mpg / 30mpg 20mpg / 29mpg Safety (Small Overlap) Top Safety Pick Plus (Good) Top Safety Pick Plus (Good) - (Marginal) MSRP USD 38,750 ~ 53,850 USD 57,400 ~ 61,600 USD 55,850 ~ 59, US Sales (Growth) 24,266 (YoY 3% ) 18,686 (YoY 18% ) 32,408 (YoY 27% ) Source: Autodata 15
17 1. Value Growth (Higher Transaction Price) Transaction prices of major models in the US market have improved with structural improvement Transaction Prices in the US Market Compact Sedan (Unit: USD 1,000) Mid-size Sedan Compact SUV Elantra Corolla Civic Sonata Camry Accord Santa Fe Cherokee Equinox Source: PIN data (Annual average transaction price in the US market) 16
18 2. Volume Growth HMC s global sales to increase with capacity expansions Capacity Expansion and Sales Plan Production Capacity Expansion Sales Plan by Plants (Unit: 1,000 Vehicles) (P) (P) Change (%) Korea 1,870 1,870 1,870 1,667 1, China (BHMC) 1,050 1,100 1,250 1,142 1, India US Czech Turkey Russia Brazil Others Overseas 2,995 3,045 3,195 3,191 3, Total 4,865 4,915 5,065 4,858 5, Source: Company data * Above sales figures are based on shipments ** BHMC : Beijing-Hyundai Motor Company (excluding China #5 plant to operate in end-2017) / Others : Sichuan-Hyundai Motor Company, Others 17
19 3. Cost Structure Improvement (Platform Integration) Platform integration will reduce development costs and deliver greater economies of scale Platform Integration Integration Schedule Reduction of Model Development Time Integrated Platforms Avg. of 40 months 19 months 33 Total No. of Platforms Total No. of Models Models per Type of Platform Increasing portion of models with integrated platform Mass Production Niche Market Old 38% Old 25% New 75% Old 13% New 87% Old 9% New 91% Micro-Small Small-Mid Mid-Large LCV FR-Mid FR-Large Source: Company Data 18
20 4. New Technology (Strategy to Improve Fuel Efficiency) By 2020, HMC will Improve fuel efficiency by 25% on average, securing the product competitiveness in the market 2020 Fuel Efficiency improvement Roadmap Improve powertrains Refresh 70% of the current powertrains (7 out of 10 P/T line-ups to be replaced) Improve performance of Nu for mid-seg and Kappa engines for small-seg sedan Category 2014 By 2020 Gasoline Kappa, Gamma, Nu, Theta II, Lambda II, Tau New engines Performance Turbo Charger Diesel U, R, A, S New engines Expand engine lineups with turbo-charger Improve current 6-speed and 8-speed transmission Transmission 4 spd : Kappa, CVT 6 spd : Gamma, Theta, Lambda DCT 7 spd : Gamma DCT 8 spd : Lambda Increase number of transmissions Improve transfer efficiency Reduce weight Increase portion of advanced strength steel for the chassis of platform to make vehicles safer and lighter Apply more lightweight materials such as aluminum, foamed plastic and etc. Category 2014 By 2018 Advanced strength steel 33% ~ 52% 48% ~ 62% Expand Green Car line-ups Increase green car line-up to 28 models Category 2016 By 2020 Introduce new green car technologies Aiming to be the 2 nd largest manufacturer in green car market by 2020 HEV 6 Models 10 Models PHEV 2 Models 8 Models EV 2 Models 8 Models FCEV 1 Model 2 Models Total 11 Models 28 Models *Including Kia models 19


![changes [Size] Large Mid Mid Mid-large New Car Launch Small](/docs-images/72/67920659/images/21-3.jpg "Low-mid Line-up Strategy Expand Green Car line-up to 28")

![nd [Fuel] Respond to fuel efficiency regulations Secure](/docs-images/72/67920659/images/21-6.jpg "competitive fuel efficiency Lead regulation / green car")
21 4. New Technology (Green Car Development Roadmap) Mid / Long-term Green Car Development Strategy Combustion Combustion + Electric Electric Green Car Development Trend Establish a flexible platform to swiftly react to market changes [Size] Large Mid Mid Mid-large New Car Launch Small Low-mid Line-up Strategy Expand Green Car line-up to 28 models by 2020 to become the world's 2 nd largest manufacturer of green cars Category 2016 By 2020 Rank 4 th 2 nd [Fuel] Respond to fuel efficiency regulations Secure competitive fuel efficiency Lead regulation / green car Technology Number of Green Cars 11 models 28 models 20
 Enhancing fuel efficiency (Top level) Focusing on HEV system improvement and obtaining distinctive components technology Introduced HEV dedicated model,")
22 4. New Technology (HEV) HMC independently developed and obtained distinctive technology on hybrid system Developing Green Cars : HEV Hybrid Vehicle Strategy Gradual expansion of HEV applied automotives (mid-size, SUV, heavy vehicles) Enhancing fuel efficiency (Top level) Focusing on HEV system improvement and obtaining distinctive components technology Introduced HEV dedicated model, IONIQ HEV in January 2016 Hybrid Vehicle Parallel Hybrid Drive System Simpler in structure compare with other types of hybrid Electric Motor Powered by advanced lithium-ion battery IONIQ HEV Displacement : 1.6l Net Power : 141 ps Fuel Efficiency : 58 mpg Launched in 2016 HEV Performance Comparison Specification Hyundai IONIQ (Blue) Toyota Prius (Eco) Ford C-Max Net Power 141 ps 121 ps 141 ps Battery (kwh) 1.56 LiPo 0.75 Li 1.40 Li Fuel Efficiency (combined) 58 mpg 56 mpg 39 mpg System Parallel System Power Split System Power Split System Source: Company data 21

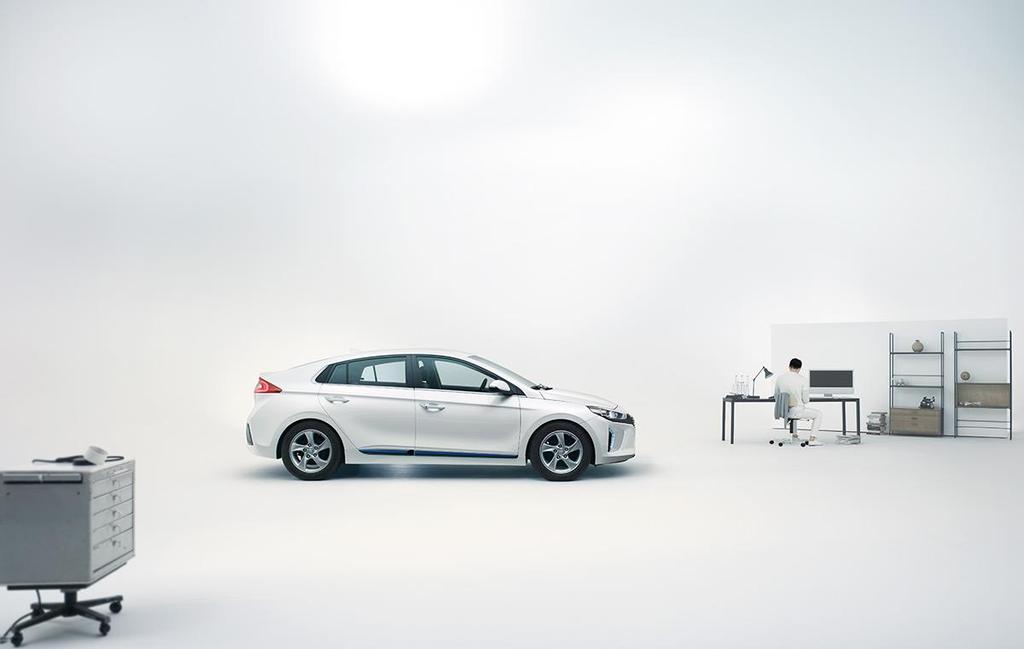
23 4. New Technology (EV) HMC launched IONIQ EV in 2016 equipped with localized key components and distinctive technology Developing Green Cars : EV Electric Vehicle Strategy Monitoring government policies and market penetration opportunities Participating in the Green Mobility System based on Next-generation Electric Vehicles commissioned by the South Korean government Minimize risks of regulations and policies Obtaining price / technology competency by localizing key components Launched IONIQ EV in June 2016 Electric Vehicle IONIQ EV Battery capacity : 28.0 kwh Max. distance : 280 km (EU) 191 km (Korea) Max. speed : 165 km/h EV Performance Comparison Specification Hyundai IONIQ EV Nissan Leaf VW e-golf Battery 28 kwh 24 kwh 30 kwh 24.2 kwh Motor 88 kw 80 kw 85 kw Driving Distance (EU standard) 280 km 199 km 250 km (24 kwh) (30 kwh) 190 km Source: Company data 22

 Development Roadmap Major Participation in Demonstration Program Phase 1 (- 2006) Develop Stack Technology Phase 2")
24 4. New Technology (FCEV) HMC has strengthened its reputation as a technology leader through the world s first mass production of FCEV Developing Green Cars : FCEV Fuel Cell Electric Vehicle Assuring FCEV Leading Maker position by participating in the demonstration program Major components are independently developed, i.e. FCEV Stack The first auto maker to successfully begin commercial production several years ahead of competitors HMC Toyota Honda Daimler FCEV Vehicle Tucson ix FCEV Max. distance: 415 km Max. speed: 160 km/h Fuel efficiency: 76.8km/kg World s 1 st mass production in Mar 13 Production year (E) Development Roadmap Major Participation in Demonstration Program Phase 1 (- 2006) Develop Stack Technology Phase 2 ( ) Improve Performance Phase 3 (2012-) Commence Small Production Year 2006 Program - Operated Demonstration program in collaboration with Korean Government Santa Fe FCEV Tucson FCEV Fuel Cell Electric Bus Tucson FCEV (2 nd Gen.) Fuel Cell Electric Bus (2 nd Gen.) Tucson ix FCEV (3 rd Gen.) Began production of Tucson ix FCEV 2004 ~ Participated in North America FCEV demonstration program led by the U.S. Department of Energy - Participated FCEV demonstration programs operated by European Government(Norway, Sweden, Denmark, Iceland) - Began to deliver FCEV to city of Copenhagen, Denmark and Skåne, Sweden, etc Began to deliver FCEV to retail customers Source: Company data 23


 Level 1 & Level 2 Lev.")
 TJA (Traffic Jam Assistance) Advanced Driver Assistance System Level")

 : 미국자동차기술자협회 In")
25 4. New Technology (Autonomous vehicle) HMC targeted to commercialize fully autonomous driving vehicles by 2030 Intelligent Safety Vehicle Development Philosophy Provide ultimate safety not only to the driver but also to the passengers / pedestrians / other drivers, by having vehicle proactively analyzing driving environments and assist driver when necessary Development status Levels of Driving Automation (SAE) Level 1 & Level 2 Lev. Definition Note 5 Full Automation In advanced research HDA (Highway Driving Assist) TJA (Traffic Jam Assistance) Advanced Driver Assistance System Level 3 4 High Automation First show in CES Conditional Automation 2 Partial Automation Completed advanced development Partially in market (HDA, etc.) Automated Lane Change Highway TG Entry/Exit Intersection Entry/Exit 1 Driver Assistance *SAE (Society of Automotive Engineers) : 미국자동차기술자협회 In market (LKAS, SCC, AEB, etc.) 24

 Locate vehicles and analyze")


26 4. New Technology (Connected car) HMC has concentrated on R&D and increased investment for future technologies Major areas Remote Support Fully Autonomous Smart Traffic Mobility Hub Remotely connect cars to prevent or solve problems Fully autonomous using V2X (V2X : Vehicle to Everything) Locate vehicles and analyze traffic to navigate the car Vehicles become center of our lives Vehicles become information hubs connecting cars to life 4 Core Technologies Car Network Tele Network Cloud Big Data Open Innovation partnership with global companies (Cisco partnership established in Apr. 2016) Integrated infrastructure combining network, cloud, big data and security solutions 25
 5.8 6.5 7.0 7.6 8.3 8.8 9.2 9.5 9.8 10.3 10.")

27 5. New Brand (Introduction of Genesis) HMC introduced new global luxury brand Genesis as a driver for growth Establish virtuous business circle Penetrating fast growing premium market (Unit : millions) Unlock the untapped profit opportunity Why Genesis? Elevate entire brand and organization BMW Toyota Daimler Nissan Ford Renault PSA Honda GM FCA VW -1.9 Source: IHS, Company data 26

 Genesis 2 nd gen.")
 G80 (Genesis) Roadmap Line-up : 3")


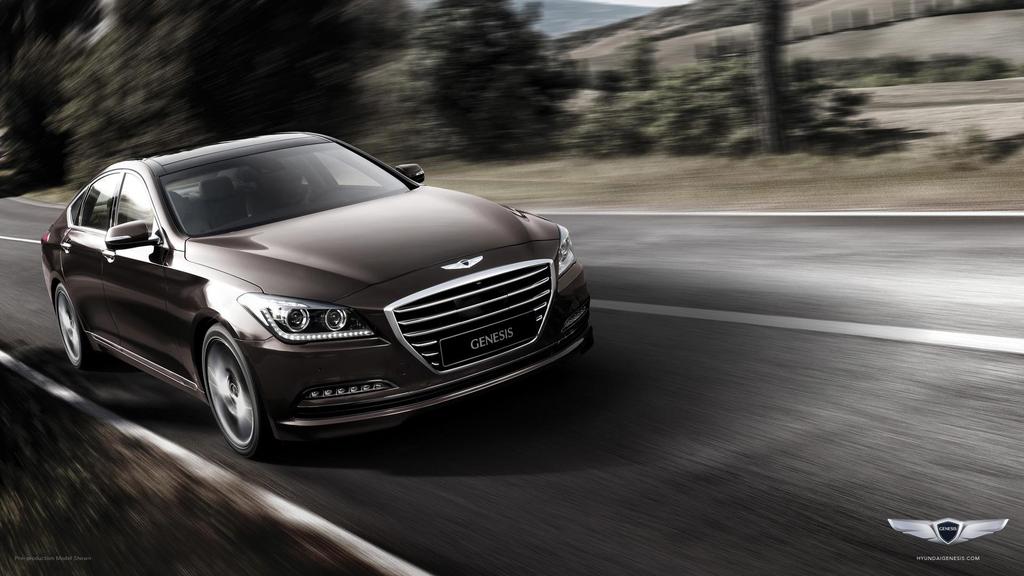
28 5. New Brand (Strategy of Genesis) Genesis Brand to achieve full line-up of 6 models by 2020 History Genesis 1 st gen. (Hyundai) Genesis 2 nd gen. (Hyundai) Launched Genesis brand & EQ900 (G90) G80 (Genesis) Roadmap Line-up : 3 models Phase 1 ( ~ 17) Sales Channel Share existing sales network and resources Line-up : 6 models Phase 2 ( ~ 20) Sales Channel Selectively open exclusive dealers and operate online sales channel Phase 3 ( 21 ~ ) Sales Channel Separately operate exclusive dealers Line-up : Diversify powertrain 27
 N will bring racetrack-capable")


 Introduce N")
29 5. New Brand (High Performance Vehicle, N sub-brand) N will bring racetrack-capable vehicles to customers who truly love cars Three Principles of N brand Major Concept Models Balanced Performance Emotional Delight Inspired Technology Delivers the value of harmonized performance Maximize driver s emotional delight of driving Technology originated from WRC RM16 Displacement: 2.0T GDI Max. Power: 300 PS Max. Torque: 39kg.m N 2025 Vision Gran Turismo Displacement : Hydrogen Fuel Cell Max. Power: 884 PS RM14 Concept RM 16 Concept Inception of R&D Project RM (Racing Midship) Introduce N sub-brand Vision Gran Turismo N sub-brand launch 1 st N sub-brand model to be launched 28

30
31 Korea Sales and M/S Trend (Retail Sales) (Unit: 1,000 vehicles) 1,579 1,542 1,539 1,660 1,834 1,821 Market Strategy New Model Launch IONIQ HEV (Jan 2016) : Green-car dedicated new model should reinforce our green car market presence IONIQ EV (Jun 2016) : EV version of IONIQ 43.3% 43.3% 41.6% 41.3% 38.9% 36.1% Grandeur (Nov 2016) : One of our best selling sedan has been refreshed New SUV-B model and Genesis G70 will be launched in 2017 Industry M/S Corresponding Measures on Increase of Imported Vehicles Increase Line-ups Introduction of premium brand the Genesis New SUV model launch will help to improve model mix Improve technology Diversify power train and green car technology Maintain high standard of quality Enhance Competitiveness Test drive for comparison with imported model Develop features for customers Source: KAMA, Company data CV RV Mid + Large PV Small PV 30
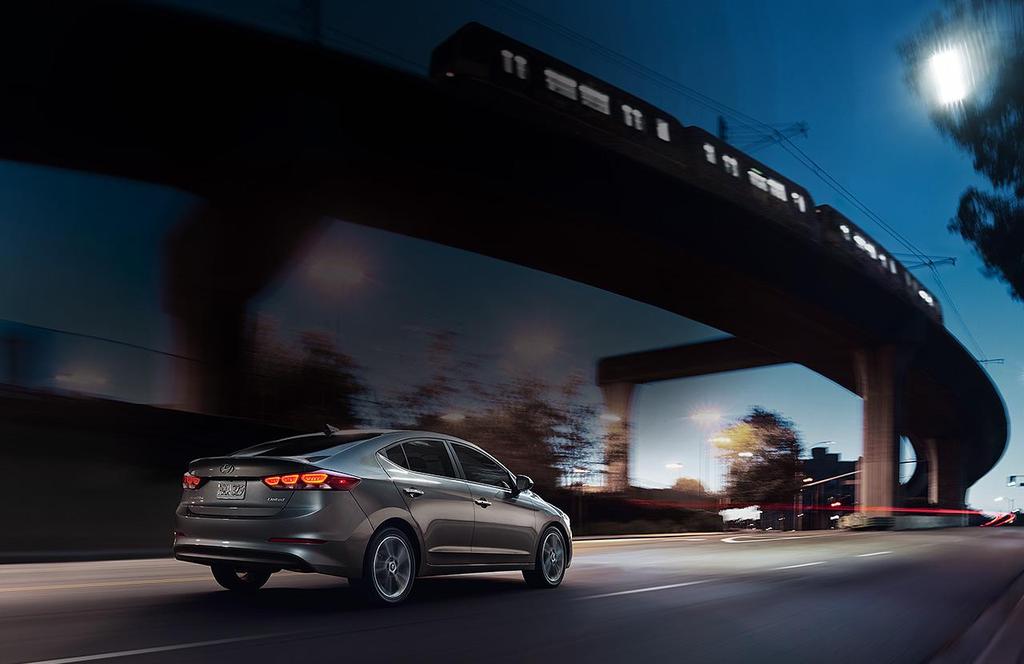
32 United States Sales and M/S Trend (Retail Sales) (Unit: 1,000 vehicles) 16,522 17,479 17,550 15,600 14,492 12, % 4.9% 4.6% 4.4% 4.4% 4.4% Market Strategy New Model Launch Elantra (Feb 2016) : One of the best selling sub-compact sedan was refreshed in 1Q of 2016 Santa Fe (Jun 2016) : Start of production from HMMA G90 (Sep 2016) : Introduction of all new model from Premium brand Genesis Industry M/S Premium Vehicle Sales (Unit: vehicle) 7.6% 7.8% 6.3% 5.6% 7.1% 5.7% 22,687 18,850 16,448 13, % 10.4% 7.0% 7.2% 6.1% 5.0% 3.7% 3.2% 24,917 24,266 19,804 19, ,193 3,972 3,578 3,415 2,332 2, Source: Company data RV Mid + Large PV Small PV G80 G90 G80 M/S G90 M/S 31
33 Europe Sales and M/S Trend (Retail Sales) (Unit: 1,000 vehicles) 15, % 13,960 13, % 14,543 15,968 17, % 3.0% 2.9% 2.9% Market Strategy Improve sales capability by strengthening finance services and introduce all new i30 Green-car dedicated new model, IONIQ HEV and EV will reinforce our green car market presence Expand dealer exposure to major cities and improve facilities of existing dealers with applying GDSI Improve brand value through FCEV, participation in WRC and launching N sub-brand Industry M/S Tucson Sales Trend (Unit: vehicle) Tucson % of Europe sales 21.2% 18.7% 19.5% 15.4% Direct 69% 75,538 86,787 86, % Direct 94,166 76% 24.9% Indirect 24% 113, % 155, , A+B seg C seg RV D seg & Others Source: Company data 32
34 China Sales and M/S Trend (Unit: 1,000 vehicles) 11, % 14,913 17,371 19, % 5.9% 5.8% 20,819 23, % 4.8% Industry M/S Market Strategy New Model Launch Lingdong (Mar 2016) : One of the best selling sedan Sonata HEV (Jun 2016) : The launch of 1 st green car model from local production Yuena (Oct 2016) : The C1 segment sedan has been refreshed with the start of China 4 th plant Yuedong (Mar 2017) : Our one of best selling strategic sedan (C2-seg) will build another sales momentum In 2017, three different strategic models will be launched including Yuedong , , ,142 1, Strategic Models Sales Trend , Small PV Mid PV SUV ix25 Mistra Global Models Source: Company data * Market demand based on Passenger Vehicle, ** Sales data based on factory sales 33
35 India 1 Sales and M/S Trend (Unit: 1,000 vehicles) 2,430 2,656 2,461 2, % 14.7% 15.4% 16.2% 2,758 2, % 17.0% Industry* M/S Market Strategy Strong sales momentum through competitive model line-up Won Indian COTY for 3 consecutive years with i10( 14), i20( 15), Creta( 16) 11 Three models(eon, i10, Creta) have received the best scores in the 2016 India Initial Quality Study (J.D. Power) New Model Launch Creta (Jul 2015) : New SUV model, customized for Indian customers, responded to strong demand in SUV market Elantra (Aug 2016) : One of the premium model in Indian market was introduced Tucson (Nov 2016) : The launch of C-segment SUV model improved our product mix Accent (Aug 2017) : The steady selling B-segment sedan model will be refreshed New Model Launch Schedule Creta Elantra Tucson i10 F/L Accent Jul. 15 Aug. 16 Nov. 16 Dec. 16 Aug. 17 Export Domestic** Source: SIAM, Company data * Industry demand based on Passenger Vehicle ** Sales based on factory sales 34
36 Other Emerging Markets Achieving a consistent sales volume growth over the years Africa-middle East and LatAm Sales Breakdown by Major Emerging Markets Sales Volume (000 s) Africa & Middle East Asia-Pacific 4.3% Latin America 6.8% Turkey 1.1% Africa-Middle East 8.3% Korea 13.4% Latin America North America 18.6% China & India 33.2% Europe 13.6% Source: Company data, 2016 HMC Global Retail Sales (exclude CKD sales) South America Brazil 35
37
38 Balance Sheet (K-IFRS Consolidated) (Billion KRW) End End diff. chg. Assets 165, , , % Current Assets (a) 67,529 72,450 +4, % Liabilities (b) 98, ,491 +8, % Current Liabilities (c) 41,214 43,610 +2, % Debt (d) 64,932 73,444 +8, % Provision 6,742 6, % Equity (e) 66,881 72,345 +5, % Capital Stock 1,489 1, % Capital Surplus 3,520 4, % Retained Earnings 60,035 64,361 +4, % Current Ratio (a/c) % % Liability to Equity (b/e) % % Debt to Equity (d/e) 97.1 % % EBITDA / Interest Expenses 35.3 x 31.4 x 37
39 Income Statement (K-IFRS Consolidated) (Billion KRW) 15. 4Q 16. 1Q 16. 2Q 16. 3Q 16. 4Q yoy qoq Revenue 24,765 22,351 24,677 22,084 24, % +11.1% Gross Profit 4,719 4,239 5,023 3,894 4, % +16.4% Margin (%) SG&A 3,204 2,897 3,261 2,826 3, % +24.3% Portion (%) Operating Income 1,515 1,342 1,762 1,068 1, % 4.4% Margin (%) Income before tax 2,063 2,163 2,382 1,495 1, % 15.2% Margin (%) Net Income 1,529 1,768 1,764 1,119 1, % 4.5% Margin (%) Depreciation Amortization EBITDA 2,273 2,144 2,573 1,908 1,927 38
Investor Presentation March 2017
 Investor Presentation March 2017 Cautionary Statement with Respect to Forward-Looking Statements In the presentation that follows and in related comments by Hyundai Motor s management, our use of the words
Investor Presentation February 2018
 Investor Presentation February 2018 Cautionary Statement with Respect to Forward-Looking Statements In the presentation that follows and in related comments by Hyundai Motor s management, our use of the
Investor Presentation May 2018
 Investor Presentation May 2018 Cautionary Statement with Respect to Forward-Looking Statements In the presentation that follows and in related comments by Hyundai Motor s management, our use of the words
Hyundai Motor Company. Investor Presentation October 2015
 Hyundai Motor Company Investor Presentation October 2015 Table of Contents 1. Executive Summary 2. Key Strengths for HMC 3. Future Strategies 4. Market Update by Region Appendix 1 1. Executive Summary
Hyundai Motor Company. Investor Presentation June 2013
 Hyundai Motor Company Investor Presentation June 2013 Table of Contents 1. Executive Summary 2. Key Strengths for HMC 3. Future Strategies 4. Market Update by Region Appendix 1 1. Executive Summary Executive
2018 Annual Business Result
 2018 Annual Business Result 2018 Annual business result is prepared for investors consideration only before completion of independent auditors review. Therefore, parts of contents on this material could
FISCAL YEAR MARCH 2018 FIRST HALF FINANCIAL RESULTS
 FISCAL YEAR MARCH 2018 FIRST HALF FINANCIAL RESULTS PRESENTATION OUTLINE Highlights Fiscal Year March 2018 First Half Results Fiscal Year March 2018 Full Year Forecast Progress of Key Initiatives/ Business
Valvoline Fourth-Quarter Fiscal 2016 Earnings Conference Call. November 9, 2016
 Valvoline Fourth-Quarter Fiscal 2016 Earnings Conference Call November 9, 2016 Forward-Looking Statements This presentation contains forward-looking statements within the meaning of Section 27A of the
FY2012 third-quarter financial results
 FY2012 third-quarter financial results Nissan Motor Co., LTD. February 8, 2013 Key performance indicators: financial results (billion yen) Net revenue 6,698.4 6,755.2 Operating profit 427.8 Net income
Conférence d Automne - Cheuvreux. Paris, September 26 th, 2011
 Conférence d Automne - Cheuvreux Paris, September 26 th, 2011 This presentation may contain forward-looking statements. Such forward-looking statements do not constitute forecasts regarding the Company
II. New Mid-term Business Plan (Apr to Mar. 2011)
") II. New Mid-term Business Plan (Apr. 2008 to Mar. 2011) 1. Corporate Philosophy and Basic Concept of MBP 2. Business Environment Surrounding Isuzu 3. Positioning of New Mid-term Business Plan 4. Market
II. New Mid-term Business Plan (Apr. 2008 to Mar. 2011) 1. Corporate Philosophy and Basic Concept of MBP 2. Business Environment Surrounding Isuzu 3. Positioning of New Mid-term Business Plan 4. Market
FY2015 Third Quarter Financial Results
 FY2015 Third Quarter Financial Results Mitsubishi Motors Corporation February 3, 2016 FY2015 Third Quarter Financial Results All-new Pajero Sport 1 FY2015 1-3Q Results Summary (vs. FY2014 1-3Q) Increase
Mazda Motor Corporation June 17, 2011
 FY ENDING MARCH 2012 FINANCIAL FORECAST New MAZDA Demio 13-SKYACTIV Mazda Motor Corporation June 17, 2011 1 PRESENTATION OUTLINE FY ending March 2012 Forecast Updates of Framework for Medium- and Long-term
2Q06 Results. Investor Relations
 2Q06 Results Investor Relations Content 1. 2Q06 Key Results 2. Summarized Income Statement 3. Balance Sheet as of Jun. 2006 4. Outlook for 2006 5. Result & Outlook By Division Appendix : 2Q06 Results Breakdown
Ssangyong Motor Company, South Korea
 Ssangyong Motor Company, South Korea Contents I. SYMC Overview II. Maximizing resource utilization III. YTD September 2015 IV. Way Forward 1 SYMC Overview SYMC Product Range SYMC Products (Segment-wise)
2010 1Q Investor Meeting. May 2010
 2010 1Q Investor Meeting May 2010 This presentation contains preliminary figures which may be materially different from the final figures. While the statements in this presentation represent our current
FISCAL YEAR MARCH 2018 FIRST QUARTER FINANCIAL RESULTS
 FISCAL YEAR MARCH 2018 FIRST QUARTER FINANCIAL RESULTS PRESENTATION OUTLINE Highlights Fiscal Year March 2018 First Quarter Results Fiscal Year March 2018 Full Year Forecast Structural Reform Stage 2 Progress
1 Copyright(C) 2012 Isuzu Motors Limited All rights reserved
 2012 Isuzu Motors Limited All rights reserved") FY2012 Financial Results May 10, 2012 1 Copyright(C) 2012 Isuzu Motors Limited All rights reserved Contents Ⅰ. President and Representative Director : Susumu Hosoi FY2012 Overview Ⅱ. Director Director
FY2012 Financial Results May 10, 2012 1 Copyright(C) 2012 Isuzu Motors Limited All rights reserved Contents Ⅰ. President and Representative Director : Susumu Hosoi FY2012 Overview Ⅱ. Director Director
FISCAL YEAR MARCH 2015 FIRST HALF FINANCIAL RESULTS. New Mazda Demio
 FISCAL YEAR MARCH 2015 FIRST HALF FINANCIAL RESULTS New Mazda Demio Mazda Motor Corporation October 31, 2014 1 PRESENTATION OUTLINE Highlights Fiscal Year March 2015 First Half Results Fiscal Year March
H Business Result
 H1 2016 Business Result H1 2016 business result is prepared for investors consideration only before completion of independent auditors review. Therefore, parts of contents on this material could be changeable
FISCAL YEAR ENDING MARCH 2012 FIRST HALF FINANCIAL RESULTS
 FISCAL YEAR ENDING MARCH 2012 FIRST HALF FINANCIAL RESULTS Mazda Motor Corporation November 2, 2011 New Mazda CX-5 (European specifications) 1 PRESENTATION OUTLINE Highlights Fiscal Year Ending March 2012
TOFAŞ RESULTS WEBCAST PRESENTATION
 TOFAŞ 31.12.2017 RESULTS WEBCAST PRESENTATION 02.02.2018 AGENDA Highlights Turkish Automotive Industry Production Domestic Market Developments Tofaş Domestic Market Performance Export Markets & Tofaş Performance
Q Business Result
 Q3 2018 Business Result Q3 2018 business result is prepared for investors consideration only before completion of independent auditors review. Therefore, parts of contents on this material could be changeable
Gabelli Automotive Symposium October 30, Adriane Brown President and CEO Honeywell Transportation Systems
 Gabelli Automotive Symposium October 30, 2007 Adriane Brown President and CEO Honeywell Transportation Systems Forward Looking Statements This report contains forward-looking statements within the meaning
Volkswagen Group Capital Markets Day 2017 Volkswagen Truck & Bus
 Volkswagen Group Capital Markets Day 2017 Volkswagen Truck & Bus Andreas Renschler Board of Management, Commercial Vehicles Capital Markets Day, 14 th of March 2017 Disclaimer The following presentations
First in Mind First in Choice. Capital Markets Day 2006 Gunnar Brock, President and CEO
 First in Mind First in Choice Capital Markets Day 26 Gunnar Brock, President and CEO 1 December 4, 26 www.atlascopco.com Atlas Copco in a Snapshot Continuing operations A world leading provider of industrial
THREE MONTHS REPORT, JAN MARCH 2016
 THREE MONTHS REPORT, JAN MARCH 2016 TELEPHONE CONFERENCE 26 APRIL, 2016, AT 14:30 CET TOMMY ANDERSSON, PRESIDENT AND CEO HELENA WENNERSTRÖM, EVP AND CFO TO PARTICIPATE, PLEASE CALL 5 MINUTES BEFORE THE
Investor Presentation. January 2019
 Investor Presentation January 2019 Safe Harbor Statement Statements in this presentation may contain forward-looking statements as contemplated by the 1995 Private Securities Litigation Reform Act that
Annual Press Conference 2011 Results
 Annual Press Conference 2011 Results Dr. Dieter Zetsche Chairman of the Board of Management Head of Mercedes-Benz Cars February 09, 2012 2 Last year s outlook Daimler results in 2011 Set all-time sales
FISCAL YEAR MARCH 2014 FIRST HALF FINANCIAL RESULTS. New Mazda Axela (Overseas name: New Mazda3)
") FISCAL YEAR MARCH 2014 FIRST HALF FINANCIAL RESULTS New Mazda Axela (Overseas name: New Mazda3) Mazda Motor Corporation October 31, 2013 1 PRESENTATION OUTLINE Highlights Fiscal Year March 2014 First Half
FISCAL YEAR MARCH 2014 FIRST HALF FINANCIAL RESULTS New Mazda Axela (Overseas name: New Mazda3) Mazda Motor Corporation October 31, 2013 1 PRESENTATION OUTLINE Highlights Fiscal Year March 2014 First Half
Bernstein Strategic Decisions Conference 2018
 Bernstein Strategic Decisions Conference 2018 Forward-Looking Statements Certain statements in this presentation, other than statements of historical fact, including estimates, projections, statements
FY2012. H1 Financial Results. November 8, Copyright(C) 2011 Isuzu Motors Limited All rights reserved
 2011 Isuzu Motors Limited All rights reserved") FY2012 H1 Financial Results November 8, 2011 1 Copyright(C) 2011 Isuzu Motors Limited All rights reserved Ⅰ. President and Representative Director : Susumu Hosoi :FY2012 H1 Financial Summary Outline Ⅱ.
FY2012 H1 Financial Results November 8, 2011 1 Copyright(C) 2011 Isuzu Motors Limited All rights reserved Ⅰ. President and Representative Director : Susumu Hosoi :FY2012 H1 Financial Summary Outline Ⅱ.
TOFAŞ RESULTS WEBCAST PRESENTATION
 TOFAŞ 31.12.2016 RESULTS WEBCAST PRESENTATION 02.02.2017 1 WEBCAST AGENDA Highlights Turkish Automotive Industry Production Domestic Market Developments Tofaş Domestic Market Performance Export Markets
FISCAL YEAR ENDED MARCH 2011 FINANCIAL RESULTS
 FISCAL YEAR ENDED MARCH 211 FINANCIAL RESULTS Mazda Motor Corporation April 28, 211 Mazda MINAGI 1 PRESENTATION OUTLINE Highlights Fiscal Year Ended March 211 Results In Summary Question & Answer Session
FISCAL YEAR MARCH 2014 FINANCIAL RESULTS
 FISCAL YEAR MARCH 214 FINANCIAL RESULTS Mazda CX-5 Mazda Atenza Mazda Motor Corporation April 25, 214 New Mazda Axela 1 PRESENTATION OUTLINE Highlights Fiscal Year March 214 Results Fiscal Year March 215
Automotive Market: Where Do We Go From Here?
 Automotive Market: Where Do We Go From Here? June, 3 rd 211 Federal Reserve Bank of Chicago Eighteenth Annual Automotive Outlook Symposium Jeff Schuster Executive Director, Forecasting and Analysis jeff.schuster@jdpa.com
FY 2006 Third Quarter Review
 FY 26 Third Quarter Review February 2, 27 Nissan Motor Co., Ltd 1 Agenda Third quarter news update Sales performance Financial results FY6 Outlook Sustainable growth 2 Third quarter news update Oct 1)
VEHICLE SALES AND RECESSIONS
 TOM LOVELESS Vice President Sales Kia Motors America 1 VEHICLE SALES AND RECESSIONS The volume decline over the last several years is the largest in history. Where do we go from here? 20,000,000 18,000,000
Aftermarket Trends: What will Drive Future Aftermarket Repair Opportunities in North America?
 Aftermarket Trends: What will Drive Future Aftermarket Repair Opportunities in North America? Mark Seng Global Aftermarket Practice Leader July 29, 2014 - Vehicles - Powertrains - Technology & How the
Investor Presentation. November 2018
 Investor Presentation November 2018 Safe Harbor Statement Statements in this presentation may contain forward-looking statements as contemplated by the 1995 Private Securities Litigation Reform Act that
ADP!AALTO FULL SPEED AHEAD! A presentation to the CEO of Harley Davidson 1/10/2019. Matti Karjalainen Patrick Timmer Lauri Hanninen Tommi Bergstrom
 DISRUPTION ADP!AALTO PARTNERS FULL SPEED AHEAD! A presentation to the CEO of Harley Davidson 1/10/2019 Matti Karjalainen Patrick Timmer Lauri Hanninen Tommi Bergstrom Executive Summary How to Maintain
FY2008 3Q Financial Results Apr. Dec. 07 / Oct. Dec. 07. FY2008 3Q Financial Results
 FY2008 3Q Financial Results FY2008 3Q Financial Results Apr. Dec. 07 / Oct. Dec. 07 February 7, 2008 1 Copyright(C) 2008 Isuzu Motors Limited All rights reserved 1. FY2008 3Q Highlight Director: MASANORI
THE ELECTRIC VEHICLE REVOLUTION AND ITS IMPACT ON PEAK OIL DEMAND
 THE ELECTRIC VEHICLE REVOLUTION AND ITS IMPACT ON PEAK OIL DEMAND INDONESIAN GAS SOCIETY JAKARTA 20 TH NOVEMBER JUNE 2016 - SELECTED SLIDES JON FREDRIK MÜLLER PARTNER HEAD OF CONSULTING ASIA-PACIFIC When
9M 2003 Financial Results (US GAAP)
") 9M Financial Results (US GAAP) January 2004 LUKOIL Group Crude Oil Production* mln tonnes 82 80 78 76 74 72 70 68 66 64 Crude oil production 3.2 5.5 3.9 76.8 70.3 71.3 2001 Production by subsidiaries Share
9M Financial Results (US GAAP) January 2004 LUKOIL Group Crude Oil Production* mln tonnes 82 80 78 76 74 72 70 68 66 64 Crude oil production 3.2 5.5 3.9 76.8 70.3 71.3 2001 Production by subsidiaries Share
FISCAL YEAR MARCH 2015 FIRST QUARTER FINANCIAL RESULTS. Mazda Roadster 25 th Anniversary Model
 FISCAL YEAR MARCH 2015 FIRST QUARTER FINANCIAL RESULTS Mazda Roadster 25 th Anniversary Model Mazda Motor Corporation July 31, 2014 1 PRESENTATION OUTLINE Highlights Fiscal Year March 2015 First Quarter
TOFAŞ Q ANALYST PRESENTATION
 TOFAŞ Q1 2016 ANALYST PRESENTATION 03.05.2016 1 2016 Q1 AGENDA Highlights Turkish Automotive Industry Production & Capacity Utilization Domestic Market Developments Tofaş Domestic Market Performance Export
M.M. Warburg Fieldtrip. September 14th, Anton Poll. Head of Financial Communication/ Analysis, AUDI AG
 M.M. Warburg Fieldtrip September 14th, 2017 Anton Poll Head of Financial Communication/ Analysis, AUDI AG Markets Financials Outlook The Audi brand comes from a unique growth story in units during the
EXANE BNP PARIBAS 13th European Seminar June 8, 2011
 EXANE BNP PARIBAS 13th European Seminar June 8, 2011 This presentation may contain forward-looking statements. Such forward-looking statements do not constitute forecasts regarding the Company s results
INVESTOR PRESENTATION. February 2011
 INVESTOR PRESENTATION February 2011 Agenda Ford Otosan Overview Turkish Automotive Industry Overview Competitive Advantages Key Operating Data ISE Performance 2 Investor Presentation February 2011 FORD
2015 Business Result
 2015 Business Result 본자료는 2015 년실적에대한외부감사인의회계검토가완료되지않은상태에서투자자여러분의편의를위하여작성된자료입니다. 따라서본자료의일부내용은회계검토과정에서변경될수있음을양지하시기바랍니다. 2015 business result is prepared for investors consideration only before completion
FISCAL YEAR MARCH 2015 THIRD QUARTER FINANCIAL RESULTS. Updated Mazda CX-5 (Japanese specification model)
") FISCAL YEAR MARCH 2015 THIRD QUARTER FINANCIAL RESULTS Updated Mazda CX-5 (Japanese specification model) Mazda Motor Corporation February 4, 2015 1 PRESENTATION OUTLINE Highlights Fiscal Year March 2015
FISCAL YEAR MARCH 2015 THIRD QUARTER FINANCIAL RESULTS Updated Mazda CX-5 (Japanese specification model) Mazda Motor Corporation February 4, 2015 1 PRESENTATION OUTLINE Highlights Fiscal Year March 2015
H Business Result
 H1 2017 Business Result H1 2017 business result is prepared for investors consideration only before completion of independent auditors review. Therefore, parts of contents on this material could be changeable
FY H1 Financial Results
 FY2011 1 H1 Financial Results November 8, 2010 1 Copyright(C) 2010 Isuzu Motors Limited All rights reserved Contents Ⅰ. President and Representative Director : Susumu Hosoi :FY2011 H1 Financial Summary
2003 fourth quarter and full-year results
 Dinesh Paliwal Member of Group Executive Committee, Head of Automation Technologies Division 2003 fourth quarter and full-year results Automation Technologies Copyright 2003 ABB. All rights reserved. -
Audi: the number one premium brand
 Investor Visit to AUDI AG, Ingolstadt, 22 nd September 2010 Audi: the number one premium brand Axel Strotbek CFO, Member of the Board, AUDI AG Development in deliveries to customers Audi [in thousand vehicles]
FY17 RESULTS BUSINESS UPDATES FY18 OUTLOOK. Nissan Motor Co., Ltd. May 14 th, 2018
 Nissan Motor Co., Ltd. May 14 th, 2018 RESULTS BUSINESS UPDATES FY18 OUTLOOK www.nissan-global.com Copyright NISSAN MOTOR CO., LTD. All rights reserved. 2 GLOBAL 91.81 5.08 TIV * 1 vs. 93.52 GLOBAL +1.9%
Meeting Materials for FY2011
 Meeting Materials for FY2011 (Year ended March 31, 2012) May 17, 2012 Masao Usui Representative Director, President Executive Officer KYB Corporation Meeting Materials for FY2011 May 17, 2012, KYB Corporation
FISCAL YEAR MARCH 2015 FINANCIAL RESULTS. New Mazda CX-3 (Japanese specification model)
") FISCAL YEAR MARCH 2015 FINANCIAL RESULTS New Mazda CX-3 (Japanese specification model) Mazda Motor Corporation April 24, 2015 1 PRESENTATION OUTLINE Highlights Fiscal Year March 2015 Results Fiscal Year
FISCAL YEAR MARCH 2015 FINANCIAL RESULTS New Mazda CX-3 (Japanese specification model) Mazda Motor Corporation April 24, 2015 1 PRESENTATION OUTLINE Highlights Fiscal Year March 2015 Results Fiscal Year
Record CY 2016 EPS-diluted-adjusted of $6.12, an increase of $1.10 Y-O-Y. Q EPS-diluted-adjusted of $1.28, a decrease of $0.11 Y-O-Y.
 1 2 3 Q4 2016 global deliveries up 0.1 million units year-over-year (Y-O-Y), a 3.3% increase. Volume gains primarily in North America and China, offset by reductions in International Operations (excluding
JAGUAR LAND ROVER RESULTS FOR THE THREE MONTHS ENDED 31 DECEMBER th FEBRUARY 2017
 JAGUAR LAND ROVER RESULTS FOR THE THREE MONTHS ENDED 31 DECEMBER 2016 14 th FEBRUARY 2017 DISCLAIMER Statements in this presentation describing the objectives, projections, estimates and expectations of
Investor Presentation. March 2017
 Investor Presentation March 2017 Disclaimer During this presentation management may discuss certain forwardlooking statements concerning Nemak s future performance that should be considered as good faith
I remind you that our presentation is available on our website. We can start from the first 2 slides that show Piaggio Group First
 CONFERENCE CALL 2009 1 st HALF RESULTS Good afternoon and welcome to everybody. I remind you that our presentation is available on our website. We can start from the first 2 slides that show Piaggio Group
Q SALES Strong organic growth, confirmed momentum. October 12, 2017
 Q3 2017 SALES Strong organic growth, confirmed momentum October 12, 2017 Q3 2017 Sales Key facts Sales Since January 1, 2017, Faurecia reports on value-added sales, which are total sales less monolith
Earnings conference call
 Earnings conference call Full year 2017 Åke Bengtsson, President & CEO Andreas Ekberg, Acting CFO February 14, 2018 1 Agenda Business Summary Market Update Sales Financials Way forward 2 Business Summary
FISCAL YEAR MARCH 2018 THIRD QUARTER FINANCIAL RESULTS
 FISCAL YEAR MARCH 2018 THIRD QUARTER FINANCIAL RESULTS PRESENTATION OUTLINE Highlights Fiscal Year March 2018 Nine Month Results Fiscal Year March 2018 Full Year Forecast Progress of Key Initiatives 1
Establishment of Joint Venture with PSA for EV Traction Motor Business
 NIDEC CORPORATION Establishment of Joint Venture with PSA for EV Traction Motor Business Nidec Corporation December 4 th, 2017 Note Regarding Forward-looking Statements These presentation materials and
February Annual Results February 13, 2008
 February 2008 1 Annual Results February 13, 2008 AGENDA AGENDA 2007 Highlights 2007 Financial Results x Competitiveness Sales and products dynamic International 2008 Outlook February 2008 2 2007: performance
Third quarter AB Volvo
 Third quarter 2013 Third quarter 2013 TRUCKS EUROPE Excellent reception of the new products decision to optimize manufacturing Highlights in Commercial launch of the new product ranges Strong order situation
Dave Carroll Capital Markets Day Markets Update
 Dave Carroll Capital Markets Day 2004 Markets Update Tomkins Operates in Diverse End Markets Breakdown 2003 Sales ( 3,150m, US$4,795m) Non-Residential Construction 11% Other 9% Automotive OE 27% Residential
FISCAL YEAR END MARCH 2013 FIRST HALF FINANCIAL RESULTS. New Mazda6 (Atenza)
") FISCAL YEAR END MARCH 2013 FIRST HALF FINANCIAL RESULTS New Mazda6 (Atenza) Mazda Motor Corporation October 31, 2012 1 PRESENTATION OUTLINE Highlights Fiscal Year March 2013 First Half Results Fiscal Year
FISCAL YEAR END MARCH 2013 FIRST HALF FINANCIAL RESULTS New Mazda6 (Atenza) Mazda Motor Corporation October 31, 2012 1 PRESENTATION OUTLINE Highlights Fiscal Year March 2013 First Half Results Fiscal Year
Global Motorcycle Market Research Report 2018
 Report Information More information from: https://www.wiseguyreports.com/reports/3271957-global-motorcycle-market-research-report-2018 Global Motorcycle Market Research Report 2018 Report / Search Code:
282m 75% +575m. Net sales Operating income before non-recurring items. Operating margin before non-recurring items. Net Loss.
 First-Half 2009 Financial Highlights Net sales Operating income before non-recurring items Operating margin before non-recurring items Net Loss Net debt-to-equity ratio Free cash flow** 7,134m 282m 4.0%
2015 Interim Results. Levallois, July 23 th, 2015
 2015 Interim Results Levallois, July 23 th, 2015 CONTENTS H1 2015 Highlights 2015 Interim Results Outlook H1 2015 Highlights DATE Improvement in all metrics 4 H1 2015 Key metrics Economic Sales * : 2,945
Fiscal Year 2015 Financial Results
 Fiscal Year 2015 Financial Results Nissan Motor Co., Ltd May 12, 2016 results FY16 outlook 2 Key performance indicators: financial results (TSE report basis - China JV Equity basis) Net revenue Operating
Manz Automation AG. Conference Call, Full Year Results 2009 March 30, 2010, Reutlingen Dieter Manz/CEO, Martin Hipp/CFO
 Manz Automation AG Conference Call, Full Year Results 2009 March 30, 2010, Reutlingen Dieter Manz/CEO, Martin Hipp/CFO Manz Automation is a high-tech equipment supplier for high growth industries is an
Michigan Public Service Commission Electric Vehicle Pilot Discussion
 Michigan Public Service Commission Electric Vehicle Pilot Discussion Brett Smith Assistant Director, Manufacturing & Engineering Technology Valerie Sathe Brugeman Senior Project Manager, Transportation
1 st Half 2018 Results. August 1 st, 2018
 1 st Half 2018 Results August 1 st, 2018 H1 HIGHLIGHTS & CATEGORY SPOTLIGHTS Gonzalve BICH 2 First Half 2018 Key Messages Challenging market and business environment Continued investment in targeted Brand
As a note, this presentation was released as the dates shown and reflected management views as of these dates. All information in this presentation
 February 2004 1 As a note, this presentation was released as the dates shown and reflected management views as of these dates. All information in this presentation regarding the Company s financial results
Mercedes-Benz: Best Sales Result for the Month of June in Company History Up 13 Percent
 In the following please find the release of the Mercedes-Benz Cars concerning worldwide vehicles sales in June 2010: Mercedes-Benz: Best Sales Result for the Month of June in Company History Up 13 Percent
Slide 1. ABB September 9, 2015
 Tarak Mehta, Head of Low Voltage Products, ABB Ltd., Capital Markets Day, Next Level Stage 2 New Electrification Products division: Power & Automation for the site Slide 1 Important notices Presentations
Statement Dr. Norbert Reithofer Chairman of the Board of Management of BMW AG Conference Call Interim Report to 30 June August 2014, 10:00 a.m.
 - Check against delivery - Statement Dr. Norbert Reithofer Chairman of the Board of Management of BMW AG Conference Call Interim Report to 30 June 2014, 10:00 a.m. Ladies and Gentlemen! Since July, Europe
Zurich, February 16, 2012, Ulrich Spiesshofer Discrete Automation and Motion Driving profitable growth. ABB Group February 16, 2012 Slide 1
 Zurich, February 16, 2012, Ulrich Spiesshofer Discrete Automation and Motion Driving profitable growth February 16, 2012 Slide 1 2011 a year of profitable growth Highlights Discrete automation Build sizeable
2017 Q3 REVENUE. October 25 th, 2017
 2017 Q3 REVENUE October 25 th, 2017 DISCLAIMER This presentation does not constitute an offer to sell, or a solicitation of an offer to buy, PEUGEOT SA ( Company ) shares. This presentation may contain
J.P. Morgan Fieldtrip. Anton Poll Head of Financial Communication/ Financial Analysis, AUDI AG
 J.P. Morgan Fieldtrip Anton Poll Head of Financial Communication/ Financial Analysis, AUDI AG performance robust KPIs 2017 Deliveries slightly above prior year $ Revenue slightly above prior year Operating
FY17 RESULTS BUSINESS UPDATES FY18 OUTLOOK. Nissan Motor Co., Ltd. May 14 th, 2018
 Nissan Motor Co., Ltd. May 14 th, 2018 RESULTS BUSINESS UPDATES FY18 OUTLOOK www.nissan-global.com Copyright NISSAN MOTOR CO., LTD. All rights reserved. 2 GLOBAL 91.81 5.08 TIV * 1 vs. 93.52 GLOBAL +1.9%
Mazda Motor Corporation FISCAL YEAR MARCH 2016 FIRST HALF FINANCIAL RESULTS (Speech Outline)
") (For your information) November 5, 2015 Mazda Motor Corporation FISCAL YEAR MARCH 2016 FIRST HALF FINANCIAL RESULTS (Speech Outline) Representative Director Executive Vice President Akira Marumoto 1. HIGHLIGHTS
(For your information) November 5, 2015 Mazda Motor Corporation FISCAL YEAR MARCH 2016 FIRST HALF FINANCIAL RESULTS (Speech Outline) Representative Director Executive Vice President Akira Marumoto 1. HIGHLIGHTS
CONFERENCE CALL RESULTS Q1 2017
 CONFERENCE CALL RESULTS Q1 2017 May 5, 2017 Marc Bunz (CFO) Nicolas-Fabian Schweizer (CTO) AGENDA Market & Strategy Update Financials 2016 Financials Q1 2017 Outlook SCHWEIZER Share Schweizer Electronic
3 rd Quarter 2017 Results
 Inside your life! 3 rd Quarter 2017 Results October 25, 2017 Mobile Automotive Display Semiconductor IoT LED Contents Ⅰ. Q3 2017 Earnings Summary Ⅱ. Earnings Highlight & Outlook Ⅲ. Results & Outlook by
Q SALES Strong outperformance in all regions. April 20, 2018
 Q1 2018 SALES Strong outperformance in all regions April 20, 2018 Q1 2018 Sales - Key Facts Impact from IFRS15 implementation In 2017, Faurecia had already partly anticipated IFRS15 through the presentation
Q RESULTS. 24 th April 2018
 Q1 2018 RESULTS 24 th April 2018 DISCLAIMER This presentation does not constitute an offer to sell, or a solicitation of an offer to buy, PEUGEOT SA ( Company ) shares. This presentation may contain forward-looking
CAPITAL MARKETS DAY DR FRIEDRICH EICHINER MEMBER OF THE BOARD OF MANAGEMENT OF BMW AG, FINANCE.
 March 26, 2015 CAPITAL MARKETS DAY DR FRIEDRICH EICHINER MEMBER OF THE BOARD OF MANAGEMENT OF BMW AG, FINANCE. AGENDA. 1 Financial Status of 2014 2 Chances and Challenges in 2015 3 Towards a strong future
Valeo reports 14% growth in consolidated sales for third quarter 2011
 24.11 Valeo reports 14 growth in consolidated sales for third quarter 2011 Third quarter 2011-14 growth in consolidated sales (12 on a like-for-like basis 1 ) to 2,662 million euros - 17 growth in original
CHUCK STEVENS. CFO, GM North America
 CHUCK STEVENS CFO, GM North America FORWARD LOOKING STATEMENTS In this presentation and in related comments by our management, our use of the words expect, anticipate, possible, potential, target, believe,
Monro, Inc. Second Quarter Fiscal 2019 Earnings Call. October 25, 2018
 Monro, Inc. Second Quarter Fiscal 2019 Earnings Call October 25, 2018 Safe Harbor Statement and Non-GAAP Measures Certain statements in this presentation, other than statements of historical fact, including
Volvo Group THIRD QUARTER 2015 JAN GURANDER. Volvo Group Headquarters Third quarter
 Volvo Group THIRD QUARTER 2015 JAN GURANDER 1 VOLVO GROUP Third quarter highlights NET SALES SEK bn 12 months 310 bn IMPROVED PROFITABILITY ON FLAT VOLUMES UNDERLYING OPERATING MARGIN 6.9% 67 73 OPERATING
BMW Group posts record earnings for 2010
 10.03.2011 BMW Group posts record earnings for 2010 Profit before tax rises to euro 4,836 million Profit before financial result climbs to euro 5,094 million Automobiles segment reports EBIT of euro 4,355
Corporate Presentation. January 2018
 Corporate Presentation January 2018 Sales Performance Jan.- Dec. 201 Overall: Domestic: Exports: 1,24,6 units, +6% YoY 1,2,8 units +6% YoY,24 units -48% YoY A-segment Sedans (New Emgrand+Vision+Emgrand
thyssenkrupp Equity Story Components Technology May 2018
 thyssenkrupp Equity Story Components Technology May 2018 thyssenkrupp a diversified industrial group Sales 41.4 bn 1 ; EBIT adj. 1.7 bn 1 Continuing operations Components Technology (CT) 7.6 bn 377 mn
Q3 & 9M 2018 Results Presentation. October 24 th, 2018
 Q3 & 9M 2018 Results Presentation October 24 th, 2018 Q3 & 9M HIGHLIGHTS & CATEGORY SPOTLIGHTS Gonzalve BICH 3Q and 9M 2018 Results Presentation 2 9 Months 2018 Key Messages Continued challenging trading
FISCAL YEAR END MARCH 2012 FINANCIAL RESULTS. Mazda TAKERI
 FISCAL YEAR END MARCH 212 FINANCIAL RESULTS Mazda TAKERI Mazda Motor Corporation April 27, 212 1 PRESENTATION OUTLINE Highlights FY End March 212 Results FY End March 213 Forecast Summary Progress Toward