H Business Result
|
|
|
- Blake Ford
- 5 years ago
- Views:
Transcription


1 H Business Result
2 H business result is prepared for investors consideration only before completion of independent auditors review. Therefore, parts of contents on this material could be changeable during independent auditors review. 1
3 Contents I. H Overview II. Market analysis III. Performance analysis IV. Financials - Income Statement V. SYMC s Focus in H

4 H Review Market Domestic total market decrease : 3.4% (vs. H1 2016) due to tax support during H SUV market decrease : 7.6% in spite of growth in SUV-B & E segments - SUV-B : +12.5%, SUV-E : +21.0% Overseas : Growth in Europe & China Currency Unfavorable F/X movements (Q USD/KRW Avg.: KRW 1,129/USD, -2.9% yoy) 1,670 1,473 1,436 1,429 1,443 1,313 1,251 1,247 1,230 1,243 1,121 1,157 1,163 1,154 1,129 1,076 1,095 1,058 1,015 1,017 Q Q Q Q Q USD/KRW EUR/KRW JPY/KRW GBP/KRW Q vs. Q Chg. % vs. Q USD/KRW -2.9% -2.2% EUR/KRW -5.4% +1.1% JPY/KRW -5.5% +0.2% GBP/KRW -13.6% +1.0% SYMC Vehicle sales SYMC H1 domestic growth : 5% driven by G4 Rexton (5,411 units) - Market share grows from 5.4% to 5.9%. Export : Steep decline due to Iran, Peru, Egypt, etc. Tivoli brand portion in the small SUV market in H : 53%
5 Domestic Market Trend Quarterly market trend (Including imported cars) 28.4% 27.4% 29.0% 454K 62K 35K 129K 228K Q PC SUV MPV Commercial SUV M/S 446K 56K 33K 122K 234K Q K 60K 33K 154K 283K Q % 424K 59K 28K 115K 223K Q Unit: vehicles (Imported cars PC, SUV, MPV) 28.9% 28.4% 28.8% 510K 65K 30K 147K 267K Q K 48K 27K 111K 204K Q K 59K 31K 144K 265K Q % 26.9% 429K 61K 30K 115K 224K Q K 65K 31K 128K 250K Q Q (vs. Q2 2016) - Total market : -7.1% (Domestic makers: -8.7%, Imported: +4.0%) - PC : -6.4%, SUV : -13.5%, MPV : +1.5% - SUV M/S : 26.9% (-2.0%p vs. Q2 2016) - SYMC Market share in SUV market: +4.1%p Q : Q = 17.9% : 22.0% - SYMC Market share in total market: +0.6%p Q : Q = 5.5% : 6.1% H (vs. H1 2016) - Total market : -3.4% (Domestic makers : -4.1%, Imported : +1.2%) - PC: -3.0%, SUV: -7.6%, MPV: +1.8% - SYMC Market share in SUV market: +3.1%p H : H = 18.1% : 21.2% - SYMC market share in total market : +0.5%p H : H = 5.4% : 5.9%

 : Example SUV-B SUV-C SUV-D SUV-E (Tivoli) (Korando C) (G4")
6 Domestic SUV Market Trend Vehicle sales by segment Portion by segment K -9% 196K K +13% 54K 100% 90% 80% 22% +5%p 27% K 87K 16K -27% -13% +21% 47K 76K 19K 70% 60% 50% 40% 30% 20% 10% 0% 30% -6%p 24% 41% -2%p 39% 7% +3%p 10% Total SUV market : -8.7% SUV-B segment : +5%p SUV-B segment : +12.5% SUV-E segment : +3%p SUV-E segment : +21.0% Unit : Vehicle, % Excluding imported car & pick-up ( ) : Example SUV-B SUV-C SUV-D SUV-E (Tivoli) (Korando C) (G4 Rexton) 5
7 Overseas Market Trend Europe (28 Countries) Russia Jan.~May ,164K (24.4%) 1,600K 614K 6,547K Jan.~May K (37.0%) 203K 15K 549K Jan.~May ,199K (27.2%) 1,861K 589K 6,850K Jan.~May K (41.2%) 238K 15K 577K - Total market : +4.6% - SUV market : +16.3% - Total market : +5.1% - SUV market : +16.8% China Jan.~May 2016 Jan.~May ,626K 4,490K (31.2%) 3,195K (35.8%) 3,785K 1,044K 872K K 10,582K - Total market : +3.5% - SUV market : +18.5% Unit : Vehicle Source : Automotive News, Jato Excluding commercial vehicles ( ) : SUV portion out of total market PC SUV MPV Others 6
8 SYMC Sales Volume in Q ,911 12,837 (31%) -12% -45% 36,117 6,998 (19%) Sales volume decrease - Total Sales : -4,794 units (-12%) Domestic : +1,045 units (+4%) Export : -5,839 units (-45%) 28,074 +4% 29,119 (69%) (81%) Q Q Domestic portion increase : +12%p - Q : Q = 69% : 81% G4 Rexton - A leading SUV model in SUV-E segment (Market share of 46% in Q2 2017) Domestic Export Unit: vehicle (including CKD) 7
9 SYMC Sales Volume in H ,577-6% 70,345 23,881-29% 16,876 (32%) (24%) 50,696 +5% 53,469 (68%) (76%) Sales volume decrease - Total Sales : -4,232 units (-6%) Domestic : +2,773 units (+5%) Export : -7,005 units (-29%) Domestic portion increase : +8%p - H : H = 68% : 76% Steady Tivoli sales in domestic market - H : 28,624 units (+2% YoY) Domestic Export Unit: vehicle (including CKD) 8
10 Region-wise Export in H W. Europe % out of export sales volume (Including CKD) 50% 52% Asia Pacific Including: China Others 10% 5% South America 21% 17% 19% 26% Others: ME, AF, E. Europe 9
11 Income Statement(Consolidated) / Q Q (vs. Q2 2016) (Unit: billion krw) Category Q Q Change Change(%) Sales % Cost of sales % Gross Profit % SG&A % Operating Profit OP margin % 2.0% -0.7% -2.7%p - PAT
12 Operating Costs / Q Q (vs. Q2 2016) Cost of sales (%) SG&A expense (%) 82.6% +1.1%p 83.7% 15.4% +1.7%p 17.1% Q Q Q Q (Cost of Sales/Sales)*100 (SG&A expenses/sales)*100 11
13 Income Statement(Consolidated) / Q Q (vs. Q1 2017) (Unit: billion krw) Category Q Q Change Change(%) Sales % Cost of sales % Gross Profit % SG&A % Operating Profit OP margin % -2.0% -0.7% +1.3%p - PAT

14 Operating Costs / Q Q (vs. Q1 2017) Cost of sales (%) SG&A expense (%) 85.3% -1.6%p 16.7% 83.7% +0.4%p 17.1% Q Q Q Q (Cost of Sales/Sales)*100 (SG&A expenses/sales)*100 13
15 Income Statement(Consolidated) / H (Unit: billion krw) Category Change Change(%) Sales 1, , % Cost of sales 1, , % Gross Profit % SG&A % Operating Profit OP margin % 1.5% -1.3% -2.8%p - PAT

16 Operating Costs / H Cost of sales (%) SG&A expense (%) 84.4% 16.9% 82.7% +1.7%p 15.8% +1.1%p (Cost of Sales/Sales)*100 (SG&A expenses/sales)*100 15


17 Financial Ratio(Consolidated) / H Net Cash Borrowings Ratio Cash Borrowings (Unit: KRW billion) Net Debt : 31 Net Debt : % 24.2%


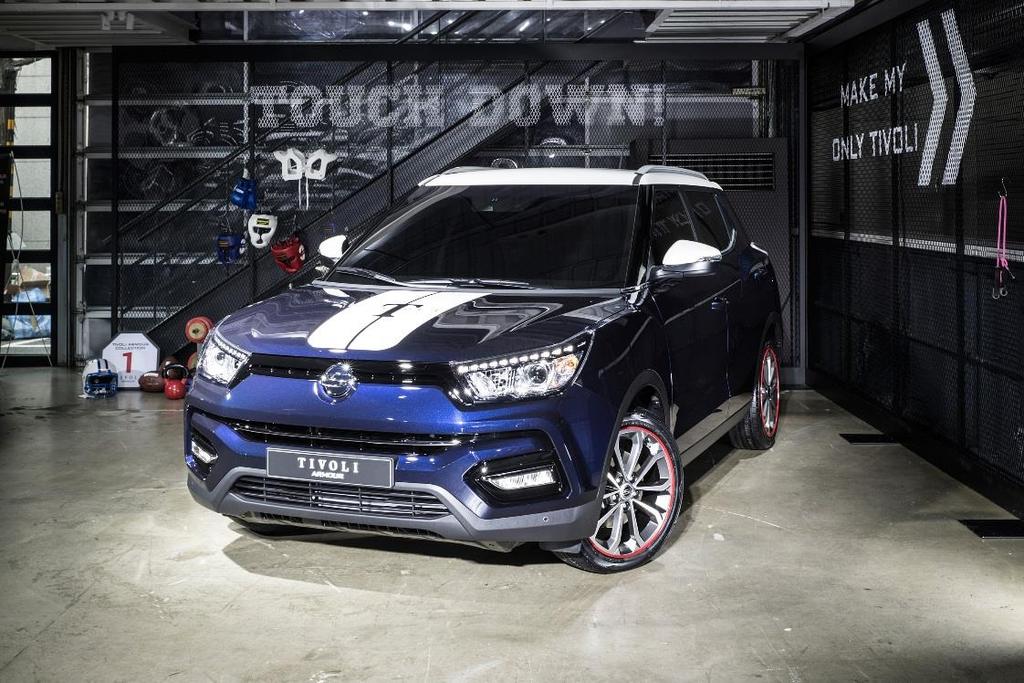
18 SYMC s Focus in H Vehicle sales - Domestic G4 Rexton variant model in H2 Tivoli product improvement model (Tivoli Armour) launch in July - Export G4 Rexton launch in H2 Cost control - Profitability priority - SY Auto capital - Cost reduction New car development - KorandoSports FMC in late 2017 or early Korando C FMC in 2019 Stable labor management relations - Sound relationship between SYMC management and labor union No production disruption for 8 years Profitability Management 17
H Business Result
 H1 2016 Business Result H1 2016 business result is prepared for investors consideration only before completion of independent auditors review. Therefore, parts of contents on this material could be changeable
Q Business Result
 Q3 2018 Business Result Q3 2018 business result is prepared for investors consideration only before completion of independent auditors review. Therefore, parts of contents on this material could be changeable
2018 Annual Business Result
 2018 Annual Business Result 2018 Annual business result is prepared for investors consideration only before completion of independent auditors review. Therefore, parts of contents on this material could
2015 Business Result
 2015 Business Result 본자료는 2015 년실적에대한외부감사인의회계검토가완료되지않은상태에서투자자여러분의편의를위하여작성된자료입니다. 따라서본자료의일부내용은회계검토과정에서변경될수있음을양지하시기바랍니다. 2015 business result is prepared for investors consideration only before completion
Ssangyong Motor Company, South Korea
 Ssangyong Motor Company, South Korea Contents I. SYMC Overview II. Maximizing resource utilization III. YTD September 2015 IV. Way Forward 1 SYMC Overview SYMC Product Range SYMC Products (Segment-wise)
Volvo Group THIRD QUARTER 2015 JAN GURANDER. Volvo Group Headquarters Third quarter
 Volvo Group THIRD QUARTER 2015 JAN GURANDER 1 VOLVO GROUP Third quarter highlights NET SALES SEK bn 12 months 310 bn IMPROVED PROFITABILITY ON FLAT VOLUMES UNDERLYING OPERATING MARGIN 6.9% 67 73 OPERATING
Earnings conference call Q3 2016
 Earnings conference call Q3 2016 Bo Annvik, CEO / Åke Bengtsson, CFO October 25, 2016 1 Agenda Business Highlights Market Update Sales Financials Outlook Public offer 2 Business Highlights Q3 2016 Solid
NET SALES AT SEPTEMBER 30, October 28, 2013
 NET SALES AT SEPTEMBER 30, 2013 October 28, 2013 1 NET SALES AT 30 SEPTEMBER 30, 2013 October 28, 2013 Net Sales of 15,282m over First 9 Months, Sales Volumes Up 2% in 3 rd Quarter Markets: up in Q3 Europe:
FISCAL YEAR MARCH 2018 FIRST QUARTER FINANCIAL RESULTS
 FISCAL YEAR MARCH 2018 FIRST QUARTER FINANCIAL RESULTS PRESENTATION OUTLINE Highlights Fiscal Year March 2018 First Quarter Results Fiscal Year March 2018 Full Year Forecast Structural Reform Stage 2 Progress
Earning Presentation
 Earning Presentation for the nine months ended December 31, 2018 February 13, 2019 This presentation contains forward looking statements that are based on current expectations and assumptions. Actual results
Financial Results for the Fiscal Year 2018 Third Quarter
 Financial Results for the Fiscal Year 218 Third Quarter http://www.star-m.jp Code 7718 January 1, 218 * The projections in this document are based on information available at the time of release of this
As a note, this presentation was released as the dates shown and reflected management views as of these dates. All information in this presentation
 February 2004 1 As a note, this presentation was released as the dates shown and reflected management views as of these dates. All information in this presentation regarding the Company s financial results
Third Quarter 2017 Performance and Business Update. October 26, 2017
 Third Quarter 2017 Performance and Business Update October 26, 2017 1 Important Notice Please read this management presentation together with the Company s press release issued earlier today announcing
FISCAL YEAR MARCH 2015 FIRST HALF FINANCIAL RESULTS. New Mazda Demio
 FISCAL YEAR MARCH 2015 FIRST HALF FINANCIAL RESULTS New Mazda Demio Mazda Motor Corporation October 31, 2014 1 PRESENTATION OUTLINE Highlights Fiscal Year March 2015 First Half Results Fiscal Year March
FISCAL YEAR ENDING MARCH 2012 FIRST HALF FINANCIAL RESULTS
 FISCAL YEAR ENDING MARCH 2012 FIRST HALF FINANCIAL RESULTS Mazda Motor Corporation November 2, 2011 New Mazda CX-5 (European specifications) 1 PRESENTATION OUTLINE Highlights Fiscal Year Ending March 2012
Third Quarter 2018 Performance and Business Update. October 24, 2018
 Third Quarter 2018 Performance and Business Update October 24, 2018 1 Important Notice Please read this management presentation together with the Company s press release issued earlier today announcing
FISCAL YEAR MARCH 2018 FIRST HALF FINANCIAL RESULTS
 FISCAL YEAR MARCH 2018 FIRST HALF FINANCIAL RESULTS PRESENTATION OUTLINE Highlights Fiscal Year March 2018 First Half Results Fiscal Year March 2018 Full Year Forecast Progress of Key Initiatives/ Business
Q Financial Results
 Q3 2018 Financial Results 1 Forward-looking statement The statements on the future in this presentation, including expected sales and earnings, are associated with risks and uncertainties and may be affected
2007 3Q Investor Meeting. November 2007
 2007 3Q Investor Meeting November 2007 Company Overview Cumulative 3Q 2007 Results Result By Division Appendix Company Overview Overview Doosan Infracore is the largest machinery company in Korea and also
282m 75% +575m. Net sales Operating income before non-recurring items. Operating margin before non-recurring items. Net Loss.
 First-Half 2009 Financial Highlights Net sales Operating income before non-recurring items Operating margin before non-recurring items Net Loss Net debt-to-equity ratio Free cash flow** 7,134m 282m 4.0%
FISCAL YEAR MARCH 2015 FIRST QUARTER FINANCIAL RESULTS. Mazda Roadster 25 th Anniversary Model
 FISCAL YEAR MARCH 2015 FIRST QUARTER FINANCIAL RESULTS Mazda Roadster 25 th Anniversary Model Mazda Motor Corporation July 31, 2014 1 PRESENTATION OUTLINE Highlights Fiscal Year March 2015 First Quarter
EXANE BNP PARIBAS 13th European Seminar June 8, 2011
 EXANE BNP PARIBAS 13th European Seminar June 8, 2011 This presentation may contain forward-looking statements. Such forward-looking statements do not constitute forecasts regarding the Company s results
Second quarter AB Volvo
 1 VOLVO GROUP Strengthened focus on core business divests Volvo Aero Enterprise value of SEK 6.9 billion. Completion expected during the third quarter of 2012. acquires shares in Deutz AG Largest shareholder
Earnings conference call Q4 & FY 2016
 Earnings conference call Q4 & FY 2016 Bo Annvik, CEO / Åke Bengtsson, CFO February 10, 2016 1 Agenda Business Highlights Market Update Sales Financials Way forward 2 Business Summary FY 2016 A year with
Earnings conference call. Q4 and Full year 2015
 Earnings conference call Q4 and Full year 2015 Bo Annvik, CEO / Åke Bengtsson, CFO 11 February 2016 1 Agenda Business Highlights Market Update Sales Financials Outlook 2 2015 in numbers Operating margin
As a note, this presentation was released as the dates shown and reflected management views as of
 Oct. 2002 1 As a note, this presentation was released as the dates shown and reflected management views as of these dates. While reviewing this information, the data and information contain certain forward-looking
2016 Annual Results Presentation. March 15, 2017
 2016 Annual Results Presentation March 15, 2017 Frank Chan 2 2016 Full Year Results (US$ m) 2015 2016 Change Local Curr Sales $5,038 $5,480 +8.8% +9.8% Gross Profit $1,798 $1,985 +10.4% Gross Margin %
FISCAL YEAR MARCH 2018 THIRD QUARTER FINANCIAL RESULTS
 FISCAL YEAR MARCH 2018 THIRD QUARTER FINANCIAL RESULTS PRESENTATION OUTLINE Highlights Fiscal Year March 2018 Nine Month Results Fiscal Year March 2018 Full Year Forecast Progress of Key Initiatives 1
Kongsberg Automotive ASA. Fourth quarter February 28, 2019
 Kongsberg Automotive ASA Fourth quarter - February 28, 2019 Highlights Q4 Sales Revenues grew by 21 (7.3%) YoY to 288 including negative FX effects of 1. We booked new business with 77 in expected annual
NET SALES at September 30, 2014
 NET SALES at September 30, 2014 October 22, 2014 1 Net sales at September 30, 2014 October 22, 2014 Net sales of 14,558m in a still slowing global market The market slowdown observed since the second quarter
FISCAL YEAR MARCH 2014 FINANCIAL RESULTS
 FISCAL YEAR MARCH 214 FINANCIAL RESULTS Mazda CX-5 Mazda Atenza Mazda Motor Corporation April 25, 214 New Mazda Axela 1 PRESENTATION OUTLINE Highlights Fiscal Year March 214 Results Fiscal Year March 215
3 rd Quarter 2017 Results
 Inside your life! 3 rd Quarter 2017 Results October 25, 2017 Mobile Automotive Display Semiconductor IoT LED Contents Ⅰ. Q3 2017 Earnings Summary Ⅱ. Earnings Highlight & Outlook Ⅲ. Results & Outlook by
SOLLERS IFRS RESULTS 1H2017
 SOLLERS IFRS RESULTS 1H2017 28.08.2017 2 1. 1H2017 SOLLERS STRATEGIC DEVELOPMENTS 2. RUSSIAN AUTOMOTIVE MARKET OVERVIEW 3. SOLLERS OPERATING AND FINANCIAL PERFORMANCE IN 1H2017 4. SOLLERS JOINT VENTURES
Q RESULTS. 24 th April 2018
 Q1 2018 RESULTS 24 th April 2018 DISCLAIMER This presentation does not constitute an offer to sell, or a solicitation of an offer to buy, PEUGEOT SA ( Company ) shares. This presentation may contain forward-looking
1 st Half 2018 Results. August 1 st, 2018
 1 st Half 2018 Results August 1 st, 2018 H1 HIGHLIGHTS & CATEGORY SPOTLIGHTS Gonzalve BICH 2 First Half 2018 Key Messages Challenging market and business environment Continued investment in targeted Brand
Third Quarter Results (ended December 31, 2014)
") Fiscal Year 214 (ending March 31, 215) Third Quarter Results (ended December 31, 214) Brother Industries, Ltd. February 4, 215 Information on this report, other than historical facts, refers to future
Fiscal Year 214 (ending March 31, 215) Third Quarter Results (ended December 31, 214) Brother Industries, Ltd. February 4, 215 Information on this report, other than historical facts, refers to future
FISCAL YEAR MARCH 2015 THIRD QUARTER FINANCIAL RESULTS. Updated Mazda CX-5 (Japanese specification model)
") FISCAL YEAR MARCH 2015 THIRD QUARTER FINANCIAL RESULTS Updated Mazda CX-5 (Japanese specification model) Mazda Motor Corporation February 4, 2015 1 PRESENTATION OUTLINE Highlights Fiscal Year March 2015
FISCAL YEAR MARCH 2015 THIRD QUARTER FINANCIAL RESULTS Updated Mazda CX-5 (Japanese specification model) Mazda Motor Corporation February 4, 2015 1 PRESENTATION OUTLINE Highlights Fiscal Year March 2015
Results 1st Quarter 2018/19 1 April 2018 to 30 June 2018
 Results 1st Quarter 2018/19 1 April 2018 to 30 June 2018 31 July 2018 Agenda 1. LEM at a Glance 2. Highlights and Business Review 3. Financial Review 4. Strategy HOY / HOYA 2 1. Global Market Leader Market
Earnings conference call
 Earnings conference call Full year 2017 Åke Bengtsson, President & CEO Andreas Ekberg, Acting CFO February 14, 2018 1 Agenda Business Summary Market Update Sales Financials Way forward 2 Business Summary
PRESS MEET Q3 - FY14. Dr. Reddy s Laboratories Limited February 11, Dr. Reddy's Laboratories Limited. All Rights Reserved.
 Dr. Reddy s Laboratories Limited February 11, 2014 Q3 FY 14 Business Highlights Sales ` 3,534 Cr 23 % Gross Margin 60.5 % 42% R & D 8.4 % 47 % 28.4 % 67 % to sales -- Q3 FY13 at 7.1% to Sales YoYGr% YoYGr%
Alfa Laval Slide 3.
 Report for Q3 2009 - Orders received and margins - Highlights - Development per segment - Geographical development - Financials - Outlook Mr. Lars Renström President and CEO Alfa Laval Group Key figures
Q3 & 9M 2018 Results Presentation. October 24 th, 2018
 Q3 & 9M 2018 Results Presentation October 24 th, 2018 Q3 & 9M HIGHLIGHTS & CATEGORY SPOTLIGHTS Gonzalve BICH 3Q and 9M 2018 Results Presentation 2 9 Months 2018 Key Messages Continued challenging trading
Third quarter AB Volvo
 1 VOLVO GROUP Slowing demand and lower earnings driven by one-offs and under-absorption SALES TREND SEK bn 12 months 318 bn OPERATING INCOME SEK bn 12 months* 25 bn 64 73 69 4.9 5.8 4.0* Q3 Q4 Q1 Q2 Q3
July 27, Copyright(C) 2006 Isuzu Motors Ltd. All rights reserved. FORWARD-New Long Term Emission version. ELF-CNG version
 2006 Isuzu Motors Ltd. All rights reserved. FORWARD-New Long Term Emission version. ELF-CNG version") ELF-CNG version FORWARD-New Long Term Emission version 2.5L/3.0L Super Clean & Economy Diesel Isuzu D-MAX GIGA-New Long Term Emission version July 27, 2006 1 Copyright(C) 2006 Isuzu Motors Ltd. All rights
ELF-CNG version FORWARD-New Long Term Emission version 2.5L/3.0L Super Clean & Economy Diesel Isuzu D-MAX GIGA-New Long Term Emission version July 27, 2006 1 Copyright(C) 2006 Isuzu Motors Ltd. All rights
Steering ahead FY2012 Results Briefing 22 nd June 2012
 Steering ahead FY2012 Results Briefing 22 nd June 2012 AGENDA FY2012 Highlights Business Overview Financial and Operations Highlights Industry Review Outlook & Growth Strategies FY2012 HIGHLIGHTS Revenue
FISCAL YEAR ENDED MARCH 2011 FINANCIAL RESULTS
 FISCAL YEAR ENDED MARCH 211 FINANCIAL RESULTS Mazda Motor Corporation April 28, 211 Mazda MINAGI 1 PRESENTATION OUTLINE Highlights Fiscal Year Ended March 211 Results In Summary Question & Answer Session
FISCAL YEAR MARCH 2014 FIRST HALF FINANCIAL RESULTS. New Mazda Axela (Overseas name: New Mazda3)
") FISCAL YEAR MARCH 2014 FIRST HALF FINANCIAL RESULTS New Mazda Axela (Overseas name: New Mazda3) Mazda Motor Corporation October 31, 2013 1 PRESENTATION OUTLINE Highlights Fiscal Year March 2014 First Half
FISCAL YEAR MARCH 2014 FIRST HALF FINANCIAL RESULTS New Mazda Axela (Overseas name: New Mazda3) Mazda Motor Corporation October 31, 2013 1 PRESENTATION OUTLINE Highlights Fiscal Year March 2014 First Half
Record CY 2016 EPS-diluted-adjusted of $6.12, an increase of $1.10 Y-O-Y. Q EPS-diluted-adjusted of $1.28, a decrease of $0.11 Y-O-Y.
 1 2 3 Q4 2016 global deliveries up 0.1 million units year-over-year (Y-O-Y), a 3.3% increase. Volume gains primarily in North America and China, offset by reductions in International Operations (excluding
Somboon Advance Technology PCL
 Somboon Advance Technology PCL Opportunity Day 2017Q2 September 12, 2017 1 Company Overview Automotive Industry Overview Tractor Industry Overview Sale Performance Financial Highlights Q&A 2 Company Overview
third QUARTER 2012 October 26, 2012
 third QUARTER 212 October 26, 212 Helena norrman Senior Vice President Communications third QUARTER 212 October 26, 212 This presentation contains forward-looking statements. Such statements are based
2013 Final Results. 19 March 2014
 2013 Final Results 19 March 2014 Important Notice The information contained herein is meant for presentation purposes only and may not be used and relied upon by any other party. It is not to be taken
RESULTS 3RD QUARTER AND NINE MONTHS OF 2016/17 1 APRIL 2016 TO 31 DECEMBER 2016
 RESULTS 3RD QUARTER AND NINE MONTHS OF 2016/17 1 APRIL 2016 TO 31 DECEMBER 2016 16 February 2017 Agenda 1. LEM at a Glance 2. Highlights and Business Review 3. Financial Review 4. Strategy and Outlook
FY2015 Third Quarter Financial Results
 FY2015 Third Quarter Financial Results Mitsubishi Motors Corporation February 3, 2016 FY2015 Third Quarter Financial Results All-new Pajero Sport 1 FY2015 1-3Q Results Summary (vs. FY2014 1-3Q) Increase
Results Briefing FY2016 1H
 Securities Code: 6770 Results Briefing FY2016 1H Friday, October 28, 2016 Contents FY2016 1H Consolidated Financial Results P. 3-9 FY2016 Consolidated Financial Results Forecast P. 10-13 Dividend Forecast
BMW GROUP QUARTERLY REPORT. TO 30 SEPTEMBER 2014
 . BMW GROUP QUARTERLY REPORT. TO 30 SEPTEMBER 2014 THE BMW GROUP IS WELL ON TRACK AND PERFORMS IN LINE WITH THE GUIDANCE. The BMW Group is well on track to reach its targets for 2014. Full year guidance
Presentation to Investors Q results ROYAL DSM HEALTH NUTRITION MATERIALS
 Presentation to Investors Q3 2016 results ROYAL DSM HEALTH NUTRITION MATERIALS Safe harbor statement This presentation may contain forward-looking statements with respect to DSM s future (financial) performance
FY2008 3Q Financial Results Apr. Dec. 07 / Oct. Dec. 07. FY2008 3Q Financial Results
 FY2008 3Q Financial Results FY2008 3Q Financial Results Apr. Dec. 07 / Oct. Dec. 07 February 7, 2008 1 Copyright(C) 2008 Isuzu Motors Limited All rights reserved 1. FY2008 3Q Highlight Director: MASANORI
JAGUAR LAND ROVER RESULTS FOR THE THREE MONTHS ENDED 31 DECEMBER th FEBRUARY 2017
 JAGUAR LAND ROVER RESULTS FOR THE THREE MONTHS ENDED 31 DECEMBER 2016 14 th FEBRUARY 2017 DISCLAIMER Statements in this presentation describing the objectives, projections, estimates and expectations of
ANALYST BRIEFING FOR THE FOURTH QUARTER ENDED FEBRUARY 2017
 ANALYST BRIEFING FOR THE FOURTH QUARTER ENDED 2016 22 FEBRUARY 2017 MSM Malaysia Holdings Berhad Analyst Briefing Q4 2016 22/2/2017 1 CONTENTS 01 02 03 04 05 Group Financial Highlights Performance Review
FY2018 Financial Results
 FY2018 Financial Results May 14, 2018 ISUZU MOTORS LIMITED 1 Copyright(C) 2018 Isuzu Motors Limited All rights reserved Contents Ⅰ. President and Representative Director : Masanori Katayama FY2018 and
FOURTH QUARTER 2017 Martin Lundstedt, President and CEO
 FOURTH QUARTER 2017 Martin Lundstedt, President and CEO Volvo Group FOURTH QUARTER HIGHLIGHTS Net sales +11% (+16% excl. currency) Continued improved profitability for the Group - Trucks adjusted operating
Months Investor Presentation
 2018 9 Months Investor Presentation 25.10.2018 Disclaimer Ereğli Demir Çelik Fabrikaları T.A.Ş. (Erdemir) may, when necessary, make written or verbal announcements about forward-looking information, expectations,
2010 1Q Investor Meeting. May 2010
 2010 1Q Investor Meeting May 2010 This presentation contains preliminary figures which may be materially different from the final figures. While the statements in this presentation represent our current
Full-year Report 2009
 Full-year Report 2009 Joakim Olsson CEO and President February 12, 2009 Innovative Vehicle Technology 2010-02-12 Summary 2009 Sales of SEK 5,622m (8,403) Adjusted for currency effects sales decreased by
2Q06 Results. Investor Relations
 2Q06 Results Investor Relations Content 1. 2Q06 Key Results 2. Summarized Income Statement 3. Balance Sheet as of Jun. 2006 4. Outlook for 2006 5. Result & Outlook By Division Appendix : 2Q06 Results Breakdown
Baoshan Iron & Steel Co., Ltd. August 2010
 Baoshan Iron & Steel Co., Ltd. August 2010 1 Disclaimer: The following presentation distributed herewith includes forwardlooking statements. All statements, other than statements of historical facts, that
Hyundai Motor Company. Investor Presentation June 2013
 Hyundai Motor Company Investor Presentation June 2013 Table of Contents 1. Executive Summary 2. Key Strengths for HMC 3. Future Strategies 4. Market Update by Region Appendix 1 1. Executive Summary Executive
LOCK & LOCK. 2Q12 Earnings Release. July 30, 2012
 LOCK & LOCK 2Q12 Earnings Release July 30, 2012 Contents 1. 2Q12 Preliminary Earnings 2. Sales Breakdown by Region 3. Sales Breakdown by Channel 4. Sales Breakdown by Product Category 5. Summary Financials
Continued strong performance in key businesses
 Continued strong performance in key businesses SECOND QUARTER PRELIMINARY RESULTS August 9, Disclaimer "This presentation and the associated slides and discussion contain forward-looking statements. These
Kongsberg Automotive ASA. Third quarter November 7, 2018
 Kongsberg Automotive ASA Third quarter - November 7, Q3 Highlights Continued improvements in turbulent times Revenues increased YoY by MEUR 18.3 (~8%) to MEUR 259 including negative FX effects of MEUR
2017 Q3 REVENUE. October 25 th, 2017
 2017 Q3 REVENUE October 25 th, 2017 DISCLAIMER This presentation does not constitute an offer to sell, or a solicitation of an offer to buy, PEUGEOT SA ( Company ) shares. This presentation may contain
Results 3 rd quarter and nine months of 2015/16. 1 April 2015 to 31 December 2015
 Results 3 rd quarter and nine months of 2015/16 1 April 2015 to 31 December 2015 16 February 2016 Agenda 1. LEM at a Glance 2. Highlights and Business Review 3. Financial Review 4. Strategy and Outlook
Conférence d Automne - Cheuvreux. Paris, September 26 th, 2011
 Conférence d Automne - Cheuvreux Paris, September 26 th, 2011 This presentation may contain forward-looking statements. Such forward-looking statements do not constitute forecasts regarding the Company
Results Briefing FY2014 1H
 Securities Code: 6770 Results Briefing FY2014 1H Friday, October 31, 2014 COPYRIGHT(C)2014 ALPS ELECTRIC CO.,LTD. ALL RIGHT RESERVED. Contents FY2014 1H Consolidated Financial Results P. 2-9 FY2014 Consolidated
Jaguar Land Rover Results For the quarter ended 30 June August 2015
 Jaguar Land Rover Results For the quarter ended 30 June 2015 7 August 2015 1 Disclaimer Statements in this presentation describing the objectives, projections, estimates and expectations of Jaguar Land
Q2 and Half-Year 2013 Results
 Q2 and Half-Year 2013 Results July 24, 2013 Contents Results for Q2 2013 Outlook for 2013 Information on the Divisions 2 Results Q2 2013 Highlights of Q2 2013 Group unit sales 605,800 (+6%) Record unit
February Annual Results February 13, 2008
 February 2008 1 Annual Results February 13, 2008 AGENDA AGENDA 2007 Highlights 2007 Financial Results x Competitiveness Sales and products dynamic International 2008 Outlook February 2008 2 2007: performance
Q Analyst Teleconference. 9 August 2018
 9 August 218 Disclaimer This presentation contains forward-looking statements that reflect the Company management s current views with respect to certain future events. Although it is believed that the
THREE MONTHS REPORT, JAN MARCH 2016
 THREE MONTHS REPORT, JAN MARCH 2016 TELEPHONE CONFERENCE 26 APRIL, 2016, AT 14:30 CET TOMMY ANDERSSON, PRESIDENT AND CEO HELENA WENNERSTRÖM, EVP AND CFO TO PARTICIPATE, PLEASE CALL 5 MINUTES BEFORE THE
Pakistan Refining Industry An Overview
 Pakistan Refining Industry An Overview October 2016 Oil World Crude Oil Reserves Largely sustained level of reserves Largest Region Contributes 47% (2014: 47.2%) Global proven oil reserves in 2015 fell
Key figures, second half 2005
 2005 Second Half and Full Year Results Pierre Lévi Frank Imbert 2006 6 February Key figures, second half 2005 ( m) 2H05 / 2H04 Sales 5,365.8 0.3%* Operating margin 2.0% (1.5) pt Restructuring costs (75.1)
Volvo Group THIRD QUARTER 2016 MARTIN LUNDSTEDT PRESIDENT AND CEO. Volvo Group Headquarters Third quarter
 Volvo Group THIRD QUARTER 2016 MARTIN LUNDSTEDT PRESIDENT AND CEO 1 VOLVO GROUP Third quarter highlights NET SALES SEK bn 12 months 299 bn 73.3 68.8 ADJUSTED OPERATING MARGIN* 12 months 6.7% % 6.9% 7.0%
Investor Presentation. 9 th August 2017
 Investor Presentation 9 th August 2017 Tata Motors Statements in this presentation describing the objectives, projections, estimates and expectations of the Company i.e. Tata Motors Ltd and its direct
Financial Summary for 2Q-FY2017 And Projections for FY2017
 Financial Summary for 2Q-FY2017 And Projections for FY2017 1 INDEX 01 Financial Summary for 2Q-FY2017 02 Performance Forecast for FY2017 03 Topics 2 01 Financial Summary for 2Q-FY2017 3 01 Financial Summary
Financial Results for First Quarter of FY2015
 Financial Results for First Quarter of FY2015 (From April 1, 2014 to June 30, 2014) July 29, 2014 Hino Motors, Ltd. 1. Sales Turnover 2/15 Global Unit Sales (Retail Sales) 3/15 Sales Sales decreased decreased
Kung Long Batteries. Performance and future outlook. Stock Code 1537
 Kung Long Batteries Performance and future outlook Stock Code 1537 Contents Company Industry Sale Profile Financials www.klb.com.tw Performance of Vietnam plant Our strength and outlook 2 Kung Long Batteries
1 st Half Joakim Olsson CEO and President July 17, Innovative Vehicle Technology
 1 st Half 2009 Joakim Olsson CEO and President July 17, 2009 Innovative Vehicle Technology 2009-07-17 Summary 1st half 2009 Sales of SEK 2,971m (4,473) Adjusted for currency exchange rates, sales declined
ABB delivers strong order growth and cash in Q2
 ABB delivers strong order growth and cash in Orders up 13% 1 ; book-to-bill ratio of 1.04x 2 Group operational EBITDA 3 impacted by loss in Power Systems (PS) Decisive step change actions implemented in
Statement Dr. Norbert Reithofer Chairman of the Board of Management of BMW AG Conference Call Interim Report to 30 June August 2014, 10:00 a.m.
 - Check against delivery - Statement Dr. Norbert Reithofer Chairman of the Board of Management of BMW AG Conference Call Interim Report to 30 June 2014, 10:00 a.m. Ladies and Gentlemen! Since July, Europe
TOFAŞ Q ANALYST PRESENTATION
 TOFAŞ Q1 2016 ANALYST PRESENTATION 03.05.2016 1 2016 Q1 AGENDA Highlights Turkish Automotive Industry Production & Capacity Utilization Domestic Market Developments Tofaş Domestic Market Performance Export
FIRST QUARTER 2017 Martin Lundstedt, President and CEO
 FIRST QUARTER 2017 Martin Lundstedt, President and CEO Volvo Group FIRST QUARTER HIGHLIGHTS Continued improved profitability for the Group Trucks adjusted operating margin 9.9% (7.8) on 4% lower HD/MD
1 Copyright(C) 2012 Isuzu Motors Limited All rights reserved
 2012 Isuzu Motors Limited All rights reserved") FY2012 Financial Results May 10, 2012 1 Copyright(C) 2012 Isuzu Motors Limited All rights reserved Contents Ⅰ. President and Representative Director : Susumu Hosoi FY2012 Overview Ⅱ. Director Director
FY2012 Financial Results May 10, 2012 1 Copyright(C) 2012 Isuzu Motors Limited All rights reserved Contents Ⅰ. President and Representative Director : Susumu Hosoi FY2012 Overview Ⅱ. Director Director
DAEWOO HEAVY INDUSTRIES & MACHINERY
 www.dhiltd.co.kr DAEWOO HEAVY INDUSTRIES & MACHINERY November 2003 Our projections in this document are based on current economic conditions and DHIM s current management policy. www.dhiltd.co.kr CONTENTS
JAGUAR LAND ROVER INVESTOR CALL
 JAGUAR LAND ROVER INVESTOR CALL RESULTS FOR THE THREE AND SIX MONTHS ENDED 30 SEPTEMBER 2017 Kenneth Gregor, CFO 9 th NOVEMBER 2017 DISCLAIMER Statements in this presentation describing the objectives,
Interim results June 30, 2003
 1 Interim results June 30, 2003 2 In units W orldwide sales at June 30 (cars and light commercial vehicles) > Worldwide sales at June 30, 2003: 1,689,200 cars and light commercial vehicles, versus 1,656,900
Mazda Motor Corporation FISCAL YEAR MARCH 2016 FIRST HALF FINANCIAL RESULTS (Speech Outline)
") (For your information) November 5, 2015 Mazda Motor Corporation FISCAL YEAR MARCH 2016 FIRST HALF FINANCIAL RESULTS (Speech Outline) Representative Director Executive Vice President Akira Marumoto 1. HIGHLIGHTS
(For your information) November 5, 2015 Mazda Motor Corporation FISCAL YEAR MARCH 2016 FIRST HALF FINANCIAL RESULTS (Speech Outline) Representative Director Executive Vice President Akira Marumoto 1. HIGHLIGHTS
Q SALES Strong sales growth and robust outperformance Confirmed FY 2018 guidance. October 11, 2018
 Q3 2018 SALES Strong sales growth and robust outperformance Confirmed FY 2018 guidance October 11, 2018 Agenda 1 Q3 2018 Sales p. 3 2 Update on IFRS 15 - Clarification about R&D capitalization p. 13 3
SOLLERS COMPANY OVERVIEW
 SOLLERS COMPANY OVERVIEW 1. CORPORATE STRUCTURE GROUP PRODUCTION FACILITIES 2. FY2015 MARKET OVERVIEW FY2015 OPERATING RESULTS 3. 2M2016 OPERATING RESULTS SHAREHOLDER EQUITY AND STOCK INFORMATION 2 CORPORATE
FISCAL YEAR END MARCH 2013 FIRST HALF FINANCIAL RESULTS. New Mazda6 (Atenza)
") FISCAL YEAR END MARCH 2013 FIRST HALF FINANCIAL RESULTS New Mazda6 (Atenza) Mazda Motor Corporation October 31, 2012 1 PRESENTATION OUTLINE Highlights Fiscal Year March 2013 First Half Results Fiscal Year
FISCAL YEAR END MARCH 2013 FIRST HALF FINANCIAL RESULTS New Mazda6 (Atenza) Mazda Motor Corporation October 31, 2012 1 PRESENTATION OUTLINE Highlights Fiscal Year March 2013 First Half Results Fiscal Year
RESULTS FOR Q ANALYST TELECONFERENCE
 RESULTS FOR Q4 216 ANALYST TELECONFERENCE Market 1 2 Operation Financials 3 Market 1 216 Fourth Quarter Market Conditions Product Market Crude Oil Postponed Maintenances Started to take place High Agricultural