Jaguar Land Rover Results For the quarter ended 30 June August 2015
|
|
|
- Patrick Taylor
- 6 years ago
- Views:
Transcription

1 Jaguar Land Rover Results For the quarter ended 30 June August
2 Disclaimer Statements in this presentation describing the objectives, projections, estimates and expectations of Jaguar Land Rover Automotive plc and its direct and indirect subsidiaries (the Company, Group or JLR ) may be forward-looking statements within the meaning of applicable securities laws and regulations. Actual results could differ materially from those expressed or implied. Important factors that could make a difference to the Company s operations include, among others, economic conditions affecting demand / supply and price conditions in the domestic and overseas markets in which the Company operates, changes in Government regulations, tax laws and other statutes and incidental factors. Q1 FY16 represents the 3 month period from 1 April 2015 to 30 June 2015 Q1 FY15 represents the 3 month period from 1 April 2014 to 30 June 2014 Consolidated results of Jaguar Land Rover Automotive plc and its subsidiaries contained in the presentation are unaudited and presented under IFRS as approved in the EU. Volume data includes sales from unconsolidated Chinese joint venture. 2
3 Participants Kenneth Gregor CFO, Jaguar Land Rover C. Ramakrishnan Group CFO, Tata Motors Bennett Birgbauer Treasurer, Jaguar Land Rover 3
4 Agenda Key topics Page Financial performance 5 New products and other developments 15 Closing Q&A 19 4
5 Solid FY16 profits Lower than very strong quarter a year ago on weaker China sales Retail volumes 114,905, down slightly (0.6)%, with Land Rover up 0.8% and Jaguar down (7.4)% Revenue 5,002m, down 351m EBITDA 821m and PBT 638m, down 266m and 286m respectively with an EBITDA margin of 16.4% Free cash flow (818)m driven by inventory build for XE and XF launch and from lower China sales Cash and financial deposits 3.3bn and undrawn committed bank lines 1.5bn (recently increased to 1.8bn) 150m dividend paid to Tata Motors in June
6 Key financial metrics Key metrics - IFRS Quarter ended 30 June ( millions, unless stated) Change Retail volumes ('000 units)* (0.7) Wholesale volumes ('000 units) (4.6) Revenues 5,002 5,353 (351) EBITDA ** 821 1,087 (266) EBITDA % 16.4% 20.3% (3.9 ppt) Profit before tax (286) Profit after tax (201) Free cash flow (818) 5 (823) Cash, Cash Equivalents and Financial Deposits 3,258 3,301 (43) *Volume data includes sales from unconsolidated Chinese joint venture **EBITDA defined to include the revaluation of current assets and liabilities and realised FX and commodity hedges but excludes the revaluation of foreign currency debt and unrealised FX and commodity hedges 6
7 Q1 FY16 financial performance detail Land Rover retail volumes of 96.8k units, up 0.8% - Range Rover, Range Rover Sport and Discovery up, as well as Discovery Sport up on the discontinued Freelander Jaguar retail volumes of 18.1k, down (7.4)% - XF and XJ down ahead of all new XF and refreshed XJ, on sale in Q2 FY16. Also discontinued XK. Partially offset by retail sales of the XE since May. EBITDA of 821m (16.4% margin), down 266m from very strong Q1 FY1 15 [EBITDA of 1,087m (20.3% margin)] primarily reflecting: Lower wholesale volumes and less favourable market mix due to lower China sales Less favourable model mix Offset partially by receipt of 62m local market incentive PBT of 638m, down 286m reflecting: Lower EBITDA Higher depreciation and amortisation Favourable revaluation of foreign currency debt and mark to market of unrealised hedges not eligible for hedge accounting under IAS 39 PAT of 492m, down 201m reflecting an effective tax rate of 22.9% 7
8 Quarterly retail volumes by geography Total retail sales of 114.9k down (0.6)% overall* UK North America China Jun FY16 Up 20% Up 13% Down (33)% Overseas, 18% UK, 20% Europe (ex. Russia), 25% China Region, 19% 114,905 Units North America, 18% Europe All other markets Jun FY15 Up 28% Down (10)% Overseas, 20% UK, 16% Land Rover Jaguar Units in 000 s. *Volume data includes sales from unconsolidated Chinese joint venture Europe (ex. Russia), 20% 115,596 China Region, 28% Units North America, 16% 8
9 Quarterly retail volumes by carline Total retail sales of 114.9k down (0.6)% overall* Jaguar - Q1FY15 vs Q1FY16 Land Rover - Q1FY15 vs Q1FY16 Down (7.4)% Up 0.8% Range Rover F-TYPE XK XJ XF XE * Range Rover Sport Range Rover Evoque Discovery Discovery Sport Freelander Defender Units in 000 s. *Volume data includes sales from unconsolidated Chinese joint venture. 9
10 Market Focus China Market Challenges As previously indicated, economic conditions in China has become more mixed and we have expected a certain normalization of the automotive market, which gathered pace in the last Quarter with the industry down (3.4)% year on year in June. JLR sales were down more than the industry as a whole due to a number of factors including: Slower sales ramp up of new Evoque produced in the China JV combined with start-up of the new integrated Marketing Sales and Service organisation Run out of the Freelander and launch of the new Discovery Sport, with the latter s import volume carefully managed to ensure a smooth transition to it being produced in China toward the end of Run out of XF and the XJ in advance of the all new XF and 16MY XJ coming soon, while XE sales only start in September Response JLR has been discussing these issues with our dealer and JV partners and the following actions are being taken: Production and sales targets have been re-aligned to reflect the slowing market and JLR model transition issues to ensure supply and demand are kept in balance 5-6% average price re-alignment on JV Evoque and realigned pricing for the launch of the new Jaguar XE Changes in the Integrated Marketing, Sales and Service organisation, including new experienced senior management Shorter payment terms for marketing payments to dealers Outlook JLR Believes China will continue to be a growing market for premium vehicles and JLR it is the largest car market in the world with a growing GDP and increasingly affluent consumers who will aspire to own premium vehicles JLR expects to increase it s share in the market with new JLR model launches including the XE, all new XF, 16MY XJ, the New F- PACE and more products to come. 10
11 Other Market focus Strong performance over the quarter JLR sales excluding China were up 12.5% compared to Q1 FY15, with strong growth in Europe, UK and North America, reflecting strong Range Rover and Range Rover Sport sales and ramp up of the Discovery Sport and Jaguar XE. Europe JLR sales were up 27.7%, outperforming industry growth of 7.5%. Notably the key markets of France, Germany, Italy and Spain all reported strong growth, up 46.8%, 25.7%, 29.2% and 45.7% respectively. As well as strong performance of the Range Rover (+17.2%) and Range Rover Sport (+7.4%) this quarter saw the introduction of the Discovery Sport and Jaguar XE, contributing 5,078 and 1,405 units respectively. UK JLR delivered 20.5% growth, beating market growth of 12.9%, with Range Rover up 35.9% the Range Rover Sport up 27.3%, and the Discovery Sport and Jaguar XE posting 4,381 and 1,415 retail sales respectively. North America For North America, JLR sales were up 12.9% with US up 12.7% against the market (+3.4%). As well as strong sales of the Range Rover (+39.9%) the quarter also saw very strong sales of the Discovery (+143.4%). The Discovery Sport sold 996 units in the quarter. The Jaguar XE is expected to do well when it is introduced in the market with petrol engines in Other Markets All Other Markets were down 9.8%, primarily reflecting weaker Russia sales (down 50.8%) given well documented issues but, on a positive note MENA sales picked up 17% and South Korea posted strong performance in a challenging environment (up 45.2%). 11
12 Income Statement Consolidated income statement - IFRS Quarter ended 30 June ( millions, unless stated) Change Revenues 5,002 5,353 (351) Material and other cost of sales (2,906) (3,299) 393 Employee costs (552) (429) (123) Other (expense) /Income (1) (1,038) (811) (227) Product development costs capitalised EBITDA 821 1,087 (266) Depreciation and amortisation (318) (234) (84) Debt/unrealised hedges MTM (2) Net finance (expense) / income and other (3) (14) 1 (15) Profit before tax (286) Income tax expense (146) (231) 85 Profit after tax (201) 1) Includes mark to market of current assets and liabilities and realised gains/losses on matured FX and commodity hedges 2) Includes mark to market of unrealised FX options (time value) and commodity hedges and revaluation of foreign currency debt 3) Includes start-up costs for the China JV 12
13 Cash flow Higher inventories for XE and XF launch and slower sales in China Consolidated cash flow - IFRS Quarter ended 30 June ( millions, unless stated) Change EBITDA 821 1,087 (266) Working capital changes (886) (377) (509) Tax paid (57) (101) 44 Other 1 11 (10) Cash flow from operations (121) 620 (741) Investment in fixed and intangible assets (712) (629) (83) Other (including finance income) Free cash flow (before financing) (818) 5 (823) Changes in debt Finance expenses and fees (25) (26) 1 Dividends paid (150) (150) - Net change in cash & financial deposits (988) (167) (821) 13
14 Solid financing structure Key financial indicators - IFRS ( millions, unless stated) June 2015 June 2014 Change On 29 th July 2015, JLR completed a refinancing of 1.5bn committed unsecured lines increased to 1.8bn all for 5 years maturing in 2020 with new documentation reflecting recent bond issues 1 EBITDA stated on a rolling 12 month basis Cash and cash equivalents 2,021 1, Financial deposits 1,237 1,433 (196) Cash and financial deposits 3,258 3,301 (43) Long term undrawn credit facilities 1,485 1, Total liquidity 4,743 4, Total equity 7,231 6, Total debt (2,458) (2,006) (452) Net cash 800 1,295 (495) Total debt/ebitda 1 0.6x 0.5x (0.1)x Total debt/equity 0.3x 0.3x 0.0x 14
15 Agenda Key topics Page Financial performance 5 New products and other developments 15 Closing Q&A 19 15


16 Exciting upcoming products Evoque 2016MY goes on sale Q XJ 2016MY goes on sale Autumn 2015 Range Rover SVAutobiography debuted April 2015 at the New York Auto Show Jaguar XF goes on sale Q

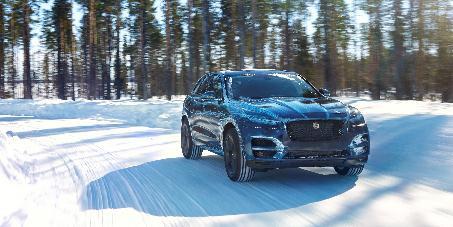
17 The new Jaguar F-PACE Performance crossover on sale in
18 Looking Ahead Solid profitability in Q1 FY16, despite weaker China market Jaguar Land Rover remains focused on: Building on the successful launches of the new Discovery Sport and the new Jaguar XE Launching the all new Jaguar XF and Range Rover Evoque in Q2 FY16, the 16 Model Year Jaguar XJ in Autumn this year and the Jaguar F-PACE and Evoque Convertible in Q4 FY16 These new products are expected to drive significant volume growth in 2015/16 although, as previously indicated, EBITDA margins are expected to be lower than the high levels in 2014/15 reflecting model mix and launch costs associated with the new products, launch and reporting effects of the China JV and more mixed economic conditions particularly in China JLR plans to continue to execute its successful growth strategy, investing in more new products, powertrains, technologies and manufacturing capacity in the UK and overseas which is expected to continue to deliver profitable growth. 6,000,000 Generating th Land Rover strong - production operating cash Land flow Rover to support rolled off our production continuing line investment One-Of-A-Kind the Business Defender estimated created 3.5bn to mark at Solihull or more in FY16 2,000,000th Defender production milestone 18
19 Agenda Key topics Page Financial performance 5 New products and other developments 15 Closing Q&A 19 19

20 Q&A Kenneth Gregor CFO, Jaguar Land Rover 20
21 Thank You Kenneth Gregor CFO, Jaguar Land Rover C. Ramakrishnan Group CFO, Tata Motors Jaguar Land Rover W/1/26 Abbey Road, Whitley Abbey Coventry Road, CV3 Whitley, 4LF, UK Coventry CV3 jaguarlandrover.com 4LF Jaguarlandrover.com Bennett Birgbauer Treasurer, Jaguar Land Rover Jaguar Land Rover Investor Relations Tata Motors Investor Relations 21

22 Additional slides 22
23 Quarterly wholesale volumes by carline Wholesales of 110.6k down (3.9)% overall Jaguar - Q1FY15 vs Q1FY16 Land Rover - Q1FY15 vs Q1FY16 Up 8.3% Down (6.4)% Range Rover F-TYPE XK XJ XF XE * Range Rover Sport Range Rover Evoque Discovery Discovery Sport Freelander Defender Units in 000 s. 23
24 Quarterly wholesale volumes by geography Wholesales of 110.6k down (3.9)% overall UK North America China Jun FY16 Up 15% Up 22% Down (53)% Overseas, 17% UK, 19% Q1FY15 * Q1FY16 Europe (ex. Russia), 29% China Region, 14% 110,648 Units North America, 20% Europe All other markets Jun FY15 Up 54% Down (19)% Overseas, 21% UK, 16% Land Rover Jaguar Units in 000 s Europe (ex. Russia), 18% China Region, 30% 115,156 Units North America, 16% 24
25 Product and other investments Key financial indicators - IFRS Quarter ended 30 June ( millions, unless stated) Change R&D expense Capitalised Expensed Total R&D expense Investment in tangible and other intangible assets Total product and other investment Of which capitalised
JAGUAR LAND ROVER RESULTS FOR THE THREE MONTHS ENDED 31 DECEMBER th FEBRUARY 2017
 JAGUAR LAND ROVER RESULTS FOR THE THREE MONTHS ENDED 31 DECEMBER 2016 14 th FEBRUARY 2017 DISCLAIMER Statements in this presentation describing the objectives, projections, estimates and expectations of
JAGUAR LAND ROVER INVESTOR CALL
 JAGUAR LAND ROVER INVESTOR CALL RESULTS FOR THE THREE AND SIX MONTHS ENDED 30 SEPTEMBER 2017 Kenneth Gregor, CFO 9 th NOVEMBER 2017 DISCLAIMER Statements in this presentation describing the objectives,
FY16 - Investor Presentation. May 30 th 2016
 FY16 - Investor Presentation May 30 th 2016 Tata Motors Statements in this presentation describing the objectives, projections, estimates and expectations of the Company i.e. Tata Motors Ltd and its direct
Investor Presentation. 9 th August 2017
 Investor Presentation 9 th August 2017 Tata Motors Statements in this presentation describing the objectives, projections, estimates and expectations of the Company i.e. Tata Motors Ltd and its direct
FISCAL YEAR MARCH 2015 FIRST HALF FINANCIAL RESULTS. New Mazda Demio
 FISCAL YEAR MARCH 2015 FIRST HALF FINANCIAL RESULTS New Mazda Demio Mazda Motor Corporation October 31, 2014 1 PRESENTATION OUTLINE Highlights Fiscal Year March 2015 First Half Results Fiscal Year March
1 st Half 2018 Results. August 1 st, 2018
 1 st Half 2018 Results August 1 st, 2018 H1 HIGHLIGHTS & CATEGORY SPOTLIGHTS Gonzalve BICH 2 First Half 2018 Key Messages Challenging market and business environment Continued investment in targeted Brand
Kongsberg Automotive ASA. Third quarter November 7, 2018
 Kongsberg Automotive ASA Third quarter - November 7, Q3 Highlights Continued improvements in turbulent times Revenues increased YoY by MEUR 18.3 (~8%) to MEUR 259 including negative FX effects of MEUR
Record CY 2016 EPS-diluted-adjusted of $6.12, an increase of $1.10 Y-O-Y. Q EPS-diluted-adjusted of $1.28, a decrease of $0.11 Y-O-Y.
 1 2 3 Q4 2016 global deliveries up 0.1 million units year-over-year (Y-O-Y), a 3.3% increase. Volume gains primarily in North America and China, offset by reductions in International Operations (excluding
TOFAŞ Q ANALYST PRESENTATION
 TOFAŞ Q1 2016 ANALYST PRESENTATION 03.05.2016 1 2016 Q1 AGENDA Highlights Turkish Automotive Industry Production & Capacity Utilization Domestic Market Developments Tofaş Domestic Market Performance Export
Kongsberg Automotive ASA. Fourth quarter February 28, 2019
 Kongsberg Automotive ASA Fourth quarter - February 28, 2019 Highlights Q4 Sales Revenues grew by 21 (7.3%) YoY to 288 including negative FX effects of 1. We booked new business with 77 in expected annual
Q3 & 9M 2018 Results Presentation. October 24 th, 2018
 Q3 & 9M 2018 Results Presentation October 24 th, 2018 Q3 & 9M HIGHLIGHTS & CATEGORY SPOTLIGHTS Gonzalve BICH 3Q and 9M 2018 Results Presentation 2 9 Months 2018 Key Messages Continued challenging trading
FISCAL YEAR MARCH 2015 FIRST QUARTER FINANCIAL RESULTS. Mazda Roadster 25 th Anniversary Model
 FISCAL YEAR MARCH 2015 FIRST QUARTER FINANCIAL RESULTS Mazda Roadster 25 th Anniversary Model Mazda Motor Corporation July 31, 2014 1 PRESENTATION OUTLINE Highlights Fiscal Year March 2015 First Quarter
FISCAL YEAR ENDING MARCH 2012 FIRST HALF FINANCIAL RESULTS
 FISCAL YEAR ENDING MARCH 2012 FIRST HALF FINANCIAL RESULTS Mazda Motor Corporation November 2, 2011 New Mazda CX-5 (European specifications) 1 PRESENTATION OUTLINE Highlights Fiscal Year Ending March 2012
Strong performance by the Bolloré Group s operating activities in 2018 Mr Cyrille Bolloré unanimously appointed Chairman and Chief Executive Officer
 PRESS RELEASE 2018 results (1) March 14, 2019 Strong performance by the Bolloré Group s operating activities in 2018 Mr Cyrille Bolloré unanimously appointed Chairman and Chief Executive Officer Revenue:
BMW GROUP QUARTERLY REPORT. TO 30 SEPTEMBER 2014
 . BMW GROUP QUARTERLY REPORT. TO 30 SEPTEMBER 2014 THE BMW GROUP IS WELL ON TRACK AND PERFORMS IN LINE WITH THE GUIDANCE. The BMW Group is well on track to reach its targets for 2014. Full year guidance
Presentation to Investors Q results ROYAL DSM HEALTH NUTRITION MATERIALS
 Presentation to Investors Q3 2016 results ROYAL DSM HEALTH NUTRITION MATERIALS Safe harbor statement This presentation may contain forward-looking statements with respect to DSM s future (financial) performance
FISCAL YEAR END MARCH 2013 FIRST HALF FINANCIAL RESULTS. New Mazda6 (Atenza)
") FISCAL YEAR END MARCH 2013 FIRST HALF FINANCIAL RESULTS New Mazda6 (Atenza) Mazda Motor Corporation October 31, 2012 1 PRESENTATION OUTLINE Highlights Fiscal Year March 2013 First Half Results Fiscal Year
FISCAL YEAR END MARCH 2013 FIRST HALF FINANCIAL RESULTS New Mazda6 (Atenza) Mazda Motor Corporation October 31, 2012 1 PRESENTATION OUTLINE Highlights Fiscal Year March 2013 First Half Results Fiscal Year
FISCAL YEAR MARCH 2014 FINANCIAL RESULTS
 FISCAL YEAR MARCH 214 FINANCIAL RESULTS Mazda CX-5 Mazda Atenza Mazda Motor Corporation April 25, 214 New Mazda Axela 1 PRESENTATION OUTLINE Highlights Fiscal Year March 214 Results Fiscal Year March 215
3 rd Quarter 2017 Results
 Inside your life! 3 rd Quarter 2017 Results October 25, 2017 Mobile Automotive Display Semiconductor IoT LED Contents Ⅰ. Q3 2017 Earnings Summary Ⅱ. Earnings Highlight & Outlook Ⅲ. Results & Outlook by
Earnings conference call. Q4 and Full year 2015
 Earnings conference call Q4 and Full year 2015 Bo Annvik, CEO / Åke Bengtsson, CFO 11 February 2016 1 Agenda Business Highlights Market Update Sales Financials Outlook 2 2015 in numbers Operating margin
Q Financial Results
 Q3 2018 Financial Results 1 Forward-looking statement The statements on the future in this presentation, including expected sales and earnings, are associated with risks and uncertainties and may be affected
Earnings conference call Q3 2016
 Earnings conference call Q3 2016 Bo Annvik, CEO / Åke Bengtsson, CFO October 25, 2016 1 Agenda Business Highlights Market Update Sales Financials Outlook Public offer 2 Business Highlights Q3 2016 Solid
Conference Call H Düsseldorf August 4, 2016
 R H E I N M E TA L L A G T H E T EC H N O LO GY G RO U P FO R S EC U R I T Y A N D M O B I L I T Y Conference Call Düsseldorf August 4, 2016 RHEINMETALL AG 2016 Rheinmetall Group Highlights Increased sales,
SOLLERS IFRS RESULTS
 SOLLERS IFRS RESULTS 2017 03.05.2018 2 1. 2017 SOLLERS STRATEGIC DEVELOPMENTS 2. RUSSIAN AUTOMOTIVE MARKET OVERVIEW 3. SOLLERS OPERATING AND FINANCIAL PERFORMANCE IN 2017 4. SOLLERS JOINT VENTURES RESULTS
TOFAŞ RESULTS WEBCAST PRESENTATION
 TOFAŞ 31.12.2016 RESULTS WEBCAST PRESENTATION 02.02.2017 1 WEBCAST AGENDA Highlights Turkish Automotive Industry Production Domestic Market Developments Tofaş Domestic Market Performance Export Markets
FISCAL YEAR MARCH 2018 FIRST QUARTER FINANCIAL RESULTS
 FISCAL YEAR MARCH 2018 FIRST QUARTER FINANCIAL RESULTS PRESENTATION OUTLINE Highlights Fiscal Year March 2018 First Quarter Results Fiscal Year March 2018 Full Year Forecast Structural Reform Stage 2 Progress
Respect for customers, partners and staff. Service: another name for the respect that a company owes its customers, partners and staff.
 Respect for customers, partners and staff Service: another name for the respect that a company owes its customers, partners and staff. Vehicle glass KEY FIGURES (in EUR million) 2004 2003 % change Total
Conférence d Automne - Cheuvreux. Paris, September 26 th, 2011
 Conférence d Automne - Cheuvreux Paris, September 26 th, 2011 This presentation may contain forward-looking statements. Such forward-looking statements do not constitute forecasts regarding the Company
I remind you that our presentation is available on our website. We can start from the first 2 slides that show Piaggio Group First
 CONFERENCE CALL 2009 1 st HALF RESULTS Good afternoon and welcome to everybody. I remind you that our presentation is available on our website. We can start from the first 2 slides that show Piaggio Group
SOLLERS IFRS RESULTS 1H2017
 SOLLERS IFRS RESULTS 1H2017 28.08.2017 2 1. 1H2017 SOLLERS STRATEGIC DEVELOPMENTS 2. RUSSIAN AUTOMOTIVE MARKET OVERVIEW 3. SOLLERS OPERATING AND FINANCIAL PERFORMANCE IN 1H2017 4. SOLLERS JOINT VENTURES
Q SALES Strong outperformance in all regions. April 20, 2018
 Q1 2018 SALES Strong outperformance in all regions April 20, 2018 Q1 2018 Sales - Key Facts Impact from IFRS15 implementation In 2017, Faurecia had already partly anticipated IFRS15 through the presentation
FISCAL YEAR MARCH 2015 THIRD QUARTER FINANCIAL RESULTS. Updated Mazda CX-5 (Japanese specification model)
") FISCAL YEAR MARCH 2015 THIRD QUARTER FINANCIAL RESULTS Updated Mazda CX-5 (Japanese specification model) Mazda Motor Corporation February 4, 2015 1 PRESENTATION OUTLINE Highlights Fiscal Year March 2015
FISCAL YEAR MARCH 2015 THIRD QUARTER FINANCIAL RESULTS Updated Mazda CX-5 (Japanese specification model) Mazda Motor Corporation February 4, 2015 1 PRESENTATION OUTLINE Highlights Fiscal Year March 2015
FISCAL YEAR END MARCH 2013 FIRST QUARTER FINANCIAL RESULTS
 FISCAL YEAR END MARCH 213 FIRST QUARTER FINANCIAL RESULTS New MAZDA CX-5 Mazda Motor Corporation July 31, 212 1 PRESENTATION OUTLINE Highlights Fiscal Year End March 213 Results Update of Structural Reform
FISCAL YEAR MARCH 2018 FIRST HALF FINANCIAL RESULTS
 FISCAL YEAR MARCH 2018 FIRST HALF FINANCIAL RESULTS PRESENTATION OUTLINE Highlights Fiscal Year March 2018 First Half Results Fiscal Year March 2018 Full Year Forecast Progress of Key Initiatives/ Business
BMW Group Corporate Communications
 14 March 2007 BMW Group to continue its successful course in 2007 Best year in company s history expected in operating terms Sales volume expected to rise to new record level Munich. The BMW Group plans
INVESTING IN GLOBAL GROWTH OPPORTUNITIES AND CHALLENGES FOR UK SUPPLY BASE.
 INVESTING IN GLOBAL GROWTH OPPORTUNITIES AND CHALLENGES FOR UK SUPPLY BASE. Rob Johnson Purchasing Director Jaguar Land Rover June 2013 Topics. Update and overview on Jaguar Land Rover New JLR UK Engine
Continued strong performance in key businesses
 Continued strong performance in key businesses SECOND QUARTER PRELIMINARY RESULTS August 9, Disclaimer "This presentation and the associated slides and discussion contain forward-looking statements. These
Q3 FY14 Performance and Financial Review February 13, 2014
 INVESTOR PRESENTATION Q3 FY14 Performance and Financial Review February 13, 2014 Contents Highlights and Financial Performance Aluminium Business Copper Business Projects 2 HIGHLIGHTS AND FINANCIAL PERFORMANCE
FISCAL YEAR MARCH 2014 FIRST HALF FINANCIAL RESULTS. New Mazda Axela (Overseas name: New Mazda3)
") FISCAL YEAR MARCH 2014 FIRST HALF FINANCIAL RESULTS New Mazda Axela (Overseas name: New Mazda3) Mazda Motor Corporation October 31, 2013 1 PRESENTATION OUTLINE Highlights Fiscal Year March 2014 First Half
FISCAL YEAR MARCH 2014 FIRST HALF FINANCIAL RESULTS New Mazda Axela (Overseas name: New Mazda3) Mazda Motor Corporation October 31, 2013 1 PRESENTATION OUTLINE Highlights Fiscal Year March 2014 First Half
CONFERENCE CALL RESULTS Q1 2017
 CONFERENCE CALL RESULTS Q1 2017 May 5, 2017 Marc Bunz (CFO) Nicolas-Fabian Schweizer (CTO) AGENDA Market & Strategy Update Financials 2016 Financials Q1 2017 Outlook SCHWEIZER Share Schweizer Electronic
Months Investor Presentation
 2018 9 Months Investor Presentation 25.10.2018 Disclaimer Ereğli Demir Çelik Fabrikaları T.A.Ş. (Erdemir) may, when necessary, make written or verbal announcements about forward-looking information, expectations,
Volvo Car GROUP interim report third Quarter 2016
 INTERIM REPORT THIRD QUARTER Volvo Car GROUP interim report third Quarter 1 OF 18 VOLVO CAR AB (PUBL.) (556810 8988) VOLVO CAR GROUP INTERIM REPORT THIRD QUARTER, GOTHENBURG INTERIM REPORT OCTOBER THIRD
TOFAŞ RESULTS WEBCAST PRESENTATION
 TOFAŞ 31.12.2017 RESULTS WEBCAST PRESENTATION 02.02.2018 AGENDA Highlights Turkish Automotive Industry Production Domestic Market Developments Tofaş Domestic Market Performance Export Markets & Tofaş Performance
Earnings conference call Q4 & FY 2016
 Earnings conference call Q4 & FY 2016 Bo Annvik, CEO / Åke Bengtsson, CFO February 10, 2016 1 Agenda Business Highlights Market Update Sales Financials Way forward 2 Business Summary FY 2016 A year with
FISCAL YEAR MARCH 2018 THIRD QUARTER FINANCIAL RESULTS
 FISCAL YEAR MARCH 2018 THIRD QUARTER FINANCIAL RESULTS PRESENTATION OUTLINE Highlights Fiscal Year March 2018 Nine Month Results Fiscal Year March 2018 Full Year Forecast Progress of Key Initiatives 1
THREE MONTHS REPORT, JAN MARCH 2016
 THREE MONTHS REPORT, JAN MARCH 2016 TELEPHONE CONFERENCE 26 APRIL, 2016, AT 14:30 CET TOMMY ANDERSSON, PRESIDENT AND CEO HELENA WENNERSTRÖM, EVP AND CFO TO PARTICIPATE, PLEASE CALL 5 MINUTES BEFORE THE
Q SALES Strong organic growth, confirmed momentum. October 12, 2017
 Q3 2017 SALES Strong organic growth, confirmed momentum October 12, 2017 Q3 2017 Sales Key facts Sales Since January 1, 2017, Faurecia reports on value-added sales, which are total sales less monolith
2015 Interim Results Announcement
 China Petroleum & Chemical Corporation 2015 Interim Results Announcement August 27, 2015 Hong Kong Cautionary Statement This presentation and the presentation materials distributed herein include forward-looking
Q SALES Strong sales growth and robust outperformance Confirmed FY 2018 guidance. October 11, 2018
 Q3 2018 SALES Strong sales growth and robust outperformance Confirmed FY 2018 guidance October 11, 2018 Agenda 1 Q3 2018 Sales p. 3 2 Update on IFRS 15 - Clarification about R&D capitalization p. 13 3
Financial Statements Matti Lievonen, President & CEO 7 February 2017
 Financial Statements 2016 Matti Lievonen, President & CEO Agenda 1 2 3 4 Year 2016 Financials 2016 Segment reviews Current topics 5 Appendix 2 Disclaimer The following information contains, or may be deemed
Lazydays Holdings, Inc. Reports Second Quarter 2018 Financial Results
 News Contact: +1 (813) 204-4099 investors@lazydays.com Lazydays Holdings, Inc. Reports Second Quarter 2018 Financial Results Tampa, FL (August 9, 2018) Lazydays Holdings, Inc. ( Lazydays )(NasdaqCM: LAZY)
INCREASING SALES FOR MINING RELATED BUSINESS
 Investor Relations of PT UNITED TRACTORS Tbk INCREASING SALES FOR MINING RELATED BUSINESS In the first half 2001, the Company managed to record increase in net revenue from IDR 2.32 trillion to IDR 3.54
Interim report Q3 2014
 Interim report Q3 2014 CEO Daniel Skjeldam CFO Erik Hansen 6 November 2014 Agenda Highlights and Key Figures Operational & Financial review Outlook Q&A 2 Highlights and key figures NOK 77 million pre tax
DARING TO ADAPT 2015 Half-Year Results 31 August 2015
 DARING TO ADAPT 2015 Half-Year Results 31 August 2015 SUMMARY Very good H1 2015 results: Sales: EUR 3.2 billion, +8.6% Current consolidated result before tax, group s share: EUR 140.0 million, +61.5% D
On track. Investor and Analyst Presentation On the Occasion of the Release of the Preliminary Figures for FY 2011 Hanover, 19 January 2012
 On track. Investor and Analyst Presentation On the Occasion of the Release of the Preliminary Figures for FY 2011 Agenda Delticom at a Glance Business Model Profit & Loss Balance Sheet Outlook 2 Agenda
Earnings conference call
 Earnings conference call Full year 2017 Åke Bengtsson, President & CEO Andreas Ekberg, Acting CFO February 14, 2018 1 Agenda Business Summary Market Update Sales Financials Way forward 2 Business Summary
2018 Q3 results. Millicom International Cellular S.A. Cable expansion accelerating. Mauricio Ramos, CEO Tim Pennington, CFO October 24 th, 2018
 2018 Q3 results Cable expansion accelerating Mauricio Ramos, CEO Tim Pennington, CFO October 24 th, 2018 Millicom International Cellular S.A. Disclaimer This presentation may contain certain forward-looking
Money and banking. Flow of funds for the third quarter
 Statistical tables Money and banking Page S South African Reserve Bank: Liabilities... 2 South African Reserve Bank: Assets... 3 Corporation for Public Deposits: Liabilities... 4 Corporation for Public
DEUTZ Investor Presentation August 2016
 DEUTZ Investor Presentation August 2016 Agenda DEUTZ strategy & positioning Financials Outlook 2 DEUTZ at a glance World s first engine factory founded in 1864 by N.A. Otto, the developer of the four the
February Annual Results February 13, 2008
 February 2008 1 Annual Results February 13, 2008 AGENDA AGENDA 2007 Highlights 2007 Financial Results x Competitiveness Sales and products dynamic International 2008 Outlook February 2008 2 2007: performance
Investor presentation May The Origin of HighTech.
 Investor presentation May 2014 The Origin of HighTech. Agenda DEUTZ strategy & positioning Financials Outlook 2 DEUTZ at a glance 150 years DEUTZ a tradition of achievement Independent manufacturer of
Consolidated Financial Results for 1Q FY2016 July 29, 2016 Fuji Electric Co., Ltd.
 Consolidated Financial Results for 1Q FY2016 July 29, 2016 Fuji Electric Co., Ltd. 2016Fuji Electric Co., Ltd. All rights reserved. 1 Summary of Consolidated Financial Results for 1Q FY2016 (YoY Comparison)
EXANE BNP PARIBAS 13th European Seminar June 8, 2011
 EXANE BNP PARIBAS 13th European Seminar June 8, 2011 This presentation may contain forward-looking statements. Such forward-looking statements do not constitute forecasts regarding the Company s results
BlueScope Steel Limited Consolidated Financial Headlines
 BlueScope Steel Limited Consolidated Financial Headlines 2003 2004 2005 2006 2007 2008 2009 2010 2011 2012 2013 2013 2013 2014 2014 2014 2015 2015 2015 2016 2016 2016 2017 2017 2017 2018 2018 2018 Total
On track. Investor and Analyst Presentation On the Occasion of the Release of the Preliminary Figures for 9M 2011 Hanover, 18 October 2011
 On track. Investor and Analyst Presentation On the Occasion of the Release of the Preliminary Figures for 9M 2011 Agenda Delticom at a Glance Business Model Profit & Loss Balance Sheet Outlook 2 Agenda
Financial Summary for 2Q-FY2017 And Projections for FY2017
 Financial Summary for 2Q-FY2017 And Projections for FY2017 1 INDEX 01 Financial Summary for 2Q-FY2017 02 Performance Forecast for FY2017 03 Topics 2 01 Financial Summary for 2Q-FY2017 3 01 Financial Summary
FISCAL YEAR ENDED MARCH 2011 FINANCIAL RESULTS
 FISCAL YEAR ENDED MARCH 211 FINANCIAL RESULTS Mazda Motor Corporation April 28, 211 Mazda MINAGI 1 PRESENTATION OUTLINE Highlights Fiscal Year Ended March 211 Results In Summary Question & Answer Session
Full-year Report 2009
 Full-year Report 2009 Joakim Olsson CEO and President February 12, 2009 Innovative Vehicle Technology 2010-02-12 Summary 2009 Sales of SEK 5,622m (8,403) Adjusted for currency effects sales decreased by
Third quarter AB Volvo
 Third quarter 2013 Third quarter 2013 TRUCKS EUROPE Excellent reception of the new products decision to optimize manufacturing Highlights in Commercial launch of the new product ranges Strong order situation
282m 75% +575m. Net sales Operating income before non-recurring items. Operating margin before non-recurring items. Net Loss.
 First-Half 2009 Financial Highlights Net sales Operating income before non-recurring items Operating margin before non-recurring items Net Loss Net debt-to-equity ratio Free cash flow** 7,134m 282m 4.0%
Saft Groupe SA reports Quarterly Financial Information for the third quarter of 2007
 N 61-07 Saft Groupe SA reports Quarterly Financial Information for the third quarter of 2007 Paris, 9 th November 2007 - Saft, leader in the design, development and manufacture of high-end batteries for
Q Analyst Teleconference. 9 August 2018
 9 August 218 Disclaimer This presentation contains forward-looking statements that reflect the Company management s current views with respect to certain future events. Although it is believed that the
ECONOMIC BULLETIN - No. 42, MARCH Statistical tables
 ECONOMIC BULLETIN - No. 42, MARCH 2006 APPENDIX Appendix Statistical tables The world economy Table a1 Gross domestic product a2 Industrial production a3 Consumer prices a4 External current account a5
2017 Q3 results. Millicom International Cellular S.A. Mauricio Ramos, CEO Tim Pennington, CFO October 25, 2017
 2017 Q3 results Millicom International Cellular S.A. Mauricio Ramos, CEO Tim Pennington, CFO October 25, 2017 Disclaimer This presentation may contain certain forward-looking statements with respect to
Table 1 ANTIGUA AND BARBUDA: MAIN ECONOMIC INDICATORS
 Antigua Tables 2006 1 Main Indicators 03/11/2006 08:05 AM Table 1 ANTIGUA AND BARBUDA: MAIN ECONOMIC INDICATORS 1996 1997 1998 1999 2000 2001 2002 2003 2004 2005 a/ Annual growth rates b/ Gross domestic
IHS AUTOMOTIVE Supplying Jaguar Land Rover. SupplierBusiness edition supplierbusiness.com SAMPLE SUPPLYING THE OEMS.
 IHS AUTOMOTIVE Supplying Jaguar Land Rover SupplierBusiness 2015 edition supplierbusiness.com SUPPLYING THE OEMS Jaguar Land Rover IHS Automotive Supplying the Volkswagen Group Contents Executive Summary
2015 Interim Results. Levallois, July 23 th, 2015
 2015 Interim Results Levallois, July 23 th, 2015 CONTENTS H1 2015 Highlights 2015 Interim Results Outlook H1 2015 Highlights DATE Improvement in all metrics 4 H1 2015 Key metrics Economic Sales * : 2,945
UPM HALF YEAR FINANCIAL REPORT Jussi Pesonen President and CEO 25 July 2017
 UPM HALF YEAR FINANCIAL REPORT 217 Jussi Pesonen President and CEO 25 July 217 Q2 217 Good performance and favourable market demand continued Comparable EBIT increased by 2% to EUR 27m (264m) Temporarily
AUTUMN CONFERENCE CHEUVREUX Paris. Cheuvreux Conference - Paris
 AUTUMN CONFERENCE CHEUVREUX Paris September 25 juillet 20 th, 2012 1 This presentation does not constitute an offer to sell, or a solicitation of an offer to buy, PEUGEOT SA ( Company ) shares. This presentation
Interim results June 30, 2003
 1 Interim results June 30, 2003 2 In units W orldwide sales at June 30 (cars and light commercial vehicles) > Worldwide sales at June 30, 2003: 1,689,200 cars and light commercial vehicles, versus 1,656,900
Statistical tables S 0. Money and banking. Capital market. National financial account. Public finance
 Statistical tables Money and banking Page S South African Reserve Bank: Liabilities... 2 South African Reserve Bank: Assets... 3 Corporation for Public Deposits: Liabilities... 4 Corporation for Public
RENAULT GROUP SOCIETE GENERALE CONFERENCE
 RENAULT GROUP SOCIETE GENERALE CONFERENCE DOMINIQUE THORMANN, EVP, CFO & RCI Banque CEO NOVEMBER 30th, 2011 DISCLAIMER Information contained within this document may contain forward looking statements.
Bernstein Strategic Decisions Conference 2018
 Bernstein Strategic Decisions Conference 2018 Forward-Looking Statements Certain statements in this presentation, other than statements of historical fact, including estimates, projections, statements
FY17 RESULTS BUSINESS UPDATES FY18 OUTLOOK. Nissan Motor Co., Ltd. May 14 th, 2018
 Nissan Motor Co., Ltd. May 14 th, 2018 RESULTS BUSINESS UPDATES FY18 OUTLOOK www.nissan-global.com Copyright NISSAN MOTOR CO., LTD. All rights reserved. 2 GLOBAL 91.81 5.08 TIV * 1 vs. 93.52 GLOBAL +1.9%
MONRO MUFFLER BRAKE, INC. PROVIDES FOURTH QUARTER AND FISCAL 2017 FINANCIAL RESULTS
 CONTACT: John Van Heel Chief Executive Officer (585) 647-6400 Robert Gross Executive Chairman (585) 647-6400 FOR IMMEDIATE RELEASE Brian D Ambrosia Senior Vice President Finance Chief Financial Officer
Performance Indicators - Q3 2005/6 - Restatements in red
 Performance Indicators - Q3 2005/6 - Restatements in red Description Page Profit & Loss 1 External Revenue by Segment 2 External Revenue Analysis / Sales Order Value 3 External Revenue Analysis - BT Retail
Q3 Interim Report 2016
 Q3 Interim Report 216 Lennart Evrell President & CEO Håkan Gabrielsson CFO Strong earnings and high mine production Revenues 9,733 (9,764) MSEK EBIT ex PIR* 1,318 (1,55) MSEK EBIT 1,529 (88) MSEK Free
RHEINMETALL AG THE TECHNOLOGY GROUP FOR SECURITY AND MOBILITY. Conference Call Q Düsseldorf November 5, 2015
 RHEINMETALL AG THE TECHNOLOGY GROUP FOR SECURITY AND MOBILITY Conference Call Q3 2015 Düsseldorf November 5, 2015 RHEINMETALL AG 2015 Rheinmetall Group Highlights 9M 2015 Strong top line growth, earnings
RHEINMETALL AG THE TECHNOLOGY GROUP FOR SECURITY AND MOBILITY. Conference Call Q Düsseldorf August 7, 2014
 RHEINMETALL AG THE TECHNOLOGY GROUP FOR SECURITY AND MOBILITY Conference Call Q2 2014 Düsseldorf August 7, 2014 RHEINMETALL AG 2014 Rheinmetall Group at a glance Introductory remark: Accounting adjustments
Performance Indicators - Q4 2005/6
 Performance Indicators - Q4 2005/6 Description Page Profit & Loss 1 External Revenue by Segment 2 External Revenue Analysis / Sales Order Value 3 External Revenue Analysis - BT Retail External Revenue
#Q3_2018. Orange financial results. Ramon Fernandez Deputy CEO, Finance, Performance and Europe. 25 October 2018
 #Q3_20 Orange financial results Ramon Fernandez Deputy CEO, Finance, Performance and Europe 25 October 20 Disclaimer This presentation may contain forward-looking statements about Orange, particularly
Corporate Communications. Media Information 2 August Check against delivery - Ladies and Gentlemen,
 Media Information - Check against delivery - Statement Dr. Nicolas Peter Member of the Board of Management of BMW AG, Finance Conference Call Interim Report to 30 June 2018, 10:00 a.m. CEDT Ladies and
H1 Financial Figures. 14 June 2016
 H1 Financial Figures 14 June 2016 H1 2015/16: Summary H1 2015/16 H1 2015/16 GERRY WEBER Core (GERRY WEBER, TAIFUN, SAMOON) Decrease in sales revenues to EUR 352.0 million (-11.8%) HALLHUBER Sales increase
PRESS RELEASE PIAGGIO GROUP: FIRST NINE MONTHS Consolidated net sales million ( 1,112.3 mln in first nine months 2012)
") PRESS RELEASE PIAGGIO GROUP: FIRST NINE MONTHS 2013 Consolidated net sales 955.0 million ( 1,112.3 mln in first nine months 2012) Ebitda 133.7 million ( 156.0 mln in first nine months 2012) Ebitda margin
PRESS RELEASE PIAGGIO GROUP: FIRST NINE MONTHS 2013 Consolidated net sales 955.0 million ( 1,112.3 mln in first nine months 2012) Ebitda 133.7 million ( 156.0 mln in first nine months 2012) Ebitda margin
Third quarter AB Volvo
 1 VOLVO GROUP Slowing demand and lower earnings driven by one-offs and under-absorption SALES TREND SEK bn 12 months 318 bn OPERATING INCOME SEK bn 12 months* 25 bn 64 73 69 4.9 5.8 4.0* Q3 Q4 Q1 Q2 Q3
Valvoline Fourth-Quarter Fiscal 2016 Earnings Conference Call. November 9, 2016
 Valvoline Fourth-Quarter Fiscal 2016 Earnings Conference Call November 9, 2016 Forward-Looking Statements This presentation contains forward-looking statements within the meaning of Section 27A of the
2013 half year results
 213 half year results Highlights Revenue evolution pointing to a stabilisation in many end-markets Revenues stable versus H1 212 Revenues up 4% versus H2 212 Profitability affected by product and regional
Results Briefing FY2016 1H
 Securities Code: 6770 Results Briefing FY2016 1H Friday, October 28, 2016 Contents FY2016 1H Consolidated Financial Results P. 3-9 FY2016 Consolidated Financial Results Forecast P. 10-13 Dividend Forecast
AMAG posts record shipments in 2013; dividend recommendation of 0.60 EUR per share unchanged on last year
 Ranshofen, 28 February 2014 AMAG posts record shipments in 2013; dividend recommendation of 0.60 EUR per share unchanged on last year Shipments at an all-time high of 351,700 tonnes (t) in 2013, compared