Steering ahead FY2012 Results Briefing 22 nd June 2012
|
|
|
- James Stephens
- 6 years ago
- Views:
Transcription


1 Steering ahead FY2012 Results Briefing 22 nd June 2012

2
3 AGENDA FY2012 Highlights Business Overview Financial and Operations Highlights Industry Review Outlook & Growth Strategies
4
5 FY2012 HIGHLIGHTS Revenue up 6.7% to S$364.1m SEA market up 5.6% to S$276.4m South Africa grew 5.6% to S$38.3m (up 18% in local currency terms) Gross margin stable at 22.1% (FY2011: 23.3%) Dividend per share of S$1.5 cent recommended, representing 36.1% payout ratio comparing (FY2011: 26.5%) Expects FY2013 to be profitable
6

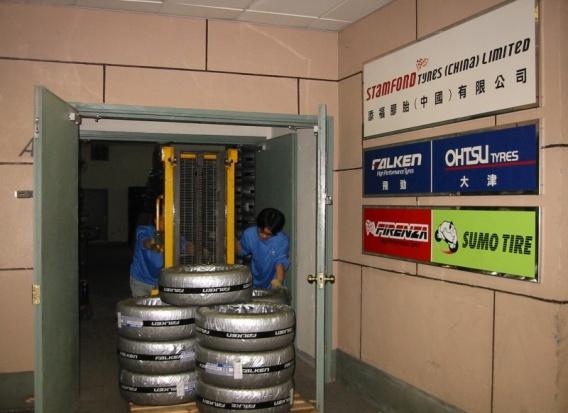
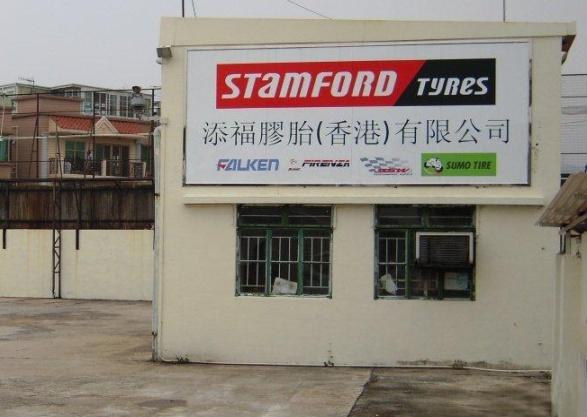
7 BUSINESS OVERVIEW One of the largest independent tyre and wheel distributors in South East Asia Presence in 9 countries; with 4,000 dealers Sole distributor for major international brands: International export of proprietary brands


 Proprietary Brand Tyres")
 SSW Alloy Wheel")


8 OUR BUSINESS MODEL Distribution Manufacturing Overseas Distribution Network Retail Network (tyres for passenger cars, wheels, car services & accessories) Commercial Tyres and Services (Truck and Off the Road OTR tyre management services) Proprietary Brand Tyres (passenger car radial, light truck, truck bus radial) SSW Alloy Wheel (Manufacturing) Retread of Truck and OTR Tyres Central warehousing and distribution in 9 countries 25 Retail Outlets in South East Asia 2 Truck Centers 3 Contract Customer Workshops 7 Mobile Fleet Service Vehicles Export to over 90 countries


9 DISTRIBUTION VALUE CHAIN Major Brands Over 4,000 3 rd Party Retail Outlets Proprietary Brands Distribution Centres 92% of revenue derived from distribution 25 Stamford Retail Outlets 2 Truck Centers 3 Contract Customer Workshops 7 Mobile Fleet Service Vehicles

10 OVERSEAS DISTRIBUTION NETWORK Links to 4,000 dealers/retailers across 9 countries India Thailand China Australia South Africa Malaysia Singapore Indonesia Hong Kong


11 LOCAL PRESENCE Singapore Malaysia Thailand Indonesia Hong Kong China Australia India South Africa
12 SOLE DISTRIBUTION AREAS OF MAJOR BRANDS Brands Falken Continental Countries Singapore, Malaysia, Thailand, Indonesia, Singapore, China, Malaysia, South Thailand, Africa, Indonesia, Mauritius, China, Brunei, South Vietnam, Africa, Cambodia, Mauritius, Myanmar Brunei, Vietnam, and India East Cambodia, Timor, Nepal, Myanmar New and Caledonia, India Southern Africa Singapore Dunlop Toyo OTR and Truck Hong Kong, Macau, Indochina through Tyre Pacific HK Singapore, Brunei, Malaysia and Indonesia

13 INTERNATIONAL EXPORT OF PROPRIETARY BRANDS Network spans more than 90 countries including Eastern Europe, Western Europe, Africa, Latin America and Middle East
14
15 STEADY SALES & GP MARGINS S$ mln 400 CAGR of 7.0% 23.3% 23.5% % 23.0% % % 22.0% % % % % 0 FY2009 FY2010 FY2011 FY2012 Revenue 20.0%
16 OVERSEAS EXPANSION Growth in all key markets Turnover by geographical segment FY12 FY11 Change (S$'000) % (S$'000) % % Southeast Asia 276, , South Africa 38, , North Asia 34, , Others 14, , Total 364, ,

17 FOREX MANAGEMENT S$ mln FY2009 FY2010 FY2011 FY
18 FOREX MANAGEMENT SGDZAR 2010/ / SGDZAR 2010/ /12 AVE FX RATE ZAR FY FY FY May '10 Aug '10 Nov '10 Feb '11 May '11 Aug '11 Nov '11 Feb '12
19 FOREX MANAGEMENT To reduce Forex impact to Profit and Loss for South Africa, the Group is taking two steps: Increase equity in South Africa to reduce foreign currency denominated payables Increase local bank borrowings to reduce foreign currency denominated payables

20 GROUP S NET PROFIT S$ mln Net Profit & Margin % % 4.0% % 3.5% % 3.0% % 2.0% 1.5% 1.0% % 1.1 FY2009 FY2010 FY2011 FY % 0.0%
21 FINANCIAL RATIOS FY12 FY11 Inventory Turnover 158 days 133 days Receivables Turnover 96 days 86 days Payables* Turnover 150 days 120 days Cash Conversion Cycle 104 days 99 days Current Ratio 1.42 Net Gearing (X) *Payables consists of trust receipts and short-term revolving loans
22


23 INCREASING VEHICLE OWNERSHIP IN SINGAPORE 1,000,000 Passenger and Commercial Vehicles Population in Singapore 950, , , , , , , , , , , , , Source: Land Transport Authority
24 VEHICLE REGISTRATIONS IN MALAYSIA REMAINS STRONG 700,000 New Passenger and Commercial Vehicles Registration 600, , , , Est: 615, , , , , , , YTD MAR Source: Malaysia Automotive Association


25 INCREASING VEHICLE OWNERSHIP IN CHINA 20,000,000 18,000,000 Sales of Passenger and Commercial Vehicles Population in China 18,061,900 18,505, Est: 20,000,000 16,000,000 14,000,000 13,645,010 12,000,000 10,000,000 8,000,000 8,023,500 6,000,000 4,000,000 2,000, YTD 2012 May Source: China Association of Automobile Manufacturers
26 LOOKING BEYOND ASIA Growing South Africa Vehicle Population 10,400,000 10,200,000 10,193,052 10,000,000 9,800,000 9,829,400 9,600,000 9,587,781 9,400,000 9,304,508 9,200,000 9,068,120 9,000,000 8,800,000 8,600,000 8,400, Source: National Traffic Information System (enatis)
27
28 OUTLOOK & GROWTH STRATEGIES Major Brands Expansion in South East Asia and South Africa Value-add to tyre business of major brands by improving warehousing and distribution capabilities Increase number of retail outlets, truck centres and Truck and Earthmover Tyre Management contracts
29 OUTLOOK & GROWTH STRATEGIES Entrance into new markets Work closely with our principals to expand into new markets

30 Corporate Contacts: 19 Lok Yang Way, Jurong, Singapore Tel: Fax: Thank You! Investor Relations Contacts: Tel:
Annual General Meeting FY August 2018
 Annual General Meeting FY2018 30 August 2018 1 CONTENTS Stamford Tyres History / Milestones Core Activities Business Operations Stamford Tyres Regional Activities Financial Highlights FY2018 Group Strategy
2011 Third Quarter Update 17 November 2011
 2011 Third Quarter Update 17 November 2011 Operations Highlights Group (In HK$ millions) 3Q11 3Q10 2011 2010 Sales 1,334 1,125 +19% 3,983 3,262 +22% Gross profit 767 638 +20% 2,348 1,875 +25% Gross margin
FISCAL YEAR ENDING MARCH 2012 FIRST HALF FINANCIAL RESULTS
 FISCAL YEAR ENDING MARCH 2012 FIRST HALF FINANCIAL RESULTS Mazda Motor Corporation November 2, 2011 New Mazda CX-5 (European specifications) 1 PRESENTATION OUTLINE Highlights Fiscal Year Ending March 2012
1 Copyright(C) 2012 Isuzu Motors Limited All rights reserved
 2012 Isuzu Motors Limited All rights reserved") FY2012 Financial Results May 10, 2012 1 Copyright(C) 2012 Isuzu Motors Limited All rights reserved Contents Ⅰ. President and Representative Director : Susumu Hosoi FY2012 Overview Ⅱ. Director Director
FY2012 Financial Results May 10, 2012 1 Copyright(C) 2012 Isuzu Motors Limited All rights reserved Contents Ⅰ. President and Representative Director : Susumu Hosoi FY2012 Overview Ⅱ. Director Director
FISCAL YEAR MARCH 2014 FIRST HALF FINANCIAL RESULTS. New Mazda Axela (Overseas name: New Mazda3)
") FISCAL YEAR MARCH 2014 FIRST HALF FINANCIAL RESULTS New Mazda Axela (Overseas name: New Mazda3) Mazda Motor Corporation October 31, 2013 1 PRESENTATION OUTLINE Highlights Fiscal Year March 2014 First Half
FISCAL YEAR MARCH 2014 FIRST HALF FINANCIAL RESULTS New Mazda Axela (Overseas name: New Mazda3) Mazda Motor Corporation October 31, 2013 1 PRESENTATION OUTLINE Highlights Fiscal Year March 2014 First Half
US$82,814m. Total assets. US$3,403m. Net debt. By Sector # US$411m Property. US$157m Insurance broking & financial services.
 Jardine Matheson Group Profile 2018 Jardine Matheson Holdings Limited 2017 Financial Highlights * US$83,808m Gross revenue US$4,378m Underlying profit before tax + US$82,814m Total assets 444,000 People
FY2017 Results. February 26, 2018
 FY2017 Results February 26, 2018 Our background & development Registered capital increased to 12 MB Started International marine transportation ( Myanmar route ) Registered capital increased to 100 MB
FY2018 Financial Results
 FY2018 Financial Results May 14, 2018 ISUZU MOTORS LIMITED 1 Copyright(C) 2018 Isuzu Motors Limited All rights reserved Contents Ⅰ. President and Representative Director : Masanori Katayama FY2018 and
Dave Carroll Capital Markets Day Markets Update
 Dave Carroll Capital Markets Day 2004 Markets Update Tomkins Operates in Diverse End Markets Breakdown 2003 Sales ( 3,150m, US$4,795m) Non-Residential Construction 11% Other 9% Automotive OE 27% Residential
Automotive Aftermarket Giorgio Brusco
 Automotive Aftermarket Giorgio Brusco Vice President Automotive Aftermarket Europe Agenda The global business today Recent progress in automotive Future growth drivers Summary 2 Worldwide Automotive Aftermarket:
FY2012 third-quarter financial results
 FY2012 third-quarter financial results Nissan Motor Co., LTD. February 8, 2013 Key performance indicators: financial results (billion yen) Net revenue 6,698.4 6,755.2 Operating profit 427.8 Net income
Financial Results for First Quarter of FY2015
 Financial Results for First Quarter of FY2015 (From April 1, 2014 to June 30, 2014) July 29, 2014 Hino Motors, Ltd. 1. Sales Turnover 2/15 Global Unit Sales (Retail Sales) 3/15 Sales Sales decreased decreased
FY17 RESULTS BUSINESS UPDATES FY18 OUTLOOK. Nissan Motor Co., Ltd. May 14 th, 2018
 Nissan Motor Co., Ltd. May 14 th, 2018 RESULTS BUSINESS UPDATES FY18 OUTLOOK www.nissan-global.com Copyright NISSAN MOTOR CO., LTD. All rights reserved. 2 GLOBAL 91.81 5.08 TIV * 1 vs. 93.52 GLOBAL +1.9%
Automotive Market in ASEAN Prepared by: Reciprocus International Date: January 2017
 RECIPROCUS RESEARCH BRIEF Automotive Market in ASEAN Prepared by: Reciprocus International Date: January 2017 Table of Contents Executive Summary 2 Macroeconomic Outlook of the Industry 3 Industry Outlook
FOURTH QUARTER 2017 Martin Lundstedt, President and CEO
 FOURTH QUARTER 2017 Martin Lundstedt, President and CEO Volvo Group FOURTH QUARTER HIGHLIGHTS Net sales +11% (+16% excl. currency) Continued improved profitability for the Group - Trucks adjusted operating
Overseas Market Conditions of Construction and Mining Equipment
 1 Overseas Market Conditions of Construction and Mining Equipment December 17, 2012 Hisashi Shinozuka Senior Executive Officer President of Construction and Mining Marketing Division Komatsu Ltd. 2 1.
FY17 RESULTS BUSINESS UPDATES FY18 OUTLOOK. Nissan Motor Co., Ltd. May 14 th, 2018
 Nissan Motor Co., Ltd. May 14 th, 2018 RESULTS BUSINESS UPDATES FY18 OUTLOOK www.nissan-global.com Copyright NISSAN MOTOR CO., LTD. All rights reserved. 2 GLOBAL 91.81 5.08 TIV * 1 vs. 93.52 GLOBAL +1.9%
Q3 Results November 16, 2006 Analyst Presentation
 Q3 Results 2006 November 16, 2006 Analyst Presentation Group Sales (in million Euro) Total Sales 2,395 +3.3% (+2.4%)* 2,474 Split per Business Group (YTD) Specialty Products 7% Q3 797 +1.0% (+2.5%)* 805
FISCAL YEAR MARCH 2014 FINANCIAL RESULTS
 FISCAL YEAR MARCH 214 FINANCIAL RESULTS Mazda CX-5 Mazda Atenza Mazda Motor Corporation April 25, 214 New Mazda Axela 1 PRESENTATION OUTLINE Highlights Fiscal Year March 214 Results Fiscal Year March 215
1 st Half 2018 Results. August 1 st, 2018
 1 st Half 2018 Results August 1 st, 2018 H1 HIGHLIGHTS & CATEGORY SPOTLIGHTS Gonzalve BICH 2 First Half 2018 Key Messages Challenging market and business environment Continued investment in targeted Brand
Agenda 股票代號 :1590. Ⅰ Group Overview. Ⅱ Product & Market. Ⅲ Competitive Advantage. Ⅳ Financial Outlook. Ⅴ Development prospects & Strategic
 1 Agenda Ⅰ Group Overview Ⅱ Product & Market Ⅲ Competitive Advantage Ⅳ Financial Outlook Ⅴ Development prospects & Strategic 2 Ⅰ Group Overview 3 Group Overview 1988 AirTAC was founded in Taiwan 1998 AirTAC
INVESTOR PRESENTATION 2016
 INVESTOR PRESENTATION 2016 WHY BRISA IS A GREAT COMPANY TO INVEST 1. Fast growing market: o Increasing capacity and new investments of automotive manufacturers o Continued growth potential in the domestic
Downstream & Chemicals
 Downstream & Chemicals Pierre Breber Executive Vice President 017 Chevron Corporation Downstream portfolio Fuels refining & marketing Integrated value chains Lubricants & additives Globally positioned
2003 fourth quarter and full-year results
 Dinesh Paliwal Member of Group Executive Committee, Head of Automation Technologies Division 2003 fourth quarter and full-year results Automation Technologies Copyright 2003 ABB. All rights reserved. -
2010 1Q Investor Meeting. May 2010
 2010 1Q Investor Meeting May 2010 This presentation contains preliminary figures which may be materially different from the final figures. While the statements in this presentation represent our current
DISCLAIMER. Indofood Agri Resources Ltd.
 INTEGRATED PLANTATION WITH LEADING BRANDS Company Presentation Q 2008 Results 29 April 2008 DISCLAIMER This presentation was prepared solely and exclusively for the parties presently being invited for
BlueScope Steel Limited Consolidated Financial Headlines
 BlueScope Steel Limited Consolidated Financial Headlines 2003 2004 2005 2006 2007 2008 2009 2010 2011 2012 2013 2013 2013 2014 2014 2014 2015 2015 2015 2016 2016 2016 2017 2017 2017 2018 2018 2018 Total
FY16 results. Business updates. FY17 outlook. Nissan Motor Co., Ltd. May 11 th, 2017
 Nissan Motor Co., Ltd. May 11 th, 2017 results Business updates FY17 outlook www.nissan-global.com Copyright NISSAN MOTOR CO., LTD. All rights reserved. 2 (TSE REPORT BASIS CHINA JV EQUITY BASIS) NET REVENUE
FISCAL YEAR ENDED MARCH 2011 FINANCIAL RESULTS
 FISCAL YEAR ENDED MARCH 211 FINANCIAL RESULTS Mazda Motor Corporation April 28, 211 Mazda MINAGI 1 PRESENTATION OUTLINE Highlights Fiscal Year Ended March 211 Results In Summary Question & Answer Session
ANALYST BRIEFING FOR THE THIRD QUARTER ENDED NOV 2016
 ANALYST BRIEFING FOR THE THIRD QUARTER ENDED 2016 21 NOV 2016 MSM Malaysia Holdings Berhad Analyst Briefing Q3 2016 21/11/2016 1 CONTENTS 01 02 03 04 05 Group Financial Highlights Performance Review Sugar
Nissan Motor Co., Ltd. February 12 th, 2019
 Nissan Motor Co., Ltd. February 12 th, 2019 NET REVENUE 2,875.5 3,045.7 OPERATING PROFIT *1 NET INCOME 301.6 FREE CASH FLOW (AUTO) NET CASH (AUTO) 1,311.4 1,334.4 US TAX REFORM 207.7 82.4 103.3 93.9 *2
KINGDOM OF CAMBODIA NATION RELIGION KING 3
 KINGDOM OF CAMBODIA NATION RELIGION KING 3 TOURISM STATISTICS REPORT October 2018 MINISTRY OF TOURISM Statistics and Tourism Information Department No. A3, Street 169, Sangkat Veal Vong, Khan 7 Makara,
KINGDOM OF CAMBODIA NATION RELIGION KING 3
 KINGDOM OF CAMBODIA NATION RELIGION KING 3 TOURISM STATISTICS REPORT September 2018 MINISTRY OF TOURISM Statistics and Tourism Information Department No. A3, Street 169, Sangkat Veal Vong, Khan 7 Makara,
Global Polybutadiene Rubber (BR) Market Study ( )
 Market Study ( )") Global Polybutadiene Rubber (BR) Market Study (2014 2025) Table of Contents 1. INTRODUCTION 1.1. Introduction to Polybutadiene Rubber Market Product Description Properties Industry Structure Value Chain
Global Polybutadiene Rubber (BR) Market Study (2014 2025) Table of Contents 1. INTRODUCTION 1.1. Introduction to Polybutadiene Rubber Market Product Description Properties Industry Structure Value Chain
Macau Visitor Arrivals. Visitors Inflow ( YTD)
") Macau Visitor Arrivals Macau Inflow 21 YOY Change 211 YOY Change 212 YOY Change Jan 2,46,556 6.8% 2,76,64 1.4% 2,461,64 18.6% Feb 2,57,566 24.4% 2,164,249 5.2% 2,13,977 1.5% Mar 2,11,99 6.7% 2,19,865 8.9%
Macau Visitor Arrivals Macau Inflow 21 YOY Change 211 YOY Change 212 YOY Change Jan 2,46,556 6.8% 2,76,64 1.4% 2,461,64 18.6% Feb 2,57,566 24.4% 2,164,249 5.2% 2,13,977 1.5% Mar 2,11,99 6.7% 2,19,865 8.9%
Q3 & 9M 2018 Results Presentation. October 24 th, 2018
 Q3 & 9M 2018 Results Presentation October 24 th, 2018 Q3 & 9M HIGHLIGHTS & CATEGORY SPOTLIGHTS Gonzalve BICH 3Q and 9M 2018 Results Presentation 2 9 Months 2018 Key Messages Continued challenging trading
Performance of Wipro Limited for Quarter and Year ended - March 31, 2013
 Performance of Wipro Limited for Quarter and Year ended - March 31, 2013 Suresh Senapaty Executive Director and Chief Financial Officer April 19, 2013 1 Financial Summary for the Year Ended March 31, 2013
OVERVIEW OF THE ASIAN FUEL MARKET
 OVERVIEW OF THE ASIAN FUEL MARKET THE EUROPEAN FUELS CONFERENCE 9 March 2011 Sunanda Banerjee European Fuel Oxygenates Association - www.efoa.eu Mission and Vision Working closely with fuel policymakers,
TOFAŞ Q ANALYST PRESENTATION
 TOFAŞ Q1 2016 ANALYST PRESENTATION 03.05.2016 1 2016 Q1 AGENDA Highlights Turkish Automotive Industry Production & Capacity Utilization Domestic Market Developments Tofaş Domestic Market Performance Export
On track. Investor and Analyst Presentation On the Occasion of the Release of the Preliminary Figures for FY 2011 Hanover, 19 January 2012
 On track. Investor and Analyst Presentation On the Occasion of the Release of the Preliminary Figures for FY 2011 Agenda Delticom at a Glance Business Model Profit & Loss Balance Sheet Outlook 2 Agenda
Q Financial Results
 Q3 2018 Financial Results 1 Forward-looking statement The statements on the future in this presentation, including expected sales and earnings, are associated with risks and uncertainties and may be affected
2Q06 Results. Investor Relations
 2Q06 Results Investor Relations Content 1. 2Q06 Key Results 2. Summarized Income Statement 3. Balance Sheet as of Jun. 2006 4. Outlook for 2006 5. Result & Outlook By Division Appendix : 2Q06 Results Breakdown
2015 Interim Results Announcement
 China Petroleum & Chemical Corporation 2015 Interim Results Announcement August 27, 2015 Hong Kong Cautionary Statement This presentation and the presentation materials distributed herein include forward-looking
Earnings conference call Q4 & FY 2016
 Earnings conference call Q4 & FY 2016 Bo Annvik, CEO / Åke Bengtsson, CFO February 10, 2016 1 Agenda Business Highlights Market Update Sales Financials Way forward 2 Business Summary FY 2016 A year with
INCREASING SALES FOR MINING RELATED BUSINESS
 Investor Relations of PT UNITED TRACTORS Tbk INCREASING SALES FOR MINING RELATED BUSINESS In the first half 2001, the Company managed to record increase in net revenue from IDR 2.32 trillion to IDR 3.54
International Flows REGIONAL TABLES. Introduction. Key Trends. Key Indicators for Asia and the Pacific 2008
 183 International Flows The People s Republic of China has the biggest share of merchandise exports in the region. The destination of exports of major exporters tends to be other Asian economies. A similar
Earnings conference call Q3 2016
 Earnings conference call Q3 2016 Bo Annvik, CEO / Åke Bengtsson, CFO October 25, 2016 1 Agenda Business Highlights Market Update Sales Financials Outlook Public offer 2 Business Highlights Q3 2016 Solid
282m 75% +575m. Net sales Operating income before non-recurring items. Operating margin before non-recurring items. Net Loss.
 First-Half 2009 Financial Highlights Net sales Operating income before non-recurring items Operating margin before non-recurring items Net Loss Net debt-to-equity ratio Free cash flow** 7,134m 282m 4.0%
Third quarter AB Volvo
 Third quarter 2013 Third quarter 2013 TRUCKS EUROPE Excellent reception of the new products decision to optimize manufacturing Highlights in Commercial launch of the new product ranges Strong order situation
Q Business Result
 Q3 2018 Business Result Q3 2018 business result is prepared for investors consideration only before completion of independent auditors review. Therefore, parts of contents on this material could be changeable
Earnings conference call. Q4 and Full year 2015
 Earnings conference call Q4 and Full year 2015 Bo Annvik, CEO / Åke Bengtsson, CFO 11 February 2016 1 Agenda Business Highlights Market Update Sales Financials Outlook 2 2015 in numbers Operating margin
FISCAL YEAR MARCH 2015 FIRST HALF FINANCIAL RESULTS. New Mazda Demio
 FISCAL YEAR MARCH 2015 FIRST HALF FINANCIAL RESULTS New Mazda Demio Mazda Motor Corporation October 31, 2014 1 PRESENTATION OUTLINE Highlights Fiscal Year March 2015 First Half Results Fiscal Year March
Corporate Presentation May 2013
 Corporate Presentation May 2013 Geely Automobile In Figures Year started: 1998 Total workforce: 18,512 (on 31/12/2012) Manufacturing facilities: Products: Distribution network: 9 car plants in China 14
Volvo Group THIRD QUARTER 2015 JAN GURANDER. Volvo Group Headquarters Third quarter
 Volvo Group THIRD QUARTER 2015 JAN GURANDER 1 VOLVO GROUP Third quarter highlights NET SALES SEK bn 12 months 310 bn IMPROVED PROFITABILITY ON FLAT VOLUMES UNDERLYING OPERATING MARGIN 6.9% 67 73 OPERATING
Analyst Presentation Barloworld Automotive 29 February 2008
 Analyst Presentation Barloworld Automotive 29 February 2008 Automotive Division Automotive Division Overview Business Overview Motor Retail Car Rental Fleet Services Importation & Distribution Joint Ventures
FISCAL YEAR MARCH 2015 THIRD QUARTER FINANCIAL RESULTS. Updated Mazda CX-5 (Japanese specification model)
") FISCAL YEAR MARCH 2015 THIRD QUARTER FINANCIAL RESULTS Updated Mazda CX-5 (Japanese specification model) Mazda Motor Corporation February 4, 2015 1 PRESENTATION OUTLINE Highlights Fiscal Year March 2015
FISCAL YEAR MARCH 2015 THIRD QUARTER FINANCIAL RESULTS Updated Mazda CX-5 (Japanese specification model) Mazda Motor Corporation February 4, 2015 1 PRESENTATION OUTLINE Highlights Fiscal Year March 2015
ANALYST BRIEFING FOR THE FOURTH QUARTER ENDED FEBRUARY 2017
 ANALYST BRIEFING FOR THE FOURTH QUARTER ENDED 2016 22 FEBRUARY 2017 MSM Malaysia Holdings Berhad Analyst Briefing Q4 2016 22/2/2017 1 CONTENTS 01 02 03 04 05 Group Financial Highlights Performance Review
Information Technology and Economic Development: An Introduction to the Research Issues
 November 1998 Working Papers No. 153 Information Technology and Economic Development: An Introduction to the Research Issues TABLE 1 WORLD-WIDE INFORMATION TECHNOLOGY MARKET BREAKDOWN, 1995
Strong growth outlook. Leif Östling, President and CEO
 Strong growth outlook Leif Östling, President and CEO 1 Disclaimer 2 This presentation contains forward-looking statements that reflect management's current views with respect to certain future events
GROUPE RENAULT NATIXIS CONFERENCE INDUSTRIALS PLENARY SESSION
 GROUPE RENAULT NATIXIS CONFERENCE INDUSTRIALS PLENARY SESSION DISCLAIMER Information contained within this document may contain forward looking statements. Although the Company considers that such information
CONFIDENCE DYNA-MAC HOLDINGS LTD.
 Dyna-Mac Holdings Ltd. 3Q 2018 Results 08-November-2018 Photo: SBM Offshore FORWARD WITH CONFIDENCE DYNA-MAC HOLDINGS LTD. 1 Photo: SBM Offshore Business Overview 2 About Dyna-Mac A multi-disciplinary
FISCAL YEAR END MARCH 2013 FIRST HALF FINANCIAL RESULTS. New Mazda6 (Atenza)
") FISCAL YEAR END MARCH 2013 FIRST HALF FINANCIAL RESULTS New Mazda6 (Atenza) Mazda Motor Corporation October 31, 2012 1 PRESENTATION OUTLINE Highlights Fiscal Year March 2013 First Half Results Fiscal Year
FISCAL YEAR END MARCH 2013 FIRST HALF FINANCIAL RESULTS New Mazda6 (Atenza) Mazda Motor Corporation October 31, 2012 1 PRESENTATION OUTLINE Highlights Fiscal Year March 2013 First Half Results Fiscal Year
BMW GROUP QUARTERLY REPORT. TO 30 SEPTEMBER 2014
 . BMW GROUP QUARTERLY REPORT. TO 30 SEPTEMBER 2014 THE BMW GROUP IS WELL ON TRACK AND PERFORMS IN LINE WITH THE GUIDANCE. The BMW Group is well on track to reach its targets for 2014. Full year guidance
TOFAŞ RESULTS WEBCAST PRESENTATION
 TOFAŞ 31.12.2017 RESULTS WEBCAST PRESENTATION 02.02.2018 AGENDA Highlights Turkish Automotive Industry Production Domestic Market Developments Tofaş Domestic Market Performance Export Markets & Tofaş Performance
FISCAL YEAR MARCH 2015 FIRST QUARTER FINANCIAL RESULTS. Mazda Roadster 25 th Anniversary Model
 FISCAL YEAR MARCH 2015 FIRST QUARTER FINANCIAL RESULTS Mazda Roadster 25 th Anniversary Model Mazda Motor Corporation July 31, 2014 1 PRESENTATION OUTLINE Highlights Fiscal Year March 2015 First Quarter
Asia - Terminal Handling Charges & Security Origin
 Asia - Terminal Handling Charges & Security Origin From: East Asia * (excluding India and Middle East countries) Charge: Terminal Handling Charge Origin (THO) valid until further notice Country Location
Mazda Motor Corporation June 17, 2011
 FY ENDING MARCH 2012 FINANCIAL FORECAST New MAZDA Demio 13-SKYACTIV Mazda Motor Corporation June 17, 2011 1 PRESENTATION OUTLINE FY ending March 2012 Forecast Updates of Framework for Medium- and Long-term
CAPITAL MARKETS DAY DR FRIEDRICH EICHINER MEMBER OF THE BOARD OF MANAGEMENT OF BMW AG, FINANCE.
 March 26, 2015 CAPITAL MARKETS DAY DR FRIEDRICH EICHINER MEMBER OF THE BOARD OF MANAGEMENT OF BMW AG, FINANCE. AGENDA. 1 Financial Status of 2014 2 Chances and Challenges in 2015 3 Towards a strong future
Market Outlook for Malaysian Rubber Products in th February 2014
 Market Outlook for Malaysian Rubber Products in 2014 25 th February 2014 World Economic Scenario World Economic Outlook For 2014 World growth increase from 3% in 2013 to 3.7% in 2014 Advanced economies
Accounting Overview for 2 nd Quarter of FY2014
 1/15 Accounting Overview for 2 nd Quarter of FY2014 October 29, 2013 Yasuhiko Ichihashi President, Member of Board Hino Motors, Ltd. Photos: Vehicles scheduled to be on display at 43rd Tokyo Motor Show
FISCAL YEAR MARCH 2018 THIRD QUARTER FINANCIAL RESULTS
 FISCAL YEAR MARCH 2018 THIRD QUARTER FINANCIAL RESULTS PRESENTATION OUTLINE Highlights Fiscal Year March 2018 Nine Month Results Fiscal Year March 2018 Full Year Forecast Progress of Key Initiatives 1
1 MICHELIN INVESTOR DAY Shenyang, China November 10, Serge Lafon
 1 MICHELIN INVESTOR DAY Shenyang, China November 10, 2014 - Serge Lafon Outline 1. Truck General Overview 2. Customer expectations & Market segmentation 3. Levers for Growth 4. Levers for Profitability
Months Investor Presentation
 2018 9 Months Investor Presentation 25.10.2018 Disclaimer Ereğli Demir Çelik Fabrikaları T.A.Ş. (Erdemir) may, when necessary, make written or verbal announcements about forward-looking information, expectations,
PKC Group establishes Joint Venture with JAC. Matti Hyytiäinen, President & CEO
 PKC Group establishes 50-50 Joint Venture with JAC Matti Hyytiäinen, President & CEO 1 PKC Group makes a major breakthrough in China and establishes JV with JAC PKC Group has signed an agreement to establish
fy05i06 final results ESPRIT HOLDINGS LIMITED
 fy05i06 final results HOLDINGS LIMITED Forward-looking statements This presentation and subsequent discussion may contain certain forward-looking statements with respect to the financial condition, results
Automotive Holdings Group Limited. Euroz Securities Rottnest Island Conference Bronte Howson Managing Director March 2008
 Automotive Holdings Group Limited Euroz Securities Rottnest Island Conference 008 Bronte Howson Managing Director March 008 Group Snapshot Largest Automotive Retailing & Logistics Group in Australia 0
FY2015 First Quarter Financial Results. SUZUKI MOTOR CORPORATION 3 August 2015
 First Quarter Financial Results SUZUKI MOTOR CORPORATION 3 August 2015 Consolidated: Financial Summary Page2 Increased net sales and operating income/ordinary income Decreased net income attributable to
H Business Result
 H1 2017 Business Result H1 2017 business result is prepared for investors consideration only before completion of independent auditors review. Therefore, parts of contents on this material could be changeable
2010 Annual Results Announcement
 2010 Annual Results Announcement March 2011 1 Disclaimer These materials have been prepared by China ZhengTong Auto Services Holdings Limited ( ZhengTong Auto or The Company, together with its subsidiaries,
Roadshow Presentation
 Roadshow Presentation June 2, Wilfried Trepels, CFO 1 SAF-HOLLAND - Components Fifth Wheels Kingpins Suspensions Landing Gear Axle Systems 2 SAF-HOLLAND - Business Units Trailer Systems Powered Vehicle
Figure 4.1: Shares in Total World Exports, Regions of the World; and Major Exporters in the Asia and Pacific Region, 2014
 272 Key Indicators for Asia and the Pacific 2015 Globalization Snapshots The Asia and Pacific region accounted for about one-third of the world s merchandise exports in 2014, up from about one-quarter
Martin Laubscher Barloworld Automotive
 Barloworld Limited Investor Day Martin Laubscher Barloworld Automotive 2 February 2009 Business Overview Automotive Division Car Rental Fleet Services Motor Retail Joint Ventures Southern Africa Southern
Promoting Continued Growth
 Promoting Continued Growth of the Automobile Industry in the ASEAN Region Fujio Cho Chairman, Japan Automobile Manufacturers Association Contents Intro: The World Automobile Market 1. The Automobile Market
Asia - Terminal Handling Charges & Security Origin
 Asia - Terminal Handling Charges & Security Origin From: East Asia * (excluding India and Middle East countries) Terminal Handling Charge Origin (THO) Country Location / Port Currency Australia Adelaide
Economy and Output. Snapshots. Key trends. 220 Key Indicators for Asia and the Pacific 2015
 220 Key Indicators for Asia and the Pacific 2015 Economy and Output Snapshots The Asia and Pacific region generated more than 40% of global gross domestic product (GDP) in purchasing power parity terms
KINGDOM OF CAMBODIA NATION RELIGION KING 3
 KINGDOM OF CAMBODIA NATION RELIGION KING 3 TOURISM STATISTICS REPORT December 2015 MINISTRY OF TOURISM Statistics and Tourism Information Department No. A3, Street 169, Sangkat Veal Vong, Khan 7 Makara,
FY 2010 first-half financial results
 FY 2010 first-half financial results November 4, 2010 Nissan Motor Co., Ltd. first-half financial results Key performance indicators: Financial results (billion yen) Net revenue Operating profit Net income
Q Activity Airgas Operations Merged Solid Gas & Services Sales Growth. Paris, 25 October 2016
 Q3 2016 Activity Airgas Operations Merged Solid Gas & Services Sales Growth Paris, 25 October 2016 Q3 2016 Highlights Paris, 25 October 2016 Fabienne Lecorvaisier l Chief Financial Officer Airgas operations
FISCAL YEAR END MARCH 2013 FIRST QUARTER FINANCIAL RESULTS
 FISCAL YEAR END MARCH 213 FIRST QUARTER FINANCIAL RESULTS New MAZDA CX-5 Mazda Motor Corporation July 31, 212 1 PRESENTATION OUTLINE Highlights Fiscal Year End March 213 Results Update of Structural Reform
Global Motorcycle Market Research Report 2018
 Report Information More information from: https://www.wiseguyreports.com/reports/3271957-global-motorcycle-market-research-report-2018 Global Motorcycle Market Research Report 2018 Report / Search Code:
Supplemental Operational Performance Data
 Supplemental Operational Performance Data Set forth below are tables that provide supplemental information regarding the operational performance results for the three months ended December 31, 2010, as
KINGDOM OF CAMBODIA NATION RELIGION KING 3
 KINGDOM OF CAMBODIA NATION RELIGION KING 3 TOURISM STATISTICS REPORT March 2018 MINISTRY OF TOURISM Statistics and Tourism Information Department No. A3, Street 169, Sangkat Veal Vong, Khan 7 Makara, Phnom
Q Sales inc. VAT 17 January 2013
 Sales growth in the fourth quarter and in 2012 Continued growth in emerging markets, notably Latin America, better quarter in France Q4 2012 sales (inc. VAT): +0.8% to 22.9bn Full-year 2012 sales (inc.
FISCAL YEAR MARCH 2018 FIRST QUARTER FINANCIAL RESULTS
 FISCAL YEAR MARCH 2018 FIRST QUARTER FINANCIAL RESULTS PRESENTATION OUTLINE Highlights Fiscal Year March 2018 First Quarter Results Fiscal Year March 2018 Full Year Forecast Structural Reform Stage 2 Progress
World Geographic Shares
 World Geographic Shares North America South America Europe Africa Asia Australia/ Oceania 18% 13% 7% 22% 33% 6% World Population Shares North America South America Europe Africa Asia Australia/ Oceania
NET SALES AT SEPTEMBER 30, October 28, 2013
 NET SALES AT SEPTEMBER 30, 2013 October 28, 2013 1 NET SALES AT 30 SEPTEMBER 30, 2013 October 28, 2013 Net Sales of 15,282m over First 9 Months, Sales Volumes Up 2% in 3 rd Quarter Markets: up in Q3 Europe:
KINGDOM OF CAMBODIA NATION RELIGION KING 3
 KINGDOM OF CAMBODIA NATION RELIGION KING 3 TOURISM STATISTICS REPORT February 2017 MINISTRY OF TOURISM Statistics and Tourism Information Department No. A3, Street 169, Sangkat Veal Vong, Khan 7 Makara,
KINGDOM OF CAMBODIA NATION RELIGION KING 3
 KINGDOM OF CAMBODIA NATION RELIGION KING 3 TOURISM STATISTICS REPORT May 2017 MINISTRY OF TOURISM Statistics and Tourism Information Department No. A3, Street 169, Sangkat Veal Vong, Khan 7 Makara, Phnom
KINGDOM OF CAMBODIA NATION RELIGION KING 3
 KINGDOM OF CAMBODIA NATION RELIGION KING 3 TOURISM STATISTICS REPORT October 2017 MINISTRY OF TOURISM Statistics and Tourism Information Department No. A3, Street 169, Sangkat Veal Vong, Khan 7 Makara,
EXANE BNP PARIBAS 13th European Seminar June 8, 2011
 EXANE BNP PARIBAS 13th European Seminar June 8, 2011 This presentation may contain forward-looking statements. Such forward-looking statements do not constitute forecasts regarding the Company s results