Somboon Advance Technology PCL
|
|
|
- Daniela Quinn
- 6 years ago
- Views:
Transcription


1 Somboon Advance Technology PCL Opportunity Day 2017Q2 September 12,
2 Company Overview Automotive Industry Overview Tractor Industry Overview Sale Performance Financial Highlights Q&A 2
3 Company Overview As of August 29, 2017 SAT Paid up 425 million Baht 1. Somboon Holding Co.,Ltd % 2. Thai NVDR 6.03% 3. Nortrust Nominees Ltd-Cl Ac. 5.89% 4. AIA TH-EQ2-P 1.91% 5. AIA TH-EQ3-P 1.69% 6. Others 54.56% 99.99% 99.99% 99.99% 99.99% ICP SBM BSK SFT 21.25% 20.00% Tsuchiyoshi Somboon Coated Sand 2.90% Yamada Somboon Nisshinbo Somboon Automotive Note: Somboon Holding & Kitaphanich Family own approximately 45% 1.80% Somboon Somic Manufacturing 3


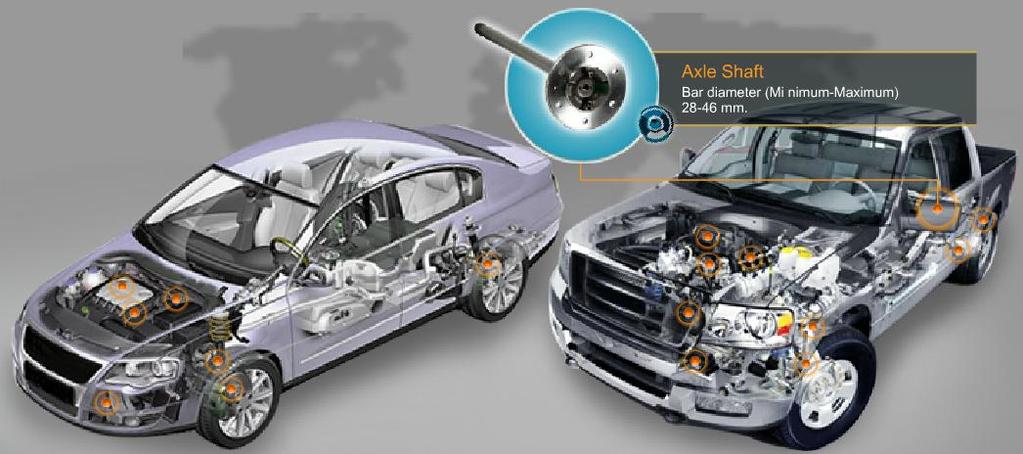
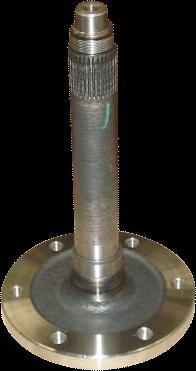
4 Company Overview SAT: Forging with Machining: Axle shaft products BSK: Bending & Coiling: Spring products ICP/SBM: Iron casting and machining products Automotive-part products Agricultural Machinery-part products SFT: Forging with Machining: General products 4


5 Automotive Parts 5
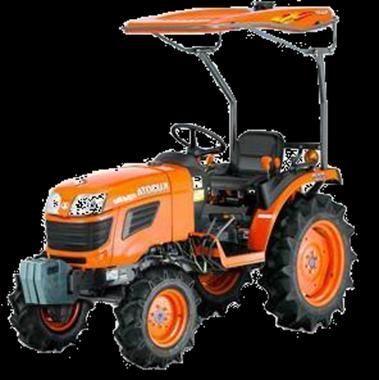
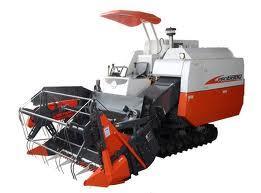


6 Agricultural Machinery Parts 6
7 Company Overview Automotive Industry Overview Tractor Industry Overview Sale Performance Financial Highlights Q&A 7

8 Car Production 2Q2017 Unit: Thousand cars Source: Thai Automotive Industry Association QoQ: Car production declined -4% as export decreased -13%, but domestic increased +9% YoY : Car production declined -4% as export decreased -12%, but domestic increased +6% 1H17: Car production declined -4% as export decreased -10%, but domestic increased +4% 8
 : Changes in Pickup, Passenger and Eco car are -7%, +3% and")
9 Car Production: by type Unit: Thousand cars QoQ (-4%) : Changes in Pick up, Passenger and Eco car are -4%, +3% and -13% YoY (-4%) : Changes in Pickup, Passenger and Eco car are -3%, -4% and -12% 1H17 (-4%) : Changes in Pickup, Passenger and Eco car are -7%, +3% and -5% 9
 :")
 : Changes in Pickup, Passenger and Eco car are -4%, +7% and")
10 Car Production: Domestic Unit: Thousand cars QoQ (+9%) : Changes in Pickup, Passenger and Eco car are +15%, -5% and +22% YoY (+6%) : Changes in Pickup, Passenger and Eco car are +4%, -6% and +38% 1H17 (+4%) : Changes in Pickup, Passenger and Eco car are -4%, +7% and +26% 10
11 Car Production: Export Unit: Thousand cars QoQ (-13%) : Changes in Pickup, Passenger and Eco car are -15%, +12% and -32% YoY (-12%) : Changes in Pickup, Passenger and Eco car are -7%, -2% and -35% 1H17 (-10%) : Changes in Pickup, Passenger and Eco car are -9%, -1% and -20% 11
 2Q2017 (YoY) : Car export declined -12% (N.")
12 Export Destinations Unit: Thousand Cars 2Q2017 (QoQ) : Car export declined -11% (Africa, N. America ) 2Q2017 (YoY) : Car export declined -12% (N. America, Middle East ) 1H17 : Car export declined -10% (YoY) Top 3 exported region are Australia, Asia and Europe 12

13 Thailand automotive outlook CAGR =9% CAGR =3% Thailand Floods & Tsunami in Japan First car scheme Global Financial Crisis Asian Financial Crisis Source: Thai Automotive Industry Association: Actual , SBG: Forecast
14 Company Overview Automotive Industry Overview Tractor Industry Overview Sale Performance Financial Highlights Q&A 14

15 Tractor production by Quarter Unit: in Thousand Source : Customer QoQ : Increased +19% YoY : Increased +44% 1H17 : Increased +23% 15
16 Tractor Production outlook Unit: in Thousand CAGR =21% CAGR = 7% Flood Drought Source : SBG s Forecast 16
17 Company Overview Automotive Industry Overview Tractor Industry Overview Sale Performance Financial Highlights Q&A 17
 12% 16% 18% 18% Disc Brake & Drum Brake 22% 21% Axle Shaft 24% 27% 0% 5% 10% 15% 20% 25% 30% Note : Including Sell&Buy back")
18 Sale by products 1H17 vs 1H16 Others Hub Stabilizer Bar 2% 1% 4% 4% 4% 6% 1H2017 1H2016 Leaf Spring 5% 5% Coil Spring 5% 6% Casting/Machining (Kubota) Casting/Machining (Automotive) 12% 16% 18% 18% Disc Brake & Drum Brake 22% 21% Axle Shaft 24% 27% 0% 5% 10% 15% 20% 25% 30% Note : Including Sell&Buy back amount 18

19 Sale by Customers 1H17 vs 1H16 Others Ford & Mazda 1% 2% 9% 9% 1H2017 1H2016 GM 1% 1% Nissan Honda 3% 2% 4% 4% Isuzu Kubota Toyota/Hino Mitsubishi 6% 6% 15% 17% 28% 31% 31% 30% 0% 5% 10% 15% 20% 25% 30% 35% Note : Including Sell&Buy back amount 19


20 Market Share 1H2017 SMT& Others 28% SAT 72% BSK 24% SBM 25% NHK& Aisin& Others Others Rear Axle Shaft Y16 = 76 % 76% Coil Spring Y16 = 31 % 75% Disc & Drum Y16= 25% SFT 12% BSK 20% Others 88% HubY16=12% NHK& Others 80% Stabilizer Bar Y16 = 27% Note : 1. Axle Shaft s market share does not include axle shaft for big truck 2. Hub s market share does not include hub for big truck 20
21 Capacity & Utilization Production line Q2016 1Q2017 2Q2017 Utilization (%) Capacity pcs /month Utilization (%) Capacity pcs /month Utilization (%) Capacity pcs /month Utilization (%) Axle Shaft 68% 300,000 70% 371,000 54% 371,000 52% Spring group - Coil Spring 31% 540,000 30% 540,000 27% 540,000 26% - Stabilizer Bar 48% 160,000 49% 160,000 44% 160,000 40% - Leaf Spring (Tons) 53% 1,100 52% 1,100 57% 1,100 64% Machining (Auto) 51% 520,000 50% 520,000 55% 520,000 48% Machining (non-auto) 74% 244,000 58% 244,000 58% 244,000 63% General Forging 41% 280,000 37% 280,000 40% 280,000 36% Total (SBG) 56% 54% 50% 49% Capacity is calculated based on 500 hours per month (20 hours x 25 days) except Axle Shaft & General Forging: 550 hours per month 21
22 Company Overview Automotive Industry Overview Tractor Industry Overview Sale Performance Financial Highlights Q&A 22

23 Sale & Gross Margin 23

24 QoQ: 2Q17 vs 1Q17 Unit: million Baht QoQ Comparison Sale 7.5% COGS 6.2% GP (amount) 14.4% %GP 1.2% Sale declined 157 MB or 7.5% due to low production volume in Q2. %GP declined 1.2% 0% 8% 6% 4% 2% 0% % COGS Gross Margin Sales %GP 24

25 YoY: 2Q17 vs 2Q16 Unit: million Baht YoY Comparison Sale 1.7 % COGS 2.3 % GP (amount) 1.8% GP (%) 0.5% 0% 8% 6% 4% 2% 0% COGS Gross Margin Sales %GP Sale declined 1.7% while the automotive industry declined 4.3%. %GP increased at 0.5% driven by reduction in production cost. 25

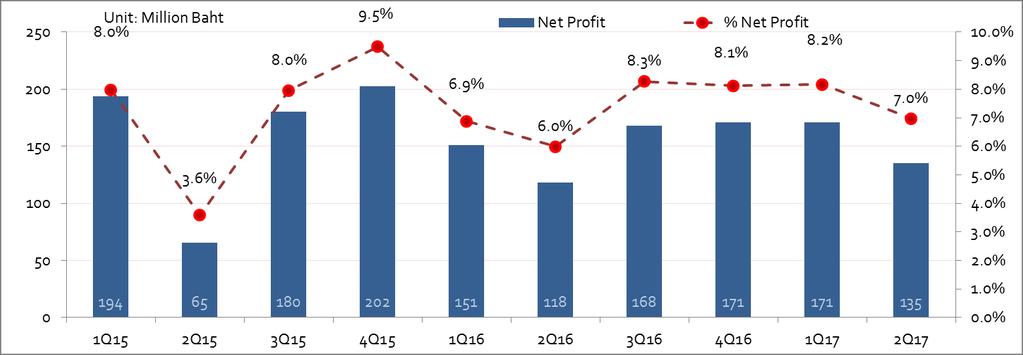
26 Net Profit 26

27 QoQ: 2Q17 vs 1Q17 1 Note: 1 Others include gain/loss on fx, other incomes, and other expenses 27
28 YoY: 2Q17 vs 2Q16 1 Note: 1 Others include gain/loss on fx, other incomes, and other expenses 28

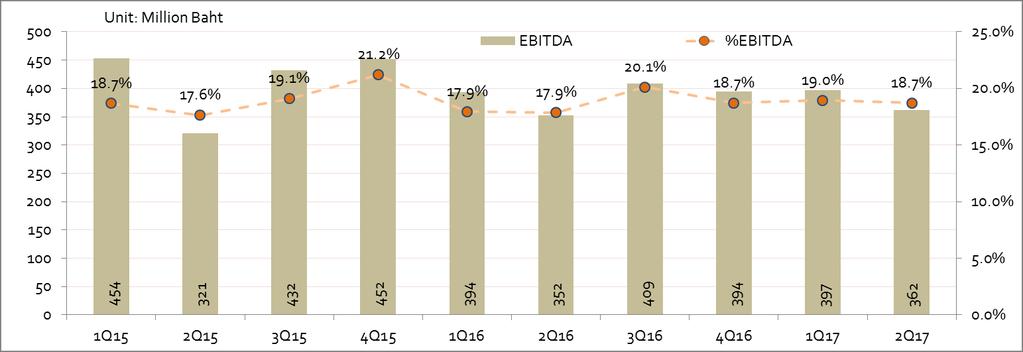
29 EBITDA 29
30 Recent Milestones Signed the joint venture agreement with MUBEA ENGINEERING AG. The JV Company will be established to manufacture and sell automotive parts including suspension springs and other parts. BANGKOK SPRING INDUSTRIAL CO., LTD. (BSK), a subsidiary company of SAT, will transfer its production and distribution business to the new joint venture company Interim dividends of the 6 months operation of the year 2017 (1 January - 30 June 2017) at the rate of 0.25 Baht per share. The payment was made on September 6,


31 Awards Quality Awards Excellence in Zero defect 2016 from MMTH The winner award for MCC-QCC activity 2016 from Kubota Gold Award for the Best Overall Supplier s Performance from Hino Bronze Award for the Best of Supplier s Quality Performance from Hino Award of Regional Contribution From Toyota Recognitions & Awards SET Awards Outstanding Investor Relations Awards Sustainability Awards Best IR Awards from IAA Best Investor Relations Awards from SET SET Awards of Honor with the excellence of outstanding Corporate Governance report for a consecutive period from 2009 to 2014 Best Corporate Social Responsibility Awards
32 Company Overview Automotive Industry Overview Tractor Industry Overview Sale Performance Financial Highlights Q&A 32


33 Q&A THANK YOU 33
34 Financial Highlights Unit : Million Baht 1Q15 2Q15 3Q15 4Q15 1Q16 2Q16 3Q16 4Q16 1Q17 2Q17 QoQ YoY Y2015 Y2016 YoY Sales 2,429 1,820 2,263 2,133 2,194 1,970 2,030 2,105 2,093 1, % -1.7% 8,645 8, % Total Revenue 2,457 1,869 2,288 2,195 2,229 1,993 2,052 2,123 2,109 1, % -1.7% 8,809 8, % Gross Margin % 1.8% 1,261 1, % SG&A % -0.6% % FOREX Gain (Loss) % % % Interest Expense % -31.8% % Net Profit % 14.4% % Net Profit excluding fx % 10.9% % EBITDA % 2.8% 1,659 1, % Cash Flow from Operating % 1.9% 1,552 1, % Depreciation % -3.4% % CAPEX % 4.4% % Effective Tax Rate 6% 13% 5% 5% 7% 6% 8% 8% 9% 10% 0.6% 3.7% 6% 7% 0.9% Total Assets 10,230 9,627 9,786 9,634 9,733 9,348 9,275 9,421 9,439 9, % -1.4% 9,634 9, % Interest Bearing Debt 2,803 2,667 2,479 2,242 2,055 1,874 1,762 1,760 1,574 1, % -26.0% 2,242 1, % Total Liabilities 4,818 4,312 4,379 4,103 4,052 3,722 3,562 3,534 3,382 3, % -14.0% 4,103 3, % Equity 5,412 5,315 5,407 5,531 5,680 5,625 5,712 5,887 6,058 6, % 7.0% 5,531 5, % Key Financial Ratios 1Q15 2Q15 3Q15 4Q15 1Q16 2Q16 3Q16 4Q16 1Q17 2Q17 QoQ YoY Y2015 Y2016 YoY %GP 15.5% 11.8% 15.5% 14.9% 13.9% 14.2% 16.1% 15.5% 15.9% 14.7% -1.2% 0.5% 14.6% 14.9% 0.3% %SG&A 7.3% 9.3% 7.6% 7.7% 8.1% 8.4% 8.1% 7.7% 8.0% 8.5% 0.5% 0.1% 7.9% 8.1% 0.2% %NP 7.9% 3.5% 7.9% 9.2% 6.8% 5.9% 8.2% 8.1% 8.1% 6.9% -1.2% 1.0% 7.3% 7.2% 0.0% %NP excluding fx 7.8% 3.4% 7.9% 9.2% 6.5% 6.0% 8.1% 8.1% 8.0% 6.8% -1.2% 0.8% 7.2% 7.2% 0.0% %EBITDA 18.5% 17.2% 18.9% 20.6% 17.7% 17.7% 19.9% 18.6% 18.8% 18.5% -0.3% 0.8% 18.8% 18.4% -0.4% %ROA 7.6% 2.7% 7.3% 8.3% 6.1% 5.0% 7.1% 7.2% 7.1% 5.8% -1.3% 0.8% 6.7% 6.5% -0.2% EBITDA/CAPEX % -7.8% % %ROE 14.8% 5.1% 13.8% 15.1% 10.9% 8.6% 12.1% 12.0% 11.7% 9.3% -2.4% 0.6% 11.6% 10.3% -1.3% %ROIC 11.0% 4.8% 10.4% 11.4% 8.8% 7.2% 9.8% 9.8% 9.8% 8.1% -1.7% 0.8% 7.9% 7.3% -0.6% Interest bearing Debt/Equity % -10.3% % D/E % -13.0% % EPS (Baht) % 14.4% % BVPS (Baht) % 7.0% % 34
Somboon Advance Technology PCL
 Somboon Advance Technology PCL Opportunity Day: 2014Q4 Mar 17, 2015 1 Company Overview Industry Overview Sale Performance Financial Highlights Q&A 2 Company Overview SAT Paid up 425 million Baht As of
Somboon Advance Technology PCL Growing in Asia automotive, expertise in design and manufacturing with stakeholders and social responsibility
 Somboon Advance Technology PCL Growing in Asia automotive, expertise in design and manufacturing with stakeholders and social responsibility Opportunity Day June 10, 2013 1 AGENDA 2 Million Thailand, world
SAT. To Become an Auto Parts Manufacturing Leader in ASEAN with Excellent lent Quality. March 16, 2010
 SAT To Become an Auto Parts Manufacturing Leader in ASEAN with Excellent lent Quality March 16, 2010 Agenda Industry Overview Group Business Performance Review Future Outlook Appendices 2009 Car Production
Somboon Advance Technology PCL To Become an Auto Parts Manufacturing Leader in ASEAN with Excellent Quality
 Somboon Advance Technology PCL To Become an Auto Parts Manufacturing Leader in ASEAN with Excellent Quality Aug 2012 1 AGENDA 2 Thousands 130 Thailand, world top auto assembler, is poised for impressive
Somboon Advance Technology PCL To Become an Auto Parts Manufacturing Leader in ASEAN with Excellent Quality
 Somboon Advance Technology PCL To Become an Auto Parts Manufacturing Leader in ASEAN with Excellent Quality Aug 2011 AGENDA Industry Overview Group Business Performance Review Future Outlook Appendices
FY2012. H1 Financial Results. November 8, Copyright(C) 2011 Isuzu Motors Limited All rights reserved
 2011 Isuzu Motors Limited All rights reserved") FY2012 H1 Financial Results November 8, 2011 1 Copyright(C) 2011 Isuzu Motors Limited All rights reserved Ⅰ. President and Representative Director : Susumu Hosoi :FY2012 H1 Financial Summary Outline Ⅱ.
FY2012 H1 Financial Results November 8, 2011 1 Copyright(C) 2011 Isuzu Motors Limited All rights reserved Ⅰ. President and Representative Director : Susumu Hosoi :FY2012 H1 Financial Summary Outline Ⅱ.
LOGO. August 16,2010
 LOGO Opportunity Day TIRATHAI PUBLIC COMPANY LIMITED August 16,2010 Contents Company Profile Business Products Electrical Demand Overview Structure of Income & Q2 Operating Results Business Forecast for
Dynasty Ceramic. We are making the impossible, POSSIBLE.
 Dynasty Ceramic We are making the impossible, POSSIBLE. Contents Road to Success Sales Reports Cost of Production Performance Competitor Analysis Going Forward Q & A 2 Dynasty Ceramic Road to Success DCC
Fiscal Year 2015 Financial Results
 Fiscal Year 2015 Financial Results Nissan Motor Co., Ltd May 12, 2016 results FY16 outlook 2 Key performance indicators: financial results (TSE report basis - China JV Equity basis) Net revenue Operating
PTG ENERGY PUBLIC COMPANY LIMITED. Opportunity Day. 2Q/2017 Performance Results
 PTG ENERGY PUBLIC COMPANY LIMITED Opportunity Day 2Q/2017 Performance Results PTG Businesses Retailing and Wholesaling Fuel Products Non-Fuel Products Logistics Business (Fuel logistics and Depot) Renewable
FY2018 Financial Results
 FY2018 Financial Results May 14, 2018 ISUZU MOTORS LIMITED 1 Copyright(C) 2018 Isuzu Motors Limited All rights reserved Contents Ⅰ. President and Representative Director : Masanori Katayama FY2018 and
FISCAL YEAR MARCH 2018 FIRST HALF FINANCIAL RESULTS
 FISCAL YEAR MARCH 2018 FIRST HALF FINANCIAL RESULTS PRESENTATION OUTLINE Highlights Fiscal Year March 2018 First Half Results Fiscal Year March 2018 Full Year Forecast Progress of Key Initiatives/ Business
FY17 RESULTS BUSINESS UPDATES FY18 OUTLOOK. Nissan Motor Co., Ltd. May 14 th, 2018
 Nissan Motor Co., Ltd. May 14 th, 2018 RESULTS BUSINESS UPDATES FY18 OUTLOOK www.nissan-global.com Copyright NISSAN MOTOR CO., LTD. All rights reserved. 2 GLOBAL 91.81 5.08 TIV * 1 vs. 93.52 GLOBAL +1.9%
July 27, Copyright(C) 2006 Isuzu Motors Ltd. All rights reserved. FORWARD-New Long Term Emission version. ELF-CNG version
 2006 Isuzu Motors Ltd. All rights reserved. FORWARD-New Long Term Emission version. ELF-CNG version") ELF-CNG version FORWARD-New Long Term Emission version 2.5L/3.0L Super Clean & Economy Diesel Isuzu D-MAX GIGA-New Long Term Emission version July 27, 2006 1 Copyright(C) 2006 Isuzu Motors Ltd. All rights
ELF-CNG version FORWARD-New Long Term Emission version 2.5L/3.0L Super Clean & Economy Diesel Isuzu D-MAX GIGA-New Long Term Emission version July 27, 2006 1 Copyright(C) 2006 Isuzu Motors Ltd. All rights
FY2019 H1 Financial Results. November 2, 2018 ISUZU MOTORS LIMITED. 1 Copyright(C) 2018 Isuzu Motors Limited All rights reserved
 2018 Isuzu Motors Limited All rights reserved") FY2019 H1 Financial Results November 2, 2018 ISUZU MOTORS LIMITED 1 Copyright(C) 2018 Isuzu Motors Limited All rights reserved Contents Ⅰ. President and Representative Director : Masanori Katayama :FY2019
FY2019 H1 Financial Results November 2, 2018 ISUZU MOTORS LIMITED 1 Copyright(C) 2018 Isuzu Motors Limited All rights reserved Contents Ⅰ. President and Representative Director : Masanori Katayama :FY2019
FISCAL YEAR MARCH 2018 THIRD QUARTER FINANCIAL RESULTS
 FISCAL YEAR MARCH 2018 THIRD QUARTER FINANCIAL RESULTS PRESENTATION OUTLINE Highlights Fiscal Year March 2018 Nine Month Results Fiscal Year March 2018 Full Year Forecast Progress of Key Initiatives 1
FISCAL YEAR MARCH 2015 FIRST HALF FINANCIAL RESULTS. New Mazda Demio
 FISCAL YEAR MARCH 2015 FIRST HALF FINANCIAL RESULTS New Mazda Demio Mazda Motor Corporation October 31, 2014 1 PRESENTATION OUTLINE Highlights Fiscal Year March 2015 First Half Results Fiscal Year March
FY H1 Financial Results
 FY2011 1 H1 Financial Results November 8, 2010 1 Copyright(C) 2010 Isuzu Motors Limited All rights reserved Contents Ⅰ. President and Representative Director : Susumu Hosoi :FY2011 H1 Financial Summary
1Q17 Highlights. +22%YoY. Officially Launched. PT Maxnitron. Sales Volume 821 Liters 6.1 1,436. Million Members. Stations
 1Q17 Highlights +22%YoY Sales Volume 821 Liters 6.1 Million Members Officially Launched PT Maxnitron 1,436 Stations Agenda Industry Outlook Business Performance Project Update Financial Performance Thailand
Operating Results Q Asian Insulators Public Company Limited
 Operating Results Q2-2010 Asian Insulators Public Company Limited 254 Seri Thai Road, Kannayaow, Bangkok 10230 Thailand http://www.asianinsulators.com Tel. (66) 0-2517-1451 Fax. (66) 0-2517-1465 E-mail
FY2016 H1 Financial Results
 FY2016 H1 Financial Results November 6, 2015 1 Copyright(C) 2015 Isuzu Motors Limited All rights reserved Contents Ⅰ. President and Representative Director : Masanori Katayama :FY2016 H1 Financial Summary
TOFAŞ Q ANALYST PRESENTATION
 TOFAŞ Q1 2016 ANALYST PRESENTATION 03.05.2016 1 2016 Q1 AGENDA Highlights Turkish Automotive Industry Production & Capacity Utilization Domestic Market Developments Tofaş Domestic Market Performance Export
FY2018 H1 Financial Results
 FY2018 H1 Financial Results November 6,2017 1 Copyright(C) 2017 Isuzu Motors Limited All rights reserved Contents Ⅰ. President and Representative Director : Masanori Katayama :FY2018 H1 Financial Summary
Analysis of Operating Results and Financial Status
 Analysis of Operating Results and Financial Status 1. Analysis of Operating Results of EGAT and its Subsidiaries Operating results of EGAT and its subsidiaries including associated company and jointly
Institutional Presentation August 2011
 Institutional Presentation August 2011 Disclaimer This presentation may include forwardlooking statements representing expectations about future events or anticipated result based on factors such as economic
FY17 RESULTS BUSINESS UPDATES FY18 OUTLOOK. Nissan Motor Co., Ltd. May 14 th, 2018
 Nissan Motor Co., Ltd. May 14 th, 2018 RESULTS BUSINESS UPDATES FY18 OUTLOOK www.nissan-global.com Copyright NISSAN MOTOR CO., LTD. All rights reserved. 2 GLOBAL 91.81 5.08 TIV * 1 vs. 93.52 GLOBAL +1.9%
FISCAL YEAR MARCH 2015 THIRD QUARTER FINANCIAL RESULTS. Updated Mazda CX-5 (Japanese specification model)
") FISCAL YEAR MARCH 2015 THIRD QUARTER FINANCIAL RESULTS Updated Mazda CX-5 (Japanese specification model) Mazda Motor Corporation February 4, 2015 1 PRESENTATION OUTLINE Highlights Fiscal Year March 2015
FISCAL YEAR MARCH 2015 THIRD QUARTER FINANCIAL RESULTS Updated Mazda CX-5 (Japanese specification model) Mazda Motor Corporation February 4, 2015 1 PRESENTATION OUTLINE Highlights Fiscal Year March 2015
ANALYST BRIEFING FOR THE FOURTH QUARTER ENDED FEBRUARY 2017
 ANALYST BRIEFING FOR THE FOURTH QUARTER ENDED 2016 22 FEBRUARY 2017 MSM Malaysia Holdings Berhad Analyst Briefing Q4 2016 22/2/2017 1 CONTENTS 01 02 03 04 05 Group Financial Highlights Performance Review
BlueScope Steel Limited Consolidated Financial Headlines
 BlueScope Steel Limited Consolidated Financial Headlines 2003 2004 2005 2006 2007 2008 2009 2010 2011 2012 2013 2013 2013 2014 2014 2014 2015 2015 2015 2016 2016 2016 2017 2017 2017 2018 2018 2018 Total
1 Copyright(C) 2014 Isuzu Motors Limited All rights reserved
 2014 Isuzu Motors Limited All rights reserved") FY2014 Financial Results May 12, 2014 1 Copyright(C) 2014 Isuzu Motors Limited All rights reserved Contents Ⅰ. President and Representative Director : Susumu Hosoi FY2014 and FY2015 Outlook Overview Ⅱ.
FY2014 Financial Results May 12, 2014 1 Copyright(C) 2014 Isuzu Motors Limited All rights reserved Contents Ⅰ. President and Representative Director : Susumu Hosoi FY2014 and FY2015 Outlook Overview Ⅱ.
FY2012 third-quarter financial results
 FY2012 third-quarter financial results Nissan Motor Co., LTD. February 8, 2013 Key performance indicators: financial results (billion yen) Net revenue 6,698.4 6,755.2 Operating profit 427.8 Net income
Nissan Motor Co., Ltd. February 12 th, 2019
 Nissan Motor Co., Ltd. February 12 th, 2019 NET REVENUE 2,875.5 3,045.7 OPERATING PROFIT *1 NET INCOME 301.6 FREE CASH FLOW (AUTO) NET CASH (AUTO) 1,311.4 1,334.4 US TAX REFORM 207.7 82.4 103.3 93.9 *2
ANALYST BRIEFING FOR THE THIRD QUARTER ENDED NOV 2016
 ANALYST BRIEFING FOR THE THIRD QUARTER ENDED 2016 21 NOV 2016 MSM Malaysia Holdings Berhad Analyst Briefing Q3 2016 21/11/2016 1 CONTENTS 01 02 03 04 05 Group Financial Highlights Performance Review Sugar
Analysis of Operating Results and Financial Status
 29 Analysis of Operating Results and Financial Status 1. Analysis of Operating Results of EGAT and Its Subsidiaries Operating results of EGAT and its subsidiaries including associated company and joint
Super Convenience Store
 Super Convenience Store Samutprakarn Province Auto SNC Cooling Supply Co., Ltd 8, sqm, 1 factory Air Cond Immortal Parts Co., Ltd 17, sqm, 3 factories Plastic SNC Former PLC. (Branch 2) 18, sqm, 4 factories
FISCAL YEAR MARCH 2018 FIRST QUARTER FINANCIAL RESULTS
 FISCAL YEAR MARCH 2018 FIRST QUARTER FINANCIAL RESULTS PRESENTATION OUTLINE Highlights Fiscal Year March 2018 First Quarter Results Fiscal Year March 2018 Full Year Forecast Structural Reform Stage 2 Progress
2Q06 Results. Investor Relations
 2Q06 Results Investor Relations Content 1. 2Q06 Key Results 2. Summarized Income Statement 3. Balance Sheet as of Jun. 2006 4. Outlook for 2006 5. Result & Outlook By Division Appendix : 2Q06 Results Breakdown
FISCAL YEAR MARCH 2015 FIRST QUARTER FINANCIAL RESULTS. Mazda Roadster 25 th Anniversary Model
 FISCAL YEAR MARCH 2015 FIRST QUARTER FINANCIAL RESULTS Mazda Roadster 25 th Anniversary Model Mazda Motor Corporation July 31, 2014 1 PRESENTATION OUTLINE Highlights Fiscal Year March 2015 First Quarter
282m 75% +575m. Net sales Operating income before non-recurring items. Operating margin before non-recurring items. Net Loss.
 First-Half 2009 Financial Highlights Net sales Operating income before non-recurring items Operating margin before non-recurring items Net Loss Net debt-to-equity ratio Free cash flow** 7,134m 282m 4.0%
FY2/18 (March 2017~February 2018)
") FY2/18 (March 2017~February 2018) Fact Book 1. Trends in the current fiscal year and previous fiscal year 3. Business overview (1) Performance overview P. 1 (1) No. of students at the end of month P. 6
FY2/18 (March 2017~February 2018) Fact Book 1. Trends in the current fiscal year and previous fiscal year 3. Business overview (1) Performance overview P. 1 (1) No. of students at the end of month P. 6
Earnings conference call. Q4 and Full year 2015
 Earnings conference call Q4 and Full year 2015 Bo Annvik, CEO / Åke Bengtsson, CFO 11 February 2016 1 Agenda Business Highlights Market Update Sales Financials Outlook 2 2015 in numbers Operating margin
INCREASING SALES FOR MINING RELATED BUSINESS
 Investor Relations of PT UNITED TRACTORS Tbk INCREASING SALES FOR MINING RELATED BUSINESS In the first half 2001, the Company managed to record increase in net revenue from IDR 2.32 trillion to IDR 3.54
P T G E N E R G Y P C L F I S C A L Y E A R 2017 R E S U L T S O P P O R T U N I T Y D A Y - M a r 8 th, 2018
 P T G E N E R G Y P C L F I S C A L Y E A R 2017 R E S U L T S O P P O R T U N I T Y D A Y - M a r 8 th, 2018 1 A G E N D A 2 0 1 8 O U T L O O K 2 0 1 7 O V E R V I E W 2 0 1 7 F I N A N C I A L PERFORMANCE
FY16 results. Business updates. FY17 outlook. Nissan Motor Co., Ltd. May 11 th, 2017
 Nissan Motor Co., Ltd. May 11 th, 2017 results Business updates FY17 outlook www.nissan-global.com Copyright NISSAN MOTOR CO., LTD. All rights reserved. 2 (TSE REPORT BASIS CHINA JV EQUITY BASIS) 12,189.5
Operating Results of Q Asian Insulators Public Company Limited
 Operating Results of Q2-2012 Asian Insulators Public Company Limited 254 Seri Thai Road, Kannayaow, Bangkok 10230 Thailand http://www.asianinsulators.com Tel. (66) 0-2517-1451 Fax. (66) 0-2517-1465 E-mail
TIRATHAI PUBLIC COMPANY LIMITED
 TIRATHAI PUBLIC COMPANY LIMITED OPPORTUNITY 25 AUGUST 2015 Content 1 Company Profile 2 Vision and Mission 3 Business Plan & Investment 4 Operating Result for 2 nd Quarter of 2015 5 Forecast for 2015 6
2007 3Q Investor Meeting. November 2007
 2007 3Q Investor Meeting November 2007 Company Overview Cumulative 3Q 2007 Results Result By Division Appendix Company Overview Overview Doosan Infracore is the largest machinery company in Korea and also
FY2017 Results. February 26, 2018
 FY2017 Results February 26, 2018 Our background & development Registered capital increased to 12 MB Started International marine transportation ( Myanmar route ) Registered capital increased to 100 MB
FY2/17 3Q(March 2016~November2016)
") FY2/17 (March 2016~November2016) Fact Book 1. Trends in the current fiscal year and previous fiscal year 3. Business overview (1) Performance overview P. 1 (1) No. of students at the end of month P. 7
FY2/17 (March 2016~November2016) Fact Book 1. Trends in the current fiscal year and previous fiscal year 3. Business overview (1) Performance overview P. 1 (1) No. of students at the end of month P. 7
1 Copyright(C) 2012 Isuzu Motors Limited All rights reserved
 2012 Isuzu Motors Limited All rights reserved") FY2012 Financial Results May 10, 2012 1 Copyright(C) 2012 Isuzu Motors Limited All rights reserved Contents Ⅰ. President and Representative Director : Susumu Hosoi FY2012 Overview Ⅱ. Director Director
FY2012 Financial Results May 10, 2012 1 Copyright(C) 2012 Isuzu Motors Limited All rights reserved Contents Ⅰ. President and Representative Director : Susumu Hosoi FY2012 Overview Ⅱ. Director Director
Healthier Net Profit under Stronger IDR
 Investor Bulletin, First Half 2002 Healthier Net Profit under Stronger IDR As of June 2002, the consolidated revenue in USD increased by 32% y.o.y. Due to IDR strengthening against USD, in IDR revenue
1 Copyright(C) 2012 Isuzu Motors Limited All rights reserved
 2012 Isuzu Motors Limited All rights reserved") FY2013 H1 Financial Results November 7, 2012 1 Copyright(C) 2012 Isuzu Motors Limited All rights reserved Contents Ⅰ. President and Representative Director : Susumu Hosoi :FY2013 H1 Financial Summary Outline
FY2013 H1 Financial Results November 7, 2012 1 Copyright(C) 2012 Isuzu Motors Limited All rights reserved Contents Ⅰ. President and Representative Director : Susumu Hosoi :FY2013 H1 Financial Summary Outline
FISCAL YEAR END MARCH 2012 FINANCIAL RESULTS. Mazda TAKERI
 FISCAL YEAR END MARCH 212 FINANCIAL RESULTS Mazda TAKERI Mazda Motor Corporation April 27, 212 1 PRESENTATION OUTLINE Highlights FY End March 212 Results FY End March 213 Forecast Summary Progress Toward
Volvo Group THIRD QUARTER 2016 MARTIN LUNDSTEDT PRESIDENT AND CEO. Volvo Group Headquarters Third quarter
 Volvo Group THIRD QUARTER 2016 MARTIN LUNDSTEDT PRESIDENT AND CEO 1 VOLVO GROUP Third quarter highlights NET SALES SEK bn 12 months 299 bn 73.3 68.8 ADJUSTED OPERATING MARGIN* 12 months 6.7% % 6.9% 7.0%
Analyst Presentation 1Q 2008 Results
 Analyst Presentation 1Q 2008 Results 0 Contents Section 1: Section 2: Section 3: Section 4: Section 5: Company Overview IPO Update Operating Performance Consolidated Financial Performance Dividend Update
FISCAL YEAR ENDED MARCH 2011 FINANCIAL RESULTS
 FISCAL YEAR ENDED MARCH 211 FINANCIAL RESULTS Mazda Motor Corporation April 28, 211 Mazda MINAGI 1 PRESENTATION OUTLINE Highlights Fiscal Year Ended March 211 Results In Summary Question & Answer Session
FY 2010 first-half financial results
 FY 2010 first-half financial results November 4, 2010 Nissan Motor Co., Ltd. first-half financial results Key performance indicators: Financial results (billion yen) Net revenue Operating profit Net income
THREE MONTHS REPORT, JAN MARCH 2016
 THREE MONTHS REPORT, JAN MARCH 2016 TELEPHONE CONFERENCE 26 APRIL, 2016, AT 14:30 CET TOMMY ANDERSSON, PRESIDENT AND CEO HELENA WENNERSTRÖM, EVP AND CFO TO PARTICIPATE, PLEASE CALL 5 MINUTES BEFORE THE
Kongsberg Automotive ASA. Fourth quarter February 28, 2019
 Kongsberg Automotive ASA Fourth quarter - February 28, 2019 Highlights Q4 Sales Revenues grew by 21 (7.3%) YoY to 288 including negative FX effects of 1. We booked new business with 77 in expected annual
FY2/18 2Q(March 2017~August 2018)
") FY2/18 2Q(March 2017~August 2018) Fact Book 1. Trends in the current fiscal year and previous fiscal year 3. Business overview (1) Performance overview P.1 (1) No. of students at the end of month P.7 (2)
FY2/18 2Q(March 2017~August 2018) Fact Book 1. Trends in the current fiscal year and previous fiscal year 3. Business overview (1) Performance overview P.1 (1) No. of students at the end of month P.7 (2)
FISCAL YEAR END MARCH 2013 FIRST QUARTER FINANCIAL RESULTS
 FISCAL YEAR END MARCH 213 FIRST QUARTER FINANCIAL RESULTS New MAZDA CX-5 Mazda Motor Corporation July 31, 212 1 PRESENTATION OUTLINE Highlights Fiscal Year End March 213 Results Update of Structural Reform
Months Investor Presentation
 2018 9 Months Investor Presentation 25.10.2018 Disclaimer Ereğli Demir Çelik Fabrikaları T.A.Ş. (Erdemir) may, when necessary, make written or verbal announcements about forward-looking information, expectations,
FY2008 3Q Financial Results Apr. Dec. 07 / Oct. Dec. 07. FY2008 3Q Financial Results
 FY2008 3Q Financial Results FY2008 3Q Financial Results Apr. Dec. 07 / Oct. Dec. 07 February 7, 2008 1 Copyright(C) 2008 Isuzu Motors Limited All rights reserved 1. FY2008 3Q Highlight Director: MASANORI
1. Trends in the current fiscal year and previous fiscal year 3. Business overview 2. Secular trends in first quarter financial results
 FY2/19 (March 2018~May 2018) Fact Book 1. Trends in the current fiscal year and previous fiscal year 3. Business overview (1) Performance overview P. 1 (1) No. of students at the end of month P. 6 (2)
Transform & Insist Move to our future. Investor Conference
 Investor Conference Outline Company Introduction Main shareholders Company Introduction RECHI was established in Dec 19, 1989 Human Resources: 6171 members (Until Dec 31, 2017) 2017 revenue NT$ 19,827
2010 1Q Investor Meeting. May 2010
 2010 1Q Investor Meeting May 2010 This presentation contains preliminary figures which may be materially different from the final figures. While the statements in this presentation represent our current
Earnings conference call Q3 2016
 Earnings conference call Q3 2016 Bo Annvik, CEO / Åke Bengtsson, CFO October 25, 2016 1 Agenda Business Highlights Market Update Sales Financials Outlook Public offer 2 Business Highlights Q3 2016 Solid
This presentation may contain statements that are forward looking. These statements are based on current expectations and assumptions that are
 This presentation may contain statements that are forward looking. These statements are based on current expectations and assumptions that are subject to risks and uncertainties, which may cause actual
H Business Result
 H1 2017 Business Result H1 2017 business result is prepared for investors consideration only before completion of independent auditors review. Therefore, parts of contents on this material could be changeable
FISCAL YEAR MARCH 2014 FINANCIAL RESULTS
 FISCAL YEAR MARCH 214 FINANCIAL RESULTS Mazda CX-5 Mazda Atenza Mazda Motor Corporation April 25, 214 New Mazda Axela 1 PRESENTATION OUTLINE Highlights Fiscal Year March 214 Results Fiscal Year March 215
SOLLERS IFRS RESULTS 1H2017
 SOLLERS IFRS RESULTS 1H2017 28.08.2017 2 1. 1H2017 SOLLERS STRATEGIC DEVELOPMENTS 2. RUSSIAN AUTOMOTIVE MARKET OVERVIEW 3. SOLLERS OPERATING AND FINANCIAL PERFORMANCE IN 1H2017 4. SOLLERS JOINT VENTURES
Q Financial Results
 Q3 2018 Financial Results 1 Forward-looking statement The statements on the future in this presentation, including expected sales and earnings, are associated with risks and uncertainties and may be affected
RESILIENCE MBM RESOURCES BERHAD ( V) Analyst Briefing 24 August 2017
 Analyst Briefing 24 August 2017") RESILIENCE MBM RESOURCES BERHAD (284496-V) Analyst Briefing 24 August 217 1 1 DISCLAIMER The information and opinions contained in this presentation are provided as at the date of the document. Certain
RESILIENCE MBM RESOURCES BERHAD (284496-V) Analyst Briefing 24 August 217 1 1 DISCLAIMER The information and opinions contained in this presentation are provided as at the date of the document. Certain
Stronger Fundamental and Excellent Growth
 Investor Bulletin, First Half 2004 Stronger Fundamental and Excellent Growth For the first six months of 2004, PT United Tractors Tbk (UT/Company) recorded consolidated net revenue of IDR 4.29 trillion,
FISCAL YEAR END MARCH 2013 FIRST HALF FINANCIAL RESULTS. New Mazda6 (Atenza)
") FISCAL YEAR END MARCH 2013 FIRST HALF FINANCIAL RESULTS New Mazda6 (Atenza) Mazda Motor Corporation October 31, 2012 1 PRESENTATION OUTLINE Highlights Fiscal Year March 2013 First Half Results Fiscal Year
FISCAL YEAR END MARCH 2013 FIRST HALF FINANCIAL RESULTS New Mazda6 (Atenza) Mazda Motor Corporation October 31, 2012 1 PRESENTATION OUTLINE Highlights Fiscal Year March 2013 First Half Results Fiscal Year
Jaguar Land Rover Results For the quarter ended 30 June August 2015
 Jaguar Land Rover Results For the quarter ended 30 June 2015 7 August 2015 1 Disclaimer Statements in this presentation describing the objectives, projections, estimates and expectations of Jaguar Land
As a note, this presentation was released as the dates shown and reflected management views as of these dates. All information in this presentation
 February 2004 1 As a note, this presentation was released as the dates shown and reflected management views as of these dates. All information in this presentation regarding the Company s financial results
FY16 results. Business updates. FY17 outlook. Nissan Motor Co., Ltd. May 11 th, 2017
 Nissan Motor Co., Ltd. May 11 th, 2017 results Business updates FY17 outlook www.nissan-global.com Copyright NISSAN MOTOR CO., LTD. All rights reserved. 2 (TSE REPORT BASIS CHINA JV EQUITY BASIS) NET REVENUE
TIRATHAI PUBLIC COMPANY LIMITED
 TIRATHAI PUBLIC COMPANY LIMITED OPPORTUNITY DAY ON 26 FEBRUARY 2015 Content 1 Company Profile 2 Vision and Mission 3 Operating Result for the year 2014 4 Business Plan & Investment 5 Forecast for 2015
TOFAŞ RESULTS WEBCAST PRESENTATION
 TOFAŞ 31.12.2016 RESULTS WEBCAST PRESENTATION 02.02.2017 1 WEBCAST AGENDA Highlights Turkish Automotive Industry Production Domestic Market Developments Tofaş Domestic Market Performance Export Markets
Management Discussion and Analysis
 Management Discussion and Analysis For the Annual Operating Results Ended December 31, 2008 Note: This Management Discussion and Analysis (MD&A) was made to disclose information and the vision of the management
Investor presentation May The Origin of HighTech.
 Investor presentation May 2014 The Origin of HighTech. Agenda DEUTZ strategy & positioning Financials Outlook 2 DEUTZ at a glance 150 years DEUTZ a tradition of achievement Independent manufacturer of
Operations Financial Recent Update. The largest privately owned tap water producer in Thailand
 Thai Tap Water Supply Public Company Limited 1Q1010 Performance 10 May 2010 1Q10 Performance Operations Financial Recent Update 2 Sales Volume (daily average) PTW 1Q10 increase 2.9% QoQ, 5.4% YoY TTW 1Q10
Roadshow Presentation
 Roadshow Presentation June 2, Wilfried Trepels, CFO 1 SAF-HOLLAND - Components Fifth Wheels Kingpins Suspensions Landing Gear Axle Systems 2 SAF-HOLLAND - Business Units Trailer Systems Powered Vehicle
FOURTH QUARTER 2017 Martin Lundstedt, President and CEO
 FOURTH QUARTER 2017 Martin Lundstedt, President and CEO Volvo Group FOURTH QUARTER HIGHLIGHTS Net sales +11% (+16% excl. currency) Continued improved profitability for the Group - Trucks adjusted operating
FISCAL YEAR ENDING MARCH 2012 FIRST HALF FINANCIAL RESULTS
 FISCAL YEAR ENDING MARCH 2012 FIRST HALF FINANCIAL RESULTS Mazda Motor Corporation November 2, 2011 New Mazda CX-5 (European specifications) 1 PRESENTATION OUTLINE Highlights Fiscal Year Ending March 2012
Lazydays Holdings, Inc. Reports Third Quarter 2018 Financial Results
 News Contact: +1 (813) 204-4099 investors@lazydays.com Lazydays Holdings, Inc. Reports Third Quarter 2018 Financial Results Tampa, FL (November 8, 2018) Lazydays Holdings, Inc. ( Lazydays ) (NasdaqCM:
Financial Summary for 2Q-FY2017 And Projections for FY2017
 Financial Summary for 2Q-FY2017 And Projections for FY2017 1 INDEX 01 Financial Summary for 2Q-FY2017 02 Performance Forecast for FY2017 03 Topics 2 01 Financial Summary for 2Q-FY2017 3 01 Financial Summary
DEUTZ Investor Presentation August 2016
 DEUTZ Investor Presentation August 2016 Agenda DEUTZ strategy & positioning Financials Outlook 2 DEUTZ at a glance World s first engine factory founded in 1864 by N.A. Otto, the developer of the four the
Earnings conference call
 Earnings conference call Full year 2017 Åke Bengtsson, President & CEO Andreas Ekberg, Acting CFO February 14, 2018 1 Agenda Business Summary Market Update Sales Financials Way forward 2 Business Summary
SOLLERS COMPANY OVERVIEW
 SOLLERS COMPANY OVERVIEW 1. CORPORATE STRUCTURE GROUP PRODUCTION FACILITIES 2. FY2015 MARKET OVERVIEW FY2015 OPERATING RESULTS 3. 2M2016 OPERATING RESULTS SHAREHOLDER EQUITY AND STOCK INFORMATION 2 CORPORATE
Earnings conference call Q4 & FY 2016
 Earnings conference call Q4 & FY 2016 Bo Annvik, CEO / Åke Bengtsson, CFO February 10, 2016 1 Agenda Business Highlights Market Update Sales Financials Way forward 2 Business Summary FY 2016 A year with
3 rd Quarter 2017 Results
 Inside your life! 3 rd Quarter 2017 Results October 25, 2017 Mobile Automotive Display Semiconductor IoT LED Contents Ⅰ. Q3 2017 Earnings Summary Ⅱ. Earnings Highlight & Outlook Ⅲ. Results & Outlook by
2015 Interim Results. Levallois, July 23 th, 2015
 2015 Interim Results Levallois, July 23 th, 2015 CONTENTS H1 2015 Highlights 2015 Interim Results Outlook H1 2015 Highlights DATE Improvement in all metrics 4 H1 2015 Key metrics Economic Sales * : 2,945
On track. Investor and Analyst Presentation On the Occasion of the Release of the Preliminary Figures for FY 2011 Hanover, 19 January 2012
 On track. Investor and Analyst Presentation On the Occasion of the Release of the Preliminary Figures for FY 2011 Agenda Delticom at a Glance Business Model Profit & Loss Balance Sheet Outlook 2 Agenda
Lazydays Holdings, Inc. Reports Second Quarter 2018 Financial Results
 News Contact: +1 (813) 204-4099 investors@lazydays.com Lazydays Holdings, Inc. Reports Second Quarter 2018 Financial Results Tampa, FL (August 9, 2018) Lazydays Holdings, Inc. ( Lazydays )(NasdaqCM: LAZY)
Ratchaburi Electricity Generating Holding PCL. Management Discussion and Analysis For the Year Ended December 31, 2012
 Ratchaburi Electricity Generating Holding PCL Management Discussion and Analysis (Translation) Ratchaburi Electricity Generating Holding Public Co., Ltd. Management Discussion and Analysis 1. Significant
FY2004 FINANCIAL RESULTS
 FY2004 FINANCIAL RESULTS Forward Ultra -Low PM, 4-Star ISUZU MOTORS LIMITED May 20, 2004 1 Copyright(C) 2004 Isuzu Motors Ltd. All rights reserved President & Representative Director Yoshinori Ida 2 Copyright(C)
third QUARTER 2012 October 26, 2012
 third QUARTER 212 October 26, 212 Helena norrman Senior Vice President Communications third QUARTER 212 October 26, 212 This presentation contains forward-looking statements. Such statements are based
FY 2008 Second Quarter Results Briefing November 2008
 FY 2008 Second Quarter Results Briefing November 2008 The forecast data presented herein reflects assumed results based on conditions that are subject to change. Nabtesco Corporation does not make representations