MODELING FRESH WATER CONSUMPTION ASSOCIATED WITH PRIMARY ENERGY PRODUCTION IN THE USA
|
|
|
- Donna Banks
- 6 years ago
- Views:
Transcription
1 MODELING FRESH WATER CONSUMPTION ASSOCIATED WITH PRIMARY ENERGY PRODUCTION IN THE USA James J Dooley The Combined GCAM Community Modeling Meeting and GTSP Technical Workshop for 2013 October 2, 2013 The author gratefully acknowledges the Platform for Regional Integrated Modeling and Analysis (PRIMA) for funding this work 1
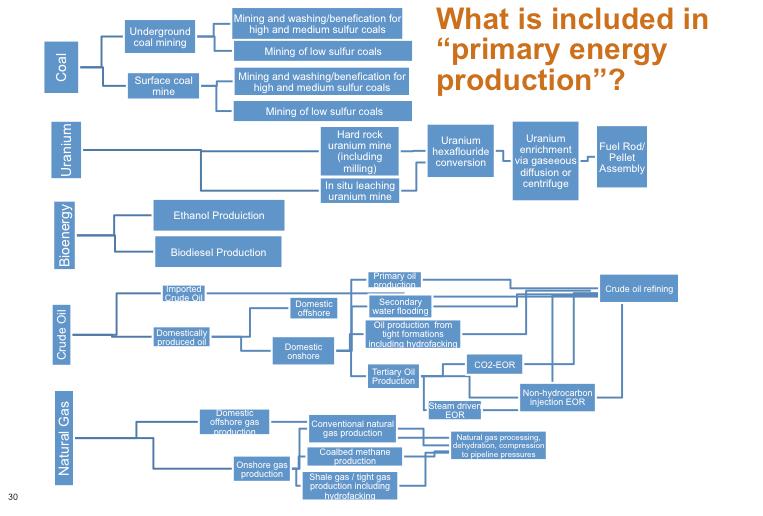
2 Coal Underground coal mining Surface coal mine Mining and washing/benefication for high and medium sulfur coals Mining of low sulfur coals Mining and washing/benefication for high and medium sulfur coals What is included in primary energy production? Mining of low sulfur coals Uranium Hard rock uranium mine (including milling) In situ leaching uranium mine Uranium hexaflouride conversion Uranium enrichment via gaseeous diffusion or centrifuge Fuel Rod/ Pellet Assembly Bioenergy Ethanol Produiction Biodiesel Production 2 Natural Gas Crude Oil Imported Crude Oil Domestically produced oil Domestic offshore gas production Onshore gas production Domestic offshore Domestic onshore Primary oil production Secondary water flooding Oil production from tight formations including hydrofacking Tertiary Oil Production Conventional natural gas production Coalbed methane production Shale gas / tight gas production including hydrofacking Steam driven EOR CO2-EOR Natural gas processing, dehydration, compression to pipeline pressures Non-hydrocarbon injection EOR Crude oil refining
3 Four Cases from AEO2013 Were Used To Explore Changes in Primary Energy Production Cases in US Reference Case Low Energy Imports US dependence on imported oil is 37% by 2040 (down from 60% in 2005). Real GDP grows at an average annual rate of 2.5 percent from 2011 to Crude oil prices rise to about $163 per barrel (2011 dollars) in US follows Low Uranium Production Scenario. US becomes net energy exporter in mid 2030s. US energy production from shale gas, tight gas, and tight oil wells expands rapidly. Also transportation fuel efficiency rises rapidly depressing domestic demand for liquid fuels and VMT growth is modest (0.2%/year). US energy related GHG emissions are 4% below Reference Case by US follows High Uranium Production Scenario. High Energy Imports Ctax$25 US dependence on imported oil is 44% by Estimated ultimate recovery (EUR) per shale gas, tight gas, and tight oil well is 50 percent lower than in the Reference case. Improvements in vehicle fuel efficiency are slower to materialized and vehicle miles traveled is higher than in other cases. US energy related GHG emissions are 1% higher Reference Case by US follows Low Uranium Production Scenario. Applies a price for CO 2 emissions throughout the economy, starting at $25/tCO 2 in 2014 and rising by 5 percent per year through 2040 (reaching about $90/tCO 2 in 2040). US energy related GHG emissions are 31% below Reference Case by US follows High Uranium Production Scenario. 3
4 Fresh Water Consumption (km 3 /year) US Primary Energy Production Total Fresh Water Consumption (km 3 ) Reference Ctax25 High Import Low Imports 4
 6 5 4 3 2 1 Oil Refining Crude Oil Production Natural Gas Biofuel Refining Coal")
5 Reference Case Fresh Water Consumption by Fuel (km 3 /year) 7 Fresh Water Consumption Associated with US Primary Energy Production Reference Case (km 3 /year) Oil Refining Crude Oil Production Natural Gas Biofuel Refining Coal Uranium 0 5
6 Estimating Fresh Water Consumption for US Uranium Production Uranium Hard rock uranium mine (including milling) In situ leaching uranium mine Uranium hexaflouride conversion Uranium enrichment via gaseeous diffusion or centrifuge Fuel Rod/ Pellet Assembly 6


7 Two Scenarios of US Domestic Uranium Production (t U 3 O 8 ) % 90% 80% 70% 60% 50% 40% 30% 20% 10% 0% US Dependence on Imported Uranium USA Domestic Uranium Production 7
8 Low Domestic Uranium Production Case Fresh Water Consumption by Technology/ Process Fresh Water Consumption by State High Domestic Uranium Production Case 8
9 Estimating Fresh Water Consumption for US Coal Production Coal Underground coal mining Surface coal mine Mining and washing/benefication for high and medium sulfur coals Mining of low sulfur coals Mining and washing/benefication for high and medium sulfur coals Mining of low sulfur coals 9

 Western Montana Low Sulfur (Sub-Bituminous) Wyoming Low Sulfur (Sub-Bituminous) Rocky Mountain Low Sulfur (Bituminous) Rocky Mountain")
 Gulf of Mexici Medium Sulfur (Lignite) Dakota Medium Sulfur (Lignite) Western Montana Medium Sulfur (Sub-Bituminous) Wyoming")
10 Coal Production by Region (EJ) Reference Case Coal Production (EJ) Fresh Water Consumption for Coal km^3 Reference Case Water for Coal Production Appalachia High Sulfur (Bituminous) Applachia Low Sulfur (Bituminous) Eastern Interior High Sulfur (Bituminous) Western Interior High Sulfur (Bituminous) Gulf of Mexico High Sulfur (Lignite) Western Montana Low Sulfur (Sub-Bituminous) Wyoming Low Sulfur (Sub-Bituminous) Rocky Mountain Low Sulfur (Bituminous) Rocky Mountain Medium Sulfur (Bituminous) Akaska / Washington State Low Sulfur (Sub-Bituminous) Applachia Medium Sulfur (Bituminous) Eastern Interior Medium Sulfur (Bituminous) Eastern Interior Medium Sulfur (Lignite) Gulf of Mexici Medium Sulfur (Lignite) Dakota Medium Sulfur (Lignite) Western Montana Medium Sulfur (Sub-Bituminous) Wyoming Medium Sulfur (Sub-Bituminous) Rocky Mountain Low Sulfur (Sub-Bituminous) Rocky Mountain Medium Sulfur (Sub-Bituminous) 10
 Western Interior High Sulfur (Bituminous) Gulf of Mexico High Sulfur (Lignite) Western Montana Low Sulfur (Sub-Bituminous) Wyoming Low Sulfur (Sub-Bituminous) Rocky Mountain Low Sulfur")
11 $25/tCO2 tax Case Coal Production (EJ/year) Coal Production by Region (EJ) Appalachia High Sulfur (Bituminous) Applachia Low Sulfur (Bituminous) Eastern Interior High Sulfur (Bituminous) Western Interior High Sulfur (Bituminous) Gulf of Mexico High Sulfur (Lignite) Western Montana Low Sulfur (Sub-Bituminous) Wyoming Low Sulfur (Sub-Bituminous) Rocky Mountain Low Sulfur (Bituminous) Rocky Mountain Medium Sulfur (Bituminous) Akaska / Washington State Low Sulfur (Sub-Bituminous) Fresh Water Consumption for Coal km^3 $25/tCO2 tax Case Water for Coal Production Applachia Medium Sulfur (Bituminous) Eastern Interior Medium Sulfur (Bituminous) Eastern Interior Medium Sulfur (Lignite) Gulf of Mexici Medium Sulfur (Lignite) Dakota Medium Sulfur (Lignite) - Western Montana Medium Sulfur (Sub-Bituminous) Wyoming Medium Sulfur (Sub-Bituminous) Rocky Mountain Low Sulfur (Sub-Bituminous) Rocky Mountain Medium Sulfur (Sub-Bituminous) 11
12 Fresh Water Consumption for US Coal Production Fresh Water Consumption (km3/year) Fresh Water Consumption for US Coal Production (km 3 /year) Reference Ctax High Import 0.02 Low Import 0 The Low Import case also reduces US coal production due to its abundant domestic oil and natural gas As one would expect, the climate policy significantly reduces US coal production. 12
13 Estimating Fresh Water Consumption for US Biofuel Refining Bioenergy Ethanol Produiction Biodiesel Production 13
14 Domestic US Biofuel Production (millions of bbls/day) US Domestic Biofuel Production (millions bbls/day) US Biofuel Fresh Water Consumption (km3/year) Fresh Water Consumption associated with US Domestic Biofuel Refining (km 3 /year) 0 Ethanol - Low Energy Imports Scenario Ethanol - High Energy Imports Scenario Ethanol- Reference Scenario Ethanol - Ctax$25 Scenario Biodiesel - Low Energy Imports Scenario Biodiesel - High Energy Imports Scenario Biodiesel - Reference Scenario Biodiesel - Ctax$25 Scenario 1 4
15 Estimating Fresh Water Consumption for US Natural Gas Production Natural Gas Domestic offshore gas production Onshore gas production Convetntional natural gas production Shale gas / tight gas production including hydrofacking Coalbed methane production Natural gas processing, dehydration, compression to pipeline pressures 15
16 Fresh Water Consumption km 3 /year) Fresh Water Consumption (km 3 /year) for US Natural Gas Production Reference Ctax25 High Import Low Imports 16
17 US Domestic Natural Gas Production (tcf/year) Natural Gas Production by State and Formation (tcf/year) 100% 80% 60% 40% 20% 0% TX Shale Gas LA Shale Gas Offshore Gulf Coast Natural Gas CO Coalbed Methane WY Coalbed Methane AR Shale Gas OK Shale Gas PA Shale Gas Fresh Water Consumption for Natural Gas Production (km3/year) Fresh Water Consumption for Natural Gas (km3/year) 100% 90% 80% 70% 60% 50% 40% 30% 20% 10% 0% TX Conventional Natural Gas LA Conventional Gas Alaska Conventional Natural Gas CO Conventonal Gas WY Conventional Natural Gas AR Conventional Gas OK Conventional Natural Gas NM Coalbed Methane 17
18 Estimating Fresh Water Consumption for US Domestic Crude Oil Production Imported Crude Oil Domestic offshore Primary oil production Crude oil refining Crude Oil Domestically produced oil Secondary water flooding Oil production from tight formations including hydrofacking CO2-EOR Domestic onshore Tertiary Oil Production Steam driven EOR Non-hydrocarbon injection EOR 18


19 19 Percent of US Crude Oil Production by State and Production Process 100% 90% 80% 70% 60% 50% 40% 30% 20% 10% Domestic Crude Oil Production 0% Percent Fresh Water Consumption Associated with US Crude Oil Production by State and Production Process Fresh Water Consumption Crude Oil Production 100% 90% 80% 70% 60% 50% 40% 30% 20% 10% 0% TX Primary Production TX Secondary Water Flooding TX Tight Oil TX CO2-EOR AK Primary Production AK Secondary Water Flooding AK Tight Oil AK CO2-EOR CA Primary Production CA Secondary Water Flooding CA Tight Oil CA CO2-EOR CO Primary Production CO Secondary Water Flooding CO Tight Oil CO CO2-EOR WY Primary Production WY Secondary Water Flooding WY Tight Oil WY CO2-EOR ND Primary Production ND Secondary Water Flooding ND Tight Oil ND CO2-EOR Lower 48 Offshore Other
20 Fresh Water Consumption (km3/year) Fresh Water Consumption for US Crude Oil Production (km 3 /year) Reference Ctax25 High Import Low Import 0 Fresh Water Consumption (km3/year) Fresh Water Consumption for Refining (km 3 /year) Reference Ctax25 High Import Low Import
21 A Shift to Lower Resource Grades Might Result in More Water Intensive Primary Energy Production! A shift to lower grades of primary energy resources implies a more energy-intensive primary energy sector.! Whether this shift to lower grades of the primary energy resource results in a more water intensive primary energy system is very dependent upon fuel, site and reservoir specific characteristics. Tight Oil / Gas Formations Enhanced Oil / Gas Production 21 Fresh Water Consumption (km3/year) US Primary Energy Production Total Fresh Water Consumption (km 3 /year) Reference Ctax25 High Import Low Imports 5.4 Primary Oil / Gas Production Derived from Figure 1 Stylized Depiction of water use and energy production as a function of time (figure taken from Supplemental Information for Nicot and Scanlon, 2012)
22 22 Backup Slides
23 23 What is happening at the state, basin, and production technology level that drives the difference in fresh water consumption between these scenarios?
24 US Primary Energy Production Total Fresh Water Consumption (km3) 7.2 Changes in Fresh Water Consumption Low Import Case minus Reference Case (km 3 /year) Fresh Water Consumption (km 3 /year) Fresh Water Consumption (km3/year) Reference Low Imports 5.6 Texas Crude Oil Refining Lousiana Crude Oil Refining Mississipi Crude Oil Refining Texas Crude OilProduction New Mexico Crude Oil Production Oklahoma Crude Oil Production Utah Crude Oil Production Wyoming Crude Oil Production Montana Crude Oil Production Illinois Crude Oil Refining Missisipi Crude Oil Production Colorado Crude Oil Production North Dakota Crude Oil Production Alaska Crude Oil Production California Crude Oil Refining New Jersy Crude Oil Refining Indiana Crude Oil Refining Kentuky Crude Oil Refining Kansas Crude Oil Refining Ohio Crude Oil Refining Oklahoma Crude Oil Refining Pennsylvania Crude Oil Refining Total 24
25 Difference in National and Regional Fresh Water Consumption Ctax$25 Case Compared to Reference Case (km 3 /year) Fresh Water Consumption (km3/year) (0.10) (0.20) (0.30) Fresh Water Consumption (km3/year) Texas Crude Oil Refining Texas Crude OilProduction Texas Natural Gas Production Lousiana Crude Oil Refining Mississipi Crude Oil Refining Mississipi Crude Oil Production West Virginia Coal Production Kentuky Coal Production Illinois Crude Oil Refining Illionois Uranium Enrichment Illinois Coal Production Wyoming Coal Production California Crude Oil Refining New Jersy Crude Oil Refining Total 6 US Primary Energy Production Total Fresh Water Consumption (km3) Reference Ctax
26 Fresh Water Consumption (km3/year) Difference in National and Regional Fresh Water Consumption High Import Case Compared to Reference Case (km 3 /year) Fresh Water Consumption (km3/year) Texas Crude Oil Refining Lousiana Crude Oil Refining Mississipi Crude Oil Refining Texas Crude OilProduction Wyoming Crude Oil Production Texas Natural Gas Production Illinois Crude Oil Refining Missisipi Crude Oil Production Colorado Crude Oil Production California Crude Oil Refining New Jersy Crude Oil Refining Total US Primary Energy Production Total Fresh Water Consumption (km3) Reference High Import
27 Super Fast Summary as I am way over my allotted time already!! The consumption of fresh water for primary energy production is small compared to water use for crude oil refining or electricity production.! It is a good thing we have an Integrated Assessment Model that we can use as it would be interesting to see what happens to primary energy fresh water consumption (as well as total fresh water consumption)! when there is significant deployment of PHEVs,! in world that had a transportation sector that is dominated by biofuels 27
28 28
29 Coal Underground coal mining Surface coal mine Mining and washing/benefication for high and medium sulfur coals Mining of low sulfur coals Mining and washing/benefication for high and medium sulfur coals Mining of low sulfur coals Uranium Hard rock uranium mine (including milling) In situ leaching uranium mine Uranium hexaflouride conversion Uranium enrichment via gaseeous diffusion or centrifuge Fuel Rod/ Pellet Assembly Bioenergy Ethanol Produiction Biodiesel Production 29
30 Imported Crude Oil Domestic offshore Primary oil production Crude oil refining Secondary water flooding Crude Oil Oil production from tight formations including hydrofacking Domestically produced oil CO2-EOR Steam driven EOR Tertiary Oil Production Non-hydrocarbon injection EOR Domestic onshore Domestic offshore gas production Natural Gas Onshore gas production Convetntional natural gas production Coalbed methane production Shale gas / tight gas production including hydrofacking Natural gas processing, dehydration, compression to pipeline pressures 30
 Crude Oil Refining 4.896 Crude Oil Produc0on 1.087 Natural Gas 0.199 Biofuel Refining 0.171 Coal 0.")
31 Reference Case Fresh Water Consumption by Fuel (km 3 /year) Fresh Water Consumption Associated with US Primary Energy Production Reference Case (km 3 /year) Oil Refining Crude Oil Production Natural Gas Biofuel Refining Coal Uranium 0 Fresh Water Consump0 on in 2040 (km 3 /year) Crude Oil Refining Crude Oil Produc0on Natural Gas Biofuel Refining Coal Uranium
32 Total Domestic Energy Production/ Consumption and Total Energy-related GHG Emissions 120 Total Domestic Energy Production and Total Domestic Energy Consumption (Quads/year) Reference Total Domestic Supply Reference Total Consumption Low Imports Total Domestic Supply High Imports Total Domestic Supply Ctax$25 Total Domestic Supply Low Imports Total Consumption High Imports Total Consumption Ctax$25 Total Consumption Energy Related Greenhouse Gas Emissions (GtCO2e/year) Reference emissions Low Imports emissions High Imports emissions Ctax$25 emissions 0 32


33 Water Use in the Low Domestic Uranium Production Case US Government has a monopoly on the conversion of U 3 O 8 to UF 6 and there is only one site in Southern Illinois that does this step in the nuclear fuel cycle. 3 3
34 34 Water Use in the High Domestic Uranium Production Case
35 Fresh Water Consumption (km3/year) Fresh Water Consumption for US Crude Oil Production (km 3 /year) Reference Ctax25 High Import Low Import 35

36 3 6 US Domestic Natural Gas Production (tcf/year) Natural Gas Production by State and Formation (tcf/year) TX Shale Gas TX Conventional Natural Gas LA Shale Gas LA Conventional Gas Offshore Gulf Coast Natural Gas Alaska Conventional Natural Gas CO Coalbed Methane CO Conventonal Gas WY Coalbed Methane WY Conventional Natural Gas AR Shale Gas AR Conventional Gas OK Shale Gas OK Conventional Natural Gas PA Shale Gas NM Coalbed Methane Other Fresh Water Consumption for Natural Gas Production (km3/year) Fresh Water Consumption for Natural Gas (km3/year)
Implications of the U.S. Shale Revolution
 Implications of the U.S. Shale Revolution For October 17, 214 Chicago, Illinois By Adam Sieminski, Administrator U.S. Energy Information Administration U.S. Energy Information Administration Independent
U.S. Rail Crude Oil Traffic
 U.S. Rail Crude Oil Traffic Association of American Railroads May 217 Summary U.S. crude oil production has risen sharply in recent years, with much of the increased output moving by rail. In 28, U.S.
Petroleum and Natural Gas Outlook
 Petroleum and Natural Gas Outlook Energy Summit 26: Developing and Supporting Critical Energy Infrastructures at the LSU Center for Energy Studies Baton Rouge, Louisiana October 2, 26 A. Michael Schaal,
U.S. Rail Crude Oil Traffic
 U.S. Rail Crude Oil Traffic Association of American Railroads November 215 Summary U.S. crude oil production has risen sharply in recent years, with much of the increased output moving by rail. In 28,
Sales of Fossil Fuels Produced from Federal and Indian Lands, FY 2003 through FY 2013
 Sales of Fossil Fuels Produced from Federal and Indian Lands, FY 2003 through FY 2013 June 2014 Independent Statistics & Analysis www.eia.gov U.S. Department of Energy Washington, DC 20585 This report
TRAFFIC VOLUME TRENDS July 2002
 TRAFFIC VOLUME TRENDS July 2002 Travel on all roads and streets changed by +2.3 percent for July 2002 as compared to July 2001. Estimated Vehicle-Miles of Travel by Region - July 2002 - (in Billions) West
For Region 5 and Region 7 Regional Response Teams Meeting April 22, 2015 St. Charles, Missouri via video/teleconference
 For Region 5 and Region 7 Regional Response Teams Meeting St. Charles, Missouri via video/teleconference By Grant Nülle, Upstream Oil & Gas Economist, Exploration and Production Analysis Team U.S. Energy
RETURN ON INVESTMENT LIQUIFIED NATURAL GAS PIVOTAL LNG TRUCK MARKET LNG TO DIESEL COMPARISON
 RETURN ON INVESTMENT LIQUIFIED NATURAL GAS PIVOTAL LNG TRUCK MARKET LNG TO DIESEL COMPARISON Year 1 Year 2 Year 3 Year 4 Year 5 Year 6 Year 7 Year 8 Year 9 Year 10 RETAIL BREAK EVEN AND IRR EXAMPLE FOR
Monthly Biodiesel Production Report
 Monthly Biodiesel Production Report With data for June 2017 August 2017 Independent Statistics & Analysis www.eia.gov U.S. Department of Energy Washington, DC 20585 This report was prepared by the U.S.
State Policy Trends in Biomass
 State Policy Trends in Biomass Biomass 2010 March 30, 2010 Glen Andersen National lconference of State Legislatures Overview of State Policies Renewable Fuel Standards Renewable Portfolio Standards Reducing/Eliminating
TRAFFIC VOLUME TRENDS
 Page 1 U. S. Department Transportation Federal Highway Administration Office Highway Policy Information TRAFFIC VOLUME TRENDS September Travel on all roads and streets changed by +2.5 (5.8 billion vehicle
Tracking New Coal-Fired Power Plants. Coal s Resurgence in Electric Power Generation
 Tracking New Coal-Fired Power Plants Coal s Resurgence in Electric Power Generation February 24, 2004 Tracking New Coal-Fired Power Plants This information package is intended to provide an overview of
A summary of national and global energy indicators. FEDERAL RESERVE BANK of KANSAS CITY
 THE U.S. Energy DATABOOK A summary of national and global energy indicators JULY 1, 17 FEDERAL RESERVE BANK of KANSAS CITY SUMMARY OF CURRENT ENERGY CONDITIONS The number of total active drilling rigs
A Clean Diesel State of Mind Top States for Diesel Drivers
 A Clean Diesel State of Mind Top States for Diesel Drivers Growing Clean Diesel Cars, Trucks and SUVs: June 4, 2014 2:00 pm ET Press Conference #cleandiesel Today s Virtual Press Conference Welcome and
STATUS OF THE U.S. REFINING INDUSTRY
 STATUS OF THE U.S. REFINING INDUSTRY October 2005 BAKER & O BRIEN Incorporated, All Rights Reserved REFINING VITAL LINK IN THE OIL SUPPLY CHAIN Crude Oil Supply & Logistics Products Distribution & Marketing
Manufactured Home Shipments by Product Mix ( )
") Manufactured Home Shipments by Product Mix (1990-2014) Data Source: Institute for Building Technology and Safety (IBTS) * "Destination Pending" represents month-end finished home inventory at a plant.
Manufactured Home Shipments by Product Mix (1990-2014) Data Source: Institute for Building Technology and Safety (IBTS) * "Destination Pending" represents month-end finished home inventory at a plant.
EPA REGULATORY UPDATE PEI Convention at the NACS Show October 8, 2018 Las Vegas, NV
 EPA REGULATORY UPDATE 2018 PEI Convention at the NACS Show October 8, 2018 Las Vegas, NV 1 Periodic Operations and Maintenance Walkthrough Inspections - beginning no later than October 13, 2018 (40 CFR
05/17/2011
 RETAIL DIESEL FUEL OUTLOOK A Fundamental Petroleum Trends Weekly Report Lehi German Tel: 816.505.0980 www.fundamentalpetroleumtrends.com Tuesday, May 17, 2011 Diesel Fuel Price Trends U.S. retail diesel
Energy, Economic. Environmental Indicators
 Energy, Economic and AUGUST, 2018 All U.S. States & Select Extra Graphs Contents Purpose / Acknowledgements Context and Data Sources Graphs: USA RGGI States (Regional Greenhouse Gas Initiative participating
U.S. Ethanol Production, Imports and Stocks
 U.S. Ethanol Production, Imports and Stocks Daniel O Brien and Mike Woolverton, Extension Agricultural Economists K-State Research and Extension January 12, 29 Trends in production, imports and ending
Alaska (AK) Passenger vehicles, motorcycles 1959 and newer require a title ATV s, boats and snowmobiles do not require a title
 Passenger vehicles, motorcycles 1959 and newer require a title ATV s, boats and snowmobiles do not require a title") Alabama (AL) Passenger vehicles 1975 and newer require a Motorcycles, mopeds and trailers 1975 and newer require a ATVs, snowmobiles and boats do not require a Alaska (AK) Passenger vehicles, motorcycles
Alabama (AL) Passenger vehicles 1975 and newer require a Motorcycles, mopeds and trailers 1975 and newer require a ATVs, snowmobiles and boats do not require a Alaska (AK) Passenger vehicles, motorcycles
CURRENT PROJECTS TO INCREASE COAL PRODUCTION & UTILIZATION. West Virginia University November 13, 2008 Bart J. Hyita
 CURRENT PROJECTS TO INCREASE COAL PRODUCTION & UTILIZATION Poundstone Lecture West Virginia University November 13, 2008 Bart J. Hyita The information contained in this presentation is the property of
U.S. Natural Gas Outlook The 3rd London Gas & LNG Forum September 26 and 27, 2016 The Rag Army & Navy Club London
 U.S. Natural Gas Outlook The 3rd London Gas & LNG Forum September 26 and 27, 216 The Rag Army & Navy Club London Lucian Pugliaresi Energy Policy Research Foundation, Inc. Washington, DC 1 About EPRINC!
2013 Migration Patterns traffic flow by state/province
 Interstate and Cross-Border 2013 Migration Patterns traffic flow by state/province Based on 77,308 Interstate Household Goods Moves from January 1, 2013 through December 31, 2013 YUKON TERRITORY 0 0 BC
California s Petroleum Infrastructure Overview and Import Projections
 California s Petroleum Infrastructure Overview and Import Projections Port of Los Angeles Harbor Commission Meeting San Pedro, CA February 1, 2007 Gordon Schremp Fuels and Transportation Division California
Iowa Biodiesel Board Sept. 9, 2011 Gary Haer, VP, Sales and Marketing, REG Chairman, National Biodiesel Board. Copyright Renewable Energy Group
 Iowa Biodiesel Board Sept. 9, 2011 Gary Haer, VP, Sales and Marketing, REG Chairman, National Biodiesel Board. 1 Agenda Biodiesel, America s Advanced Biofuel New Biorefining Manufacturing Sector Creating
May 2018 Short-Term Energy Outlook
 May 2018 for Williston Basin Petroleum Conference Bismarck, N.D. by Dr. Linda Capuano Administrator U.S. Energy Information Administration Independent Statistics & Analysis www.eia.gov Brent crude oil
2016 Migration Patterns traffic flow by state/province
 Interstate and Cross-Border 2016 Migration Patterns traffic flow by state/province Based on 75,427 Interstate Household Goods Moves from January 1, 2016 through December 15, 2016 NL 8 13 YUKON TERRITORY
Weekly Statistical Bulletin
 API 1220 L Street, NW Washington, DC 20005 Weekly Statistical Bulletin STATISTICS DEPARTMENT Volume: 93 Number: 35 Week Ending: August 31, 2012 SUMMARY (In thousands of 42-gallon barrels per day, except
MMWR 1 Expanded Table 1. Persons living with diagnosed. Persons living with undiagnosed HIV infection
 MMWR 1 Expanded Table 1 Expanded Table 1. Estimated* number of persons aged 13 years with (diagnosed and undiagnosed), and percentage of those with diagnosed, by jurisdiction and year United States, 2008
The Outlook for Energy: A View to 2040
 The Outlook for Energy: A View to 24 Dr. David Khemakhem Riyadh, Kingdom of Saudi Arabia March 25, 213 This presentation includes forward-looking statements. Actual future conditions (including economic
Tight Oil: A Solution to U.S. Import Dependence?
 Tight Oil: A Solution to U.S. Import Dependence? Geological Society of America Denver, Colorado October 28, 213 J. David Hughes Global Sustainability Research Inc. Post Carbon Institute The Shale Revolution
US Exports to China by State
 US Exports to China by State 2000 10 1818 N Street, NW, Suite 200, Washington, DC 20036 Tel: 202-429-0340 Fax: 202-775-2476 E-mail: info@uschina.org www.uschina.org Executive Summary Exports to China are
Rice Global E&C Forum August 9, 2013
 Rice Global E&C Forum August 9, 2013 Midyear Forecast: July 1, 2013 Conglin Xu, Senior Editor-Economics Laura Bell, Statistics Editor Alan Petzet, Chief Editor-Exploration Forecast & Review: Jan. 7, 2013
ANNUAL FINANCIAL PROFILE OF AMERICA S FRANCHISED NEW-TRUCK DEALERSHIPS
 217 ANNUAL FINANCIAL PROFILE OF AMERICA S FRANCHISED NEW-TRUCK DEALERSHIPS Overview For 217, ATD Data our annual financial profile of franchised new medium- and heavyduty truck dealerships shows the following:
U.S. GASOLINE AND DISTILLATE FUELS UPDATE - DECEMBER 20, 2017
 U.S. GASOLINE AND DISTILLATE FUELS UPDATE - DECEMBER 20, 2017 PRICE TRENDS Monday, December 18 According to the Energy Information Administration (EIA), the average U.S. retail price for regular grade
Minerals Management Service
 U.S. Department of the Interior Minerals Management Service Future US Energy Sources US Offshore - Offshore Arctic Dave Marin MMS Maritime Transportation of Energy Mare Forum USA 2008 February 14, 2008
Introduction. Julie C. DeFalco Policy Analyst 125.
 Introduction The federal Corporate Average Fuel Economy (CAFE) standards were originally imposed in the mid-1970s as a way to save oil. They turned out to be an incredibly expensive and ineffective way
RELATIVE COSTS OF DRIVING ELECTRIC AND GASOLINE VEHICLES
 SWT-2018-1 JANUARY 2018 RELATIVE COSTS OF DRIVING ELECTRIC AND GASOLINE VEHICLES IN THE INDIVIDUAL U.S. STATES MICHAEL SIVAK BRANDON SCHOETTLE SUSTAINABLE WORLDWIDE TRANSPORTATION RELATIVE COSTS OF DRIVING
Technical Session: Crude Oil Supply High Quality Competitive Distillate Fuels from Coal-to-Liquids Processing
 Technical Session: Crude Oil Supply High Quality Competitive Distillate Fuels from Coal-to-Liquids Processing NPRA Annual Meeting March 20, 2007 Mark Landrum / Jon Warzel BAKER & O BRIEN Incorporated,
8,975 7,927 6,552 6,764
 y = 0.1493x 4-23842x 3 + 1E+09x 2-4E+13x + 4E+17 R 2 = 0.9977 27,717 21,449 17,855 13,222 11,054 10,053 6/28/2009 6/24/2009 6/22/2009 6/20/2009 6/18/2009 6/16/2009 6/14/2009 6/8/2009 6/6/2009 6/4/2009
Wyoming Energy Projects
 Wyoming Energy Projects Wyoming Infrastructure Authority Spring Conference March 28-29, 2019 PacifiCorp Overview Two divisions Rocky Mountain Power and Pacific Power 5600 Employees 1.9 million electricity
Emerging Trends in Petroleum Markets
 Emerging Trends in Petroleum Markets For Defense Logistics Agency, Worldwide Energy Conference Washington, D.C. By T. Mason Hamilton, Petroleum Markets Analyst U.S. Energy Information Administration Independent
All Applicants - By HS GPA Run Date: Thursday, September 06, Applicants GPA Count % of Total
 All Freshmen: 3 Year Comparison of Fall Applications Received, Degree, Net s and Net s GPA All - By HS GPA Net s 3.900-4.000 1932 44.3 1840 55.8 441 57.0 24.0 35 1395 3.800-3.899 301 6.9 267 8.1 54 7.0
Achieving Energy Security and Greenhouse. Biomass Crop Assistance Program. Madhu Khanna
 Achieving Energy Security and Greenhouse Gas Reduction Cost-Effectively: The Biomass Crop Assistance Program Madhu Khanna Professor, Agricultural and Environmental Economics University of Illinois, Urbana-Champaign
CHEMSYSTEMS. Report Abstract. Petrochemical Market Dynamics Feedstocks
 CHEMSYSTEMS PPE PROGRAM Report Abstract Petrochemical Market Dynamics Feedstocks Petrochemical feedstocks industry overview, crude oil, natural gas, coal, biological hydrocarbons, olefins, aromatics, methane
The Impact of Shale Oil Production Growth in the US
 The Impact of Shale Oil Production Growth in the US Presentation to IMSF, Copenhagen By Selena Yan, Senior Analyst www.clarksons.com Disclaimer The material and the information (including, without limitation,
PHOTOS: SHUTTERSTOCK. June Editor s note: The Arkansas Energy Report is Sponsored by MISO & Arkansas State Chamber of Commerce.
 PHOTOS: SHUTTERSTOCK June 2016 Editor s note: The Arkansas Energy Report is Sponsored by MISO & Arkansas State Chamber of Commerce. Arkansas energy picture in recent months is one of low pump prices, a
FutureMetrics LLC. 8 Airport Road Bethel, ME 04217, USA. Cheap Natural Gas will be Good for the Wood-to-Energy Sector!
 FutureMetrics LLC 8 Airport Road Bethel, ME 04217, USA Cheap Natural Gas will be Good for the Wood-to-Energy Sector! January 13, 2013 By Dr. William Strauss, FutureMetrics It is not uncommon to hear that
DEAL ER DATAVI EW. Digital Marketing Index. June 2017
 DEAL ER DATAVI EW Digital Marketing Index June 2017 DATA DRIVES STRATEGY. Dealer DataView is a monthly automotive digital marketing index, based on Dealer.com s leading proprietary data, research and analytics.
Drilling Productivity Report
 Independent Statistics & Analysis U.S. Energy Information Administration il 216 For key tight oil and shale gas regions Bakken Marcellus Utica Niobrara Permian Haynesville Eagle Ford The seven regions
Tax Information. Federal Tax ID. Federal Tax ID: EPA Registration. EPA Registration #: California SG # California SG #:
 Tax Information Federal Tax ID NGL Crude Logistics LLC Debra Kelson 2900 N. Loop W., Suite 1250, Houston, TX 77092 Phone: 713-496-3900 Fax: 713-496-3902 Energytaxes@nglep.com Federal Tax ID: 47-0794813
Oil and gas prices down off 2008 highs
 Oil and gas prices down off 28 highs $ US$ per per barrel barrel US$ $ per thousand cubic feet 16 9 14 8 12 7 Natural gas (wellhead) 6 1 (Right) 5 8 4 6 3 4 2 Crude oil 2 (Left) 1 198 1985 199 1995 2 25
Failing the Grade: School Bus Pollution & Children s Health. Patricia Monahan Union of Concerned Scientists Clean Cities Conference May 13, 2002
 Failing the Grade: School Bus Pollution & Children s Health Patricia Monahan Union of Concerned Scientists Clean Cities Conference May 13, 2002 Outline School bus/diesel pollution and children s health
Denbury Resources Inc. Compression in CO2 Enhanced Recovery February 10, 2011 NYSE: DNR
 Denbury Resources Inc. Compression in CO2 Enhanced Recovery February 10, 2011 NYSE: DNR Denbury Overview CO2 Compression History Engineering Issues Typical Denbury Packages Summary Denbury Resources Inc.
LES DEFIS TECHNOLOGIQUES DU SECTEUR DES HYDROCARBURES
 LES DEFIS TECHNOLOGIQUES DU SECTEUR DES HYDROCARBURES Olivier APPERT Président IFP Club Mines Energie Ecole des Mines de Paris Mardi 23 mai 2006 1 1970-2030 Evolution of World Energy Balance (incl. Biomass
Oregon s Road Usage Charge Program
 Oregon s Road Usage Charge Program NACo Symposium On America s County Transportation and Infrastructure Hon. Tammy Baney, Deschutes County, OR Oregon Transportation Commissioner James Whitty, Program Manager,
DEAL ER DATAVI EW. Digital Marketing Index August 2018
 DEAL ER DATAVI EW Digital Marketing Index August 2018 DATA DRIVES STRATEGY. The DataView is a monthly automotive digital marketing index, based on Dealer.com s proprietary data, research and analytics.
THE EMPLOYMENT AND ECONOMIC IMPACT OF THE VEHICLE SUPPLIER INDUSTRY IN THE U.S. mema.org DRIVING THE FUTURE 1
 DRIVING THE FUTURE THE EMPLOYMENT AND ECONOMIC IMPACT OF THE VEHICLE SUPPLIER INDUSTRY IN THE U.S. mema.org DRIVING THE FUTURE 1 THE LARGEST SECTOR OF MANUFACTURING JOBS IN THE UNITED STATES JUST GOT BIGGER
DEAL ER DATAVI EW. Digital Marketing Index October 2017
 DEAL ER DATAVI EW Digital Marketing Index October 2017 DATA DRIVES STRATEGY. Dealer DataView is a monthly automotive digital marketing index, based on Dealer.com s proprietary data, research and analytics.
The Outlook for Energy:
 The Outlook for Energy: A View to 2040 Paul L. Tanaka November 9, 2015 This presentation includes forward-looking statements. Actual future conditions (including economic conditions, energy demand, and
ENERGY WORKFORCE DEMAND
 NOVEMBER 2015 Center for Energy Workforce Development ENERGY WORKFORCE DEMAND MIDWEST REGION Center for Energy Workforce Development ENERGY WORKFORCE DEMAND MIDWEST REGION TABLE OF CONTENTS INTRODUCTION
The Economic Downturn Lessons on the Correlation between Economic Growth and Energy
 The Economic Downturn Lessons on the Correlation between Economic Growth and Energy Demand presented to Indiana State Bar Association Utility Law Spring Seminar April 9, 2010 presented by Doug Gotham State
North American Construction: The Canadian Perspective. Dale Orr Managing Director, Canadian Macro Services
 North American Construction: The Canadian Perspective Dale Orr Managing Director, Canadian Macro Services Canada Moves Ahead of the United States 4.0 Real GDP (percent change) 3.5 3.0 2.5 2.0 1.5 1.0 Canada
Defining the Debate: Crude Oil Exports
 Defining the Debate: Crude Oil Exports Trisha Curtis, Director of Research Upstream and Midstream Energy Policy Research Foundation, Inc. (EPRINC) Brookings Task Force February 28th, 214 About EPRINC www.eprinc.org
UPS Alternative Fuel and Advanced Technology Vehicles
 UPS Alternative Fuel and Advanced Technology Vehicles UPS operates one of the largest private alternative fuel and advanced technology fleets in the U.S. with more than 8,500 vehicles. This includes all-electric,
2009 Migration Patterns traffic flow by state/province
 Interstate and Cross-Border 2009 Migration Patterns traffic flow by state/province Based on 71,474 Interstate Household Goods Moves from January 1, 2009 through December 31, 2009 UNITED STATES ALABAMA
2010 Migration Patterns traffic flow by state/province
 Interstate and Cross-Border 2010 Migration Patterns traffic flow by state/province Based on 74,541 Interstate Household Goods Moves from January 1, 2010 through December 31, 2010 UNITED STATES ALABAMA
ESTIMATED NUMBER OF NEW CANCER CASES AND DEATHS BY STATE All Sites Brain and ONS Female Breast Uterine Cervix STATE Cases Deaths Cases Deaths
 All Sites Brain and ONS Female Breast Uterine Cervix Alabama 24,090 9,900 310 200 2,970 700 190 80 Alaska 2,530 830 * * 370 60 * * Arizona 27,600 10,260 470 280 3,470 740 210 80 Arkansas 14,800 6,230 200
Clean Fuels MARAMA
 Clean Fuels MARAMA 3.20.2019 Alleyn Harned Virginia Clean Cities 540-568-8896 aharned@vacleancities.org Clean Cities / 1 Clean Fuels and Mobile Sources Ask the questions: Why Energy Economic Security Environmental
THE PARTNERSHIP OF RAIL & COAL MOVING AHEAD 2014 RMCMI ANNUAL MEETING SEPTEMBER 19, 2014
 THE PARTNERSHIP OF RAIL & COAL MOVING AHEAD 2014 RMCMI ANNUAL MEETING SEPTEMBER 19, 2014 1 BNSF is a Leading U.S. Railroad A Berkshire Hathaway company 32,500 route miles in 28 states and two Canadian
ESTIMATED NUMBER OF NEW CANCER CASES AND DEATHS BY STATE All Sites Brain & ONS Female Breast Uterine Cervix STATE Cases Deaths Cases Deaths
 ESTIMATED NUMBER OF NEW CANCER CASES AND DEATHS BY STATE -- 2019 All Sites Brain & ONS Female Breast Uterine Cervix Alabama 28,950 10,630 370 350 4,240 690 240 110 Alaska 3,090 1,120 50 * 470 70 * * Arizona
Results from the Auto Laundry News. Detailing Survey
 Detail Survey Cover:Detail Survey Cover T H E V O I C E 12/19/12 O F 12:23 PM T H E Page 27 C A R C A R E I N D U S T R Y Results from the Auto Laundry News 2013 Detailing Survey Results From The Auto
DEAL ER DATAVI EW. Digital Marketing Index. August 2017
 DEAL ER DATAVI EW Digital Marketing Index August 2017 DATA DRIVES STRATEGY. Dealer DataView is a monthly automotive digital marketing index, based on Dealer.com s leading proprietary data, research and
Expanding Biodiesel Production and Use. Renewable Energy Opportunities for American Farmers Arlington, VA February 18-20, 2004
 Expanding Biodiesel Production and Use Renewable Energy Opportunities for American Farmers Arlington, VA February 18-20, 2004 About Us West Central was incorporated in 1933 in Ralston, Iowa, which is still
Executive Summary. Exports to China: A key driver of US economic growth. China: An important market for US goods
 Executive Summary Exports to China: A key driver of US economic growth China continues to be an important contributor to US economic growth. In 2014, US exports to China totaled $120 billion, making it
State Efforts to Promote Alternative Fuels. Kristy Hartman November 13, 2014
 State Efforts to Promote Alternative Fuels Kristy Hartman November 13, 2014 NCSL Overview Bipartisan organization Serves the 7,383 legislators and 30,000+ legislative staff of the nation's 50 states, commonwealths
JOB CUT ANNOUNCEMENTS SURGE 45 PERCENT TO 76,835, HIGHEST MONTHLY TOTAL IN OVER THREE YEARS
 CONTACT Colleen Madden, Director of Public Relations Office: 312-422-5074 Mobile: 314-807-1568 colleenmadden@challengergray.com **EMBARGOED COPY** FOR RELEASE AT 7:30 A.M. ET, MARCH 7, 2019 JOB CUT ANNOUNCEMENTS
Stifel Nicolaus Transportation Conference
 Stifel Nicolaus Transportation Conference February 14, 2012 James A. Squires Executive Vice President Finance and Chief Financial Officer Norfolk Southern System Norfolk Southern Update Recent Results
ANNUAL FINANCIAL PROFILE OF AMERICA S FRANCHISED NEW-CAR DEALERSHIPS
 ANNUAL FINANCIAL PROFILE OF AMERICA S FRANCHISED NEW-CAR DEALERSHIPS 2014 www./nadadata Overview NADA Data 2014 the annual financial profile of America s franchised new-car dealerships shows a robust and
Hoerbiger Engineering Services. Gas/Electric Partnership 2008 Electronic Pre-Combustion Check Valve (EPCC)
") Hoerbiger Engineering Services Gas/Electric Partnership 2008 Electronic Pre-Combustion Check Valve (EPCC) Hoerbiger Engineering Services (HES) Services Offered In 3 Key Areas Of Compressor Station Design
Hoerbiger Engineering Services Gas/Electric Partnership 2008 Electronic Pre-Combustion Check Valve (EPCC) Hoerbiger Engineering Services (HES) Services Offered In 3 Key Areas Of Compressor Station Design
Copyright 2018 Renewable Energy Group, Inc. AFOA Biomass Based Diesel Market Trends
 AFOA Biomass Based Diesel Market Trends Agenda Production Trends Modest and steady growth in biodiesel Potential Growth in RD, timeline is uncertain Co-processing volume yet to materialize Market Trends
ANNUAL FINANCIAL PROFILE OF AMERICA S FRANCHISED NEW-CAR DEALERSHIPS
 2015 ANNUAL FINANCIAL PROFILE OF AMERICA S FRANCHISED NEW-CAR DEALERSHIPS NATIONAL AUTOMOBILE DEALERS ASSOCIATION Overview Steven Szakaly Chief Economist, NADA Patrick Manzi Senior Economist, NADA NADA
WRAP Oil & Gas: 2002/2005 and 2018 Area Source Controls Evaluation
 WRAP Oil & Gas: 2002/2005 and 2018 Area Source Controls Evaluation WRAP SSJF Oil and Gas Work Group Members and Other Interested Parties May 30, 2007 1 WRAP Phase II Project Overview Project is focused
The Outlook for Energy: A View to 2040
 The Outlook for Energy: A View to 24 Todd Onderdonk June 213 This presentation includes forward-looking statements. Actual future conditions (including economic conditions, energy demand, and energy supply)
Sapphire Energy. Creating the Potential for Fuels from Algae. Presented by Cynthia J Warner, President
 Sapphire Energy Creating the Potential for Fuels from Algae Presented by Cynthia J Warner, President 0 Liquid transportation fuels are a major source of energy use, though renewables make up a tiny fraction
Moving Crude Oil by Rail
 Moving Crude Oil by Rail Association of American Railroads May 2013 Summary Technological advances, along with relatively high crude oil prices, have led to sharply higher U.S. crude oil production. Historically,
Biofuels: Implications for Prices and Production. Darrel L. Good and Scott H. Irwin
 Biofuels: Implications for Prices and Production Darrel L. Good and Scott H. Irwin Why Ethanol? Convert relatively abundant domestic sources of energy into a substitute for imported petroleum Energy Conversion
Market Report Series Oil 2018
 Market Report Series Oil 218 Norwegian Ministry of Energy, 17 April 218 Neil Atkinson, Head of Oil Industry and Markets Division Toril Bosoni, Senior Oil Market Analyst, Oil Industry and Markets Division
Traffic Safety Facts 2000
 DOT HS 809 326 U.S. Department of Transportation National Highway Traffic Safety Administration Traffic Safety Facts 2000 Motorcycles In 2000, 2,862 motorcyclists were killed and an additional 58,000 were
Results from the Auto Laundry News. Detailing Survey
 Detail Survey Cover:Detail Survey Cover T H E V O I C E 12/24/13 O F 10:45 AM T H E Page 33 C A R C A R E I N D U S T R Y Results from the Auto Laundry News 2014 Detailing Survey 2014 Detail Survey he
Characteristics of Minimum Wage Workers: Bureau of Labor Statistics U.S. Department of Labor
 Characteristics of Minimum Wage Workers: 2012 Bureau of Labor Statistics U.S. Department of Labor February 26, 2013 In 2012, 75.3 million in the United States age 16 and over were paid at, representing
USDA Projections of Bioenergy-Related Corn and Soyoil Use for
 USDA Projections of Bioenergy-Related Corn and Soyoil Use for 2010-2019 Daniel M. O Brien, Extension Agricultural Economist K-State Research and Extension The United States Department of Agriculture released
Secretary's Statistical Report Quarterly
 Date Sent: May 6, 200 Submitted by: G ALEXANDER BRYANT, SECRETARY ORGANIZATION ES COMPANIES NORTH AMERICAN DIVISION - Military Church ATLANTIC UNION CONFERENCE CANADA, SDA IN COLUMBIA UNION CONFERENCE
Thursday, March 6, 2014 Houston, TX. 8:30 9:40 a.m. AN ECONOMIST S-EYE VIEW OF THE ENERGY INDUSTRY: HYDROCARBON HAT TRICK
 Thursday, March 6, 214 Houston, TX 8:3 9:4 a.m. AN ECONOMIST S-EYE VIEW OF THE ENERGY INDUSTRY: HYDROCARBON HAT TRICK Presented by Jesse Thompson Business Economist Federal Reserve Bank of Dallas, Houston
Medium- and Heavy-Duty Vehicle Policies
 Medium- and Heavy-Duty Vehicle Policies This map contains state laws and regulations that affect medium- and heavy-duty vehicles. The policies include the following: Tax incentives: tax credits for vehicle
Commercializing the Rentech Process
 Commercializing the Rentech Process China-US Coal Gasification and Liquefaction Workshop Beijing, China June 15-16, 16, 2006 1 Ultra-High Purity Fuel - from Coal (CTL) The U.S. needs clean economical fuel
HALE STEEL PRICE LIST#0818 Effective August 1, 2018
 HALE STEEL PRICE LIST#0818 Effective August 1, 2018 TABLE OF CONTENTS Single Faced Flat Shelving... 4 Double Faced Flat Shelving... 5 Single Faced Integral Back Divider Shelving.... 6 Double Faced Integral
January * Kansas Stats/ Rankings. * Accident Stats
 KDOT Quick Facts January 2012 * Kansas Stats/ Rankings * CTP * Personnel * Revenue * Taxes * Accident Stats Table of Contents Kansas Public Road Miles and Vehicle Miles of Travel - Percent by Jurisdiction...
How Does Diesel Compare to Other Sources of Energy?
 Name How Does Diesel Compare to Other Sources of Energy? Diesel and Gasoline are common fuel sources in Alaska. How do they compare? Both diesel and gasoline are made from crude oil. Crude oil is a liquid