US Crude Oil Reshaping International Crude Oil Flows. Olivier Jakob,
|
|
|
- Mariah Allen
- 6 years ago
- Views:
Transcription


1 US Crude Oil Reshaping International Crude Oil Flows Olivier Jakob,
2 Claimer Petromatrix publishes since 2006 a daily market note on the oil markets Our reports are trading oriented and offer a mix of fundamental, technical and investment flow analysis Our customers include the largest oil traders, oil majors, hedge funds, investment banks but also small oil companies and private traders. For more information or a free trial please visit or info@petromatrix.com
3 WTI is the real price of crude oil Brent is the reality of the price of crude oil.
4 The two crude markets WTI: Free-market Efficient allocation of resources. If pricing differentials exist, then infrastructure will be developed. Trend of increasing production Brent: Ultimately it is the OPEC market. Supply is controlled by OPEC and price is dependent of OPEC policies Trend of decreasing production in the pricemaking benchmark
5 From the price being set by OPEC 2000: OPEC price band of 22 $/bbl to 28 $/bbl on basis of OPEC basket Below 22 $/bbl for 10 days or above 28 $/bbl for 20 days triggers production adjustments. Abandoned in early 2005.
6 World Oil Demand Y-O-Y Growth myn b/d (source: IEA)
7 Crude Oil lost to wars/strikes in OPEC countries (k bpd) 3,000 2,500 2,000 1,500 1, Jan-02 Jun-02 Nov-02 Apr-03 Sep-03 Feb-04 Jul-04 Dec-04 May-05 Oct-05 Mar-06 Aug-06 Jan-07 Jun-07 Nov-07 Apr-08 Sep-08 Feb-09 Jul-09 Dec-09 May-10 Oct-10 Mar-11 Aug-11 Jan-12 Jun-12 Nov-12
8
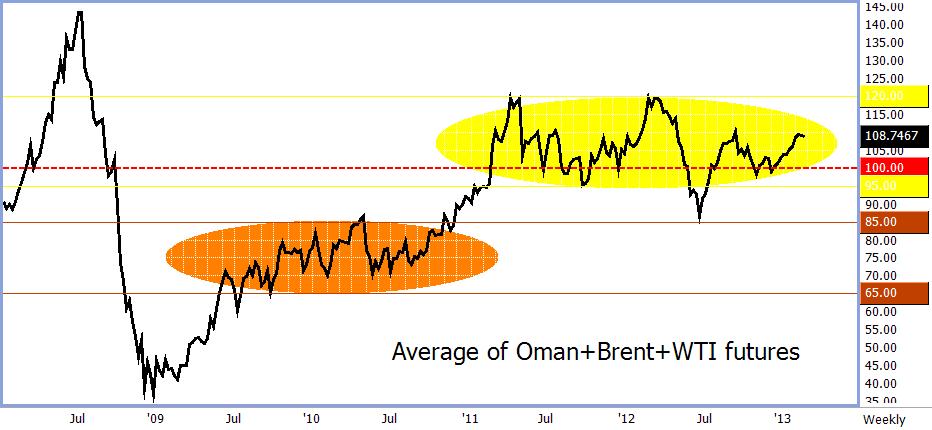
9 to the price being set by the market Until end-december 2010: price of crude oil has to be set by the marginal cost of production. Deemed to be deep-offshore then Canadian sands $/bbl floor King Abdullah, 2008/2009: fair price is 75 $/bbl or maybe 80 $/bbl.
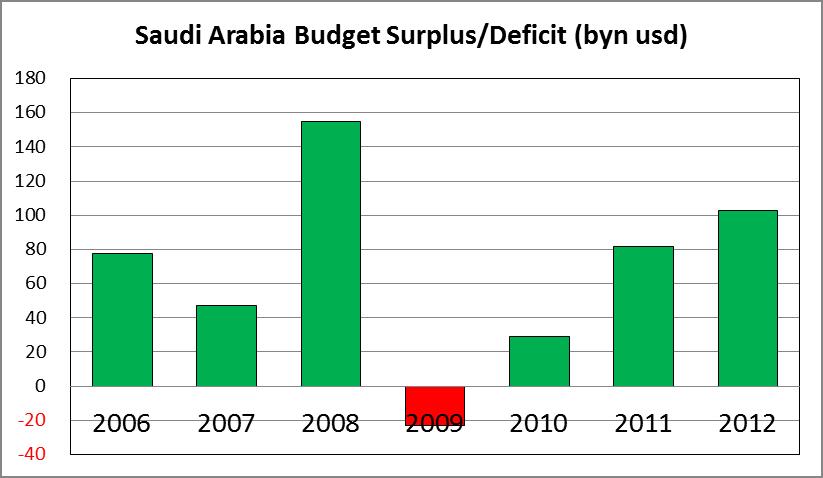
10 and back to OPEC Since early 2011: price has to be set at a floor that allows budgetary requirements of OPEC nations facing civil pressure. More or less 100 $/bbl floor Targeting 100 $/bbl or 110 $/bbl?
11
12
13
14
15
16
17
18
19
20 There used to be only one benchmark WTI was the price maker. Had the most liquidity and Brent was also a WTI market due to North Sea shipments up the pipe to Padd2 Brent was being priced as a differential to WTI. Dubai set as a differential to Brent. World crudes could be linked to a WTI or Brent formula, WTI was the ultimate price maker
21 And then there were two With reduced flows from the US Gulf to Padd2, the arbitrage started to move to the US Gulf values Relationship between Brent and WTI has been broken. OPEC walks from WTI reference Passive investors have lost in the WTI contango, loosing appetite in WTI and favoring Brent since 2011 Increased calls that «WTI is disconnected» to the world.
22 -In early 2010, Petromatrix calls for Brent premium to WTI for 1Q2011 -But not to the 15 $/bbl+ -Would we have a Brent/WTI at 15 $/bbl if OPEC target was still 80 $/bbl?
23
24 Myth: US does not export crude oil. Versus Jan 2008 ( 000 bpd): 2,000 1,500 1, Feb-08 Feb-09 Feb-10 Feb-11 Feb ,000-1,500 Product Exports Crude Oil Production
25 14,000 12,000 10,000 Myth: US does not export Natural Gas (US Coal Exports, thou short tons) 8,000 6,000 4,000 2,000 0 Jan-06 Jan-07 Jan-08 Jan-09 Jan-10 Jan-11 Jan-12
26 US crude prodn & imports vs Jan 2008 ( 000 b/d) 2,500 2,000 1,500 1, Feb-08 Feb-09 Feb-10 Feb-11 Feb-12-1,000-1,500-2,000-2,500 Imports Production
27 IEA (OECD) outlook for US crude production growth ( 000 bpd) Dec11 Dec12 Jul12 Jan13
28
29 US imports from Saudi Arabia ( 000 b/d) 1,800 1,700 1,600 1,500 1,400 1,300 1,200 1,100 1,
30 Imports from S.Arabia Oct-Nov 2012 vs Oct-Nov 2011 ( 000 b/d) OECD Europe OECD Asia US China
31 Iraq production increase ( 000 bpd) 3,400 3,200 3,000 2,800 2,600 2,400 2,200 2,000 Jan-09 Apr-09 Jul-09 Oct-09 Jan-10 Apr-10 Jul-10 Oct-10 Jan-11 Apr-11 Jul-11 Oct-11 Jan-12 Apr-12 Jul-12 Oct-12 Jan-13
32 US imports from Iraq ( 000 b/d)
33 Imports from Iraq Oct-Nov 2012 vs Oct-Nov 2011 ( 000 b/d) OECD Europe OECD Asia US China
34 Imports from Iran ( 000 bpd) 3,000 2,500 2,000 1,500 1, Belgium France Greece Italy Netherlands Spain Turkey Japan South Korea China India Taiwan
35 US imports from Colombia ( 000 b/d)
36 Imports from Colombia Oct-Nov 2012 vs Oct-Nov 2011 ( 000 b/d) OECD Europe OECD Asia US China
37 US imports from Brazil ( 000 b/d)
38 Imports from Brazil Oct-Nov 2012 vs Oct-Nov 2011 ( 000 b/d) OECD Europe OECD Asia US China
39 US imports from Russia ( 000 b/d)
40 Imports from Russia Oct-Nov 2012 vs Oct-Nov 2011 ( 000 b/d) OECD Europe OECD Asia US China
41 US imports from Algeria ( 000 b/d)
42 Imports from Algeria Oct-Nov 2012 vs Oct-Nov 2011 ( 000 b/d) OECD Europe OECD Asia US China
43 US imports from Angola ( 000 b/d)
44 US imports from Angola ( 000 b/d) Jan-11 Feb-11 Mar-11 Apr-11 May-11 Jun-11 Jul-11 Aug-11 Sep-11 Oct-11 Nov-11 Dec-11 Jan-12 Feb-12 Mar-12 Apr-12 May-12 Jun-12 Jul-12 Aug-12 Sep-12 Oct-12 Nov-12 Padd1 Padd3 Padd5
45 Imports from Angola Oct-Nov 2012 vs Oct-Nov 2011 ( 000 b/d) OECD Europe OECD Asia US China
46 US imports from Nigeria ( 000 b/d)
47 US imports from Nigeria ( 000 b/d) Jan-11 Feb-11 Mar-11 Apr-11 May-11 Jun-11 Jul-11 Aug-11 Sep-11 Oct-11 Nov-11 Dec-11 Jan-12 Feb-12 Mar-12 Apr-12 May-12 Jun-12 Jul-12 Aug-12 Sep-12 Oct-12 Nov-12 Padd1 Padd3
48 Imports from Nigeria Oct-Nov 2012 vs Oct-Nov 2011 ( 000 b/d) OECD Europe OECD Asia US China
49 Increased Nigeria to Europe offset by FTA for European crude to S.Korea ( 000 bpd) Jan-11 Feb-11 Mar-11 Apr-11 May-11 Jun-11 Jul-11 Aug-11 Sep-11 Oct-11 Nov-11 Dec-11 Jan-12 Feb-12 Mar-12 Apr-12 May-12 Jun-12 Jul-12 Aug-12 Sep-12 Oct-12 Nov-12 Dec-12 Norway UK

50 Policy decisions on small flows but key benchmarks can have significant price impact
51 US crude imports 4 week avg to Feb 15 th 000 bpd vs year ago level Canada Saudi Arabia Mexico Venezuela Iraq Nigeria Kuwait Colombia Angola Ecuador Russia Brazil Norway Algeria -89 0
52 US crude oil imports (excl. CAN, 000 bpd) 9,000 8,500 8,000 7,500 7,000 6,500 6,000 5,500 5,000 Jan-07 Apr-07 Jul-07 Oct-07 Jan-08 Apr-08 Jul-08 Oct-08 Jan-09 Apr-09 Jul-09 Oct-09 Jan-10 Apr-10 Jul-10 Oct-10 Jan-11 Apr-11 Jul-11 Oct-11 Jan-12 Apr-12 Jul-12 Oct-12 Jan-13
53 US crude oil imports (excl. CAN) and China crude oil imports (vs Jan 2007, 000 bpd) 3,000 2,000 1, ,000 Jan-07 Apr-07 Jul-07 Oct-07 Jan-08 Apr-08 Jul-08 Oct-08 Jan-09 Apr-09 Jul-09 Oct-09 Jan-10 Apr-10 Jul-10 Oct-10 Jan-11 Apr-11 Jul-11 Oct-11 Jan-12 Apr-12 Jul-12 Oct-12 Jan-13-2,000-3,000 US China
54 US crude oil imports (excl. CAN) and China crude oil imports ( 000 bpd) 9,000 8,000 7,000 6,000 5,000 4,000 3,000 Jan-07 Apr-07 Jul-07 Oct-07 Jan-08 Apr-08 Jul-08 Oct-08 Jan-09 Apr-09 Jul-09 US Oct-09 Jan-10 Apr-10 China Jul-10 Oct-10 Jan-11 Apr-11 Jul-11 Oct-11 Jan-12 Apr-12 Jul-12 Oct-12 Jan-13
55 US obligatory oil stocks in days of net imports (End-Nov, IEA)
56 US Sweet SPR days of cover for USG imports of NIG+ALG+ANG+BRAZ 1,
Global Overview of Middle Distillates Supply and Demand ICE Market Forum Rotterdam, November 2012
 Global Overview of Middle Distillates Supply and Demand ICE Market Forum Rotterdam, November 2012 About Petromatrix Based in Switzerland (city of Zug) Publishes a daily newsletter on oil markets Mix of
Market Report Series: Oil 2018 Analysis & Forecasts to Energy Community 10 th Oil Forum, Belgrade, 25 September 2018
 Market Report Series: Oil 218 Analysis & Forecasts to 223 Energy Community 1 th Oil Forum, Belgrade, 25 September 218 Short term update: crude prices (excl. WTI) up strongly Aug/Sep $/bbl 8 Benchmark Crude
A summary of national and global energy indicators. FEDERAL RESERVE BANK of KANSAS CITY
 THE U.S. Energy DATABOOK A summary of national and global energy indicators JULY 1, 17 FEDERAL RESERVE BANK of KANSAS CITY SUMMARY OF CURRENT ENERGY CONDITIONS The number of total active drilling rigs
Global Monthly February 2018
 Global Monthly February 18 3 1-year Treasury yields 1-year breakeven inflation rate 1 1 15 16 17 18 February 18 5 3 Global GDP growth Composite PMI (RHS) Index 56 5 5 1 5 1 13 1 15 16 17 18 3..5. 1.5 1.
Soybean Oil Prices Diverge on Different Supply Situations
 United States Department of Agriculture Foreign Agricultural Service Circular Series FOP 10-09 October 2009 Soybean Oil Prices Diverge on Different Supply Situations Soybean Oil Price ($/ton) $900 $850
Commercial-in-Confidence Ashton Old Baths Financial Model - Detailed Cashflow
 Year 0 1 2 3 4 5 6 7 8 9 10 11 12 13 Oct-16 Nov-16 Dec-16 Jan-17 Feb-17 Mar-17 Apr-17 May-17 Jun-17 Jul-17 Aug-17 Sep-17 Oct-17 2,038 2,922 4,089 4,349 6,256 7,124 8,885 8,885 8,885 8,885 8,885 8,885 9,107
PREVIEW FundamentalEdge Report October 2018
 GLOBAL CRUDE OIL SUPPLY AND DEMAND PREVIEW FundamentalEdge Report October 2018 learn more at drillinginfo.com Key Takeaways This is a PREVIEW of a 20+ Page Report Global Crude Oil Supply and Demand is
Fundamental Oil Market Outlook
 Fundamental Oil Market Outlook ICE Forum David Wech JBC Energy GmbH 13 November 2012 Research - Energy Studies - Consulting - Training 21 November 2012 Slide 1 Disclaimer All statements other than statements
Primary energy. 8 Consumption 9 Consumption by fuel. 67 th edition
 Primary energy 8 Consumption 9 Consumption by fuel 67 th edition Primary energy Consumption* Growth rate per annum Million tonnes oil equivalent 27 28 29 2 211 212 213 214 215 216 217 217 26-16 Share 217
Soybean Trade Growth: A Story of Brazil, the United States, and China
 United States Department of Agriculture Foreign Agricultural Service October 2017 Soybean Trade Growth: A Story of Brazil, the United States, and China 12-Month Soybean Export Growth Year Ending September
Pakistan Oilseed Processors Seize Opportunity to Crush Soybeans
 United States Department of Agriculture Foreign Agricultural Service December 2015 Pakistan Oilseed Processors Seize Opportunity to Crush Soybeans Pakistan, long an importer of soybean meal, is transitioning
The Supply of Oil. Projections to Oil and the Macroeconomy in a Changing World Federal Reserve Bank of Boston June 9, 2010 Boston, MA
 The Supply of Oil Projections to 2035 Oil and the Macroeconomy in a Changing World Federal Reserve Bank of Boston June 9, 2010 Boston, MA Howard Gruenspecht, Deputy Administrator Near-term oil price uncertainty
About Czarnikow. The Premier Provider of Sugar Market Services. Czarnikow has been in the sugar business since 1861
 About Czarnikow The Premier Provider of Sugar Market Services Czarnikow has been in the sugar business since 1861 Czarnikow is the leading professional services company in the sugar market Czarnikow has
2016/17 Global Olive Oil Production Down But Prices Stabilize
 United States Department of Agriculture Foreign Agricultural Service November 2016 Global Olive Oil Down But Prices Stabilize Global Olive Oil and Stocks 4000 3500 5000 Extra Virgin Olive Oil Prices Stabilizing
Fresh Connections: Netherlands
 Fresh Connections: Netherlands SHIFTING TRADE WINDS: GEOPOLITICS, GLOBAL TRADE & YOU JULIEN MARCILLY CHIEF ECONOMIST APRIL 29, 215 Oil prices: Lower for longer 14 Oil price (Brent, source: OPEC) 12 Oil
CERI Commodity Report Crude Oil
 1-Jun-10 1-Jul-10 1-Aug-10 1-Sep-10 1-Oct-10 1-Nov-10 1-Dec-10 1-Jan-11 1-Feb-11 1-Mar-11 1-Apr-11 1-May-11 1-Jun-11 1-Jun-10 1-Jul-10 1-Aug-10 1-Sep-10 1-Oct-10 1-Nov-10 1-Dec-10 1-Jan-11 1-Feb-11 1-Mar-11
Argentine Exporters Switch to Soybean Oil as Biodiesel Exports Fall
 United States Department of Agriculture Foreign Agricultural Service Circular Series FOP 08-13 Argentine Exporters Switch to Soybean Oil as Biodiesel Exports Fall Argentina s soybean oil exports have surged
Regional Refining Outlook
 Regional Refining Outlook Implications for Crude Demand Platts Crude Summit 15 May 213 David Wech JBC Energy GmbH 13 th May 213 Research - Energy Studies - Consulting - Training Disclaimer All statements
Sharp Decline in Vegetable Oil Stocks Leads to Steeply Higher Prices
 United States Department of Agriculture Foreign Agricultural Service Circular Series FOP 1-11 Sharp Decline in Vegetable Oil Leads to Steeply Higher Prices Commodity prices have been on an upward trend
U.S. Soybean Prices Fall as Buyers Focus Turns to South America
 United States Department of Agriculture Foreign Agricultural Service Circular Series FOP 2-10 ruary 2010 U.S. Soybean Prices Fall as Buyers Focus Turns to South America $11.00 Daily U.S. Soybean Cash Price
China s Global Peanut Export Share Declines
 United States Department of Agriculture Foreign Agricultural Service Circular Series FOP 07-13 China s Global Peanut Export Share Declines U.S. 10% Others 19% Argentina 17% U.S. 11% Others 16% Argentina
Measuring the Quality of the Crude Oil Supply and its Impact on Basis Differentials
 Measuring the Quality of the Crude Oil Supply and its Impact on Basis Differentials Quality Flexibility Relationship Innovation Information = Advantage Ali AL-SUMAITI PhD Candidate, Colorado School of
Brazil s Soybean Oil Exports Squeezed by Rising Biodiesel Demand
 United States Department of Agriculture Foreign Agricultural Service Circular Series FOP 6-09 e 2009 Brazil s Soybean Oil Exports Squeezed by Rising Biodiesel Demand Soybean Oil Exports and Industrial
Global Monthly March 2019
 Global Monthly March 19 Percent of world bonds outstanding 3 5 15 5 Jan-1 Jun-1 Nov-1 Apr-15 Sep-15 Feb-1 Jul-1 Dec-1 May-17 Oct-17 Mar-1 Aug-1 Dec-1 Mar-19 March 19 Percent, year-on-year 7 5 3 1 1Q1 1Q
Table 1 WORLD OIL SUPPLY AND DEMAND (million barrels per day)
") INTERNATIONAL ENERGY AGENCY - OIL MARKET REPORT TABLES TABLES Table 1 WORLD OIL SUPPLY AND DEMAND (million barrels per day) 2011 2012 1Q13 2Q13 3Q13 4Q13 2013 1Q14 2Q14 3Q14 4Q14 2014 1Q15 2Q15 3Q15 4Q15
INTERNATIONAL ENERGY AGENCY - OIL MARKET REPORT TABLES TABLES Table 1 WORLD OIL SUPPLY AND DEMAND (million barrels per day) 2011 2012 1Q13 2Q13 3Q13 4Q13 2013 1Q14 2Q14 3Q14 4Q14 2014 1Q15 2Q15 3Q15 4Q15
/ PRELIMINARY STEEL IMPORTS INCREASE 15% IN APRIL Import Market Share 27% in April
 News Release FOR IMMEDIATE RELEASE May 23, 2014 CONTACT Lisa Harrison 202.452.7115/ lharrison@steel.org PRELIMINARY STEEL IMPORTS INCREASE 15% IN APRIL Import Market Share 27% in April Washington, D.C.
/ PRELIMINARY STEEL IMPORTS INCREASE 2% IN MAY Import Market Share 23% in May
 News Release FOR IMMEDIATE RELEASE June 25, 2013 CONTACT Lisa Harrison 202.452.7115/ lharrison@steel.org PRELIMINARY STEEL IMPORTS INCREASE 2% IN MAY Import Market Share 23% in May Washington, D.C. Based
STEEL IMPORTS UP 15% IN 2017 Finished Import Market Share Increased to 27%
 News Release FOR IMMEDIATE RELEASE January 26, 2018 CONTACT Lisa Harrison 202.452.7115/lharrison@steel.org STEEL IMPORTS UP 15% IN 2017 Finished Import Market Share Increased to 27% Washington, D.C. Based
Early-Season U.S. Soybean Meal Sales Surge
 United States Department of Agriculture Foreign Agricultural Service November 2014 Early-Season U.S. Soybean Meal Sales Surge U.S. soybean meal export commitments (accumulated exports plus outstanding
North American Storage and Transportation Trends
 North American Storage and Transportation Trends Brian Busch Director, Oil Markets and Business Development www.genscape.com 2016 Genscape Incorporated. All rights reserved. What we do 2 Current State
Recent Developments in EU Refining and in the Supply and Trade of Petroleum Products
 Recent Developments in EU Refining and in the Supply and Trade of Petroleum Products Second Meeting of the EU Refining Forum Brussels, 27 November 2013 Toril Bosoni, International Energy Agency OECD/IEA
Weak Real to Boost Brazil s Soybean Exports in 2016
 United States Department of Agriculture Foreign Agricultural Service October 2015 Weak Real to Boost Brazil s Soybean Exports in 2016 Brazil s exchange rate is having a significant impact on domestic and
Indian Soybean Meal Exports Unlikely to Recover in 2015/16
 United States Department of Agriculture Foreign Agricultural Service November 2015 Indian Soybean Meal Exports Unlikely to Recover in Though once a significant regional exporter of soybean meal, India
Oil Markets into Peter Davies Chief Economist, BP plc British Institute of Energy Economics London. 24 January, 2006
 Oil Markets into 26 Peter Davies Chief Economist, BP plc British Institute of Energy Economics London. 24 January, 26 Outline Oil and energy today How did we get to here? Prospects for 26 Into the medium
WORLD OIL SUPPLY AND DEMAND (million barrels per day)
") INTERNATIONAL ENERGY AGENCY OIL MARKET REPORT TABLES TABLES Table 1 WORLD OIL SUPPLY AND DEMAND (million barrels per day) 2005 2006 1Q07 2Q07 3Q07 4Q07 2007 1Q08 2Q08 3Q08 4Q08 2008 1Q09 2Q09 3Q09 4Q09
INTERNATIONAL ENERGY AGENCY OIL MARKET REPORT TABLES TABLES Table 1 WORLD OIL SUPPLY AND DEMAND (million barrels per day) 2005 2006 1Q07 2Q07 3Q07 4Q07 2007 1Q08 2Q08 3Q08 4Q08 2008 1Q09 2Q09 3Q09 4Q09
As China s Soybean Oil Imports Fall, Production Expands
 United States Department of Agriculture Foreign Agricultural Service Circular Series FOP 10-10 October 2010 As China s Soybean Oil Fall, Expands 12 10 Million Metric Tons 8 6 4 2 0 2006/07 2007/08 China
INTERTANKO Istanbul Tanker Event. Demand Developments. David Martin Oil Industry & Markets Division OECD/IEA
 INTERTANKO Istanbul Tanker Event Demand Developments David Martin Industry & s Division david.martin@iea.org - Istanbul, April 20-23, 2008 Medium-Term Outlook What is driving oil prices? Fundamentals or
Oil. 12 Reserves 14 Production and consumption 20 Prices 22 Refining 24 Trade movements. 67 th edition
 Oil 12 Reserves 14 Production and consumption 20 Prices 22 Refining 24 Trade movements 67 th edition Oil Total proved reserves At end 1997 At end 2007 At end 2016 At end Thousand million barrels Thousand
STEEL IMPORTS UP 17% IN JANUARY Finished Import Market Share at 26%
 News Release FOR IMMEDIATE RELEASE February 26, 2018 CONTACT Lisa Harrison 202.452.7115/lharrison@steel.org STEEL IMPORTS UP 17% IN JANUARY Finished Import Market Share at 26% Washington, D.C. Based on
BP Statistical Review of World Energy June 2017
 BP Statistical Review of World Energy June 217 Primary energy 8 Consumption 8 Consumption by fuel 9 66 th edition Primary energy Consumption* Growth rate per annum Million tonnes oil equivalent 26 27 28
FINISHED STEEL IMPORT MARKET SHARE AT 25% IN JANUARY
 News Release FOR IMMEDIATE RELEASE March 27, 2019 CONTACT Lisa Harrison 202.452.7115/lharrison@steel.org FINISHED STEEL IMPORT MARKET SHARE AT 25% IN JANUARY Washington, D.C. Based on preliminary Census
Table 1 TABLES INTERNATIONAL ENERGY AGENCY OIL MARKET REPORT 15 MAY
 INTERNATIONAL ENERGY AGENCY OIL MARKET REPORT TABLES Table 1 Table WORLD 1 - World OIL SUPPLY Oil Supply AND DEMAND and Demand (million barrels per day) 2010 2011 1Q12 2Q12 3Q12 4Q12 2012 1Q13 2Q13 3Q13
Coconut Oil Prices Spike
 United States Department of Agriculture Foreign Agricultural Service Coconut Oil Prices Spike Coconut oil prices have surged over the past year in contrast to the general downward trend in other vegetable
Growing Fuel Use Limits Exports of Soybean Oil by South America
 United States Department of Agriculture Foreign Agricultural Service Circular Series FOP 11-09 ember 2009 Growing Fuel Use Limits of Soybean Oil by South America 2006/07 Soybean Oil Distribution Soybean
Current Oil Market Issues. Energy Training Week Paris, April 2013
 Current Oil Market Issues Energy Training Week Paris, April 2013 Short and Medium-Term Analysis & Forecasting: Current Oil Market Issues Antoine Halff Crude oil prices retreat from recent highs $/bbl 130
Table 1: World Oil Supply And Demand
 INTERNATIONAL ENERGY AGENCY - OIL MARKET REPORT TABLES Table 1 WORLD OIL SUPPLY AND DEMAND Table 1: World Oil Supply And Demand (million barrels per day) TABLES 2012 2013 1Q14 2Q14 3Q14 4Q14 2014 1Q15
Midwest Association of Rail Shippers
 January 13, 2016 Midwest Association of Rail Shippers Lance Fritz Chairman and CEO Union Pacific 1 2015 Economic Results Consumer-driven growth 1 Consumer Spending 2 Light Vehicle Sales 3.6% 3.0% 3.0%
COMPARISON OF FIXED & VARIABLE RATES (25 YEARS) CHARTERED BANK ADMINISTERED INTEREST RATES - PRIME BUSINESS*
 CHARTERED BANK ADMINISTERED INTEREST RATES - PRIME BUSINESS*") COMPARISON OF FIXED & VARIABLE RATES (25 YEARS) 2 Fixed Rates Variable Rates For Internal Use Only. FIXED RATES OF THE PAST 25 YEARS AVERAGE RESIDENTIAL MORTGAGE LENDING RATE - 5 YEAR* (Per cent) Year
COMPARISON OF FIXED & VARIABLE RATES (25 YEARS) 2 Fixed Rates Variable Rates For Internal Use Only. FIXED RATES OF THE PAST 25 YEARS AVERAGE RESIDENTIAL MORTGAGE LENDING RATE - 5 YEAR* (Per cent) Year
COMPARISON OF FIXED & VARIABLE RATES (25 YEARS) CHARTERED BANK ADMINISTERED INTEREST RATES - PRIME BUSINESS*
 CHARTERED BANK ADMINISTERED INTEREST RATES - PRIME BUSINESS*") COMPARISON OF FIXED & VARIABLE RATES (25 YEARS) 2 Fixed Rates Variable Rates FIXED RATES OF THE PAST 25 YEARS AVERAGE RESIDENTIAL MORTGAGE LENDING RATE - 5 YEAR* (Per cent) Year Jan Feb Mar Apr May Jun
COMPARISON OF FIXED & VARIABLE RATES (25 YEARS) 2 Fixed Rates Variable Rates FIXED RATES OF THE PAST 25 YEARS AVERAGE RESIDENTIAL MORTGAGE LENDING RATE - 5 YEAR* (Per cent) Year Jan Feb Mar Apr May Jun
 Urchin 7 cflag.ifas.ufl.edu Page 1 of 2 Standard View Export All Visits Permalink Geo Location Jul 1, 2015 - Jul 31, 2015 First Date 2015 Compare to Past Jan Feb Mar Apr May Jun Jul Aug Sep Oct Nov Dec
EU Dairy Exports to Third countries
 Milk Market Observatory TRA.EU.Extr Latest update : 12.6.218 Source : Eurostat (COMEXT) EU Dairy Exports to Third countries (January-April) 16 14 12 1 8 6 4 2 BUTTER exports 1 Tonnes 162 135 137 12 94
Recent Developments in EU Refining and in the Supply and Trade of Petroleum Products
 Recent Developments in EU Refining and in the Supply and Trade of Petroleum Products Third Meeting of the EU Refining Forum Brussels, 22 May 2014 Toril Bosoni, International Energy Agency OECD/IEA 2014
China Tariffs Driving U.S. Soybean Exports To the European Union to a 30-Year High
 United States Department of Agriculture Foreign Agricultural Service March 2019 China Tariffs Driving U.S. Soybean Exports To the European Union to a 30-Year High 12-MONTH MOVING TOTAL U.S. SOYBEAN EXPORTS
IEA Refinery Outlook European Recovery in Sight?
 IEA Refinery Outlook European Recovery in Sight? Platts 6 th Annual European Refining Markets Conference Brussels, 24-25 September 2012 Toril Bosoni, International Energy Agency Subdued Global Oil Demand
Energy Outlook. U.S. Energy Information Administration. For EnerCom Dallas February 22, 2018 Dallas, TX
 Energy Outlook For EnerCom Dallas Dallas, TX Jeff Barron Industry Economist, U.S. Energy Information Administration U.S. Energy Information Administration Independent Statistics & Analysis www.eia.gov
Regional Vegetable Oil Situation: Cut in Sun Oil Production, Imports Leaves North Africa & the Middle East Looking for Soy & Palm Oil to Fill Demand
 United States Department of Agriculture Foreign Agricultural Service Circular Series FOP 09-07 tember 2007 Regional Vegetable Oil Situation: Cut in Sun Oil, Leaves North Africa & the Middle East Looking
Trends in U.S. crude oil and petroleum product exports
 Trends in U.S. crude oil and petroleum product exports For ENERCOM Oil & Gas Conference August 21, 218 Denver, Colorado By T. Mason Hamilton, Petroleum Markets Analyst, Office of Energy Markets and Financial
Palm and Soy Oil Use Expands at Expense of Other Oils
 United States Department of Agriculture Foreign Agricultural Service September 2015 Revised on September 15, 2015 Palm and Soy Oil Use Expands at Expense of Other Oils As global demand for vegetable oil
Natural gas. 26 Reserves 28 Production and consumption 33 Prices 34 Trade movements. 67 th edition
 Natural gas 26 Reserves 28 Production and consumption 33 Prices 34 Trade movements 67 th edition Natural gas Total proved reserves At end 1997 At end 2007 At end 2016 At end Trillion Trillion Trillion
Recent Developments in International Seaborne Trade and Maritime Transport
 Recent Developments in International Seaborne Trade and Maritime Transport IFSPA, Hong Kong, 3-5 June 2013 Dr. Vincent F. Valentine Officer-in-Charge, Transport Section Division on Technology and Logistics
CERI Commodity Report Crude Oil
 2001 2002 2003 2004 2005 2006 2007 2008 2009 2010 2011 2012 2013 2014 2015 2016 2017 2018 2019 2020 2021 2022 2023 2024 2025 2026 2027 2028 2029 2030 2031 2032 2033 2034 2035 Well Count CERI Commodity
Emerging Trends in Petroleum Markets
 Emerging Trends in Petroleum Markets For Defense Logistics Agency, Worldwide Energy Conference Washington, D.C. By T. Mason Hamilton, Petroleum Markets Analyst U.S. Energy Information Administration Independent
Petroleum and Natural Gas Situation
 Petroleum and Natural Gas Situation John C. Felmy Chief Economist and Director Statistics Department American Petroleum Institute Felmyj@api.org www.api.org www.gasolineandyou.org www.naturalgasfacts.org
/ Preliminary Steel Imports Increase 6% in May Import Market Share at 21%
 News Release FOR IMMEDIATE RELEASE June 21, 2011 CONTACT: NANCY GRAVATT 202.452.7115/ ngravatt@steel.org Preliminary Steel Imports Increase 6% in May Import Market Share at 21% Washington, D.C. Based on
STEEL IMPORTS DOWN 23% FROM PRIOR MONTH IN MAY Finished Import Market Share YTD at 26%
 News Release FOR IMMEDIATE RELEASE June 25, 2018 CONTACT Lisa Harrison 202.452.7115/lharrison@steel.org STEEL IMPORTS DOWN 23% FROM PRIOR MONTH IN MAY Finished Import Market Share YTD at 26% Washington,
STEEL IMPORTS DOWN 5% YEAR-TO-DATE THROUGH FEBRUARY Finished Import Market Share YTD at 25%
 News Release FOR IMMEDIATE RELEASE March 23, 2018 CONTACT Lisa Harrison 202.452.7115/lharrison@steel.org STEEL IMPORTS DOWN 5% YEAR-TO-DATE THROUGH FEBRUARY Finished Import Market Share YTD at 25% Washington,
World Air Conditioner Demand by Region
 World Air Conditioner Demand by Region April 2015 The Japan Refrigeration and Air Conditioning Industry Association 1 World Air Conditioner Demand by Region April 2015 The Japan Refrigeration and Air Conditioning
Short - Term Outlook for the World Oil Market and Oil Price
 Short - Term Outlook for the World Oil Market and Oil Price Supplement to the Short-term Energy Supply and Demand Outlook Presented at the 376th Regular Meeting of Research Briefings 1. Background of recent
KINGDOM OF CAMBODIA NATION RELIGION KING 3
 KINGDOM OF CAMBODIA NATION RELIGION KING 3 TOURISM STATISTICS REPORT October 2018 MINISTRY OF TOURISM Statistics and Tourism Information Department No. A3, Street 169, Sangkat Veal Vong, Khan 7 Makara,
World Geographic Shares
 World Geographic Shares North America South America Europe Africa Asia Australia/ Oceania 18% 13% 7% 22% 33% 6% World Population Shares North America South America Europe Africa Asia Australia/ Oceania
KINGDOM OF CAMBODIA NATION RELIGION KING 3
 KINGDOM OF CAMBODIA NATION RELIGION KING 3 TOURISM STATISTICS REPORT September 2018 MINISTRY OF TOURISM Statistics and Tourism Information Department No. A3, Street 169, Sangkat Veal Vong, Khan 7 Makara,
Medium-term Coal Market Report 2011 Carlos Fernández Alvarez. Senior Coal Analyst. Gas, Coal and Power Markets Division
 Medium-term Coal Market Report 211 Carlos Fernández Alvarez. Senior Coal Analyst. Gas, Coal and Power Markets Division Madrid, 31 January 212 The context Uncertainties will fundamentally shape the medium-term
The Shale Boom Heard Around the World
 The Shale Boom Heard Around the World Ben Montalbano Director of Research and Operations Energy Policy Research Foundation, Inc. (EPRINC) Clingendael Institute November 5, 2013 Is this the wrong question?
Toyota IMV Sales Reach Global 5 Million-unit Mark
 Apr. 06, 2012 Toyota IMV Sales Reach Global 5 Million-unit Mark Toyota City, Japan, April 6, 2012 Toyota Motor Corporation (TMC) announces that worldwide cumulative sales of its Innovative International
WEEKLY REFINING INDICATORS REPORT WEEK ENDING 06/17/2016
 WEEKLY REFINING INDICATORS REPORT WEEK ENDING 06/17/2016 Blake Fernandez, Analyst 713.393.4524 blakef@howardweil.com Quick Take: Somewhat bearish stats on the refining side as we had hoped for some gasoline
UK Continental Shelf (UKCS) Oil and Gas Production and the UK Economy. Mike Earp
 Oil and Gas Production and the UK Economy. Mike Earp") UK Continental Shelf (UKCS) Oil and Gas Production and the UK Economy Mike Earp 15 June 215 Outline Production and Reserves Expenditure, Income and Taxation Gross Value Added Trade Recent Production History
UK Continental Shelf (UKCS) Oil and Gas Production and the UK Economy Mike Earp 15 June 215 Outline Production and Reserves Expenditure, Income and Taxation Gross Value Added Trade Recent Production History
China s Rapeseed Meal Imports Rise as Seed Imports Decline
 United States Department of Agriculture Foreign Agricultural Service February 2017 China s Rapeseed Meal Rise as Seed Decline Trend in China Rapeseed 12-Month Moving Totals Trend In China Rapeseed Meal
Preliminary Steel Imports Increase 16% in January Highest Total Imports Since January 2009
 News Release FOR IMMEDIATE RELEASE February 23, 2010 CONTACT: NANCY GRAVATT 202.452.7115/ ngravatt@steel.org Preliminary Steel Imports Increase 16% in uary Highest Total Imports Since uary 2009 Washington,
Gas & electricity - at a glance
 $/barrel /tco 2 e p/therm /MWh Gas & electricity - at a glance Week-on-Week Annual Gas Price Changes Short-term gas contracts jump Cold snap forecast for the first half of February, lifting demand Longer-dated
Soybean and Oilseed Meal Import Prospects Higher as Severe Weather Damages EU Crops
 Million Tons Million Tons Million Tons United States Department of Agriculture Foreign Agricultural Service August 2018 Soybean and Oilseed Meal Import Prospects Higher as Severe Weather Damages EU Crops
Preliminary Steel Imports, Down 14% in June, Increase 35% in First Half of Year; Import Market Share 21% in Second Quarter 2010
 News Release FOR IMMEDIATE RELEASE July 27, 2010 CONTACT: NANCY GRAVATT 202.452.7115/ ngravatt@steel.org Preliminary Steel Imports, Down 14% in June, Increase 35% in First Half of Year; Import Market Share
ASPHALT SUPPLY IN A VOLATILE OIL WORLD
 ASPHALT SUPPLY IN A VOLATILE OIL WORLD Bill Haverland ConocoPhillips Baxter Burns Ergon CRUDE OIL SUPPLY A WORLD LOOK Crude Oil Supply (2006) World Crude Oil Production Millions of Barrels Per Day FSU/E.
Table 1 WORLD OIL SUPPLY AND DEMAND (million barrels per day)
") INTERNATIONAL ENERGY AGENCY - OIL MARKET REPORT TABLES Table 1 WORLD OIL SUPPLY AND DEMAND (million barrels per day) 2004 2005 1Q06 2Q06 3Q06 4Q06 2006 1Q07 2Q07 3Q07 4Q07 2007 1Q08 2Q08 3Q08 4Q08 2008
INTERNATIONAL ENERGY AGENCY - OIL MARKET REPORT TABLES Table 1 WORLD OIL SUPPLY AND DEMAND (million barrels per day) 2004 2005 1Q06 2Q06 3Q06 4Q06 2006 1Q07 2Q07 3Q07 4Q07 2007 1Q08 2Q08 3Q08 4Q08 2008
Ten Years of JODI. Jean-Yves Garnier Head, Energy Statistics Division International Energy Agency
 th International JODI Conference 8 th 10-11 11 th October 2011, Beijing, China Ten Years of JODI Presentations Jean-Yves Garnier Head, Energy Statistics Division International Energy Agency World Oil Market
EXECUTIVE SUMMARY ATLANTIC SALMON NO 03/06
 MARKET This table shows development in supply/consumption of Atlantic salmon in the main markets per month, in tonnes r.w The table contains preliminary figures and may diverge from same figures in the
International Coal Markets
 International Coal Markets www.coalimp.org.uk Nigel Yaxley Managing Director, CoalImp 26 th November 28 International Coal Markets World supply and demand Seaborne trade Reserves and resources International
U.S. Soybean Exports Forecast to Reach Record
 United States Department of Agriculture Foreign Agricultural Service July 2017 U.S. Soybean Exports Forecast to Reach Record 60 Accumulated Exports by Week Total Commitments of Soybeans as of End of June
Drought in South America to Limit Soybean Exports
 United States Department of Agriculture Foreign Agricultural Service Circular Series FOP 2-09 ruary 2009 Drought in South America to Limit Soybean Exports Million Tons 16 14 12 10 8 6 4 2 Annual Change
High fuel costs could last Diesel and propane may not get much cheaper in 2019 By Bryce Knorr, senior grain market analyst
 High fuel costs could last Diesel and propane may not get much cheaper in 2019 By Bryce Knorr, senior grain market analyst In July I recommended using a dip in the energy market to lock in propane for
Growing Soybean Oil Price Raises Oil s Contribution to Total Soybean Value
 United States Department of Agriculture Foreign Agricultural Service Circular Series FOP 10-07 October 2007 Growing Soybean Oil Price Raises Oil s Contribution to Total Soybean Value Relative Share Value:
CERI Commodity Report Crude Oil
 CERI Commodity Report Crude Oil June-July 2014 Increasing Project Costs in the Oil Sands Sector Dinara Millington Recently, the Canadian Energy Research Institute (CERI) published the ninth annual edition
Rising Coconut Oil Prices Foreshadow Tight Supplies in 2007
 United States Department of Agriculture Foreign Agricultural Service Circular Series FOP 2-07 ruary 2007 Rising Coconut Oil Prices Foreshadow Tight Supplies in 2007 800 Coconut Oil Price: CIF Rotterdam
I. World trade in Overview
 I. World trade in - Overview Table I.1 Growth in the volume of world merchandise exports and production, 2-5 (Annual percentage change) 2-5 23 24 World merchandise exports 4.5 5. 9.5 6. Agricultural products
China is Key to Slow Pace of U.S. Soybean Exports
 United States Department of Agriculture Foreign Agricultural Service January 2018 China is Key to Slow Pace of U.S. Soybean Exports U.S. and Brazil Soybean Exports by Destination (Accumulated Exports:
Q Analyst Teleconference. 9 August 2018
 9 August 218 Disclaimer This presentation contains forward-looking statements that reflect the Company management s current views with respect to certain future events. Although it is believed that the
Market Report Series Oil 2018 Analysis and Forecasts to Columbia University Centre on Global Energy Policy, New York, May 22 nd 2018
 Market Report Series Oil 218 Analysis and Forecasts to 223 Columbia University Centre on Global Energy Policy, New York, May 22 nd 218 Robust global oil demand growth to 223 1.8 1.6 1.4 1.2 1..8.6.4.2.
Devaluation Energizes Argentine Soybean Crush
 United States Department of Agriculture Foreign Agricultural Service March 2016 Devaluation Energizes Argentine Soybean Crush Argentina Quarterly Soybean Crush Volume Exchange Rate* and Constant Dollar
Explosive Growth in Vegetable Oil Demand Exacerbates Chinese Supply Deficit, Reliance on Imports. Imports
 United States Department of Agriculture Foreign Agricultural Service Circular Series FOP 12-07 ember 2007 Million tons 35 Explosive Growth in Vegetable Oil Demand Exacerbates Chinese Supply Deficit, Reliance
Share of Brazil s Soybean Exports to China Spikes in August
 United States Department of Agriculture Foreign Agricultural Service September 2018 Share of Brazil s Soybean Exports to China Spikes in August Monthly Share of Brazil's Soybean Exports to China 85% 75%
Stockholm. What s Driving OPEC? 4 March Network Oil & Gas Sweden. Stephen George, Chief Economist KBC Advanced Technologies plc
 What s Driving OPEC? Stockholm 4 March 215 Network Oil & Gas Sweden Stephen George, Chief Economist KBC Advanced Technologies plc Contents copyright KBC Advanced Technologies plc, 215 KBC Advanced Technologies