VEHICLE OCCUPANCY DETERMINATORS
|
|
|
- Lucinda Richardson
- 6 years ago
- Views:
Transcription
1 ARIZONA DEPARTMENT OF TRANSPORTATION REPORT NUMBER: FHWA-AZ VEHICLE OCCUPANCY DETERMINATORS Final Report Prepared by: Barton-Aschman Associates, Inc. 100 Park Center Plaza, Suite 450 San Jose, California August 1989 Prepared for: Arizona Department of Transportation 206 South 17 th Avenue Phoenix, Arizona in cooperation with U.S. Department of Transportation Federal Highway Administration
2 The contents of this report reflect the views of the authors who are responsible for the facts and the accuracy of the data presented herein. The contents do not necessarily reflect the official views or policies of the Arizona Department of Transportation or the Federal Highways Administration. This report does not constitute a standard, specification, or regulation. Trade or manufacturer s names which may appear herein are cited only because they are considered essential to the objectives of the report. The U.S. Government and the State of Arizona do not endorse products or manufacturers.
3 TECHNICAL REPORT DOCUMENTATION PAGE 1. REPORT NO 2. GOVERNMENT ACCESSION NO. 3. RECIPIENT S CATALOG NO. FHWA-AZ TITLE AND SUBTITLE VEHICLE OCCUPANCY DETERMINATORS 5. REPORT DATE August PERFORMING ORGANIZATION CODE 7. AUTHOR (S) 8. PREFORMING ORGANIZATION REPORT NO.. 9. PERFORMING ORGANIZATION NAME AND ADDRESS Barton-Aschman Associates, Inc. 100 Park Center Plaza, Suite 450 San Jose, California SPONSORING AGENCY NAME AND ADDRESS ARIZONA DEPARTMENT OF TRANSPORTATION 206 S 17 TH AVENUE PHOENIX, ARIZONA WORK UNIT NO. 11. CONTRACT OR GRANT NO. HPR-PL-1-(31)-Item TYPE OF REPORT & PERIOD COVERED Final 14. SPONSORING AGENCY CODE SUPPLEMENTARY NOTES Prepared in cooperation with the U.S. Department of Transportation, Federal Highway Administration 16. ABSTRACT By using extensive and detailed counts and surveys of vehicle occupancy, conducted in Phoenix, this research project was intended to determine which factors have the greatest influence on vehicle occupancy and which conclusions about vehicle occupancy could be transferred from one metropolitan area to another. Trip purpose was determined to be the most significant factor affecting vehicle occupancy. With the exception of having a private vehicle available for making the trip in question, all other factors, including household income and trip distance were deemed to be far less important determinators of vehicle occupancy. As the percentages of trips by purpose vary greatly by time of day, vehicle occupancy rates were also shown to vary greatly by time of day. The lowest vehicle occupancy rates were associated with home-work-based trips. Given that home-work-based trips represent a larger proportion of trips during AM and PM peak hours, vehicle occupancies for those hours are lower than during off peak hours. (Extensive data about vehicle occupancy rates are provided in this report.) The 1988 daily regional vehicle occupancy rate of 1.33 derived for the Phoenix metropolitan area is very similar to the rates counted in Phoenix in previous years and to rates derived in other metropolitan areas. The conclusions about vehicle occupancy and the vehicle occupancy rates derived from this research are judged applicable in other metropolitan areas having Phoenix s development patterns, auto ownership rates and demographic characteristics. 23. REGISTRANT'S SEAL 17. KEY WORDS 18. DISTRIBUTION STATEMENT Vehicle Occupancy 19. SECURITY CLASSIF. (Of this report) 20. SECURITY CLASSIF. (Of this page) 21. NO. OF PAGES 22. PRICE 133 p.
4 TABLE OF CONTENTS PAGE 1. INTRODUCTION... 1 A. Purpose of Study... 2 B. Problem Statement... 4 C. Organization of this Report STUDY DESIGN AND DATA COLLECTION PROCEDURES... 6 A. Literature Search... 7 B. Possible Data to be Collected... 8 C. Possible Survey Approaches D. Data Collection Procedures Initially Recommended Direct Observation of Vehicle Occupancy Rates Sample Survey of Arriving Vehicles E. Data Collection and Data Processing Procedures Selected Vehicle Occupancy Counts Intercept Surveys ANALYSIS OF DATA COLLECTED A. Vehicle Occupancy Counts Vehicle Occupancies in Comparisons with other Years and Other Urban Areas B. Vehicle Intercept Surveys EVALUATION OF EXISTING VEHICLE OCCUPANCY MODELS FOR PHOENIX AREA A. Existing Regional Travel Demand Models B. Comparison of Existing Model Forecasts and New Data C. Recommended Modeling Changes CONCLUSIONS APPENDICES A. Abstracts of Selected Reference Materials Discussing Vehicle Occupancy... A-1 B. Intercept Survey Procedures and Survey Log... B-1 C. Intercept Survey Questionnaire... C-1 D. Classification of Responses to Intercept Surveys... D-1 E. Factoring the Intercept Survey Responses... E-1 F. Standard Deviations and Standard Errors and Estimates of Vehicle Occupancy... F-1 Phoenix V.O.D./Sept. 1989:eab ii
5 LIST OF TABLES PAGE Table 1 Abstracts of Reference Documents Discussing Vehicle Occupancy Data Collection... 9 Table 2 Abstracts of Reference Documents Reviewing Vehicle Occupancy Data Collection Techniques Table 3 Destination Area Trips by Trip Purpose Attracted and Parking Charge Table 4 Samples Required for Differing Levels of Precision and Confidence Table 5 Proposed Sample of Intercept Survey Questionnaires Table 6 Vehicle Occupancy Rates by Time of Day, Facility Type and Geographic Area Table 7 Regional Vehicle Occupancy Rates by Time of Day and Facility Type Table 8 Occupancy Rates for Carpools By Time of Day, Facility Type and Geographic Area Table 9 Table 10 Table 11 Percentages of Vehicles and Travelers by Vehicle Occupancy by Time of Day All Facilities in Region Percentages of Vehicles and Travelers by Vehicle Occupancy by Time of Day All Freeways in Region Percentages of Vehicles and Travelers by Vehicle Occupancy by Time of Day Arterials and Collectors Table 12 Com parison of Vehicle Occupancy Classifications and Occupancy Rates for Phoenix Table 13 Summary of Intercept Survey Questionnaires Distributed and Returned Table 14 Table 15 Number of Intercept Survey Responses by Category of Vehicle Occupant and Trip Purpose Percentages of Trips by Trip Purpose and Vehicle Occupancy by Num ber of Separate Households in Vehicle Table 16 Percentages of Served Households in Carpool Vehicles by Trip Purpose - Comparison of Drivers and Passengers Responses Table 17 Percentages of Numbers of Persons Dropped Off Before Vehicle Arrived At Survey Location by Trip Purpose Table 18 Distributions of Vehicle Occupancy by Household Income and Trip Purpose Table 19 Frequency of Making This Trip Table 20 Distance Walked From Parking Site to Destination Table 21 Cumulative Travel Distances by Trip Purpose and Category of Vehicle Occupancy Table 22 Cumulative Travel Times by Trip Purpose and Category of Vehicle Occupant Table 23 Possible Time Savings If Carpoolers Had Been Traveling Alone, by Trip Purpose Table 24 Daily Parking Costs By Vehicle Occupancy and Trip Purpose Table 25 Mode Split Equations for Phoenix Mode Choice Models Table 26 Com parison of Vehicle Occupancies for Downtown Phoenix Table 27 Comparison of Vehicle Occupancies By Area Type and Facility Type Table 28 Characteristics Typically Used To Explain Vehicle Occupancy iii
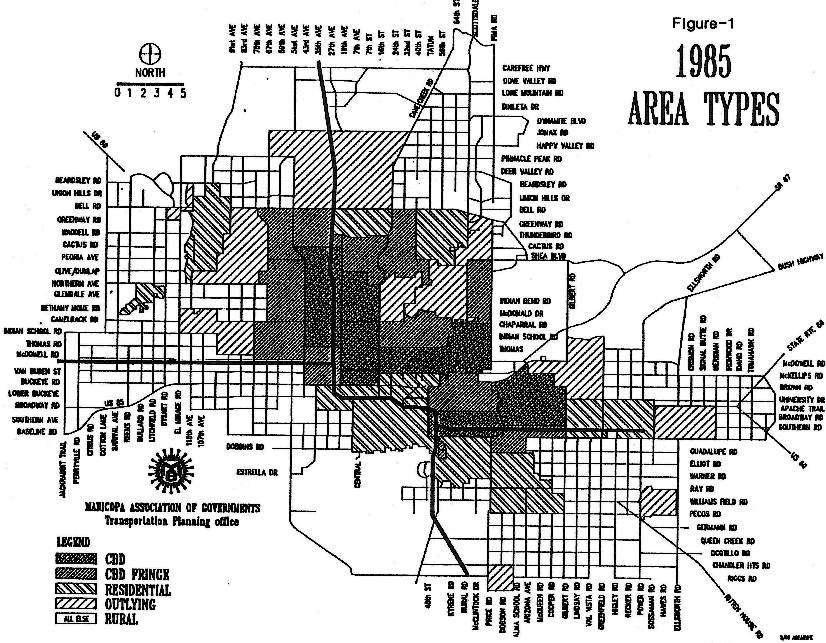
6 LIST OF FIGURES PAGE Figure Area Types (Used by MAGTPO) Figure 2 Vehicle Occupancy for all Roadways in Region Figure 3 Vehicle Occupancy in the Region by Facility Type Figure 4 Vehicle Occupancy for all Roadways by Area Type Figure 5 Vehicle Occupancy for all Freeways in Region Figure 6 Vehicle Occupancy for all Arterials and Collectors in Region iv
7 1. INTRODUCTION This report presents the results of a study of vehicle occupancy conducted in Phoenix, Arizona to determine what factors have the greatest influence on having persons travel together to make trips in private vehicles. In this report, the words vehicle occupancy will be the ones used to describe how many persons are being transported by the private vehicles counted or surveyed as traveling in different geographic areas, on different types of roadways, for different trip purposes or at different times of the day. The Maricopa Association of Governments, Transportation and Planning Office (MAGTPO) is responsible for developing and applying the travel demand forecasting models for the Phoenix metropolitan area. MAGTPO s forecasting models are used in a variety of ways by agencies engaged in transportation planning and project development activities. One of the primary uses of the models is to create forecasts of trips made in private vehicles or on transit during an average weekday or during the peak hour of travel. MAGTPO s travel forecasting models, like those used by other transportation planning agencies, are continuously undergoing refinements to incorporate the availability of additional data or to improve specific predictive capabilities. In previous work efforts, the MAGTPO models have been modified to reflect the results of a transit on-board survey and to account for external travel occurring in the Phoenix metropolitan area. 1 Increasing attention is being given in the Phoenix metropolitan area to the concept that carpooling is a mode of travel that should be considered as a way to address future transportation supply deficiencies. 2 An existing section of I-10 in Phoenix contains lanes reserved for high-occupancy vehicles, and those lanes are planned to be extended in conjunction with the construction of new freeways in the Phoenix metropolitan area. 3 1 External trips are classified as those with one trip end outside the region being modeled. On that basis, trips either beginning or ending outside the Phoenix metropolitan area would be classified as external trips. 2 The term carpooling, as used in this report, is defined as having persons travel together in the same vehicle to complete a journey. Carpooling is often called ridesharing in a broader context, to account for all of the different kinds of private vehicles that persons could be traveling in. 3 High-occupancy vehicles, called HOV s by transportation planners, include carpools, vanpools, buspools and regularly scheduled buses. The numbers of persons that must be traveling together in a private vehicle for that vehicle to be classified as an HOV is set by policy and can vary by facility or location. In some places an HOV may carry just 2 persons to be qualified to use lanes designated for use by HOV s, while in other places an HOV must carry three or more persons. 1
8 The mode choice model used by MAGTPO creates forecasts of trips made by persons driving together and by persons riding transit. 4 Characteristics of the households where trips originate, of the zones where trips are destined, and relative travel time and cost differences between modes are used to create the forecasts of persons traveling on each mode assumed to be available. 5 The equations that comprise the shared-ride mode choice model have been set up to incorporate variables related to characteristics of the origin zone, of the destination zone, and of the relative travel times and costs between origins and destinations. Although some data were available from vehicle occupancy counts and a household survey done in Phoenix, the coefficients incorporated into the MAGTPO mode choice equations were based on carpooling data from other metropolitan areas. 6 In summary, the current MAGTPO mode choice model has been calibrated to create regional forecasts of travel by persons driving alone and by persons sharing rides. With planning underway for additional HOV lanes, MAGTPO made the decision to review its mode choice model for ridesharing and incorporate into the modeling process local data about the characteristics of travelers or zones in the Phoenix metropolitan area that would reflect the propensity of persons to travel together. A. Purpose of Study The research described in this report was performed to develop information about which factors exert influence on or help determine the propensity of persons to travel together in private vehicles. Although the data were collected in the Phoenix metropolitan area for the purpose of refining the MAGTPO mode split model for vehicle trips, the conclusions reached in this study of vehicle occupancy are also intended to be checked against data from other metropolitan areas. (Vehicle occupancy is the term used throughout this report to encompass all discussions of persons traveling together in a private vehicle, and not just the calculation of persons traveling together per vehicle trip.) This study of factors at the origin and destination ends of trips that affect vehicle occupancy rates in the Phoenix metropolitan area was conducted to accomplish 4 The mode choice model creates forecasts of travel made during the average weekday or during a peak hour on each of the modes available in the region. 5 The regional forecasts of trips by mode are based on summing the mode split model s forecasts of trips made on each mode available between distinct origin and destination pairs of travel analysis zones. 6 Barton-Aschman Associates, Inc. Development and Calibration of Travel Demand Models for the Phoenix Area. June Pp
9 three major research and application objectives. The objectives of this study, which affected the design of the data collection efforts described in the next chapter, were as follows: 1. The primary objective of the study was to collect the data necessary to calibrate the shared-ride component of the mode choice model now used by the Maricopa Association of Governments, Transportation and Planning Office (MAGTPO), so as to have the model reflect carpooling characteristics occurring in the Phoenix metropolitan area. 2. Affiliated with the primary objective were the following technical objectives: S S S The research had to distinguish between vehicle occupancy determinators that can be directly affected by public policy and those that cannot. 7 (Vehicle occupancy determinators could be characteristics of the traveler, of the destination, or of the trip purpose that would determine if persons would travel together in a private vehicle.) The research had to provide information for a stratified sample of trip types in order to collect reliable statistics about vehicle occupancy rates and determinators for home-based-work, home-based other, and non-homebased trips. 8 The survey techniques had to be capable of being updated in an economical and consistent manner, such as in conjunction with the results of the next Census of Population. 3. The research was intended to describe the conclusions that can be transferred to other metropolitan areas, and the relations between the conclusions reached in this study and the findings reached about vehicle occupancy determinators in other metropolitan areas. 7 The term determinator, as used for this study, has the following meaning:high-occupancy vehicles, called HOV s by transportation planners, include carpools, vanpools, buspools and regularly scheduled buses. The numbers of persons that must be traveling together in a private vehicle for that vehicle to be classified as an HOV is set by policy and can vary that which determines or decides (what will happen). 8 Home-based-work trips are categorized as those made from the traveler s home directly to work and from their place of work directly back to home. Home-based-other trips are those trips made from the traveler s home to any destination other than work and from that destination back to home. Non-home-based trips are defined as those that neither end or begin at the traveler s home. The mode split model would be applied to create separate forecasts of persons driving alone or traveling together in private vehicles. Different vehicle occupancy rates are used to convert vehicle-person trips into vehicle trips by trip purpose. 3
10 B. Problem Statement Phoenix and other rapidly growing metropolitan areas are looking to a wide mix of transportation modes to provide additional capacity to serve travelers in the future. Some of the facilities planned for the Phoenix metropolitan area would provide travel time advantages to persons traveling in carpools of two or more in an attempt to transport more persons in fewer vehicles (i.e., increase vehicle occupancy rates). Transportation planners know that vehicle occupancy rates vary greatly by trip purpose, as does the propensity of persons from different households to travel together. The costs of the possible investments in busways and high-occupancyvehicle (HOV) lanes being considered in Phoenix require that local statistics be available to understand existing conditions and create more realistic simulations of future travel before additional decisions are made to determine which other policy actions could be implemented to increase vehicle occupancy rates. In order to satisfy the objectives described above, the following issues were addressed in accomplishing the work described in this report: 1. An accurate base of knowledge that could be used to describe and understand the existing characteristics of persons, particularly from different households, who travel together for different purposes in Phoenix did not exist. 2. The lack of information describing aspects of travel behavior affecting vehicle occupancy rates did not allow for a high level of confidence to be associated with directly comparing vehicle occupancy data for Phoenix and other metropolitan areas. Knowledge about existing vehicle occupancy characteristics was needed so that information could be used to establish possible changes in vehicle occupancy rates based on future investment and policy options. 3. Since a network of carpool lanes or other regional policy actions designed to increase vehicle occupancy rates do not exist in the Phoenix metropolitan area, surveys had to be designed to properly identify the determinators of vehicle occupancy required to create an accurate predictive model. 4. Although asking detailed survey questions about travelers attitudes and motivations may be of interest to some analysts, concentrating on the compilation of statistics about characteristics of the production end of trips (persons or households) and the attraction end of trips (land uses by geographic and other categories) has proved to be a more reliable and costeffective means of collecting the information required to create an accurate predictive model of vehicle occupancy rates. 4
11 5. Persons who travel in carpools, especially carpools involving members of more than one household, comprise a very small proportion of all travelers. For example, based on the results from surveys in various metropolitan areas, less than 20 percent of persons traveling to work will be sharing rides on any day, and less than 10 percent of all vehicles transporting persons to work will be a carpool or vanpool. Thus, the survey of Phoenix area residents had to be designed to generate sufficient valid responses from persons who are carpooling now. 9 C. Organization of this Report This report contains five chapters that have been used to describe the major milestones that occurred during the chronological course of this research into vehicle occupancy. Each chapter has the following purpose and contains the following subjects: I. Introduction. This chapter describes the reasons for undertaking the research. II. III. IV. Study Design. The assessment of data collection techniques was used to recommend the ways in which counts and surveys would be used to collect vehicle occupancy data in Phoenix. This chapter also describes the procedures that were used to count vehicles by occupancy rate and to conduct surveys of vehicle occupancy characteristics. Analysis of Data. The information collected from the counts and surveys is presented in this chapter, together with a comparison of the data collected in Phoenix with vehicle occupancy data collected previously in Phoenix and in other areas. Evaluation of Existing Vehicle Occupancy Models for Phoenix. The methodology used to evaluate the simulations of vehicle occupancy produced by the existing MAGTPO travel demand models is discussed in this chapter, as are the refinements recommended to enhance the model s capability to reflect changes in vehicle occupancy by time of day. V. Conclusions. The results of the data collection and analysis tasks are presented in this final chapter, as well as recommendations for further research into vehicle occupancy determinators. 9 Federal Highway Administration. Journey-to-Work Trends, (Based on 1960, 1979 and 1980 Decennial Censuses). July 1986, pp
12 2. STUDY DESIGN AND DATA COLLECTION PROCEDURES This chapter describes how the data collection procedures were defined and what data collection procedures were used to accomplish the objectives of this study. Ideas and suggestions about defining the procedures that should be used to collect vehicle occupancy data came from primarily two sources. First, a literature search was conducted to provide suggestions about optional ways of collecting data about vehicle occupancy. Second, discussions were held between the consultant and staff from MAGTPO, the Arizona Department of Transportation (ADOT) and the City of Phoenix to review the results of the literature search and to select the data collection procedures to be used in this study. Before the data collection tasks could begin, it was necessary to specify the types of data that would be required to refine the MAGTPO mode choice model for vehicle occupancy and to more directly relate the effects of certain variables on vehicle occupancy rates. The review of reference materials was used to ascertain what had been determined from research into vehicle occupancy done in other metropolitan areas, as well as to describe the different types of procedures that could be used to collect data about vehicle occupancy. One clear objective of the literature search was to develop a list of variables about which information would need to be gathered, so as to identify those variables that were likely to have the greatest influence on vehicle occupancy rates in Phoenix. Those variables would be called vehicle occupancy determinators, because the research would indicate that very strong correlations exist between those variables and a propensity to share rides. The following activities, which occurred during the design phase of the study, are discussed in this chapter: S S S S S S S defining the data items to be collected, identifying possible ways of collecting those data items, recommending the specific data collection procedures to be used in this study, designing the survey and count procedures to be used, pre-testing the survey, designing the final data collection procedures, and implementing the data collection procedures. While the literature search can be viewed as an activity separate from the rest of the design phase, what was learned from the review of other reports was used to reach 6
13 conclusions about most of the activities described above. Due to the importance that the literature search had on establishing the direction for this study, the results of that effort will be discussed first. A. Literature Search Even though the search for relevant reference materials was concentrated on finding technical reports describing how to conduct counts or surveys of vehicle occupancy, the literature search was not limited to those topics. Due to the many descriptive words that can be associated with the study of vehicle occupancy, the search for useful reference materials also produced a listing of references containing information about vehicle occupancy data, historical trends in vehicle occupancy rates, and descriptions of factors influencing vehicle occupancy. The subject of vehicle occupancy can be described using a wide variety of words including the following descriptors: vehicle occupancy, vehicle occupancy surveys, auto occupancy, carpooling and ridesharing. An initial review of the descriptors used by the Transportation Research Information Service (TRIS), was used to determine which descriptors should be mentioned in the search for relevant reference materials. 10 The results of that initial review were used to select those descriptors that should be used in the final, focused literature search, based on two objectives. The first objective was that the reference materials provide relevant assessments about how to collect data describing vehicle occupancy. The second objective was that the reference materials present information about other metropolitan areas that could be used to corroborate the conclusions reached by this research into vehicle occupancy in Phoenix. Based on those two objectives, the literature search was conducted by using the following descriptors to identify the reports most relevant to this research: vehicle occupancy and travel forecasting, and vehicle occupancy and transportation planning. The literature search revealed that while there have been numerous reports written to describe the results of counts or surveys of vehicle occupancy, very few reports have been written to describe the procedures that should be used to collect information about vehicle occupancy. Fewer than ten books or articles were found to provide guidance or insights about the issues that should be considered when designing data collection programs about vehicle occupancy. Since those reference materials were used to design the data collection procedures for this research, abstracts and syntheses of their most important subject matter are presented on the following pages. Other reference materials identified through the literature search - 10 TRIS was used because this database was developed by the Transportation Research Board to be the central source of transportation reference materials. Listings of reports and abstracts included in the TRIS database are provided by government agencies, universities and various planning and engineering journals. 7
14 those describing characteristics or data about vehicle occupancy - are presented and discussed in subsequent chapters of this report. The abstracts presented in Table 1 summarize those books and articles that were used to design the data collection procedures in this study. 11 The abstracts presented in Table 2 describe those reference materials used to confirm that the recommended data collection procedures would work correctly, i.e., that the desired information would be collected. B. Possible Data to be Collected Recommendations or conclusions presented in the reference sources listed in Tables 1 and 2 were used to assess the possible ways of collecting the data that could be used to prove linkages between certain factors and vehicle occupancy. Those possible data collection approaches are described on the next page, following the presentation of data variables that were nominated for consideration in this research. The review of the literature revealed that, while there is no unanimity about the variables that determine vehicle occupancy, there is wide agreement on the most likely factors. One reason why most analysts agree on the factors that are most important is that most analysts have searched for the same categories of factors. That is, the typical categories defined to analyze travel are arranged in the same manner as are the elements of a journey and describe the same kinds of characteristics represented by the typical mode choice model, as follows: 1. Characteristics of the trip origin, such as household size, household income, auto availability, and trip purpose at the origin of the trip. 2. Characteristics of the trip destination, such as parking cost and trip purpose at the destination of the trip; and 3. Comparison of travel modes, including comparisons of total travel time and costs required to accomplish the trip. Since the factors that may influence vehicle occupancy describe 1) conditions that exist where trips begin and end, 2) characteristics of the travelers and of the households where they live, and 3) the journeys that are made for different purposes at different times of day, data about vehicle occupancy could be collected a number of different ways. The benefits and costs of different data collection strategies are presented in the following pages to present the context for the data collection decisions made in this research project. 11 Abstracts for reference materials describing the results of studies analyzing data about vehicle occupancy are presented in Appendix A. Those reference materials were not used directly in this study, but are listed in Appendix A as a supplement to Tables 1 and 2. 8
15 TABLE 1 ABSTRACTS OF REFERENCE DOCUMENTS DISCUSSING VEHICLE OCCUPANCY DATA COLLECTION GUIDE FOR ESTIMATING URBAN VEHICLE CLASSIFICATION AND OCCUPANCY Ferlis, RA Peat, Marwick, Mitchell and Company, 1990 K Street, N.W., Washington, DC 20006; Federal Highway Administration Office of Highway Planning, th Street, SW Washington, DC March 1981, Final Report 60 p. REPORT NO: HS CONTRACT NO: DOT-FH SUBFILE: HRIS; HSL AVAILABLE FROM: National Technical Information Service, 5285 Port Royal Road, Springfield, Virginia This manual provides sampling and data collection procedures for field surveys that estimate vehicle classification and occupancy and (when combined with estimates of vehicle-miles of travel derived from parallel mechanical traffic counting programs) that estimate travel by vehicle type and person travel. Because sound statistical sampling techniques are used, these surveys can provide valid estimates at predetermined levels of precision and at the lowest possible cost. APPLICATIONS AND USE OF TRANSPORTATION DATA McLau, Mary, ed. Transportation Res. Board, 2101 Constitution Ave., N. W. Washington, DC , 440. REPORT NO: TRR-701; HS , includes HS HS SUBFILE: HSL AVAILABLE FROM : TRB Seven papers are compiled which individually cover the following aspects of transportation data collection and use: field data collection and sampling procedures for measuring regional vehicle classification and occupancy; research in the Seattle area on techniques for monitoring automobile occupancy; Georgia s evaluation of Federal Highway Administration procedures for estimating urban vehicle miles of travel; U.S. Census travel data for transportation planning; workplace interviews as an efficient source of travel survey data; design of small-sample home-interview travel surveys; and use of travel diaries in collecting travel data on elderly and handicapped persons. 9
16 TABLE 1 (Continued) ABSTRACTS OF REFERENCE DOCUMENTS DISCUSSING VEHICLE OCCUPANCY DATA COLLECTION GUIDE TO URBAN TRAFFIC VOLUME COUNTING Office of the Secretary of Transportation, th Street SW Washington, DC September 1981, 52 p. SUBFILE: HRIS; UMTRIS AVAILABLE FROM: Federal Highway Administration Office of Urban Planning, th Street, SW Washington, DC This report presents methods by which urbanized areas can develop and implement integrated traffic data counting programs to serve the volume data needs of all their agencies. The procedures presented complement the techniques for measuring vehicle type and occupancy presented in the Guide for Estimating Urban Vehicle Classification and Occupancy. Methods for estimating volume at a single location, volume across a particular cordonline, cutline, vehicle-miles traveled within a corridor, and regional vehicle-miles traveled are presented. Of particular value to transportation analysts in urban areas, these techniques permit collection of volume data at pre-determined levels of precision, and in a cost-effective manner. TRANSIT AND TRAFFIC ANALYSIS Carter, MM Transportation Research Board Transportation Research Board Special Report, No. 206, 1985 pp REPORT NO: Part V SUBFILE: HRIS AVAILABLE FROM: Transportation Research Board Publications Office, 2101 Constitution Avenue, NW Washington, DC Proceedings on the National Conference on Decennial Census Data for Transportation Planning, Orlando, Florida, December 9-12, Workshop Report. This workshop focused on those planning areas that are more near-term in nature, including short-range planning, operations impacts, and alternatives analyses. The workshop reviewed its findings for the 1980 UTPP (Urban Transportation Planning Package) and compared it with its expectations in the major areas of transportation planning. This paper presents a summary of the discussions in each of the following areas: updating urban and transportation planning data sets; model development, updating, and validation; rideshare data sets; special generator information; obtaining the work-trip file; transit market analysis; mode-of-access information; vehicle occupancy; residential and industrial development planning; and general observations. Detailed recommendations are presented on questionnaire content, procedures and sample size, geographic coding, data products and comparability. 10
17 TABLE 2 ABSTRACTS OF REFERENCE DOCUMENTS REVIEWING VEHICLE OCCUPANCY DATA COLLECTION TECHNIQUES ATLANTA VEHICLE OCCUPANCY MONITORING Fisher, RF; Williams, GJ; Boyd, JP (Georgia Department of Transportation; Atlanta Regional Commission) Transportation Research Board Transportation Research Record No. 779, 1980, pp SUBFILE: HRIS AVAILABLE FROM: Transportation Research Board Publications Office, 2101 Constitution Avenue, NW Washington, DC This report describes the implementation of a statistically defined survey technique for collecting vehicle classification and occupancy data in the Atlanta region. The paper describes the results of a stratified, areawide survey for collecting passenger occupancy rates. The potential movement of people provided by the capacity of the roadway system is virtually an untapped resource, according to the data collected for this study. Sponsored by the U.S. Department of Transportation, efforts are being made to improve the usefulness of passenger vehicles through current programs that include vanpooling, ridesharing programs, and park-and-ride lots. The success of these ventures, which are likely to become more significant in the future, can be measured by a dependable vehicleoccupancy monitoring program. This research has proved that the Guide for Estimating Urban Vehicle Classification and Occupancy provides a statistically acceptable method to measure vehicle occupancy rates. The minimum sample requirement for determining occupancy rates by area and facility type is desirable for an annual program of this nature. AUTO OCCUPANCY, VEHICLE TRIPS, AND TRIP PURPOSE; SOME FORECASTING PROBLEMS Ohstrom, EG; Stopher, PR (Humana Incorporated; Schimpeler-Corradino, Associates) Transportation Research Board Transportation Research Record No. 987, 1984, pp 8-13 REPORT NO: HS AVAILABLE FROM: Transportation Research Board, Publications Office, 2101 Constitution Avenue, NW Washington, DC The problems with estimating automobile occupancy by trip purpose for use in travel forecasting and in the policy decisions that frequently follow from forecasts are described. Investigations of data and development of logit models of mode choice reveal that the occupants of multi-occupant automobiles frequently have disparate trip purposes, even within the restricted trip-purpose definitions usually encountered in practical transportation planning. These disparate purposes mean that, although occupants can be classified by trip purpose, the automobile vehicle cannot be defined as being used for a single trip purpose, as it is necessary to compute accurately the automobile occupancy for a purpose and to convert automobile-person trips by purpose to automobile-vehicle trips for assignment of automobile vehicles to the highway network. This has serious repercussions on a variety of contemporary policy decisions. The problems are discussed, and some alternative procedures that can be used as a compromise computation of vehicle occupancy by purpose are given. The problems and solutions are demonstrated in the context of a case study. 11
18 C. Possible Survey Approaches Travel forecasting models typically compare the travel costs and times for three different trip purposes, and based on certain characteristics of the origin and destination of the simulated trips, create estimates of travel by mode. The model developed for and used by MAGTPO is of this type. Forecasts of trips generated by mode are created for home-based work (hbw), home-based-other (hbo), and non-home- based (nhb) trip purposes. Those forecasts are based on the simulated comparisons of in-vehicle and out-of-vehicle travel times and costs. Characteristics of the production ends of the travelers making the trips (household income stratifications and terminal times to reach the highway or transit network), and of the attraction ends of trips (terminal times and costs and general activity type stratifications) are also used. Finally, the travel time and cost characteristics of each network are used to forecast usage levels for persons driving their automobile without sharing that ride (drive alone), persons who are transporting passengers (shared-ride), and persons riding regularly scheduled transportation (transit). 12 Different data sources are required to calibrate travel models, because to have the various dependent components of the models replicate available information about existing conditions means that accurate and reliable information must be available. The decennial Census of Population through the Urban Transportation Planning Package (UTPP) provides a special tabulation of data derived from a subset of Census responses. UTPP reports can be used to describe the following types of information about travelers to places (zones) of employment or from places (zones) of residence: individual income, industry of employment, occupation, commuting mode, and travel time by commuting mode. Origin-destination matrices can be derived describing where groups of persons live and work, their commuting modes, and travel times by mode. Since those data are available down to the block-group level, there are typically sufficient data records to use in developing and calibrating work-travel models that may be reasonably accurate down to the level of transportation analysis zones. While good data are available on a recurring (five-or ten-year) basis for home-towork trips, similar data are not typically available for other trip purposes. Data describing home-base-other trips (trips that are usually related to work travel but that do not have home as a trip end) are most often derived from surveys of households. Those surveys, where persons from the selected sample of households are asked to describe their trips during a certain period of time (to create a travel diary), are very expensive to administer. Due to the high costs of household surveys (because of the need to gain the cooperation of a stratified sample of households), those surveys are done infrequently and typically include only sufficient households to derive trip-generation rates and origin-destination matrices for aggregations of transportation analysis zones. 12 Barton-Aschman Associates, Inc. Mode Choice Model Update for the Phoenix Region. March Pp
19 This research was initiated to determine if and how the MAGTPO travel model would need to be refined and calibrated to create more realistic forecasts of sharedride trips, i.e., to recommend if and how the coefficients of the model would be modified to create simulations of shared-ride travel that are sensitive to characteristics of households, destinations and transportation networks in the Phoenix metropolitan area. To decide what changes might need to be made, data would have to be collected describing the existing characteristics of persons, locations and trip purposes that could affect vehicle occupancy rates. The ways available to collect information about auto occupancy are described in the following paragraphs. Direct Observation. In this approach, vehicles in the traffic stream are observed and the frequencies of vehicle occupancies are recorded by time period. An unbiased estimate of the mean auto occupancy and the standard deviation of the mean can be obtained from a random sample of locations from which auto occupancies are recorded. This method can provide frequency distributions of car occupancy by time of day. However, these counts of private vehicles carrying different numbers of persons do not provide car occupancy rates by purpose of trip, length of trip, income of travelers, or parking costs of the trip. Those data would be needed to verify why vehicle occupancy rates change by time of day and by other characteristics of journeys and travelers making each journey. Interview Travelers at Their Residence Home Interview. This is a standard data collection procedure that has been used for decades in transportation planning. Individual travelers are contacted at their place of residence via an interview to obtain travel data for a typical day. Statistically reliable data on vehicle occupancy can be obtained for relatively small sample surveys, such as 1,000 households. Moreover, those data can be stratified by trip purpose, cars owned, trip length, income and other characteristics. However, most origin-destination (O-D) surveys have not reliably collected data on persons traveling in the same vehicle, but who are from different households. The utility of the home interview survey as a basis for vehicle occupancy data is further limited by the fact that multi-passenger auto trips are relatively infrequent when compared to drive-alone auto travel. For home-based work trips, interviews would have to occur with over 90 auto drivers making a work trip before finding one drive in a vehicle with two or more passengers. To find that at least one of the travelers in a vehicle with two or more passengers was from a different household than the driver would require over 95 interviews. Survey of Travelers at Place of Destination. Yet another survey approach would be to interview travelers at the destination (attraction) end of their trip. One could survey establishments--shopping centers, office buildings, manufacturing plants, 13
20 etc. As travelers approach or enter an establishment or site, they could be interviewed and given a self-enumeration questionnaire. The approach would yield data that could be weighted by establishment type and employment size, i.e., an unbiased estimate of car occupancy could be made from the data collected in such a survey. The liabilities of this approach are much the same as those of the home interview that travelers from different households are not linked. In addition, the frequency of multi-passenger vehicles is usually so low that a very large number of questionnaires would need to be distributed to obtain a statistically significant sample of multi-passenger vehicles. Since the vehicle would not be observed in this approach, one could not vary the sample rate according to the number of passengers in the vehicle. After considering possible ways of collecting the information required to refine the MAGTPO travel model, the following conclusions were reached: 1. Surveys of households would not be cost-effective, because of the high costs involved to generate a statistically valid sample, and the difficulty in getting reliable information for a wide variety of trips. 2. Roadside surveys would not be cost-effective, because as shared-ride trips make up only a small proportion of all vehicle trips, a large number of drivers would have to be inconvenienced in order to find persons sharing rides. In addition, the roadway is not a rational unit to be used for factoring, nor would roadside surveys be statistically valid at the destination end. D. Data Collection Procedures Initially Recommended After considering the possible data collection options, the decision was made to undertake a sample survey of vehicles arriving at a sample of destinations and to take sample counts to determine vehicle occupancy rates by trip purpose and provide data required for validation of the refined MAGTPO carpool mode-split model. Vehicle occupancy rates by trip purpose were to be derived from a sample survey of vehicles arriving at a sample of parking lots and garages. Data on vehicle occupancy by time of day by geographic area and highway facility type were to be collected from counts of vehicles stratified by occupancy taken at a sample of locations. The two procedures are described below. 1. Direct Observation of Vehicle Occupancy Rates The first type of data collection would require direct observation (counts) of levels of car occupancy at a sample of locations in the Phoenix metropolitan area. Those observations would be stratified by geographic area and highway facility type. In this type of count, the frequencies of private vehicles transporting one, two, three, four, five and six or more persons were to be recorded at each of the sample locations. (Private vehicles would include automobiles, vans, and trucks.) 14
21 The initial definition of procedures was that the surveyor(s) would begin work at each location at 7:00 AM and count vehicles until 11:00 AM. After going to lunch, the surveyor(s) would resume counting vehicles at 12:30 PM and continue until 2:30 PM. After taking another break, the surveyor(s) would resume counting vehicles at 3:30 PM and continue counting until 5:30 PM. The total of eight hours of observation would have provided vehicle-occupancy data for a two-hour AM peak period (7:00-9:00 AM), a four-hour midday period (9:00 AM - 11:00 AM and 12:30-2:30 PM), and a two-hour PM peak period (3:30-5:30 PM). 13 A systematic short-count procedure, in which observations are made for a fixed interval in each hour of the day, was to be used to enhance the potential for producing relatively accurate daily estimates, while conserving manpower resources. The following three basic types of short-count procedures were considered: Using one or more surveyors to count all vehicles that pass by during a fixed interval within each hour (e.g., count for 45 minutes and rest for 15 minutes, thus representing a 75 percent systematic sample). 2. Using one surveyor to count vehicles that pass by on each lane during a fixed interval within each hour (e.g., count each of three lanes during successive 15-minute periods and rest for 15 minutes within each hour, thus representing a 25 percent systematic sample). 3. Using one or more surveyors to systematically observe two or more locations concurrently by counting all vehicles passing a particular location during the same time interval within each hour (e.g., count vehicles at one location from 7:00 to 7:45, etc., thus representing a 25 percent systematic sample). Sampling Approach. The sampling approach was designed on the basis of the link-day as the sampling unit. 15 A link-day represents the combination of a particular roadway segment and the number of hours of surveying that would occur in a day. To accomplish an areawide survey, such as this one, would involve the random selection of links in the regional highway network and the selection of data that would be collected on the selected links. 13 The final procedures adopted for the counts are different than those described here, and are presented on page Ferris, RA., Office of Highway Planning, Federal Highway Administration, Guide for estimating Urban Vehicle Classification and Occupancy, March 1981, pp Op. cit., p 7 15
22 Sample Size. The sample size of link-days needed to estimate average vehicle occupancy was computed as follows: 16 N = Z 2 x SO 2 DOCC 2 Where: DOCC = Desired tolerance, or the acceptable difference between the estimated average occupancy and the true value. SO = Composite standard deviation of average occupancy. Z = Normal variant for the specific level of confidence, two-tailed test (i.e,. as represented in standard tables) N = Number of link-days of data collection required. In turn, the composite standard deviation was based on the following formula: where: SO = (SOL 2 +SOS 2 +SOW 2 )1/2 SOL = Standard deviation of average occupancy across link-days within a season. SOS = Standard deviation of average occupancy across seasons. SOW = Standard deviation of average occupancy across time periods during a day resulting from use of short-counts. Using recommended values for SOL, SOS, and SOW of.063,.015, and , yielded SO = Therefore, the following sample sizes would be required, depending on the desired confidence level and tolerance: Tolerance Confidence Level Sample Size Confidence Level Samples Size ±.02 95% 43 90% 30 ±.03 95% 19 90% 13 ±.04 95% 11 90% 8 ±.05 95% 7 90% 5 16 Op. cit., p Ibid. 16
23 The observations of vehicle occupancy would be stratified geographically and by highway facility type. The classification of geographic areas would be CBD and fringe, urban, and suburban and rural. On the basis of definitions established by MAGTPO for modeling purposes, the geographic stratifications would include the following area types: CBD and fringe Area Types 1 and 2, Urban Area Type 3, and Suburban and rural area types 4 and Figure 1 shows the Area Types defined for travel forecasting (modeling) purposes in the Phoenix metropolitan area. Within each geographic area, the observations would be stratified into the following two facility types: freeways and expressways, and arterials (primary and secondary) and collectors. On the basis of the variability estimates cited in the Guide for Estimating Urban Vehicle Classification and Occupancy, a very small sample would provide an overall estimate of car occupancy with a very small sampling error at the 90 percent confidence level. Assuming a standard deviation of.067 and a mean vehicle occupancy of 1.3 for the Phoenix metropolitan area, the sampling error for alternative samples was calculated. Since a stratification by three area types and two facility types was desired, the sample sizes would be 12, 18, 24, 30...N (at least 2 samples per cell are required to estimate variance). The standard error for sample sizes ranging between 12 and 36 samples was calculated and was found to be very small because the estimated standard deviation of.067 is only 5.1 percent of mean of After discussions were held between the consultant and staff from the Arizona Department of Transportation, the decision was made to accept the recommendation that 30 count locations be selected in addition to the six count locations in the Phoenix metropolitan area where counts of car occupancy were taken in the last five years. The sample of 36 count locations would yield a calculation of actual overall vehicle occupancy rates in Phoenix with a very small estimate of sampling error, while including the six previous count locations would provide for continuity in analyzing those vehicle occupancy counts. (The new count locations were to be selected randomly using the MAGTPO highway network in which links are stratified by area type and facility type. How that was done is explained on page Barton-Aschman Associates, Inc., for Maricopa Association of Governments Transportation and Planning Office, Development and Calculation of Travel Models for the Phoenix Area, June 1984, Appendix B, pp The formula presented on page 16, N = Z 2 *SOCC 2 DOCC 2 was used to calculate that the standard error would be ±0.15 with a sample size of 12 locations and ±0.085 with a sample size of 36 locations, with Z = 2 (at the 95 percent confidence level). 17
24 2. Sample Survey of Arriving Vehicles The second survey required for this study of vehicle occupancy determinators in Phoenix was the intercept survey of arriving vehicles. This survey type was selected in order to be able to find high-occupancy vehicles in quantities sufficient for purposes of statistical accuracy, without having to interview an enormous number of persons driving alone. (Another major factor favoring the intercept type of interview is the fact that it provides access to ride-sharing passengers from households other than the household of the driver. Assembling those ridesharing households in a telephone interview survey would be an almost impossible task.) Each of the occupants of the vehicle included in the intercept sample would receive a self-enumeration questionnaire to fill out and mail back or return directly to the surveyor at the sample site. (For some garages or lots, it was thought possible that the surveyors would be able to accept the completed questionnaire when the driver and passengers would be returning to their cars to proceed to their next destination. Some occupants of sampled vehicles were also expected to complete their questionnaires immediately and turn the completed questionnaires directly back to the surveyor). Distribution of surveys would not need to occur throughout the day in order to compile the required sample at each type of parking space. Analysis of parking accumulation data indicated that 100 percent of the vehicles arriving to park at a garage or lot associated with a particular land use arrive by the following times: at offices by 10:00 AM, and at retail centers by 1:00 PM on weekdays and by 3:00 PM on Saturdays. 20 (Those times are not presented to indicate that there will be no parking turnover, but that a survey of office-related parking can be concentrated in the morning hours and of retail-related parking in the mid-day hours.) Conducting the intercept surveys of vehicles arriving at parking lots or garages could have taken place at a variety of different types of sites. Before deciding where to conduct the surveys, the data collection needs of this research were compared against the likely attributes of different types of destinations to identify those attributes that could most directly affect vehicle occupancy. One piece of information that proved very useful was an array of destination types against trip purposes likely to occur there. As shown in Table 3, that array showed that while there are many different types of destination areas that would attract persons traveling for work-related and non-work trips, parking costs would only be likely to occur at a much smaller number of destinations. As this variable was considered to be one of the most important ones affecting vehicle occupancy, the list of destination types to be possibly surveyed was greatly reduced. 20 Barton-Aschman Associates, Inc., for Urban Land Institute, Shared Parking Study, June 1983, pages 19 and
25 19
FHWA/IN/JTRP-2000/23. Final Report. Sedat Gulen John Nagle John Weaver Victor Gallivan
 FHWA/IN/JTRP-2000/23 Final Report DETERMINATION OF PRACTICAL ESALS PER TRUCK VALUES ON INDIANA ROADS Sedat Gulen John Nagle John Weaver Victor Gallivan December 2000 Final Report FHWA/IN/JTRP-2000/23 DETERMINATION
The Value of Travel-Time: Estimates of the Hourly Value of Time for Vehicles in Oregon 2007
 The Value of Travel-Time: Estimates of the Hourly Value of Time for Vehicles in Oregon 2007 Oregon Department of Transportation Long Range Planning Unit June 2008 For questions contact: Denise Whitney
Travel Demand Modeling at NCTCOG
 Travel Demand Modeling at NCTCOG Arash Mirzaei North Central Texas Council Of Governments for Southern Methodist University The ASCE Student Chapter October 24, 2005 Contents NCTCOG DFW Regional Model
HAS MOTORIZATION IN THE U.S. PEAKED? PART 2: USE OF LIGHT-DUTY VEHICLES
 UMTRI-2013-20 JULY 2013 HAS MOTORIZATION IN THE U.S. PEAKED? PART 2: USE OF LIGHT-DUTY VEHICLES MICHAEL SIVAK HAS MOTORIZATION IN THE U.S. PEAKED? PART 2: USE OF LIGHT-DUTY VEHICLES Michael Sivak The University
Missouri Seat Belt Usage Survey for 2017
 Missouri Seat Belt Usage Survey for 2017 Conducted for the Highway Safety & Traffic Division of the Missouri Department of Transportation by The Missouri Safety Center University of Central Missouri Final
National Household Travel Survey Add-On Use in the Des Moines, Iowa, Metropolitan Area
 National Household Travel Survey Add-On Use in the Des Moines, Iowa, Metropolitan Area Presentation to the Transportation Research Board s National Household Travel Survey Conference: Data for Understanding
Development of the Idaho Statewide Travel Demand Model Trip Matrices Using Cell Phone OD Data and Origin Destination Matrix Estimation
 Portland State University PDXScholar TREC Friday Seminar Series Transportation Research and Education Center (TREC) 10-24-2016 Development of the Idaho Statewide Travel Demand Model Trip Matrices Using
UTA Transportation Equity Study and Staff Analysis. Board Workshop January 6, 2018
 UTA Transportation Equity Study and Staff Analysis Board Workshop January 6, 2018 1 Executive Summary UTA ranks DART 6 th out of top 20 Transit Agencies in the country for ridership. UTA Study confirms
Public Transit in America:
 Public Transit in America: Findings from the 1995 Nationwide Personal Transportation Survey September 1998 Center for Urban Transportation Research University of South Florida 4202 East Fowler Avenue,
National Center for Statistics and Analysis Research and Development
 U.S. Department of Transportation National Highway Traffic Safety Administration DOT HS 809 271 June 2001 Technical Report Published By: National Center for Statistics and Analysis Research and Development
Downtown Lee s Summit Parking Study
 Downtown Lee s Summit Parking Study As part of the Downtown Lee s Summit Master Plan, a downtown parking and traffic study was completed by TranSystems Corporation in November 2003. The parking analysis
Speed Evaluation Saw Mill Drive
 Speed Evaluation Saw Mill Drive Prepared for: Mount Laurel Township Burlington County, New Jersey Prepared by: Dana Litwornia Litwornia & Associates, Inc. Transportation, Traffic & Environmental Engineering
Where are the Increases in Motorcycle Rider Fatalities?
 Where are the Increases in Motorcycle Rider Fatalities? Umesh Shankar Mathematical Analysis Division (NPO-121) Office of Traffic Records and Analysis National Center for Statistics and Analysis National
4 COSTS AND OPERATIONS
 4 COSTS AND OPERATIONS 4.1 INTRODUCTION This chapter summarizes the estimated capital and operations and maintenance (O&M) costs for the Modal and High-Speed Train (HST) Alternatives evaluated in this
KENTUCKY TRANSPORTATION CENTER
 Research Report KTC-08-10/UI56-07-1F KENTUCKY TRANSPORTATION CENTER EVALUATION OF 70 MPH SPEED LIMIT IN KENTUCKY OUR MISSION We provide services to the transportation community through research, technology
EXECUTIVE SUMMARY. Introduction
 EXECUTIVE SUMMARY Introduction The purpose of this study is to ensure that the Village, in cooperation and coordination with the Downtown Management Corporation (DMC), is using best practices as they plan
DRIVER SPEED COMPLIANCE WITHIN SCHOOL ZONES AND EFFECTS OF 40 PAINTED SPEED LIMIT ON DRIVER SPEED BEHAVIOURS Tony Radalj Main Roads Western Australia
 DRIVER SPEED COMPLIANCE WITHIN SCHOOL ZONES AND EFFECTS OF 4 PAINTED SPEED LIMIT ON DRIVER SPEED BEHAVIOURS Tony Radalj Main Roads Western Australia ABSTRACT Two speed surveys were conducted on nineteen
Denver Car Share Program 2017 Program Summary
 Denver Car Share Program 2017 Program Summary Prepared for: Prepared by: Project Manager: Malinda Reese, PE Apex Design Reference No. P170271, Task Order #3 January 2018 Table of Contents 1. Introduction...
Funding Scenario Descriptions & Performance
 Funding Scenario Descriptions & Performance These scenarios were developed based on direction set by the Task Force at previous meetings. They represent approaches for funding to further Task Force discussion
Technical Memorandum Analysis Procedures and Mobility Performance Measures 100 Most Congested Texas Road Sections What s New for 2015
 Technical Memorandum Analysis Procedures and Mobility Performance Measures 100 Most Congested Texas Road Sections Prepared by Texas A&M Transportation Institute August 2015 This memo documents the analysis
Trip Generation and Parking Study New Californian Apartments, Berkeley
 Trip Generation and Parking Study New Californian Apartments, Berkeley Institute of Transportation Engineers University of California, Berkeley Student Chapter Spring 2012 Background The ITE Student Chapter
TEXAS CITY PARK & RIDE RIDERSHIP ANALYSIS
 TEXAS CITY PARK & RIDE RIDERSHIP ANALYSIS This document reviews the methodologies and tools used to calculate the projected ridership and parking space needs from the proposed Texas City Park & Ride to
More persons in the cars? Status and potential for change in car occupancy rates in Norway
 Author(s): Liva Vågane Oslo 2009, 57 pages Norwegian language Summary: More persons in the cars? Status and potential for change in car occupancy rates in Norway Results from national travel surveys in
CITY OF EDMONTON COMMERCIAL VEHICLE MODEL UPDATE USING A ROADSIDE TRUCK SURVEY
 CITY OF EDMONTON COMMERCIAL VEHICLE MODEL UPDATE USING A ROADSIDE TRUCK SURVEY Matthew J. Roorda, University of Toronto Nico Malfara, University of Toronto Introduction The movement of goods and services
CO 2 Emissions: A Campus Comparison
 Journal of Service Learning in Conservation Biology 3:4-8 Rachel Peacher CO 2 Emissions: A Campus Comparison Abstract Global warming, little cash inflow, and over-crowded parking lots are three problems
Alpine Highway to North County Boulevard Connector Study
 Alpine Highway to North County Boulevard Connector Study prepared by Avenue Consultants March 16, 2017 North County Boulevard Connector Study March 16, 2017 Table of Contents 1 Summary of Findings... 1
Travel Time Savings Memorandum
 04-05-2018 TABLE OF CONTENTS 1 Background 3 Methodology 3 Inputs and Calculation 3 Assumptions 4 Light Rail Transit (LRT) Travel Times 5 Auto Travel Times 5 Bus Travel Times 6 Findings 7 Generalized Cost
Development of Turning Templates for Various Design Vehicles
 Transportation Kentucky Transportation Center Research Report University of Kentucky Year 1991 Development of Turning Templates for Various Design Vehicles Kenneth R. Agent Jerry G. Pigman University of
Parks and Transportation System Development Charge Methodology
 City of Sandy Parks and Transportation System Development Charge Methodology March, 2016 Background In order to implement a City Council goal the City of Sandy engaged FCS Group in January of 2015 to update
Office of Transportation Bureau of Traffic Management Downtown Parking Meter District Rate Report
 Office of Transportation Bureau of Traffic Management 1997 Downtown Parking Meter District Rate Report Introduction The City operates approximately 5,600 parking meters in the core area of downtown. 1
Oregon DOT Slow-Speed Weigh-in-Motion (SWIM) Project: Analysis of Initial Weight Data
 Project: Analysis of Initial Weight Data") Portland State University PDXScholar Center for Urban Studies Publications and Reports Center for Urban Studies 7-1997 Oregon DOT Slow-Speed Weigh-in-Motion (SWIM) Project: Analysis of Initial Weight Data
Portland State University PDXScholar Center for Urban Studies Publications and Reports Center for Urban Studies 7-1997 Oregon DOT Slow-Speed Weigh-in-Motion (SWIM) Project: Analysis of Initial Weight Data
HAS MOTORIZATION IN THE U.S. PEAKED? PART 5: UPDATE THROUGH 2012
 UMTRI-2014-11 APRIL 2013 HAS MOTORIZATION IN THE U.S. PEAKED? PART 5: UPDATE THROUGH 2012 MICHAEL SIVAK HAS MOTORIZATION IN THE U.S. PEAKED? PART 5: UPDATE THROUGH 2012 Michael Sivak The University of
HAS MOTORIZATION IN THE U.S. PEAKED? PART 9: VEHICLE OWNERSHIP AND DISTANCE DRIVEN, 1984 TO 2015
 SWT-2017-4 FEBRUARY 2017 HAS MOTORIZATION IN THE U.S. PEAKED? PART 9: VEHICLE OWNERSHIP AND DISTANCE DRIVEN, 1984 TO 2015 MICHAEL SIVAK SUSTAINABLE WORLDWIDE TRANSPORTATION HAS MOTORIZATION IN THE U.S.
June Safety Measurement System Changes
 June 2012 Safety Measurement System Changes The Federal Motor Carrier Safety Administration s (FMCSA) Safety Measurement System (SMS) quantifies the on-road safety performance and compliance history of
Passenger seat belt use in Durham Region
 Facts on Passenger seat belt use in Durham Region June 2017 Highlights In 2013/2014, 85 per cent of Durham Region residents 12 and older always wore their seat belt when riding as a passenger in a car,
Introduction and Background Study Purpose
 Introduction and Background The Brent Spence Bridge on I-71/75 across the Ohio River is arguably the single most important piece of transportation infrastructure the Ohio-Kentucky-Indiana (OKI) region.
Transportation Statistical Data Development Report BAY COUNTY 2035 LONG RANGE TRANSPORTATION PLAN
 Transportation Statistical Data Development Report BAY COUNTY 2035 LONG RANGE TRANSPORTATION PLAN Prepared for Bay County Transportation Planning Organization and The Florida Department of Transportation,
The Case for. Business. investment. in Public Transportation
 The Case for Business investment in Public Transportation Introduction Public transportation is an enterprise with expenditure of $55 billion in the United States. There has been a steady growth trend
Executive Summary. Draft Environmental Impact Statement/Environmental Impact Report ES-1
 Executive Summary Introduction The Eastside Transit Corridor Phase 2 Project is a vital public transit infrastructure investment that would provide a transit connection to the existing Metro Gold Line
Wellington Transport Strategy Model. TN19.1 Time Period Factors Report Final
 Wellington Transport Strategy Model TN19.1 Time Period Factors Report Final Wellington Transport Strategy Model Time Period Factors Report Final July 2003 prepared for Greater Wellington The Regional Council
Who has trouble reporting prior day events?
 Vol. 10, Issue 1, 2017 Who has trouble reporting prior day events? Tim Triplett 1, Rob Santos 2, Brian Tefft 3 Survey Practice 10.29115/SP-2017-0003 Jan 01, 2017 Tags: missing data, recall data, measurement
CITY OF VANCOUVER ADMINISTRATIVE REPORT
 Supports Item No. 1 T&T Committee Agenda May 13, 2008 CITY OF VANCOUVER ADMINISTRATIVE REPORT Report Date: April 29, 2008 Author: Don Klimchuk Phone No.: 604.873.7345 RTS No.: 07283 VanRIMS No.: 13-1400-10
Parking Management Element
 Parking Management Element The State Transportation Planning Rule, adopted in 1991, requires that the Metropolitan Planning Organization (MPO) area implement, through its member jurisdictions, a parking
Parking Pricing As a TDM Strategy
 Parking Pricing As a TDM Strategy Wei-Shiuen Ng Postdoctoral Scholar Precourt Energy Efficiency Center Stanford University ACT Northern California Transportation Research Symposium April 30, 2015 Parking
Energy Technical Memorandum
 Southeast Extension Project Lincoln Station to RidgeGate Parkway Prepared for: Federal Transit Administration Prepared by: Denver Regional Transportation District May 2014 Table of Contents Page No. Chapter
Michigan/Grand River Avenue Transportation Study TECHNICAL MEMORANDUM #18 PROJECTED CARBON DIOXIDE (CO 2 ) EMISSIONS
 EMISSIONS") TECHNICAL MEMORANDUM #18 PROJECTED CARBON DIOXIDE (CO 2 ) EMISSIONS Michigan / Grand River Avenue TECHNICAL MEMORANDUM #18 From: URS Consultant Team To: CATA Project Staff and Technical Committee Topic:
TECHNICAL MEMORANDUM #18 PROJECTED CARBON DIOXIDE (CO 2 ) EMISSIONS Michigan / Grand River Avenue TECHNICAL MEMORANDUM #18 From: URS Consultant Team To: CATA Project Staff and Technical Committee Topic:
LONG RANGE PERFORMANCE REPORT. Study Objectives: 1. To determine annually an index of statewide turkey populations and production success in Georgia.
 State: Georgia Grant Number: 8-1 Study Number: 6 LONG RANGE PERFORMANCE REPORT Grant Title: State Funded Wildlife Survey Period Covered: July 1, 1998 - June 30, 1999 Study Title: Wild Turkey Production
PARKING OCCUPANCY IN WINDSOR CENTER
 PARKING OCCUPANCY IN WINDSOR CENTER TOWN OF WINDSOR, CONNECTICUT REPORT JUNE 2017 CONTENTS Background... 3 Other Relevant Data... 3 Parking Survey Design... 6 Parking Supply Inventory... 6 Parking Demand
TRAFFIC SIMULATION IN REGIONAL MODELING: APPLICATION TO THE INTERSTATEE INFRASTRUCTURE NEAR THE TOLEDO SEA PORT
 MICHIGAN OHIO UNIVERSITY TRANSPORTATION CENTER Alternate energy and system mobility to stimulate economic development. Report No: MIOH UTC TS41p1-2 2012-Final TRAFFIC SIMULATION IN REGIONAL MODELING: APPLICATION
KANSAS Occupant Protection Observational Survey Supplementary Analyses Summer Study
 KANSAS Occupant Protection Observational Survey Supplementary Analyses 2018 Summer Study Submitted To: Kansas Department of Transportation Bureau of Transportation Safety and Technology Prepared by: DCCCA
TRAVEL DEMAND FORECASTS
 Jiangxi Ji an Sustainable Urban Transport Project (RRP PRC 45022) TRAVEL DEMAND FORECASTS A. Introduction 1. The purpose of the travel demand forecasts is to assess the impact of the project components
LONG RANGE PERFORMANCE REPORT. Study Objectives: 1. To determine annually an index of statewide turkey populations and production success in Georgia.
 State: Georgia Grant Number: 08-953 Study Number: 6 LONG RANGE PERFORMANCE REPORT Grant Title: State Funded Wildlife Survey Period Covered: July 1, 2010 - June 30, 2011 Study Title: Wild Turkey Production
Policy Note. Vanpools in the Puget Sound Region The case for expanding vanpool programs to move the most people for the least cost.
 Policy Note Vanpools in the Puget Sound Region The case for expanding vanpool programs to move the most people for the least cost Recommendations 1. Saturate vanpool market before expanding other intercity
Mobile Area Transportation Study Urban Area and Planning Boundary
 Mobile Origin- Destination Study Mobile Origin- Destination Study Trip Distribution Calibration WHY? Some background on Mobile Long Range Transportation Plan Crash course in travel demand forecasting HOW?
DEVELOPMENT OF RIDERSHIP FORECASTS FOR THE SAN BERNARDINO INFRASTRUCTURE IMPROVEMENT STUDY
 APPENDIX 1 DEVELOPMENT OF RIDERSHIP FORECASTS FOR THE SAN BERNARDINO INFRASTRUCTURE IMPROVEMENT STUDY INTRODUCTION: This Appendix presents a general description of the analysis method used in forecasting
CHARACTERIZATION AND DEVELOPMENT OF TRUCK LOAD SPECTRA FOR CURRENT AND FUTURE PAVEMENT DESIGN PRACTICES IN LOUISIANA
 CHARACTERIZATION AND DEVELOPMENT OF TRUCK LOAD SPECTRA FOR CURRENT AND FUTURE PAVEMENT DESIGN PRACTICES IN LOUISIANA LSU Research Team Sherif Ishak Hak-Chul Shin Bharath K Sridhar OUTLINE BACKGROUND AND
CHAPTER 7: EMISSION FACTORS/MOVES MODEL
 CHAPTER 7: EMISSION FACTORS/MOVES MODEL 7.1 Overview This chapter discusses development of the regional motor vehicle emissions analysis for the North Central Texas nonattainment area, including all key
HAS MOTORIZATION IN THE U.S. PEAKED? PART 10: VEHICLE OWNERSHIP AND DISTANCE DRIVEN, 1984 TO 2016
 SWT-2018-2 JANUARY 2018 HAS MOTORIZATION IN THE U.S. PEAKED? PART 10: VEHICLE OWNERSHIP AND DISTANCE DRIVEN, 1984 TO 2016 MICHAEL SIVAK SUSTAINABLE WORLDWIDE TRANSPORTATION HAS MOTORIZATION IN THE U.S.
WLTP DHC subgroup. Draft methodology to develop WLTP drive cycle
 WLTP DHC subgroup Date 30/10/09 Title Working paper number Draft methodology to develop WLTP drive cycle WLTP-DHC-02-05 1.0. Introduction This paper sets out the methodology that will be used to generate
CHAPTER 9. PARKING SUPPLY
 CHAPTER 9. PARKING SUPPLY The goal of this chapter is to provide City and University decision-makers with information about Study Area parking that can be used to determine the amount of parking that should
Abstract. Executive Summary. Emily Rogers Jean Wang ORF 467 Final Report-Middlesex County
 Emily Rogers Jean Wang ORF 467 Final Report-Middlesex County Abstract The purpose of this investigation is to model the demand for an ataxi system in Middlesex County. Given transportation statistics for
Linking the Virginia SOL Assessments to NWEA MAP Growth Tests *
 Linking the Virginia SOL Assessments to NWEA MAP Growth Tests * *As of June 2017 Measures of Academic Progress (MAP ) is known as MAP Growth. March 2016 Introduction Northwest Evaluation Association (NWEA
Transportation Demand Management Element
 Transportation Demand Management Element Over the years, our reliance on the private automobile as our primary mode of transportation has grown substantially. Our dependence on the automobile is evidenced
Executive Summary. Treasure Valley High Capacity Transit Study Priority Corridor Phase 1 Alternatives Analysis October 13, 2009.
 Treasure Valley High Capacity Transit Study Priority Corridor Phase 1 Alternatives Analysis October 13, 2009 Background As the Treasure Valley continues to grow, high-quality transportation connections
REMOTE SENSING DEVICE HIGH EMITTER IDENTIFICATION WITH CONFIRMATORY ROADSIDE INSPECTION
 Final Report 2001-06 August 30, 2001 REMOTE SENSING DEVICE HIGH EMITTER IDENTIFICATION WITH CONFIRMATORY ROADSIDE INSPECTION Bureau of Automotive Repair Engineering and Research Branch INTRODUCTION Several
IV. ENVIRONMENTAL IMPACT ANALYSIS K.2. PARKING
 IV. ENVIRONMENTAL IMPACT ANALYSIS K.2. PARKING ENVIRONMENTAL SETTING The following analysis summarizes the findings and conclusions of the Traffic Analysis (Traffic Study), prepared by The Mobility Group,
An Evaluation of the Relationship between the Seat Belt Usage Rates of Front Seat Occupants and Their Drivers
 An Evaluation of the Relationship between the Seat Belt Usage Rates of Front Seat Occupants and Their Drivers Vinod Vasudevan Transportation Research Center University of Nevada, Las Vegas 4505 S. Maryland
RTID Travel Demand Modeling: Assumptions and Method of Analysis
 RTID Travel Demand Modeling: Assumptions and Method of Analysis Overall Model and Scenario Assumptions The Puget Sound Regional Council s (PSRC) regional travel demand model was used to forecast travel
The 1997 U.S. Residential Energy Consumption Survey s Editing Experience Using BLAISE III
 The 997 U.S. Residential Energy Consumption Survey s Editing Experience Using BLAISE III Joelle Davis and Nancy L. Leach, Energy Information Administration (USA) Introduction In 997, the Residential Energy
Hybrid Electric Vehicle End-of-Life Testing On Honda Insights, Honda Gen I Civics and Toyota Gen I Priuses
 INL/EXT-06-01262 U.S. Department of Energy FreedomCAR & Vehicle Technologies Program Hybrid Electric Vehicle End-of-Life Testing On Honda Insights, Honda Gen I Civics and Toyota Gen I Priuses TECHNICAL
ON-ROAD FUEL ECONOMY OF VEHICLES
 SWT-2017-5 MARCH 2017 ON-ROAD FUEL ECONOMY OF VEHICLES IN THE UNITED STATES: 1923-2015 MICHAEL SIVAK BRANDON SCHOETTLE SUSTAINABLE WORLDWIDE TRANSPORTATION ON-ROAD FUEL ECONOMY OF VEHICLES IN THE UNITED
Engineering Dept. Highways & Transportation Engineering
 The University College of Applied Sciences UCAS Engineering Dept. Highways & Transportation Engineering (BENG 4326) Instructors: Dr. Y. R. Sarraj Chapter 4 Traffic Engineering Studies Reference: Traffic
Interstate Operations Study: Fargo-Moorhead Metropolitan Area Simulation Output
 NDSU Dept #2880 PO Box 6050 Fargo, ND 58108-6050 Tel 701-231-8058 Fax 701-231-6265 www.ugpti.org www.atacenter.org Interstate Operations Study: Fargo-Moorhead Metropolitan Area 2015 Simulation Output Technical
Trip Generation & Parking Occupancy Data Collection: Grocery Stores Student Chapter of Institute of Transportation Engineers at UCLA Spring 2014
 Trip Generation & Parking Occupancy Data Collection: Grocery Stores Student Chapter of Institute of Transportation Engineers at UCLA Spring 2014 Page 1 Introduction The UCLA Institute of Transportation
2012 Air Emissions Inventory
 SECTION 6 HEAVY-DUTY VEHICLES This section presents emissions estimates for the heavy-duty vehicles (HDV) source category, including source description (6.1), geographical delineation (6.2), data and information
Vers. 2.3 travel model, trip generation: Development of trip production model
 TFS item #4a Vers. 2.3 travel model, trip generation: Development of trip Presented to the Travel Forecasting Subcommittee of the TPB Technical Committee September 17, 2010 Mark Moran, TPB staff National
Costco Gasoline Fuel Station Transportation Characteristics
 Exhibit A MEMORANDUM Date: May 23, 2013 Project #: I-10 To: Jennifer Murillo, Costco Wholesale Terry Odle, Mulvanny G2 Architecture From: Sonia Hennum, PTOE Project: Subject: Signal Hill Costco Gasoline
EUGENE-SPRINGFIELD, OREGON EAST WEST PILOT BRT LANE TRANSIT DISTRICT
 EUGENE-SPRINGFIELD, OREGON EAST WEST PILOT BRT LANE TRANSIT DISTRICT (BRIEF) Table of Contents EUGENE-SPRINGFIELD, OREGON (USA)... 1 COUNTY CONTEXT AND SYSTEM DESCRIPTION... 1 SYSTEM OVERVIEW... 1 PLANNING
Travel Forecasting Methodology
 Travel Forecasting Methodology Introduction This technical memorandum documents the travel demand forecasting methodology used for the SH7 BRT Study. This memorandum includes discussion of the following:
2 VALUE PROPOSITION VALUE PROPOSITION DEVELOPMENT
 2 VALUE PROPOSITION The purpose of the Value Proposition is to define a number of metrics or interesting facts that clearly demonstrate the value of the existing Xpress system to external audiences including
HALTON REGION SUB-MODEL
 WORKING DRAFT GTA P.M. PEAK MODEL Version 2.0 And HALTON REGION SUB-MODEL Documentation & Users' Guide Prepared by Peter Dalton July 2001 Contents 1.0 P.M. Peak Period Model for the GTA... 4 Table 1 -
MOTORISTS' PREFERENCES FOR DIFFERENT LEVELS OF VEHICLE AUTOMATION: 2016
 SWT-2016-8 MAY 2016 MOTORISTS' PREFERENCES FOR DIFFERENT LEVELS OF VEHICLE AUTOMATION: 2016 BRANDON SCHOETTLE MICHAEL SIVAK SUSTAINABLE WORLDWIDE TRANSPORTATION MOTORISTS' PREFERENCES FOR DIFFERENT LEVELS
Use of National Household Travel Survey (NHTS) Data in Assessment of Impacts of PHEVs on Greenhouse Gas (GHG) Emissions and Electricity Demand
 Data in Assessment of Impacts of PHEVs on Greenhouse Gas (GHG) Emissions and Electricity Demand") Use of National Household Travel Survey (NHTS) Data in Assessment of Impacts of PHEVs on Greenhouse Gas (GHG) Emissions and Electricity Demand By Yan Zhou and Anant Vyas Center for Transportation Research
Use of National Household Travel Survey (NHTS) Data in Assessment of Impacts of PHEVs on Greenhouse Gas (GHG) Emissions and Electricity Demand By Yan Zhou and Anant Vyas Center for Transportation Research
BROWARD BOULEVARD CORRIDOR TRANSIT STUDY
 BROWARD BOULEVARD CORRIDOR TRANSIT STUDY FM # 42802411201 EXECUTIVE SUMMARY July 2012 GOBROWARD Broward Boulevard Corridor Transit Study FM # 42802411201 Executive Summary Prepared For: Ms. Khalilah Ffrench,
Facts and Figures. October 2006 List Release Special Edition BWC National Benefits and Related Facts October, 2006 (Previous Versions Obsolete)
") Facts and Figures Date October 2006 List Release Special Edition BWC National Benefits and Related Facts October, 2006 (Previous Versions Obsolete) Best Workplaces for Commuters - Environmental and Energy
Facts and Figures Date October 2006 List Release Special Edition BWC National Benefits and Related Facts October, 2006 (Previous Versions Obsolete) Best Workplaces for Commuters - Environmental and Energy
Performance Measure Summary - Seattle WA. Performance Measures and Definition of Terms
 Performance Measure Summary - Seattle WA There are several inventory and performance measures listed in the pages of this Urban Area Report for the years from 1982 to 2014. There is no single performance
Performance Measure Summary - Tucson AZ. Performance Measures and Definition of Terms
 Performance Measure Summary - Tucson AZ There are several inventory and performance measures listed in the pages of this Urban Area Report for the years from 1982 to 2014. There is no single performance
Trip Generation and Parking Utilization Data Collection at Mini-Mart with Gas Station
 Trip Generation and Parking Utilization Data Collection at Mini-Mart with Gas Station Final Report 2013 ITE District 6 - Data Collection Project Institute of Transportation Engineers Student Chapter at
Spatial and Temporal Analysis of Real-World Empirical Fuel Use and Emissions
 Spatial and Temporal Analysis of Real-World Empirical Fuel Use and Emissions Extended Abstract 27-A-285-AWMA H. Christopher Frey, Kaishan Zhang Department of Civil, Construction and Environmental Engineering,
Performance Measure Summary - Washington DC-VA-MD. Performance Measures and Definition of Terms
 Performance Measure Summary - Washington DC-VA-MD There are several inventory and performance measures listed in the pages of this Urban Area Report for the years from 1982 to 2014. There is no single
Subarea Study. Manning Avenue (CSAH 15) Corridor Management and Safety Improvement Project. Final Version 1. Washington County.
 Corridor Management and Safety Improvement Project. Final Version 1. Washington County.") Subarea Study Manning Avenue (CSAH 15) Corridor Management and Safety Improvement Project Final Version 1 Washington County June 12, 214 SRF No. 138141 Table of Contents Introduction... 1 Forecast Methodology
Subarea Study Manning Avenue (CSAH 15) Corridor Management and Safety Improvement Project Final Version 1 Washington County June 12, 214 SRF No. 138141 Table of Contents Introduction... 1 Forecast Methodology
VEHICLE FLEET MANAGEMENT AT THE IDAHO NATIONAL ENGINEERING AND ENVl RONMENTAL LABORATORY
 VEHICLE FLEET MANAGEMENT AT THE IDAHO NATIONAL ENGINEERING AND ENVl RONMENTAL LABORATORY March 1999 DISCLAIMER Portions of this document may be illegible in electronic image products. Images are produced
Linking the Georgia Milestones Assessments to NWEA MAP Growth Tests *
 Linking the Georgia Milestones Assessments to NWEA MAP Growth Tests * *As of June 2017 Measures of Academic Progress (MAP ) is known as MAP Growth. February 2016 Introduction Northwest Evaluation Association
The Evolution of Side Crash Compatibility Between Cars, Light Trucks and Vans
 2003-01-0899 The Evolution of Side Crash Compatibility Between Cars, Light Trucks and Vans Hampton C. Gabler Rowan University Copyright 2003 SAE International ABSTRACT Several research studies have concluded
Vanpool in Atlanta: Accommodating a 10% Mode Shift for Coca-Cola. Prepared for CEE 6625 by Calvin Clark Daejin Kim Yu Chen
 Vanpool in Atlanta: Accommodating a 10% Mode Shift for Coca-Cola Prepared for CEE 6625 by Calvin Clark Daejin Kim Yu Chen Outline Vanpool System Introduction Vanpool System in Atlanta Estimations for Coca-Cola
Developing a Toll Demand Model for DelDOT s Statewide Travel Demand Model
 Developing a Toll Demand Model for DelDOT s Statewide Travel Demand Model TRB 87 th Annual Meeting Washington, D.C. Introduction DelDOT is facing the same deteriorating infrastructure, increasing congestion
Table of Contents. 1.0 Introduction Demographic Characteristics Travel Behaviour Aggregate Trips 28
 Table of Contents 1.0 Introduction 1 1.1 Overview of the Household Travel Survey 1 1.2 Study Area 2 1.3 Scaling 5 1.4 Sample Accuracy 6 2.0 Demographic Characteristics 8 2.1 Population, Employment and
Level of Service Classification for Urban Heterogeneous Traffic: A Case Study of Kanapur Metropolis
 Level of Service Classification for Urban Heterogeneous Traffic: A Case Study of Kanapur Metropolis B.R. MARWAH Professor, Department of Civil Engineering, I.I.T. Kanpur BHUVANESH SINGH Professional Research
Appendix F Model Development Report
 Appendix F Model Development Report This page intentionally left blank. Westside Mobility Plan Model Development Report December 2015 WESTSIDE MOBILITY PLAN MODEL DEVELOPMENT REPORT December 2015 Originally
Performance Measure Summary - Large Area Sum. Performance Measures and Definition of Terms
 Performance Measure Summary - Large Area Sum There are several inventory and performance measures listed in the pages of this Urban Area Report for the years from 1982 to 2014. There is no single performance