Table of Contents. 1.0 Introduction Demographic Characteristics Travel Behaviour Aggregate Trips 28
|
|
|
- Anne Barrett
- 6 years ago
- Views:
Transcription


1
2 Table of Contents 1.0 Introduction Overview of the Household Travel Survey Study Area Scaling Sample Accuracy Demographic Characteristics Population, Employment and Related Information Travel Behaviour Weekday Trip Generation Weekday Travel Mode Share Weekday Person Trip Lengths Aggregate Trips Total Weekday Person Trips and Mode Share Total Weekday Daily Trips by Purpose Weekday Travel Distances Weekday Travel Patterns Weekday Trips to Central Edmonton Conclusions Growth Demographic Changes Weekday Travel Changes 46 Project No June, 2006
3 Appendices Appendix A Appendix B Appendix C Weekday Daily Trips, 4 Sectors Weekday Daily Trips, 7 Sectors Weekday Daily Trips From Home List of Tables Table 2.1: Population of the Edmonton Census Metropolitan Area (CMA) by Sector, 1994 and Table 3.1a: Mode Share by Age Group and Gender, Table 3.1b: Change in Mode Share by Age Group and Gender, Table 3.2: Average Trip Length (km) by Purpose, 1994 and Table 3.3: Average Trip Length (km) by Mode, 1994 and Table 4.1: Weekday Daily Trips by Trip Purpose, 1994 and Table 5.1: Trips to Central Edmonton from Specified Home Area, List of Figures Figure 1.1: Study Area 3 Figure 1.2: Edmonton Area Sectors 4 Figure 1.3: Distribution of Surveyed Households 5 Figure 2.1: Population Growth in Edmonton from 1994 to Figure 2.2: Population Age Distribution, Figure 2.3: Change in Population Age Distribution, Figure 2.4: Primary Occupation or School Status, 1994 and Figure 2.5: Household Size by Sector, 1994 and Figure 2.6: Household Income Distribution, Figure 2.7: Extent and Distribution of Employment Growth 16 Figure 2.8: Passenger Vehicles per Person Aged Figure 3.1: Weekday Trips per Person by Age and Gender, Figure 3.2: Trips per Weekday by Household Income, 1994 and Figure 3.3: Trips per Weekday by Household Size, Figure 3.4: Trips per Weekday by Car Ownership, Figure 3.5: Mode Share by Age Group, Figure 3.6: Transit Mode Share by Household Income, Figure 3.7: Transit Mode Share by Car Ownership, Figure 3.8: Trip Lengths by Trip Purpose, 1994 and Figure 3.9: Average Trip Length (km) by Travel Mode, 1994 and Figure 4.1: Mode Share by Number of Trips, 1994 and Figure 4.2: Mode Share by Percent of All Trips, Figure 4.3: Commute to Work Mode Share, Figure 4.4: Commute to Elementary School by Mode Share, Figure 4.5: Commute to Junior High School by Mode Share, Figure 4.6: Commute to Senior High School by Mode Share, Figure 4.7: Commute to Post-Secondary School by Mode Share, Figure 4.8: Person-km Traveled by Mode, 1994 and Figure 5.1: Four Sector Map 38 Figure 5.2: Total Daily Trips for Intra-Regional Travel, 1994 and Project No June, 2006
4 Figure 5.3: Change in Daily Trips for Intra-Regional Travel, Figure 5.4: Percentage of Car Driver and Transit Trips for Intra-Regional Travel, Figure 5.5: 2005 Seven Sector Map Figure 5.6: Trips to Central Edmonton from Specified Home Sector, 1994 and Figure 5.7: Car Driver and Transit Trips to Central Edmonton from Home, Project No June, 2006
5 1.0 Introduction In the fall of 2005, the City of Edmonton, together with Alberta Infrastructure and Transportation, undertook an extensive survey of households in the Edmonton region to determine the nature of current travel patterns. The collected information will be used to assess the transportation needs of the City of Edmonton and surrounding region, and to help develop plans to meet those needs. The first step in determining the need for transportation infrastructure and services is gaining an understanding of current travel patterns and the underlying elements which affect these patterns. Once these are known, transportation planning models can be developed to project future transportation needs based upon various assumptions about the type and magnitude of regional growth and the location of these developments. This report provides an overview of the information collected from the 2005 Household Travel Survey. It is intended to be illustrative of the pattern and intensity of travel in the Edmonton region at the time of the survey, as well as the variables which underlie these travel patterns. While some regional information is presented in this report, the primary focus is on weekday travel in Edmonton. 1.1 Overview of the Household Travel Survey Between September 26, 2005 and December 15, 2005, approximately 9,300 households in the Edmonton region participated in a survey which collected information about the household, the residents of the household, and travel information for each member of the household for a 24 hour weekday or weekend period. Some 6,600 of the surveyed households in the city provided information on their weekday travel, as compared to approximately 6,000 in The main objectives of the 2005 Household Travel Survey were to: Provide current demographics and travel data, including origin and destination, trip purpose, mode choice, time of day, activities undertaken, and trip frequency for Project No June, 2006 Page 1
6 updating the regional travel forecasting model being used to forecast travel in the Edmonton area and to assess future transportation policies and strategies. Provide current empirical data and stated preference data on travel choices, including cost, mode, and time of day, by a representative sample of households. The survey participants were selected at random from published telephone lists for the Edmonton region. Those households who agreed to participate in the survey were assigned a travel day and each member of the household was asked to record their travel information on travel diaries, which were provided in an information package mailed to each participating household. Household, person, and travel information was collected by trained surveyors following the assigned travel day. The survey results were coded and entered into an electronic data base for analysis. 1.2 Study Area The study area for the Household Travel Survey corresponds to the Edmonton Census Metropolitan Area (CMA) which encompasses the City of Edmonton, the City of St. Albert, Strathcona County (including Sherwood Park), the City of Fort Saskatchewan, M.D. of Sturgeon, Parkland County (including City of Spruce Grove and Town of Stony Plain), and Leduc County (including the City of Leduc, Town of Devon, and Town of Beaumont). The study area is illustrated in Figure 1.1. For the purpose of presenting the findings of the survey, the study area has been divided into seventeen sectors. The City of Edmonton, together with St. Albert and Sherwood Park, make up fifteen of the seventeen sectors, while the remaining area has been divided into two sectors: regionurban and region-rural. Figure 1.2 illustrates the study area encompassing Edmonton, St. Albert and Sherwood Park. The boundaries are consistent with those used in Figure 1.3 illustrates the locations of the households surveyed in the City of Edmonton. Project No June, 2006 Page 2

7 Figure 1.1: Study Area Project No June, 2006 Page 3

8 Figure 1.2: Edmonton Area Sectors Project No June, 2006 Page 4

9 Figure 1.3: Distribution of Surveyed Households 1.3 Scaling A sample survey approach was used in this study. The relevant information was gathered from a sample of households and then scaled, or factored up, to represent the full population of households in the Edmonton Region. In order to ensure that the scaled survey results best represent the population, a separate scaling factor was developed for each sample household so that the scaled sample matches the actual population. The scaling factors cause the sample to match Project No June, 2006 Page 5
10 the real world across several variables including: population, income, dwelling type, households, household size, age, gender, and employment status by geographic area. On average, each household in the sample is used to represent the behaviour of 65 households in the full population. Using the scaling methodology some households in the sample have a scaling factor higher than 65 and some lower than 65, depending on the rate that households of their type were in the sample, compared to the full population. The result is a scaled survey which compares favourably with the available totals, and the survey results regarding travel can therefore be used with confidence. 1.4 Sample Accuracy Because the scaled survey results are based on a sample, they are subject to a form of imprecision or sample error. A difference of one or two households in the sample is magnified in the scaled values. Consequently, the numbers reported here for the population such as the number of trips made by transit or the number of car drivers must be interpreted with the understanding that they are estimates of the population values influenced by the random chance that one or two more or less households of one type or another may be included, and the true population value may be slightly different from the calculated value. This lack of precision, the sample error, is typically reported as a +/ range about the calculated value that is expected to contain the population value with some specified probability. For example, the number of trips per person for the population of Edmonton is calculated to be 3.63 using the full sample of 10,935 persons with a +/ range of expected to contain the actual population value 19 times out of 20. The magnitude of this +/ range for a given estimate, and the resulting precision of the estimate, is influenced by the number of observations in the sample. Consequently, the number of trips per household for the population of Edmonton households with 4 cars is calculated to be using the sample of such households (just 103 out of the full set of 4,595 households) but in this case with a +/ range of expected to contain the actual population value 19 times out of 20. Note that with the smaller sample the +/ range increases, reflecting a greater imprecision. Project No June, 2006 Page 6
11 The same sort of sample error arises with the population proportions estimated using the sample: there is a +/ range about the calculated value that is influenced by the size of the sample used. For example, the proportion of all trips made using transit for the full population of Edmonton residents is calculated to be 8.58% using the full sample of 40,716 trips overall - with a +/ range of 0.272% expected to contain the actual population proportion value 19 times out of 20. The proportion of trips from the West End to the Central City made using transit for the full population is calculated to be 18.2% using the sample of 560 trips going from the West End to the Central City with a +/ range of 3.19% expected to contain the actual population value 19 times out of 20. As the available sample size decreases, the sample error, as indicated by the +/ range, increases. In general, the samples available for calculating the values reported here are comparatively large, with hundreds and even thousands of observations, and the associated sample error is consequently fairly small and not a matter for concern. But increasing caution needs to be used when the sample is smaller, which happens as smaller and more detailed components of the full system are considered. Project No June, 2006 Page 7
12 2.0 Demographic Characteristics The Household Travel Survey captured detailed travel and demographic information from residents living in the Edmonton Census Metropolitan Area (CMA). Information was collected about the household and about the people living in each household. The majority of the information presented in this section is derived from the travel survey. The total number of households and total population in the City of Edmonton is based on the 2005 City of Edmonton Census. The survey captured travel information which illustrates current travel patterns and behaviours. A number of key changes in travel patterns and behaviours have emerged which appear to be strongly related to demographic changes and shifts. 2.1 Population, Employment and Related Information Population The 2005 population statistics presented in Table 2.1 below were obtained from the 2005 City of Edmonton Census, not from Household Travel Survey data. As shown in Table 2.1, Edmonton had a 2005 population of 712,400, an increase of 13% over the 1994 population. Likewise, the population of the entire Edmonton region has grown some 16% to a total of 1,005,500 in Project No June, 2006 Page 8
13 Table 2.1: Population of the Edmonton Census Metropolitan Area (CMA) by Sector, 1994 and 2005 Sector Description Difference % Difference 1 Downtown 7,000 9,900 2,900 41% 2 University 11,600 14,300 2,700 23% 3 Downtown Fringe 43,900 46,600 2,700 6% 4 Northwest Inner 44,400 42,600-1,800-4% 5 Northeast Inner 96,600 89,200-7,400-8% 6 Southeast Inner 59,300 58, % 7 Southwest Inner 54,000 52,100-1,900-4% 8 West Inner 57,300 55,200-2,100-4% INNER CITY 374, ,500-5,600-1% 9 Northwest Suburb 36,800 47,700 10,900 30% 10 Northeast Suburb 44,200 65,000 20,800 47% 11 Southeast Suburb 85, ,800 15,500 18% 12 Southwest Suburb 39,500 64,000 24,500 62% 13 West Suburb 53,300 66,400 13,100 25% SUBURB CITY 259, ,900 84,800 33% CITY 633, ,400 79,200 13% 14 Sherwood Park 38,700 55,000 16,300 42% 15 St Albert 45,200 56,300 11,100 25% 16 Region - Urban 76,700 94,700 18,000 23% 17 Region - Rural 74,000 87,100 13,100 18% REGION 234, ,100 58,500 25% CMA 867,800 1,005, ,700 16% Table 2.1 illustrates that the Edmonton CMA population has grown by 137,700 people with Edmonton gaining 79,200 people and the surrounding region gaining 58,500 people. Within Edmonton, the highest population increases have occurred in suburban areas with the northeast and southwest suburbs (sectors 10 and 12) showing the highest amounts of growth, both in absolute and percentage terms. In contrast, the mature inner areas of Edmonton showed small declines in population since The exceptions to these inner area declines are the University and Downtown areas. The growth in Downtown population is attributed to the significant increase in residential development that has occurred in the Downtown since Figure 2.1 provides a graphical illustration of population growth. Project No June, 2006 Page 9


14 Figure 2.1: Population Growth in Edmonton from 1994 to Age Profile of Edmonton s Population Information retrieved from Edmonton s 2005 Civic Census on the age profile of Edmonton residents has uncovered significant changes that have implications for travel Project No June, 2006 Page 10
15 patterns and behaviours. Figure 2.2 illustrates the distribution of Edmonton s population by age category in Figure 2.3 shows the percentage changes in each age category. 70,000 60,000 50,000 Number of People 40,000 30,000 20,000 10, Age Category Figure 2.2: Population Age Distribution, 2005 Project No June, 2006 Page 11
16 140% 120% 100% Percent Change in Population 80% 60% 40% 20% 0% -20% % -60% Age Category Figure 2.3: Change in Population Age Distribution, Figures 2.2 and 2.3 indicate that Edmonton s population has matured significantly since The number of people over 45 years of age has increased by 52%, a disproportionately high rate when compared to the 13% population increase. In addition, some of the younger segments have diminished as a proportion of the total population Primary Employment or School Status Another dimension of Edmonton s population is each person s primary occupation or school status. Reference to Figure 2.4 illustrates that there has been a marked increase in people employed full time, an increase in retired people, and decreases in preschool/elementary school children and homemakers. These changes are fully consistent with the previous references to an older population. Project No June, 2006 Page 12
17 50% 45% 40% 35% Population (%) 30% 25% 20% 15% 10% 5% 0% Employed Full Time Employed Part Time Unemployed Retired Homemaker Pre-Schooler K - G6 Junior High Senior High PSE Other Primary Occupation Figure 2.4: Primary Occupation or School Status, 1994 and Household Size In 2005, there were approximately 295,000 households in the City of Edmonton, an increase of almost 50,000 households, or 20%. Figure 2.5 illustrates the distribution of Edmonton households by sector and household size. As indicated, in virtually all sectors in the City, household size has declined. The average household size in Edmonton in 2005 was 2.38 as compared with 2.56 in This represents a notable decline in household size and is consistent with the decline in the number of children and the increase in the number of person over 65 years of age, who typically reside in small households consisting of one or two persons. Project No June, 2006 Page 13
18 Household Size Downtown University Downtown Fringe NW Inner NE Inner SE Inner SW Inner W Inner NW Suburb NE Suburb SE Suburb SW Suburb W Suburb Sherwood Park Sector St Albert Figure 2.5: Household Size by Sector, 1994 and Household Income Household income is defined as the combined annual gross income (before taxes) for all members of the household for the 2005 calendar year. Household income is known to have a strong influence on travel characteristics and it is therefore useful to understand the level and distribution of household incomes that prevail in Edmonton. Figure 2.6 illustrates the distribution of household incomes in Edmonton and indicates that in Edmonton, about 55% of households earn less than $60,000 per annum, while about 20% of households earn more than $100,000. Project No June, 2006 Page 14
19 35% 30% 25% Households (%) 20% 15% 10% 5% 0% <$30,000 $30,000 - $59,999 $60,000 - $99,999 >$100,000 Household Income Figure 2.6: Household Income Distribution, Employment Work related travel forms a significant portion of daily travel activities and places very high demands on the transportation system over relatively short periods of the day. As a consequence, it is important to understand the extent and spatial distribution of employment. Figure 2.7 provides a graphical illustration of the extent and locations of employment growth in the Edmonton area. Employment growth has been strongest in the downtown (sector 1), southeast suburb (sector 11) and northwest suburb (sector 9). The strength of employment growth in suburban locations coupled with the already mentioned strong suburban population growth has significant travel implications. Project No June, 2006 Page 15


20 Figure 2.7: Extent and Distribution of Employment Growth Household Car Availability Cars are defined as all passenger cars, pickups, motorcycles, and vans which are available for use by the persons residing in the household. The extent to which a car is available for use is known to have an influence on travel mode choices. Car availability Project No June, 2006 Page 16
21 is tracked by vehicle registrations in the City of Edmonton, and are shown in Figure 2.8. As can be seen, there has been a slight decline in car availability over time, although the decline is not seen as dramatic Vehicles per Person Aged Year Figure 2.8: Passenger Vehicles per Person Aged Travel Costs Travel costs and any changes to those costs can have an influence on travel choices and patterns. As a backdrop to the travel information being presented in this report, the following information on car travel and transit travel costs is provided: The price of gasoline in Edmonton has risen from 39.9 cents/litre in October 1994 to 91.0 cents/litre in October When inflation is accounted for, the increase in the cost of gasoline amounts to approximately 80%. The Adult cash transit fare in Edmonton was $1.60 in In 2005, the cash fare was $2.00. When the 1994 fare is adjusted for inflation, the 1994 and 2005 adult transit fares are on par with each other. Project No June, 2006 Page 17
22 The above comparison of travel costs indicates that between 1994 and 2005, the cost of travel to the user has risen significantly for car drivers but has remained stable for transit users. Project No June, 2006 Page 18
23 3.0 Travel Behaviour The 2005 Household Travel Survey collected information on all trips generated by all persons residing in the surveyed household during a 24 hour period. This section of the report describes the various characteristics of weekday trips in terms of the: Trip generation rates; Choice of travel mode; Average trip length (km) and travel time (minutes). 3.1 Weekday Trip Generation Weekday Daily Trip Generation Rates for Persons Figure 3.1 illustrates the trip generation rate of people in different age groups by gender. The number of trips made by each person tends to increase by age up until 65, at which point trip rates decrease. There are also differences in trip making by gender. Males and females make about the same number of trips per day below the age of 25, but between the ages of 25 and 44, females tend to make more trips per day than males. Beyond the age of 65 males make more daily trips than females. On an average weekday, people in Edmonton make 3.63 trips per day, which is an increase from 3.61 trips per day in Project No June, 2006 Page 19
24 Number of Trips per Weekday < Age Group Male Female Average Figure 3.1: Weekday Trips per Person by Age and Gender, Daily Trip Generation Rates for Households Household size, income levels, and the availability of cars are all important factors that influence the number of trips generated by a household. Figures 3.2, 3.3 and 3.4 illustrate the daily person trip generation rates by these three factors. On average, households in Edmonton generate 8.6 trips per day, which is a decrease from 9.2 trips per day in The decrease in trips per household is a result of the decreasing household size rather than fewer actual trips being made. Project No June, 2006 Page 20
25 14.0 Number of Trips per Household per Weekday <$30,000 $30,000 - $59,999 $60,000 - $99,999 >$100,000 Household Income Average Figure 3.2: Trips per Weekday by Household Income, Number of Trips per Household per Weekday Household Size Average Figure 3.3: Trips per Weekday by Household Size, 2005 Project No June, 2006 Page 21
26 20.0 Number of Trips per Household per Weekday Car Ownership per Household Average Figure 3.4: Trips per Weekday by Car Ownership, 2005 The following observations are drawn from Figures 3.2, 3.3 and 3.4: The number of trips made per weekday increases with household income; The number of trips made per weekday increases with household size; The number of trips made per weekday increases with car ownership. These relationships are consistent with those observed in 1994 and confirm the strong influence of income, household size, and car ownership on the number of trips made by a household. 3.2 Weekday Travel Mode Share The mode by which people travel is an extremely important element of a transportation system as it affects the type and nature of transportation facilities and services that need to be provided. Accordingly, Figures 3.5, 3.6, 3.7 and Table 3.1 illustrate the relationship between mode choice and a number of variables such as age, gender, income, and car ownership. Project No June, 2006 Page 22
27 90% 80% 70% 60% Trips (%) 50% 40% 30% 20% 10% 0% < Age Group Car Driver Car Passenger Transit Walk Bicycle School / Work Bus Figure 3.5: Mode Share by Age Group, 2005 Table 3.1a: Mode Share by Age Group and Gender, 2005 Table 3.1a: Mode Share by Age Group and Gender, 2005 Mode Age Group Gender < Male Female TOTAL Car Driver 2% 40% 69% 76% 65% 61% 54% 57% Car Passenger 63% 23% 10% 10% 18% 17% 24% 20% Transit 8% 22% 7% 5% 7% 8% 9% 9% Walk 17% 13% 11% 8% 8% 11% 11% 11% Bicycle 1% 1% 1% 1% 0% 1% 1% 1% School / Work Bus 8% 1% 0% 0% 0% 2% 1% 1% Other 0% 1% 1% 0% 1% 1% 0% 0% Table 3.1b: Change in Mode Share by Age Group and Gender, Mode Age Group Gender < Male Female TOTAL Car Driver 2% -4% -5% 3% 5% -1% 6% 3% Car Passenger 1% 1% -1% -3% 1% -2% -4% -3% Transit 0% 0% 1% -1% -3% 1% -1% 0% Walk/Bicycle -3% 1% 2% 1% -1% 0% 0% 0% Walk -7% 2% 4% 1% -2% 0% -1% 0% Bicycle 1% 0% 1% 1% 0% 0% 1% 1% School / Work Bus 3% 0% 0% 0% 0% 1% 0% 0% Other 0% 0% 0% 0% -1% 0% 0% 0% Project No June, 2006 Page 23
28 Section demonstrated a strong correlation between trip generation rates and household income and household size. When transit mode share was compared for different household income levels, it was observed that transit mode share was inversely correlated with household income. Figure 3.6 indicates that transit mode share declines with increasing household incomes. This figure also indicates an average transit mode share of 8.6%. 18% 16% Trips made by Transit (%) 14% 12% 10% 8% 6% 4% 2% 0% <$30,000 $30,000 - $59,999 $60,000 - $99,999 >$100,000 Household Income Average Figure 3.6: Transit Mode Share by Household Income, 2005 Project No June, 2006 Page 24
29 50% 40% Transit Mode Share (%) 30% 20% 10% 0% Household Car Ownership Average Figure 3.7: Transit Mode Share by Car Ownership, Weekday Person Trip Lengths The length of trips taken is an indicator of the spatial characteristics of travel and the extent to which people are willing or forced to travel to complete activities. Figure 3.8 illustrates the average trip length for different trip purposes in 2005 and in The trip purposes match the categories used in the 1994 travel survey; a home based trip is a trip that starts or ends at home while non home based trips start or end elsewhere. Project No June, 2006 Page 25
30 Trip Length (km) HB Work HB Post- Secondary HB School HB Shopping HB Social / Recreation HB Other Non-HB Work Non-HB Other Trip Purpose HB = Home-based Figure 3.8: Trip Lengths by Trip Purpose, 1994 and 2005 There has been an increase in trip lengths across virtually all trip purposes, indicating that Edmontonians are having to or willing to travel further to complete their daily activities. Longer trips mean increased use of the transportation system and reflect a geographically more dispersed population. This is consistent with the high levels of population growth in suburban areas. The actual values and percent differences are shown in Table 3.2. Table 3.2: Average Trip Length (km) by Purpose, 1994 and 2005 Purpose Difference % Difference HB Work % HB Post-Secondary % HB School % HB Shopping % HB Social / Recreation % HB Other % Non-HB Work % Non-HB Other % Average % Project No June, 2006 Page 26
31 Average Trip Length (km) Car Driver Car Passenger Transit Walk Bicycle School / Work Bus Other Travel Mode Figure 3.9: Average Trip Length (km) by Travel Mode, 1994 and 2005 Table 3.3: Average Trip Length (km) by Mode, 1994 and 2005 Mode Difference % Difference Car Driver % Car Passenger % Transit % Walk % Bicycle % School / Work Bus % Other % Average % Figure 3.9 and Table 3.3 illustrate trip length by mode for 1994 and All modes except for school/work bus and walk have experienced an increased average trip length. Car driver and car passenger modes experienced a notable increase. Project No June, 2006 Page 27
32 4.0 Aggregate Trips The number of trips made by Edmonton residents has risen from 2.25 million trips per weekday in 1994 to 2.56 million in 2005, an increase of approximately 14%. This increase is in line with the city population increase of 13%. The aggregate trip characteristics described in this section allow an assessment of the characteristics of this increase in demand and the effect on the transportation system. 4.1 Total Weekday Person Trips and Mode Share Of the 2.56 million trips per weekday made by Edmonton residents, 1.98 million are made by car, a share of approximately 78%, while 220,000 are made by transit, a share of almost 9%. Figure 4.1 illustrates the mode share of all person trips in 1994 and ,600,000 1,400,000 1,200,000 Number of Trips 1,000, , , , ,000 0 Car Driver Car Passenger Walk Transit School / Work Bus Bicycle Other Travel Mode Figure 4.1: Mode Share by Number of Trips, 1994 and 2005 Project No June, 2006 Page 28
33 From Figure 4.1 the largest change in the number of trips since 1994 is by car driver, which today account for nearly 1.5 million trips per weekday made by Edmonton residents, an increase of 23% over There has also been a drop in car passengers, which can be attributed to the overall decline in household size and the relative decline in the school age population. Figure 4.2 shows the relative mode shares in terms of percent of all weekday trips. Transit, 8.6% School / Work Bus, 1.4% Bicycle, 1.0% Walk, 11.1% -0.1% -0.3% Car Passenger, 20.5% -3.0% Change in Share: +2.7% Car Driver, 57.0% Figure 4.2: Mode Share by Percent of All Trips, 2005 Figure 4.2 illustrates percentage mode share in 2005 and the change in share since The figure shows a decrease in car passenger and a corresponding increase in car driver percentages. The overall share of car trips has remained constant at just under 78%. Transit is shown to have maintained a constant 8.6% mode share since It is therefore clear that transit is attracting new trips at a rate equal to its mode share, and proportional to the overall growth in the number of trips. Project No June, 2006 Page 29
34 This distinction between the total number of trips and the percentages of trips also highlights the increasing demand on the transportation system: the number of daily transit trips has increased by approximately 25,000, and the number of car trips has increased by almost 240,000 since Total Weekday Daily Trips by Purpose In transportation planning it is useful to categorize trips by the purpose of travel; different trip purposes have different sensitivities to travel elements such as cost, mode use, and time constraints. The trip purposes used in the 2005 travel survey are the same as those used in These include Home-Based Work and Home-Based School purposes. Home based trips either start or end at home. In other words, two trips, one from home to work and the other from work to home, are each counted as home-based work trips. Table 4.1 lists the total trips by purpose in 2005 and changes from 1994 to Table 4.1: Weekday Daily Trips by Trip Purpose, 1994 and 2005 Purpose 1994 Trips 1994 % of Trips 2005 Trips 2005 % of Trips Difference in Trips % Difference HB-Work 429,000 19% 516,000 20% 87,000 20% HB-Post-Secondary 71,000 3% 72,000 3% 1,000 1% HB-School 241,000 11% 176,000 7% -65,000-27% HB-Shopping 238,000 11% 331,000 13% 93,000 39% HB-Social / Recreation 209,000 9% 336,000 13% 127,000 61% HB-Personal Business 179,000 8% 147,000 6% -32,000-18% HB-Pick Up / Drop Off 132,000 6% 168,000 7% 36,000 27% HB-Other 188,000 8% 209,000 8% 21,000 11% HB-Sub-Total 1,687,000 75% 1,955,000 76% 268,000 16% Non-HB-Work 77,000 3% 141,000 6% 64,000 83% Non-HB-Other 486,000 22% 464,000 18% -22,000-5% Non-HB-Sub-Total 563,000 25% 605,000 24% 42,000 7% TOTAL 2,250, % 2,559, % 309,000 14% HB = Home-based Project No June, 2006 Page 30
35 From Table 4.1, 20% of trips in 2005 are to and from work, and if school trips are added to work trips the total is 30%. This ratio highlights the need to plan transportation facilities considering more than just peak period trips to or from work. It is also worth noting that the Federal Census only considers the AM peak period home to work trips, and therefore lacks important information for planning and evaluation purposes that are captured by this survey. There are several changes in trips by trip purpose since First is a shift away from home based school trips to other purposes. This is likely a result of the changing demographics and aging of the population. Personal Business trips have also decreased, perhaps reflecting growth in internet banking and other social changes. Social and recreation trips have experienced the biggest increase, followed by shopping trips. These changes might be attributed to income growth, a move towards a healthier lifestyle, and an increase in the retired population. In general, the other changes can be attributed to a number of causes including social changes, new trends, or differences in survey questions and responses Weekday Mode Share by Trip Purpose Home to work is an important part of overall transportation demand because of the prevalence of the car driver mode and the hope of attracting commuters to transit facilities. Figure 4.3 has the home to work trips broken down by travel mode. As expected, car driver trips are the dominant mode, however a transit share of approximately 12% is higher than the overall transit share of 8.6%. Project No June, 2006 Page 31
36 80% 70% 60% 50% Trips (%) 40% 30% 20% 10% 0% Car Driver Transit Car Passenger Walk Bicycle Other Travel Mode Figure 4.3: Commute to Work Mode Share, 2005 Figures 4.4 through 4.7 have mode share for travel from home to different school types. There are several patterns in the data including the proportions of trips that are passenger, walk, and transit. At elementary and junior high levels, Figures 4.4 and 4.5 confirm the trend that driving children to school has become more popular particularly given the city s open border policy on school enrolment. At a senior high school level there are nearly as many car drivers as walkers, and bicycle riding only captures a small fraction of total trips. Transit is also the most popular mode for senior high and post secondary students. Project No June, 2006 Page 32
37 60% 50% 40% Trips (%) 30% 20% 10% 0% Car Passenger Walk School Bus Transit Bicycle Travel Mode Figure 4.4: Commute to Elementary School by Mode Share, % 50% 40% Trips (%) 30% 20% 10% 0% Car Passenger Transit Walk School Bus Bicycle Travel Mode Figure 4.5: Commute to Junior High School by Mode Share, 2005 Project No June, 2006 Page 33
38 60% 50% 40% Trips (%) 30% 20% 10% 0% Transit Car Passenger Walk School Bus Car Driver Bicycle Other Travel Mode Figure 4.6: Commute to Senior High School by Mode Share, % 40% Trips (%) 30% 20% 10% 0% Transit Walk Car Driver Car Passenger Bicycle Other Travel Mode Figure 4.7: Commute to Post-Secondary School by Mode Share, 2005 Project No June, 2006 Page 34
39 4.3 Weekday Travel Distances The aggregate distance traveled combines the distance traveled on trips and the number of trips. The result is the total person-km, which is an indicator of demand. Figure 4.8 has the person-km of travel by mode. 14,000,000 12,000,000 10,000,000 Person-km 8,000,000 6,000,000 4,000,000 2,000,000 0 Car Driver Car Passenger Transit Walk School / Work Bus Other Bicycle Travel Mode Figure 4.8: Person-km Traveled by Mode, 1994 and 2005 As shown in the above figure the person-km has increased for both car driver and transit users. In particular, the car driver person-km has risen from 9.9 million person-km in 1994 to 13.1 million person-km in 2005, an increase of over 32%. This increase illustrates how the demand on the City s roads has increased much faster than either the number of trips or the trip length when viewed independently. The increase for transit was from 1.3 million person-km in 1994 to 1.6 million in 2005, an increase of 23%. Walking has seen a slight decrease in person-km, perhaps reflecting the changing demographics. Project No June, 2006 Page 35
40 In general, the increase in trip length is expected for increasing city size and development on the periphery. People in suburbs have to travel further to get to desired locations in the city, and there is a higher tendency towards car mode in these areas. Project No June, 2006 Page 36
41 5.0 Weekday Travel Patterns In the 2005 Household Travel Survey, trip origins and destinations were tracked so that area to area flows could be evaluated. For the purposes of reporting overall trends, the city and region were divided into large areas as shown in Figure 5.1. Project No June, 2006 Page 37
42 Figure 5.1: Four Sector Map The intra-regional travel (travel within and between these sectors) illustrates the impacts of suburbanization and growth on travel patterns. Figure 5.2 shows the total daily trips for 1994 and 2005 while Figure 5.3 shows the differences. Project No June, 2006 Page 38
43 700, , ,000 Number of Trips 400, , , ,000 - Central - Central Central - Inner Central - Suburb Inner - Inner Suburb - Inner Suburb - Suburb Region - City Sector to Sector Figure 5.2: Total Daily Trips for Intra-Regional Travel, 1994 and , , ,000 Change in Number of Trips 50,000 - (50,000) Central - Central Central - Inner Central - Suburb Inner - Inner Suburb - Inner Suburb - Suburb Region - City (100,000) (150,000) Sector to Sector Figure 5.3: Change in Daily Trips for Intra-Regional Travel, Project No June, 2006 Page 39
44 Figures 5.2 and 5.3 show a major trend to suburban and regional travel in the Edmonton CMA. With an overall growth of 310,000 trips per weekday in the City of Edmonton, travel to and from the suburbs has grown by approximately 330,000 trips. In other words, not only are new trips being made from and to the suburbs, but other trips which were shorter distance Inner City travel in 1994, have now redistributed to start or end in the suburbs. Central Edmonton, consisting of the Downtown and University, has experienced a growth of approximately 95,000 trips per weekday, roughly half of which is from the suburbs and half from within the same area, which corresponds to the population growth in these areas. There has also been a major increase in travel from the city to the region and in intraregional travel. In particular, trips from the region to the city have increased by 110,000, while trips within the region have increased by 150,000 per weekday. In general, these travel patterns are the expected result of the changing land uses in and around Edmonton and the demographics shown in Section 2.0. There has been notable employment growth in southeast Edmonton as well as in the northwest light industrial areas. In the region, there has been employment growth south of Edmonton, and in the counties east and northeast of the city. Residential growth has occurred in many areas, predominantly in the fringes of the city. Figure 5.4 illustrates the car driver and transit shares for intra-regional trips in The figure demonstrates how transit is a major mode for trips to and from the Central Sectors, and used less for suburban travel. Project No June, 2006 Page 40
45 80% 70% 60% 50% Trips (%) 40% 30% 20% 10% 0% Central - Central Central - Inner Central - Suburb Inner - Inner Suburb - Inner Suburb - Suburb Region - City Sector to Sector Car Driver Transit Figure 5.4: Percentage of Car Driver and Transit Trips for Intra-Regional Travel, Weekday Trips to Central Edmonton It is useful to isolate the trips to Central Edmonton to show the travel patterns for commuters to the Downtown and University. Figure 5.5 is a map showing the seven sectors used, while Figure 5.6 has the total number of trips from these sectors. Project No June, 2006 Page 41
46 Figure 5.5: Seven Sector Map Project No June, 2006 Page 42
47 40,000 35,000 30,000 Number of Trips 25,000 20,000 15,000 10,000 5,000 0 Northeast Southeast West Southwest Northwest Home Sector Figure 5.6: Trips to Central Edmonton from Home, 1994 and 2005 Figure 5.6 demonstrates that Southwest Edmonton now accounts for more trips to Central Edmonton than the other sectors, compared to 1994 when the Southeast accounted for the most trips. Figure 5.7 has the number of car driver and transit trips from the same sectors to Downtown. 25,000 20,000 Number of Trips 15,000 10,000 5,000 0 Northwest Northeast Southeast Southwest West Home Sector Car Driver Transit Figure 5.7: Car Driver and Transit Trips to Central Edmonton from Home, 2005 Project No June, 2006 Page 43
48 Figure 5.7 shows that the transit trips from the Northeast sector to Central Edmonton are significantly higher than other home sectors. This can be attributed to the LRT line serving northeast Edmonton. Following the Northeast, the Southeast has the highest number of transit trips, followed by the Southwest, the West, and the Northwest. The ratio between transit trips and other trips is shown in Table 5.1. Table 5.1: Trips to Central Edmonton from Home, 2005 From 2005 Trips Change from Transit Share Northeast 34,000 3,000 39% Southeast 35,000 3,000 23% West 27,000 2,000 21% Southwest 38,000 7,000 20% Northwest 22,000 5,000 18% Table 5.1 illustrates that for trips to Central Edmonton from the Northeast, transit share is 39%. The Southeast quadrant has the next highest transit share at 23%. These figures have implications for planning high speed transit, which was shown to be most applicable to travel to Central Edmonton. The potential market for high speed transit is a combination of demand for travel from an area to the Downtown and the existing number of transit users. Project No June, 2006 Page 44
49 6.0 Conclusions The 2005 Household Travel Survey provided a very rich poll of data on the travel patterns of Edmonton and area residents. The information that has been collected reveals significant changes in travel patterns and behaviours that will be assessed and applied towards transportation policies and strategies for Edmonton over the coming years. There are a number of changes to travel patterns and behaviours that need to be highlighted as follows: 6.1 Growth Part of the change in travel patterns observed can be attributed to growth. Edmonton has experienced significant population growth since the last travel survey was carried out in The majority of growth has occurred in suburban areas of Edmonton, including the Southwest (62% growth) and Northeast (47% growth) suburban areas. While there have been slight declines in the population of the inner city sectors (a 4% to 8% decrease), the Downtown proper has grown significantly since 1994, with a population increase of almost 6,000 people in the Downtown and Downtown Fringe and 2,700 people in the University area. In total, the population of the metropolitan area has increased from 867,800 to 1,005,500, a 16% increase. There has also been strong employment growth. Southeast Edmonton, the Northwest industrial areas, Downtown, and University have all experienced employment growth. Sherwood Park has also seen a notable increase. 6.2 Demographic Changes One of the most significant areas of change since 1994 is the change in the demographic characteristics in Edmonton s population. The proportion of the population over 45 years of age has increased by 52%, a disproportionate increase Project No June, 2006 Page 45
50 compared to the City of Edmonton s population growth of 13%. Furthermore, the population aged 15 years or less has declined in relative terms. Household size, which is a key variable in the number of trips made in a day, has declined significantly in 13 of 15 sectors. The average household size is now 2.38 as compared to 2.56 in A review of occupations and school status shows higher level of full time employment, greater incidence of retired people and lower levels of children in grade school. 6.3 Weekday Travel Changes Trip Rates and Demographics The number of trips made per weekday by a household in Edmonton has decreased from 9.2 to 8.6. This is mainly a result of the changing demographics (such as smaller household size) rather than a change in the trip rates per person, which has slightly increased from 3.61 to Trip rates were also shown to be strongly influenced by household income and the number of cars available to the household. Also, in the 25 to 44 age category, females now make more trips per day than males do. Demographics were shown to have an impact on mode share. Households with no car available use transit for 45% of daily trips, which drops to 5% or less for households with 2 or more cars. Average trip lengths were also shown to be increasing. Edmonton students now travel 4.4 km on average to get to school from home versus 3.3 km in There has also been an increase in the home to work average trip length from 10.3 km to 11.0 km on average Weekday Aggregate Trips The number of trips made in Edmonton has increased from 2.25 million trips per weekday in 1994 to 2.56 million in 2005, an increase of approximately 14%. The largest change in the number of trips is by car driver, which account for nearly 1.5 million trips per day, an increase of 23% over This increase is a result of growth as well as a Project No June, 2006 Page 46
51 mode shift from car passenger to car driver, car drivers now account for 57% of all trips in the city. Transit mode share has remained constant at 8.6% of all trips, demonstrating that transit is attracting riders in proportion to overall growth in trips. When trips are categorized by trip purpose, it becomes clear that trips from home to work and back are only a fraction of the travel that occurs in Edmonton. Trips for shopping and social/recreation purposes have experienced the biggest percent change since 1994, and now account for 26% of all trips, more than work trips and postsecondary trips combined. Mode share by trip purpose is also revealing; transit is the dominant mode of travel for senior high and post secondary students, while 72% of home to work trips are by car driver. Coupled with increased suburban travel there has been a disproportionately strong growth in vehicle kilometres of travel. All weekday car trips account for 13.1 million person-km, an increase of 32% compared to the 9.9 million person-km driven in This illustrates how the demand on the City s roads has increased much faster than growth in population, in the number of trips, or growth in average trip length when viewed independently. Transit is also accounting for more trips that are longer; on a weekday basis transit moves 1.6 million person-km, an increase of 23% over Implications Overall, the mode share of trips between cars, transit, walking, and cycling is relatively unchanged since Car travel accounts for about 78% of all trips while transit trips account for about 9%. Transit continues to show strength in trips oriented to the central area of the city. It is notable that the Northeast sector to Downtown has significantly more transit trips than Project No June, 2006 Page 47
52 other sectors. The Northeast is also the only sector that has a high-speed transit service (LRT) with travel times competitive with the private car. Edmonton roads are accommodating 32% more travel in 2005 compared to This has implications on the congestion levels experienced by drivers and illustrates a need to plan for traffic levels that increase faster than population growth. The majority of growth in travel was observed for suburban origins or destinations. This has implications on the City s ring road system; growth in trips serviced by these roads is occurring much faster than the otherwise notable population growth. Travel from the suburbs to Downtown is also increasing. All sectors of Edmonton experienced growth in the number of trips to Central Edmonton, with the Southwest experiencing the greatest increase. While the Southwest has the greatest overall demand for travel to Central Edmonton, the Southeast was identified as having a higher transit share for trips Downtown compared to other sectors, not including the Northeast. Project No June, 2006 Page 48
53 Appendix A Weekday Daily Trips, 4 Sectors Project No June, 2006
54 Project No June, 2006 City of Edmonton - Transportation Department
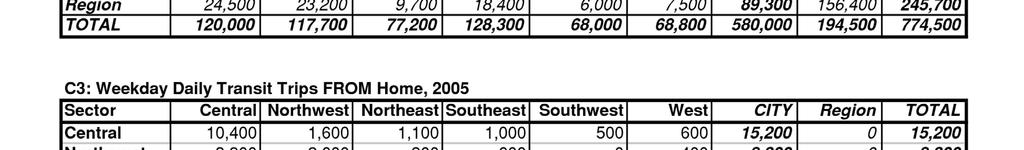
55 A1: Weekday Daily Person Trips, 2005 Sector Central Inner Suburb Region TOTAL Central 210, , ,200 39, ,800 Inner 144, , ,400 66,500 1,052,600 Suburb 103, , ,000 96,700 1,132,400 Region 43,100 65,100 95, , ,200 TOTAL 500,400 1,052,200 1,133, ,000 3,581,000 A2: Weekday Daily Car Driver Trips, 2005 Sector Central Inner Suburb Region TOTAL Central 60,400 79,400 62,600 29, ,800 Inner 77, , ,500 48, ,100 Suburb 64, , ,800 74, ,300 Region 31,700 48,600 74, , ,100 TOTAL 234, , , ,500 2,105,300 A3: Weekday Daily Transit Trips, 2005 Sector Central Inner Suburb Region TOTAL Central 28,000 30,200 21,500 4,500 84,200 Inner 30,800 33,800 20,000 2,000 86,600 Suburb 20,900 19,100 17, ,200 Region 4,200 1, ,100 9,200 TOTAL 83,900 84,800 59,600 9, ,200 A4: Weekday Transit Mode Split, 2005 Sector Central Inner Suburb Region TOTAL Central 13% 20% 21% 11% 17% Inner 21% 6% 7% 3% 8% Suburb 20% 7% 3% 0% 5% Region 10% 3% 0% 0% 1% TOTAL 17% 8% 5% 1% 7% Project No June, 2006
56 Appendix B Weekday Daily Trips, 7 Sectors Project No June, 2006
57 Project No June, 2006 City of Edmonton - Transportation Department
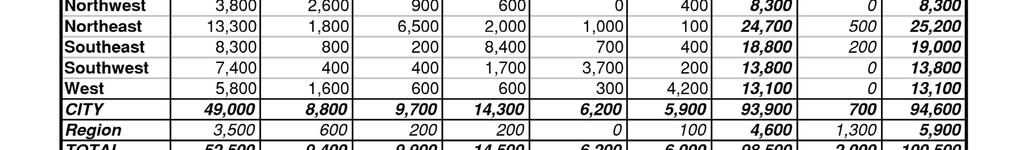
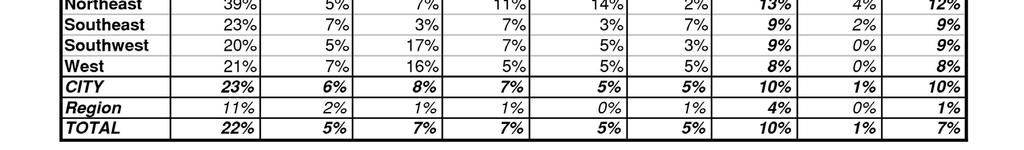
58 B1: Weekday Daily Trips, 2005 Sector Central Northwest Northeast Southeast Southwest West CITY Region TOTAL Central 210,200 48,900 48,500 56,300 57,300 39, ,200 39, ,800 Northwest 48, ,900 65,600 27,600 12,800 45, ,200 43, ,300 Northeast 46,400 66, ,000 31,200 11,300 12, ,400 34, ,300 Southeast 58,000 25,400 33, ,400 65,300 20, ,200 45, ,800 Southwest 54,500 13,600 9,900 66, ,300 16, ,600 19, ,900 West 40,200 44,400 11,600 21,000 16, , ,400 20, ,700 CITY 457, , , , , ,300 2,482, ,800 2,684,800 Region 43,100 44,100 32,000 45,500 18,100 21, , , ,200 TOTAL 500, , , , , ,500 2,686, ,000 3,581,000 B2: Weekday Daily Car Driver Trips, 2005 Sector Central Northwest Northeast Southeast Southwest West CITY Region TOTAL Central 60,400 31,700 22,600 31,200 31,500 25, ,400 29, ,800 Northwest 31,000 93,700 44,900 21,400 9,300 32, ,700 34, ,000 Northeast 22,200 44, ,000 20,700 7,800 7, ,300 25, ,900 Southeast 32,900 19,400 21, ,900 44,200 15, ,600 35, ,700 Southwest 30,100 10,600 6,700 45, ,700 11, ,400 13, ,100 West 25,700 32,000 8,000 15,700 11, , ,600 15, ,700 CITY 202, , , , , ,800 1,396, ,200 1,549,200 Region 31,700 35,700 23,900 34,100 13,200 16, , , ,100 TOTAL 234, , , , , ,000 1,550, ,500 2,105,300 B3: Weekday Daily Transit Trips, 2005 Sector Central Northwest Northeast Southeast Southwest West CITY Region TOTAL Central 28,000 6,300 18,300 10,000 10,300 6,800 79,700 4,500 84,200 Northwest 5,900 5,700 2,900 1, ,600 18, ,800 Northeast 17,100 3,000 14,600 2,800 1, , ,900 Southeast 11,700 1,500 2,800 19,300 2,800 1,100 39, ,800 Southwest 9, ,200 3,100 8, , ,800 West 7,300 2, , ,000 22, ,500 CITY 79,700 19,300 40,600 37,700 24,200 20, ,200 6, ,000 Region 4, ,100 3,100 9,200 TOTAL 83,900 20,000 41,300 38,200 24,200 20, ,300 9, ,200 B4: Weekday Transit Mode Split, 2005 Sector Central Northwest Northeast Southeast Southwest West CITY Region TOTAL Central 13% 13% 38% 18% 18% 17% 17% 11% 17% Northwest 12% 4% 4% 5% 5% 4% 5% 2% 5% Northeast 37% 5% 6% 9% 11% 4% 10% 2% 9% Southeast 20% 6% 8% 6% 4% 5% 7% 1% 7% Southwest 18% 3% 12% 5% 4% 4% 7% 0% 6% West 18% 5% 7% 6% 4% 4% 6% 1% 6% CITY 17% 5% 10% 7% 7% 6% 9% 3% 9% Region 10% 2% 2% 1% 0% 0% 3% 0% 1% TOTAL 17% 5% 9% 7% 6% 5% 8% 1% 7% Project No June, 2006
59 Appendix C Weekday Daily Trips from Home, 7 Sectors Project No June, 2006
60 Project No June, 2006 City of Edmonton - Transportation and Streets


61 Project No June, 2006 City of Edmonton - Transportation and Streets
2018 Municipal Census RESULTS CENSUS2018
 2018 Municipal Census RESULTS CENSUS2018 Introduction The 2018 Municipal Census was conducted by the City of Fort Saskatchewan, Legislative Services Department. This report provides data collected between
Edmonton Region Commodity Flow Study
 A Joint Alberta Transportation, City of Edmonton and Economic Development Edmonton Venture Supported by: Alberta Motor Transport Association (AMTA) Alberta Capital Region Alliance (ACRA) Page 1 27,748
National Household Travel Survey Add-On Use in the Des Moines, Iowa, Metropolitan Area
 National Household Travel Survey Add-On Use in the Des Moines, Iowa, Metropolitan Area Presentation to the Transportation Research Board s National Household Travel Survey Conference: Data for Understanding
CITY OF EDMONTON COMMERCIAL VEHICLE MODEL UPDATE USING A ROADSIDE TRUCK SURVEY
 CITY OF EDMONTON COMMERCIAL VEHICLE MODEL UPDATE USING A ROADSIDE TRUCK SURVEY Matthew J. Roorda, University of Toronto Nico Malfara, University of Toronto Introduction The movement of goods and services
Downtown Lee s Summit Parking Study
 Downtown Lee s Summit Parking Study As part of the Downtown Lee s Summit Master Plan, a downtown parking and traffic study was completed by TranSystems Corporation in November 2003. The parking analysis
More persons in the cars? Status and potential for change in car occupancy rates in Norway
 Author(s): Liva Vågane Oslo 2009, 57 pages Norwegian language Summary: More persons in the cars? Status and potential for change in car occupancy rates in Norway Results from national travel surveys in
Passenger seat belt use in Durham Region
 Facts on Passenger seat belt use in Durham Region June 2017 Highlights In 2013/2014, 85 per cent of Durham Region residents 12 and older always wore their seat belt when riding as a passenger in a car,
Who has trouble reporting prior day events?
 Vol. 10, Issue 1, 2017 Who has trouble reporting prior day events? Tim Triplett 1, Rob Santos 2, Brian Tefft 3 Survey Practice 10.29115/SP-2017-0003 Jan 01, 2017 Tags: missing data, recall data, measurement
8. TRIP DISTRIBUTION. 8.1 Trip Distribution by Trip Purpose. Figures 8.1 show desire lines by trip purpose. < To Work >
 8. TRIP DISTRIBUTION 8.1 Trip Distribution by Trip Purpose Figures 8.1 show desire lines by trip purpose. < To Work > Quezon (II) and Makati form large centers for to Work trips. Manila also attracts a
TRAVEL DEMAND FORECASTS
 Jiangxi Ji an Sustainable Urban Transport Project (RRP PRC 45022) TRAVEL DEMAND FORECASTS A. Introduction 1. The purpose of the travel demand forecasts is to assess the impact of the project components
2 EXISTING ROUTE STRUCTURE AND SERVICE LEVELS
 2 EXISTING ROUTE STRUCTURE AND SERVICE LEVELS In the Study Area, as in most of the Metro Transit network, there are two distinct route structures. The base service structure operates all day and the peak
Ministry of Infrastructure and Watermanagement
 Ministry of Infrastructure and Watermanagement User characteristics and trip patterns of e-bike use in the Netherlands Results from the Dutch National Travel Survey and the Mobility Panel Netherlands Maarten
American Driving Survey,
 RESEARCH BRIEF American Driving Survey, 2015 2016 This Research Brief provides highlights from the AAA Foundation for Traffic Safety s 2016 American Driving Survey, which quantifies the daily driving patterns
Whither the Dashing Commuter?
 Whither the Dashing Commuter? The MTA in a Changing Region William Wheeler Director of Special Project Development and Planning Travel in the New York Region has changed from the days of the 9 to 5 commute
TRANSIT DEMAND IN RURAL DOUGLAS COUNTY: PRELIMINARY BACKGROUND DATA
 TRANSIT DEMAND IN RURAL DOUGLAS COUNTY: PRELIMINARY BACKGROUND DATA Lawrence-Douglas County MPO Regional Transit Advisory Committee Lawrence, Kans. Tuesday October 31, 2017 Chris Zeilinger Assistant Director
Where are the Increases in Motorcycle Rider Fatalities?
 Where are the Increases in Motorcycle Rider Fatalities? Umesh Shankar Mathematical Analysis Division (NPO-121) Office of Traffic Records and Analysis National Center for Statistics and Analysis National
Missouri Seat Belt Usage Survey for 2017
 Missouri Seat Belt Usage Survey for 2017 Conducted for the Highway Safety & Traffic Division of the Missouri Department of Transportation by The Missouri Safety Center University of Central Missouri Final
UTA Transportation Equity Study and Staff Analysis. Board Workshop January 6, 2018
 UTA Transportation Equity Study and Staff Analysis Board Workshop January 6, 2018 1 Executive Summary UTA ranks DART 6 th out of top 20 Transit Agencies in the country for ridership. UTA Study confirms
Seat Belt Survey. Q1. When travelling in a car, do you wear your seat belt all of the time, most of the time, some of the time, or never?
 N F O C F g r o u p Seat Belt Survey Q1. When travelling in a car, do you wear your seat belt all of the time, most of the time, some of the time, or never? The majority of Canadians (85%) wear their seat
Bi-County Transitway/ Bethesda Station Access Demand Analysis
 Bi-County Transitway/ Bethesda Station Access Demand Analysis Prepared for: Washington Metropolitan Area Transit Authority Office of Planning and Project Development May 2005 Prepared by: in conjunction
CITY OF VANCOUVER ADMINISTRATIVE REPORT
 Supports Item No. 1 T&T Committee Agenda May 13, 2008 CITY OF VANCOUVER ADMINISTRATIVE REPORT Report Date: April 29, 2008 Author: Don Klimchuk Phone No.: 604.873.7345 RTS No.: 07283 VanRIMS No.: 13-1400-10
Aging of the light vehicle fleet May 2011
 Aging of the light vehicle fleet May 211 1 The Scope At an average age of 12.7 years in 21, New Zealand has one of the oldest light vehicle fleets in the developed world. This report looks at some of the
Abstract. Executive Summary. Emily Rogers Jean Wang ORF 467 Final Report-Middlesex County
 Emily Rogers Jean Wang ORF 467 Final Report-Middlesex County Abstract The purpose of this investigation is to model the demand for an ataxi system in Middlesex County. Given transportation statistics for
2015 LRT STATION ACTIVITY & PASSENGER FLOW SUMMARY REPORT
 LRT STATION ACTIVITY & PASSENGER FLOW SUMMARY REPORT CAPITAL and METRO LINES Project Team: ETS Transit Data Management Transportation Planning Strategic Monitoring and Analysis April, 2016 LRT STATION
Impact of Copenhagen s
 Impact of Copenhagen s Parking Strategy Copenhagen s parking strategy Strategy background From the 1950s, a marked increase was seen in car traffic, and streets and squares in the centre of Copenhagen
1 Background and definitions
 EUROPEAN COMMISSION DG Employment, Social Affairs and Inclusion Europe 2020: Employment Policies European Employment Strategy Youth neither in employment nor education and training (NEET) Presentation
Presentation A Blue Slides 1-5.
 Presentation A Blue Slides 1-5. 1 Presentation A Blue Slides 1-5. 2 Presentation A Blue Slides 1-5. 3 Presentation A Blue Slides 1-5. 4 Presentation A Blue Slides 1-5. 5 Transit Service right. service
Vehicle Miles Traveled in Massachusetts: Who is driving and where are they going?
 Vehicle Miles Traveled in Massachusetts: Who is driving and where are they going? A presentation to the House Committee on Global Warming and Climate Change Representative Frank Smizik, Chair April 13,
[Report Title] [Report Tag Line]
![[Report Title] [Report Tag Line]](/thumbs/90/104316182.jpg "[Report Title] [Report Tag Line]") [Report Title] [Report Tag Line] TTS 6 REGIONAL MUNICIPALITY OF PEEL SUMMARY BY WARD MARCH 8 Bess Ashby, Research Director 5 Yonge St. Toronto, ON M5B E7 Phone: (6) 6-6 ext. E-mail: b.ashby@malatest.com
[Report Title] [Report Tag Line] TTS 6 REGIONAL MUNICIPALITY OF PEEL SUMMARY BY WARD MARCH 8 Bess Ashby, Research Director 5 Yonge St. Toronto, ON M5B E7 Phone: (6) 6-6 ext. E-mail: b.ashby@malatest.com
Kauai Resident Travel Survey: Summary of Results
 Kauai Resident Travel Survey: Summary of Results Kauai Multimodal Land Transportation Plan Charlier Associates, Inc. November 23, 2011 1 Table of Contents Executive Summary... 2 Survey Goals and Methodology...
Facts and Figures. October 2006 List Release Special Edition BWC National Benefits and Related Facts October, 2006 (Previous Versions Obsolete)
") Facts and Figures Date October 2006 List Release Special Edition BWC National Benefits and Related Facts October, 2006 (Previous Versions Obsolete) Best Workplaces for Commuters - Environmental and Energy
Facts and Figures Date October 2006 List Release Special Edition BWC National Benefits and Related Facts October, 2006 (Previous Versions Obsolete) Best Workplaces for Commuters - Environmental and Energy
NEW YORK SUBURBAN RAIL SUMMARY (COMMUTER RAIL, REGIONAL RAIL)
") NEW YORK SUBURBAN RAIL SUMMARY (COMMUTER RAIL, REGIONAL RAIL) October 2003 New York: The New York commuter rail service area consists of 20.3 million people, spread over 4,700 square miles at an average
NEW YORK SUBURBAN RAIL SUMMARY (COMMUTER RAIL, REGIONAL RAIL) October 2003 New York: The New York commuter rail service area consists of 20.3 million people, spread over 4,700 square miles at an average
WHITE PAPER. Preventing Collisions and Reducing Fleet Costs While Using the Zendrive Dashboard
 WHITE PAPER Preventing Collisions and Reducing Fleet Costs While Using the Zendrive Dashboard August 2017 Introduction The term accident, even in a collision sense, often has the connotation of being an
2010 Motorcycle Risk Study Update
 2010 Motorcycle Risk Study Update Introduction This report provides an update to the Motorcycle Risk Study from AI.16 of the 2005 Rate Application. The original study was in response to Public Utilities
HAS MOTORIZATION IN THE U.S. PEAKED? PART 2: USE OF LIGHT-DUTY VEHICLES
 UMTRI-2013-20 JULY 2013 HAS MOTORIZATION IN THE U.S. PEAKED? PART 2: USE OF LIGHT-DUTY VEHICLES MICHAEL SIVAK HAS MOTORIZATION IN THE U.S. PEAKED? PART 2: USE OF LIGHT-DUTY VEHICLES Michael Sivak The University
DEVELOPMENT OF RIDERSHIP FORECASTS FOR THE SAN BERNARDINO INFRASTRUCTURE IMPROVEMENT STUDY
 APPENDIX 1 DEVELOPMENT OF RIDERSHIP FORECASTS FOR THE SAN BERNARDINO INFRASTRUCTURE IMPROVEMENT STUDY INTRODUCTION: This Appendix presents a general description of the analysis method used in forecasting
Post Opening Project Evaluation. M6 Toll
 M6 Toll Five Post Years Opening After Study: Project Summary Evaluation Report Post Opening Project Evaluation M6 Toll Five Years After Study Summary Report October 2009 Document History JOB NUMBER: 5081587/905
Submission to Greater Cambridge City Deal
 What Transport for Cambridge? 2 1 Submission to Greater Cambridge City Deal By Professor Marcial Echenique OBE ScD RIBA RTPI and Jonathan Barker Introduction Cambridge Futures was founded in 1997 as a
US 81 Bypass of Chickasha Environmental Assessment Public Meeting
 US 81 Bypass of Chickasha Environmental Assessment Public Meeting March 14, 2013 Introductions ODOT FHWA SAIC Meeting Purpose Present need for bypass Provide responses to 10/04/11 public meeting comments
CLRP. Performance Analysis of The Draft 2014 CLRP. Long-Range Transportation Plan For the National Capital Region
 NATIONAL CAPITAL REGION TRANSPORTATION PLANNING BOARD Item 12 CLRP Financially Constrained Long-Range Transportation Plan For the National Capital Region 2014 Performance Analysis of The Draft 2014 CLRP
SOCIO-ECONOMIC and LAND USE DATA
 SOCIO-ECONOMIC and LAND USE DATA FUTURE CONDITIONS January CHATHAM URBAN TRANSPORTATION STUDY - 1 - Table of Contents Introduction 3 TAZ - Municipality - Map Index...8 2005 Socio-economic and Land Use
Travel Time Savings Memorandum
 04-05-2018 TABLE OF CONTENTS 1 Background 3 Methodology 3 Inputs and Calculation 3 Assumptions 4 Light Rail Transit (LRT) Travel Times 5 Auto Travel Times 5 Bus Travel Times 6 Findings 7 Generalized Cost
PHILADELPHIA SUBURBAN RAIL SUMMARY (COMMUTER RAIL, REGIONAL RAIL)
") PHILADELPHIA SUBURBAN RAIL SUMMARY (COMMUTER RAIL, REGIONAL RAIL) October 2003 The Philadelphia commuter rail service area consists of 5.1 million people, spread over 1,800 square miles at an average population
PHILADELPHIA SUBURBAN RAIL SUMMARY (COMMUTER RAIL, REGIONAL RAIL) October 2003 The Philadelphia commuter rail service area consists of 5.1 million people, spread over 1,800 square miles at an average population
2.1 Outline of Person Trip Survey
 Trip Characteristics 2.1 Outline of Person Trip Survey 2.1.1 Outline of the Survey The Person Trip survey was carried out from 2006 to 2007 as a part of the Istanbul Transportation Master Plan undertaken
Denver Car Share Program 2017 Program Summary
 Denver Car Share Program 2017 Program Summary Prepared for: Prepared by: Project Manager: Malinda Reese, PE Apex Design Reference No. P170271, Task Order #3 January 2018 Table of Contents 1. Introduction...
Transportation Statistical Data Development Report BAY COUNTY 2035 LONG RANGE TRANSPORTATION PLAN
 Transportation Statistical Data Development Report BAY COUNTY 2035 LONG RANGE TRANSPORTATION PLAN Prepared for Bay County Transportation Planning Organization and The Florida Department of Transportation,
Yonge-Eglinton. Mobility Hub Profile. September 19, 2012 YONGE- EGLINTON
 September 19, 2012 PEEL YORK HALTON DURHAM HAMILTON TORONTO YONGE- EGLINTON MOBILITY HUBS: places of connectivity between regional and rapid transit services, where different modes of transportation come
Travel Demand Modeling at NCTCOG
 Travel Demand Modeling at NCTCOG Arash Mirzaei North Central Texas Council Of Governments for Southern Methodist University The ASCE Student Chapter October 24, 2005 Contents NCTCOG DFW Regional Model
Trip Generation and Parking Study New Californian Apartments, Berkeley
 Trip Generation and Parking Study New Californian Apartments, Berkeley Institute of Transportation Engineers University of California, Berkeley Student Chapter Spring 2012 Background The ITE Student Chapter
Green Line Long-Term Investments
 Enhancements Short-term improvements to keep Austin moving. Investments Long-term projects to support our future. Mobility Hubs MetroRapid MetroRail MetroExpress Connectors Circulators Project Connect
The Value of Travel-Time: Estimates of the Hourly Value of Time for Vehicles in Oregon 2007
 The Value of Travel-Time: Estimates of the Hourly Value of Time for Vehicles in Oregon 2007 Oregon Department of Transportation Long Range Planning Unit June 2008 For questions contact: Denise Whitney
TORONTO TRANSIT COMMISSION REPORT NO.
 Revised: March/13 TORONTO TRANSIT COMMISSION REPORT NO. MEETING DATE: March 26, 2014 SUBJECT: COMMUNITY BUS SERVICES ACTION ITEM RECOMMENDATION It is recommended that the Board not approve any routing
Parks and Transportation System Development Charge Methodology
 City of Sandy Parks and Transportation System Development Charge Methodology March, 2016 Background In order to implement a City Council goal the City of Sandy engaged FCS Group in January of 2015 to update
2 VALUE PROPOSITION VALUE PROPOSITION DEVELOPMENT
 2 VALUE PROPOSITION The purpose of the Value Proposition is to define a number of metrics or interesting facts that clearly demonstrate the value of the existing Xpress system to external audiences including
How to Create Exponential Decline in Car Use in Australian Cities. By Peter Newman, Jeff Kenworthy and Gary Glazebrook.
 How to Create Exponential Decline in Car Use in Australian Cities By Peter Newman, Jeff Kenworthy and Gary Glazebrook. Curtin University and University of Technology Sydney. Car dependent cities like those
Jeff s House. Downtown Charlottesville. PEC Office
 Jeff s House Downtown Charlottesville PEC Office Year 2000 US Census Data Employed persons over 16 Percentage of Employed Persons Locality Avg Commute (in minutes) Drove Public Transit Walk/Bike Other
Subarea Study. Manning Avenue (CSAH 15) Corridor Management and Safety Improvement Project. Final Version 1. Washington County.
 Corridor Management and Safety Improvement Project. Final Version 1. Washington County.") Subarea Study Manning Avenue (CSAH 15) Corridor Management and Safety Improvement Project Final Version 1 Washington County June 12, 214 SRF No. 138141 Table of Contents Introduction... 1 Forecast Methodology
Subarea Study Manning Avenue (CSAH 15) Corridor Management and Safety Improvement Project Final Version 1 Washington County June 12, 214 SRF No. 138141 Table of Contents Introduction... 1 Forecast Methodology
Public Transit in America:
 Public Transit in America: Findings from the 1995 Nationwide Personal Transportation Survey September 1998 Center for Urban Transportation Research University of South Florida 4202 East Fowler Avenue,
2015 LRT PASSENGER COUNT. CAPITAL and METRO LINES
 2015 LRT PASSENGER COUNT CAPITAL and METRO LINES Project Team: ETS Transit Data Management Transportation Planning Strategic Monitoring and Analysis April, 2016 2015 LRT PASSENGER COUNT Edmonton Transit
Road Safety s Mid Life Crisis The Trends and Characteristics for Middle Aged Controllers Involved in Road Trauma
 Road Safety s Mid Life Crisis The Trends and Characteristics for Middle Aged Controllers Involved in Road Trauma Author: Andrew Graham, Roads and Traffic Authority, NSW Biography: Andrew Graham has been
Carsharing for Older Populations
 Carsharing for Older Populations Susan A. Shaheen, Ph.D. Co-Director, Transportation Sustainability Research Center (TSRC), UC Berkeley sashaheen@tsrc.berkeley.edu Transportation Research Board 90 th Annual
WATFORD LOCAL PLAN PART 2. Review of Car Parking Policy and Standards. Evidence Base. February 2012
 WATFORD LOCAL PLAN PART 2 Review of Car Parking Policy and Standards Evidence Base February 2012 1.0 Background 1.1 The Watford District Plan 2000 contains various policies relating to the provision of
Trip Generation and Parking Utilization Data Collection at Mini-Mart with Gas Station
 Trip Generation and Parking Utilization Data Collection at Mini-Mart with Gas Station Final Report 2013 ITE District 6 - Data Collection Project Institute of Transportation Engineers Student Chapter at
Tarrant County Projected Population Growth
 Based on the information provided in the preceding chapters, it is apparent that there are a number of issues that must be addressed as The T works to develop an excellent transit system for Fort Worth
Dr. K. Gunasekaran Associate Professor Division of Transportation Engineering Anna University Chennai
 Dr. K. Gunasekaran Associate Professor Division of Transportation Engineering Anna University Chennai INTRODUCTION Bus Transport is the most preferred Public Transport System in many Indian cities Recent
Northwest Residential Electric Bills
 Henry Lorenzen Chair Oregon Bill Bradbury Oregon Phil Rockefeller Washington Tom Karier Washington W. Bill Booth Vice Chair Idaho James Yost Idaho Pat Smith Montana Jennifer Anders Montana July 2016 Northwest
A Transit Plan for the Future. Draft Network Plan
 A Transit Plan for the Future Draft Network Plan Project Overview and Status Completed Market Analysis and Service Evaluation. Developed Plan Framework and Guiding Principles. Developed a draft Five Year
Technical Memorandum Analysis Procedures and Mobility Performance Measures 100 Most Congested Texas Road Sections What s New for 2015
 Technical Memorandum Analysis Procedures and Mobility Performance Measures 100 Most Congested Texas Road Sections Prepared by Texas A&M Transportation Institute August 2015 This memo documents the analysis
WORTHINGTON SCHOOLS ENROLLMENT PROJECTIONS REPORT FEBRUARY 14, 2018
 FEBRUARY 14, 2018 PREPARED FOR: Worthington Schools 200 E. Wilson Bridge Rd. Worthington, OH 43085 T 614.450.6000 PREPARED BY: Cooperative Strategies 3325 Hilliard Rome Road Hilliard, OH 43026 T 614.798.8828
APPENDIX 6: Transportation Modelling Considerations City of Toronto, February 2014
 APPENDIX 6: Transportation Modelling Considerations City of Toronto, February 2014 Transportation and Infrastructure The future of the elevated Gardiner Expressway east of Jarvis Street forms part of a
Environmental Assessment Derry Road and Argentia Road Intersection
 Air and Noise Study Environmental Assessment Derry Road and Argentia Road Intersection Project 11-4295 City of Mississauga, Region of Peel October 17, 2014 1 Region of Peel Environmental Assessment for
NATIONAL ASSOCIATION OF AUTOMOBILE MANUFACTURERS OF SOUTH AFRICA
 NATIONAL ASSOCIATION OF AUTOMOBILE MANUFACTURERS OF SOUTH AFRICA GROUND FLOOR, BUILDING F ALENTI OFFICE PARK 457 WITHERITE ROAD, THE WILLOWS, X82 PRETORIA PO BOX 40611, ARCADIA 0007 TELEPHONE: (012) 807-0152
Can Public Transportation Compete with Automated and Connected Cars?
 Can Public Transportation Compete with Automated and Connected Cars? RALPH BUEHLER, VIRGINIA TECH, ALEXANDRIA, VA Based on: Buehler, R. 2018. Can Public Transportation Compete with Automated and Connected
Back to the Future? Land Use, Mobility & Accessibility in Metropolitan China Day 23 C. Zegras. Contents
 Back to the Future? Land Use, Mobility & Accessibility in Metropolitan China 11.953 Day 23 C. Zegras Contents Remember the Developing World..? Motorization! China: Motorization and its Challenges Land
Calgary Transit and the Calgary Transportation Plan Chris Jordan, M.Sc., P.Eng. Coordinator, Strategic Transit Planning, Calgary Transit
 Calgary Transit and the Calgary Transportation Plan Chris Jordan, M.Sc., P.Eng. Coordinator, Strategic Transit Planning, Calgary Transit 1. Plan It Calgary the new Municipal Development Plan and Calgary
EVALUATING THE SOCIO-ECONOMIC AND ENVIRONMENTAL IMPACT OF BATTERY OPERATED AUTO RICKSHAW IN KHULNA CITY
 Proceedings of the 4 th International Conference on Civil Engineering for Sustainable Development (ICCESD 2018), 9~11 February 2018, KUET, Khulna, Bangladesh (ISBN-978-984-34-3502-6) EVALUATING THE SOCIO-ECONOMIC
Introduction. Problem and methodology
 Introduction The motorcycle business in Germany does not only have a long tradition but in fact has its origins in Germany with the invention of Daimler s Reitwagen ( riding wagon ) in the year 1885. And
Findings from the Limassol SUMP study
 5 th European Conference on Sustainable Urban Mobility Plans 14-15 May 2018 Nicosia, Cyprus Findings from the Limassol SUMP study Apostolos Bizakis Deputy PM General Information The largest city in the
WLTP DHC subgroup. Draft methodology to develop WLTP drive cycle
 WLTP DHC subgroup Date 30/10/09 Title Working paper number Draft methodology to develop WLTP drive cycle WLTP-DHC-02-05 1.0. Introduction This paper sets out the methodology that will be used to generate
Benefits of greener trucks and buses
 Rolling Smokestacks: Cleaning Up America s Trucks and Buses 31 C H A P T E R 4 Benefits of greener trucks and buses The truck market today is extremely diverse, ranging from garbage trucks that may travel
LRT Preferred to Subway in Scarborough
 FOR IMMEDIATE RELEASE LRT Preferred to Subway in Scarborough Most want to cancel subway and build something else In a random sampling of public opinion taken by the Forum Poll among 667 Toronto voters,
Alpine Highway to North County Boulevard Connector Study
 Alpine Highway to North County Boulevard Connector Study prepared by Avenue Consultants March 16, 2017 North County Boulevard Connector Study March 16, 2017 Table of Contents 1 Summary of Findings... 1
Memorandum. To: The Arlington County Board Date: June 29, 2018 From: Subject:
 OFFICE OF THE COUNTY MANAGER 2100 Clarendon Boulevard, Suite 302, Arlington, VA 22201 TEL 703.228.3120 FAX 703.228.3218 TTY 703.228.4611 www.arlingtonva.us Memorandum To: The Arlington County Board Date:
CHAPTER 9. PARKING SUPPLY
 CHAPTER 9. PARKING SUPPLY The goal of this chapter is to provide City and University decision-makers with information about Study Area parking that can be used to determine the amount of parking that should
DRIVER SPEED COMPLIANCE WITHIN SCHOOL ZONES AND EFFECTS OF 40 PAINTED SPEED LIMIT ON DRIVER SPEED BEHAVIOURS Tony Radalj Main Roads Western Australia
 DRIVER SPEED COMPLIANCE WITHIN SCHOOL ZONES AND EFFECTS OF 4 PAINTED SPEED LIMIT ON DRIVER SPEED BEHAVIOURS Tony Radalj Main Roads Western Australia ABSTRACT Two speed surveys were conducted on nineteen
Issues Facing the Panel
 Issues Facing the Panel Choice of technology for Sheppard Avenue (not for every corridor every where for all time!): subway vs. LRT Budget implications I would argue that procurement, construction management
Mass Transit in Charlotte and San Antonio. Keith T. Parker, AICP
 Mass Transit in Charlotte and San Antonio Keith T. Parker, AICP President/CEO Presentation Overview Charlotte Agency and Customer Profile San Antonio Agency and Customer Profile Attracting New Customers
Consumer Attitude Survey
 Consumer Attitude Survey Spring 2018 Consumer Attitude Survey Spring 2018 2 Consumer Attitude Survey Spring 2018 Contents Introduction.. 4 Regional breakdown...... 5 Consumer views General perceptions..
ITEM 9 Information October 19, Briefing on the Performance Analysis of the Draft 2016 CLRP Amendment
 ITEM 9 Information October 19, 2016 Briefing on the Performance Analysis of the Draft 2016 CLRP Amendment Staff Recommendation: Issues: Background: Receive briefing None The board will be briefed on a
Motorcycling. New Zealand Household Travel Survey October 2015
 Motorcycling New Zealand Household Travel Survey 2009-2014 October 2015 Disclaimer: All reasonable endeavours are made to ensure the accuracy of the information in this report. However, the information
Visioning and Backcasting for UK Transport Policy
 Visioning and Backcasting for UK Transport Policy Robin Hickman & David Banister The Bartlett School of Planning, University College London & Halcrow Group VIBAT September 2005 1>VIBAT: Today Project structure
Application of EMME3 and Transportation Tomorrow Survey (TTS) for Estimation of Zonal Time Varying Population Density Distribution in
 for Estimation of Zonal Time Varying Population Density Distribution in") Application of EMME3 and Transportation Tomorrow Survey (TTS) for Estimation of Zonal Time Varying Population Density Distribution in the Greater Toronto Area Prepared by: Matthew Roorda, Associate Professor
Application of EMME3 and Transportation Tomorrow Survey (TTS) for Estimation of Zonal Time Varying Population Density Distribution in the Greater Toronto Area Prepared by: Matthew Roorda, Associate Professor
Excessive speed as a contributory factor to personal injury road accidents
 Excessive speed as a contributory factor to personal injury road accidents Jonathan Mosedale and Andrew Purdy, Transport Statistics: Road Safety, Department for Transport Summary This report analyses contributory
2018 Automotive Fuel Economy Survey Report
 2018 Automotive Fuel Economy Survey Report The Consumer Reports Survey Team conducted a nationally representative survey in May 2018 to assess American adults attitudes and viewpoints on vehicle fuel economy.
NOTAT. Mopeds - Risk of serious injury or death Delnotat III. Transport-, Bygnings- og Boligministeriet. knallert og lille motorcykel.
 NOTAT Til Transport-, Bygnings- og Boligministeriet Vedr. Forskningsprojekt om aldersgrænsen for erhvervelse af kørekort til stor knallert og lille motorcykel. Fra Mette Møller, Kira H. Janstrup, Luca
April 2010 April 2010 Presented by Alan Eirls
 April 2010 April 2010 Presented by Alan Eirls A Partnership Between the Coeur d Alene Tribe, the State of Idaho, the KMPO, and Kootenai County. Current System The Citylink system began on the Coeur d Alene
National Capital Region Travel Trend Study Parts 2 and 3
 National Capital Region Travel Trend Study Parts 2 and 3 National Capital Region January 2011 National Capital Region Travel Trend Study Parts 2 and 3 National Capital Region January 2011 HDR itrans 1545
Urban Land Use/Transport Policy, Metro and Its Impacts in Shanghai
 Towards Low Carbon Cities: Understanding and analyzing urban energy and carbon February 17-18, 2009,Nagoya Urban Land Use/Transport Policy, Metro and Its Impacts in Shanghai Pan Haixiao, Professor Department
THE WAY WE MOVE LRT FOR EVERYONE
 THE WAY WE MOVE LRT FOR EVERYONE 2 LRT for Everyone LRT FOR EVERYONE Light rail is about more than transit; it s about transforming Edmonton. As the city grows, so do its transportation needs. LRT is an
Factors Affecting Vehicle Use in Multiple-Vehicle Households
 Factors Affecting Vehicle Use in Multiple-Vehicle Households Rachel West and Don Pickrell 2009 NHTS Workshop June 6, 2011 Road Map Prevalence of multiple-vehicle households Contributions to total fleet,