Appendix F Model Development Report
|
|
|
- Clement Hubbard
- 5 years ago
- Views:
Transcription
1 Appendix F Model Development Report
2 This page intentionally left blank.

3 Westside Mobility Plan Model Development Report December 2015
4 WESTSIDE MOBILITY PLAN MODEL DEVELOPMENT REPORT December 2015 Originally Prepared in 2011; Updated in 2015 for CTCSP & West LA EIR Prepared for: LOS ANGELES DEPARTMENT OF TRANSPORTATION Prepared by: 201 Santa Monica Boulevard, Suite 500 Santa Monica, California (310) Ref: SM
5 TABLE OF CONTENTS 1. Introduction Model Development... 3 Overview... 3 Roadway Network... 3 Transit Network TAZ Structure Model Component Modifications Initialization Network Skimming Trip Generation Trip Distribution Modal Split Production/Attraction (PA) to Origin/Destination (OD) Trip Assignment Feedback Stage Model Run Time Peak Hour Traffic Volumes Static Model Validation Model Validation Dynamic Model Validation Land Use Tests Highway Network Tests Transit Network Tests Induced and Suppressed Demand Tests Auto Trip Variables Tests Summary of Dynamic Validation Testing Results Conclusions The 4D Process Introduction to the D s D Elasticity Values Initial Sensitivity Tests Model Integration Amendments to CTCSP & WLA TIMP SCAG RTP Consistency Project List updates CTCSP & WLA TIMP Impact Analysis... 72
6 APPENDICES Appendix A: LADCP Base Year Land Use Changes Appendix B: Socio-Economic Data Appendix C: Network Skimming Appendix D: Trip Distribution Appendix E: Mode Split Appendix F: Trip Assignment Appendix G: Traffic Counts Appendix H: Peak Period Static Model Validation and Screenline Results Appendix I: Peak Period Dynamic Model Validation Results Appendix J: Westside TDF Model Plots for Existing, 2035 without Project, and 2035 Plus Project Conditions
7 LIST OF FIGURES Figure 1 Model Focus Area... 2 Figure 2 Components of the Travel Demand Model... 4 Figure 3 Roadway Network Modifications... 6 Figure 4 All-Day Travel Lanes... 7 Figure 5 Peak Period Parking Restrictions... 8 Figure 6 Westside Transit Network Figure 7 Traffic Analysis Zone Modifications Figure 8 Static Model Validation Traffic Count Locations Figure 9 Static Model Validation Screenlines Figure 10 Dynamic Validation Test Add/Remove Highway Network Capacity Figure 11 Dynamic Validation Test Add a Link Figure 12 Dynamic Validation Test Delete a Link Figure 12 Dynamic Validation Test Delete a Link Figure 13 Dynamic Validation Test Induced Demand Figure 14 4D Enhancement Model Integration... 63
8 LIST OF TABLES Table 1 Model TAZ Structure Comparison Table 2 Westside Study Area Socioeconomic Data Table 3 City of Santa Monica Model Base Year (2008) Land Use Comparison Table 4 Daily Transit Ridership Comparison to 2010 Metro Data Table 5 Household Trip Generation Data for Los Angeles County Table 6 Peak and Off-Peak Person Trip Production for Los Angeles County Table 7 Trip Distribution Summary for Los Angeles County Table 8 Mode Split Comparison for Los Angeles County Table 9 Average Auto Occupancy Table 10 Vehicle Time-of-Travel Summary Table 11 Trip Assignment Statistics Table 12 Los Angeles County Highway Performance Measures Table 13 Comparison of Los Angeles County Daily VMT to HPMS Data Table 14 Peak Period to Peak Hour Factors Table 15 Peak Hours of Travel in the Westside Table 16 Model Time Periods Comparison Table 17 Results of Peak Period Highway Static Model Validation Within the Westside Study Area: SCAG 2008 RTP Model Table 18 Results of Peak Period Highway Static Model Validation Within the Westside Study Area: City of Los Angeles Model Table 19 Results of Peak Period Highway Static Model Validation Within the Westside Study Area: Westside Mobility Plan Sub-Area Model Table 20 Results Within the Westside Study Area for Congested and Uncongested Locations: Westside Mobility Plan Sub-Area Model Table 21 Results of Daily Highway Static Model Validation Within the Westside Study Area: Westside Mobility Plan Sub-Area Model Table 22 Results of Peak Period Transit Static Model Validation Within the Westside Study Area: SCAG 2008 RTP Model Table 23 Results of Peak Period Transit Static Model Validation Within the Westside Study Area: Westside Mobility Plan Sub-Area Model... 36
9 Table 24 Peak Period Transit Boardings for Routes along the Westside Study Corridors Table 25 Initial Elasticities 4D Model Enhancements for Westside Mobility Plan TDF Model Table 26 Test #1: Uniform Density Increase Table 27 Test #2: Density Increase in a Select Area Table 28 Test #3: Balancing Land Use in a Single Area Table 29 Final 4D Elasticites For Westside Mobility Plan TDF Model Table 30 Westside Study Area Socioeconomic Data Table 31 Potential Transportation ImProvements (Project list Updates)... 68
10 1. INTRODUCTION The City of Los Angeles Travel Demand Forecasting (TDF) Model provides the ability to evaluate the transportation system, use performance indicators for land use and transportation alternatives, provide information on regional pass-through traffic versus locally generated trips, and graphically display these results. The model is sensitive to emerging land use trends through improved sensitivity to built environment variables referred to as the 4Ds. In essence, the travel demand model serves as a tool to implement, manage and monitor the City of Los Angeles transportation plans, projects, and programs, providing a suitable starting point for additional refinement as part of a more local application, such as the Westside Mobility Plan and proposed amendments to the Coastal Transportation Corridor Specific Plan (CTCSP) and West Los Angeles Transportation Improvement and Mitigation Specific Plan (WLA TIMP). Fehr & Peers developed a travel demand model for the City of Los Angeles as part of the Transportation Strategic Plan Study. The City of Los Angeles TDF Model provided the starting point for creating a more detailed, locally valid model for the Westside Mobility Plan and Specific Plan amendments to which future roadway improvements and land use assumptions could be added. Starting with a regionally valid model ensured the model captured regional traffic flow patterns and transit ridership while the additional detail and model refinements from the City of Los Angeles Model development process allowed the model to more accurately capture travel patterns within the City boundary. To develop a model for the Westside, land use and roadway network detail were added within and around the study area. Additional modifications were also made to key model components based on data provided by the City of Los Angeles to allow the model to more accurately capture traffic patterns within and around the Westside. The SCAG model area, encompassing a six-county region and representing the starting point for the model, is shown on Figure 1 along with the City of Los Angeles windowed model area and the Westside Mobility Plan model focus area. This report documents the model structure and methodological approach to the development of the travel demand model for the Westside Mobility Plan and Specific Plan amendments, including the assumptions and sources of data used to develop key model inputs and refine model components. A summary of how well the model performed against validation thresholds established by the California Transportation Commission is also provided. The additional refinement and model enhancements for the Westside Mobility Plan TDF Model comply with the 2010 California Regional Transportation Plan Guidelines, which outline model development expectations and validation tests for all travel demand models used by public agencies in California. Compliance with these guidelines indicates that the model is suitable for developing traffic volume forecasts to evaluate future land use changes and transportation system improvements within the Westside study area. Having a locally valid model is a critical step in ensuring a high level of confidence for traffic volume forecasts. 1

11 Figure 1 Model Focus Area 2
12 2. MODEL DEVELOPMENT OVERVIEW The Westside Mobility Plan TDF model was based on the City of Los Angeles Model, which utilizes the TransCAD Version 4.8 Build 500 modeling software. The model was designed to produce AM and PM peak period vehicle and transit flows on roadways within the Westside study area based on comprehensive land use and socio-economic data (SED). The model utilizes a conventional four-step process consisting of trip generation, trip distribution, modal split, and assignment. The model components, including key model inputs and outputs, are summarized on Figure 2. Additional detail regarding the grandparent SCAG TDF model can be obtained in the User s Guide for the SCAG Planning Model (Southern California Association of Governments, June, 2008), and additional detail regarding the parent City of Los Angeles Model can be obtained in the City of Los Angeles Model Draft Model Development Report (Fehr & Peers, December, 2010). The roadway and transit networks along with the traffic analysis zone (TAZ) structure were modified within and around the Westside study area to ensure the model produced traffic forecasts that reasonably resembled observed traffic counts and transit ridership data. Following validation of base year (2008) forecasts and transit ridership, the modifications to the base year TDF model are applied to the future year (2035) TDF model to produce forecasts of future vehicle and transit flows within and around the Westside study area. This section summarizes the roadway network, transit network, TAZ structure, and model component changes made to the base year (2008) model to develop a refined sub-area model for the Westside Mobility Plan and Specific Plan amendments. ROADWAY NETWORK The roadway network within the City of Los Angeles boundary was refined to reflect the Circulation Plans for each of the current Community Plan Areas. The majority of additional roadway network detail represents collector roadways, which are not typically included in regional models. However, they were included in the City of Los Angeles and Westside Mobility Plan models to improve forecast sensitivity and accuracy for these types of roadways. The inclusion of collector roadways also improves the loading of traffic onto arterials and highways, providing a more detailed representation of traffic flows and increasing the accuracy of the resulting traffic volume forecasts. As part of the Westside Mobility Plan, an additional 25 roadway link miles were added within the Westside study area. 3

13 Figure 2 Components of the Travel Demand Model 4
14 A comparison of the base year SCAG 2008 RTP model roadway network and the base year (2008) Westside Mobility Plan sub-area model roadway network is shown on Figure 3. The roadway network within adjacent cities and geographic areas such as Santa Monica, Culver City and the South Bay were also verified using aerial photography and field work collected for other recent studies conducted by Fehr & Peers. Roadway Network Attribute Data Roadway segment attribute data such as the number of lanes, roadway classification, and travel speed were checked against field data provided by LADOT and SCAG as well as field data collected by Fehr & Peers within and around the City of Los Angeles. Field data collected for the projects listed above was included along with the data provided by SCAG as part of the SCAG Regional Highway Network Study. The following link attributes were checked to ensure the model matched observed data: Number of lanes (including peak hour parking restrictions) Facility type (used to determine capacity) Length Free-flow travel speed Travel modes allowed This data was also used to determine peak period parking restrictions on roadway segments included in the model since peak period parking restrictions were not included in the SCAG RTP model. The number of all-day travel lanes for roadways within the Westside study area is shown on Figure 4. Roadway segments with a peak period parking restriction in either one or both directions are shown on Figure 5. Node attribute data was also checked to ensure the model matched observed conditions. Attribute data, such as intersection type and node type, were checked for nodes representing intersections, traffic analysis zones (TAZs), park and ride lots, Metrolink stations, and urban rail stations. Additionally, intersection turn prohibitions were added to the model to ensure the appropriate loading of vehicles onto the roadway network. 5

15 Figure 3 Roadway Network Modifications 6

16 Figure 4 All-Day Travel Lanes 7


17 Figure 5 Peak Period Parking Restrictions 8
18 Centroid Connector Reconfiguration As part of the Westside Mobility Plan TDF model development, the number and placement of centroid connectors was further refined to load trips onto the roadway network at an even more localized level for TAZs within the Westside study area and adjacent cities such as Santa Monica and Culver City. Centroid connectors typically represent local streets and determine how trips originating or terminating at TAZs access the collectors and arterials included in the roadway network. Therefore, the location, configuration, and number of centroid connectors have a significant impact on how traffic is assigned to the network. The majority of centroid connectors in the original SCAG RTP model load traffic to the nearest intersection of a collector or arterial roadway rather than at mid-block locations where local streets typically connect to the street system. To load trips onto the roadway network at a more localized level, centroid connectors associated with TAZs were modified to load at mid-block locations. The number and placement of centroid connectors was also modified to reflect the location of local streets and how they interact with collector and arterial roadways. Highway Network Checks A series of highway network tests were conducted to ensure the highway network and the associated attribute data was accurately coded. These tests included a connectivity check for all roadway links within the City of Los Angeles using the line layer connectivity tool in TransCAD. This tool checks every roadway link in the network and indicates every location where roadway links cross as well as whether they intersect or are grade-separated. This tool is also useful in identifying locations where roadway links or centroid connectors appeared to connect to the highway network but did not. A series of shortest path checks in TransCAD were performed using the shortest path toolbox which returns the shortest path/distance between two points in the highway network. This tool was used to check if the distance between two selected locations was correct and to ascertain if the route chosen was reasonable based on a combination of travel distance and speed to determine uncongested travel time. For example, the model was reviewed to ensure that freeways were preferred to local streets for longer distance trips under free-flow conditions. The resulting travel distance data was also compared to data from aerial images and the resulting travel time data was checked for reasonableness against empirical congested travel time data. Finally, a test highway network skim (representing travel time) and a test traffic assignment were performed to check the highway network from a system-wide perspective. Skim values from the test highway network were checked for reasonableness against observed travel distances and times. For the traffic assignment, an origin-destination matrix, where every possible origin-destination pair was filled with one vehicle trip, was used to ensure traffic from each TAZ could be assigned to every TAZ in the model. These checks ensured that the roadway network was properly coded prior to the calibration/validation of the travel demand model. 9
19 TRANSIT NETWORK The SCAG RTP Model includes an extensive transit network of routes and stops, which is used to help determine the number of person trips utilizing various modes of transit in the model. The model includes approximately 1,645 transit routes for the entire six-county SCAG region. The model reflects numerous modes of transit, such as local bus, express bus, rapid bus, commuter rail, light rail, and heavy rail. Each route contains attribute data, such as route name, carrier, and peak and off-peak headway times. The model also includes approximately 55,840 transit stops, which are used to access and associate a fare with the corresponding transit route. All transit routes with a stop within a mile of the City of Los Angeles boundary were included along with all stops along the selected route. The portion of the selected transit routes as well as the corresponding stops extending outside the City of Los Angeles boundary were also included in the model. The resulting transit network consists of approximately 800 transit routes and 30,960 transit stops, representing nearly half the transit facilities within the SCAG region. For the Westside Mobility Plan model, it was determined that 155 transit routes have a stop within the Westside study area with a total of 1,570 stops, representing approximately 20 percent of the transit routes within the City of Los Angeles. Figure 6 shows the transit routes within and around the Westside study area by transit carrier at the time of model calibration (Year 2008). 10

20 Figure 6 Westside Transit Network 11
21 TAZ STRUCTURE The SCAG RTP model TAZ structure was used as the basis for the City of Los Angeles Model s TAZ structure, and was further disaggregated as part of the Westside Mobility Plan TAZ system development. TAZ disaggregation allows the model to more accurately capture the flow of person trips through the model and the modes in which they travel. Aside from more accurately representing the spatial location of land use, TAZ disaggregation reduces the size of TAZs in the model. This helps to reduce the number of trips internalized by each zone by providing additional access to the roadway network as well as a smaller amount of land use to potentially interact. For instance, a homebased work trip may not be assigned to the roadway network if it can be satisfied within the zone from which it is based. If the zone were split into a zone with jobs and a zone with households, the trip would be forced to travel from one zone to the other using the roadway network. This trip would now be accounted for on the roadway network and used to calculate congested speeds for use in the assignment and feedback iterations as well as to calculate performance measures such as vehicle miles of travel and emissions. The reduction of intra-zonal trips also has a direct impact on the number of auto, walk, bike, and transit trips estimated by the model. This is because the mode choice component of the model is performed after the trip distribution stage and is based on various mode choice variables including distance and travel time. Since the number of intra-zonal trips have already been determined during the trip distribution stage and do have not distance or travel time associated with them, a default calculation must be performed. Therefore, intra-zonal trips for very large TAZs have their travel time calculated the same way as the travel time for intra-zonal trips for very small TAZs when in actuality an intra-zonal trip in a very large TAZ could be traveling much further. Increasing the number of TAZs reduces the number of intra-zonal trips that occur simply due to large TAZ sizes and enhances the model s mode choice component. The SCAG RTP model contained approximately 890 TAZs within the City of Los Angeles. These TAZs were disaggregated to a total of 1,385 TAZs for the City of Los Angeles model. For the Westside Mobility Plan, an additional 52 TAZs were added within the City of Los Angeles and 17 TAZs in nearby jurisdictions. Within the Westside study area, the SCAG RTP model contained 99 TAZs which were disaggregated to a total of 270 TAZs for the Westside Mobility Plan and Specific Plan amendments. Mid-block connections were then used to facilitate the loading of vehicle and transit trips to the roadway and transit networks. The additional disaggregation further improves vehicle and transit trip loading but also allows for the detailed incorporation of future land use patterns in areas that are expected to experience significant changes. As shown on Figure 7, the 99 existing TAZs in the Westside study area were typically split along major roadways or physical boundaries. Potential trips relating to TAZs not included in the City of Los Angeles model were reflected as internal-to-external (I-X), external-to-internal (X-I), or external-to-external (X-X) trips associated with new external stations created at the City of Los Angeles model boundary. Table 1 provides a summary of the SCAG RTP model TAZ structure compared to the modified TAZ structure for the City of Los Angeles and Westside Mobility Plan models. 12

22 Figure 7 Traffic Analysis Zone Modifications 13
23 TABLE 1 MODEL TAZ STRUCTURE COMPARISON Category Westside Mobility Plan Sub-Area Model SCAG 2008 RTP Model Internal Zones 2,717 4,109 External Zones 9 40 Air and Port Zones Socio-Economic Data Since TAZs are used to tabulate demographic and employment data, socio-economic data (SED) from the SCAG RTP model was modified by reallocating demographic and employment assumptions from the original SCAG TAZ system to the modified TAZ system. The data for each new TAZ was allocated from its corresponding SCAG TAZ based on aerial photography, field observations, work on other projects within the City of Los Angeles, and input from the City of Los Angeles Department of City Planning (LADCP). Base year (2008) land use changes from the LADCP are provided in Appendix A. Table 2 presents the SED for the Westside TDF model within the CTCSP and WLA TIMP Specific Plan areas. Detailed base year (2008) SED estimates for the Westside study area are provided in Appendix B. TABLE 2 WESTSIDE STUDY AREA SOCIOECONOMIC DATA SED Data Location Model Calibration Year 2008 Households CTCSP Area 68,383 WLA TIMP Area 88,903 Project Area 157,286 CTCSP Area 87,679 Employment WLA TIMP Area 197,840 Project Area 285,519 Population CTCSP Area 157,466 WLA TIMP Area 197,190 Project Area 354,656 Socio-economic data for TAZs outside the City of Los Angeles boundary were checked for reasonableness against aerial photography, field observations, and work on other projects. One such project was the update of the City of Santa Monica General Plan s Land Use and Circulation Element (LUCE). As part of this project, base year (2008) socio-economic data was obtained for the City of Santa Monica. This data was compared to base year (2008) land 14
24 use from the City of Los Angeles Model. As shown in Table 3, the population, household, and employment estimates for the City of Santa Monica are within 1 percent, while student estimates are within 3 percent. Additionally, the City of Los Angeles Model daily trip productions and peak hour vehicle trip generation are within approximately 1 percent. TABLE 3 CITY OF SANTA MONICA MODEL BASE YEAR (2008) LAND USE COMPARISON Category City of Los Angeles Model (2008) Santa Monica Model (2008) Delta % Difference Population 95,766 95, % Households 48,757 48, % Jobs 90,224 89, % K-12 Students 13,008 12, % College Students 30,624 30, % Daily Trip Productions 473, ,114 2, % AM Vehicle Trips 32,559 32, % PM Vehicle Trips 38,110 37, % Trip Tables External-to-External Trip Tables Once the City of Los Angeles model roadway network, transit network, and TAZ system were developed, a full model run was performed to obtain origin-destination (OD) matrices for the entire SCAG region. The resulting OD matrices contain all the vehicle trips in the model, including the vehicle trips corresponding to pass-through traffic originating and terminating outside the City of Los Angeles model area (referred to as external-to-external trips). Since these types of vehicle trips are generally not affected by land use or transportation changes within the City of Los Angeles, they are not calculated by the City of Los Angeles model directly and were obtained for the model study area by performing a sub-area model run. The sub-area model run created a sub-area OD matrix for external-to-external vehicle trips that was checked for reasonableness against traffic count data. Internal-to-External and External-to-Internal Trip Tables In the original SCAG RTP model, vehicle trips originating in the SCAG region with a destination outside the SCAG region and vehicle trips originating outside the SCAG region with a destination within the SCAG region are not calculated by the core model procedures. Alternatively, they are accounted for in separate trip tables appended to the trip tables calculated by the model. To make the City of Los Angeles and Westside Mobility Plan models sensitive to changes in internal-to-external and external-to-internal trips associated with changes in land use or transportation 15
25 infrastructure within the City of Los Angeles, TAZs outside the model area were aggregated into larger zones encompassing most of the SED not included in TAZs within the model area. SED not included in the City of Los Angeles Model was accounted for by modifying the separate trip tables, which become appended to the trip tables calculated by the model, based on information from the sub-area model run. Internal-to-external and external-to-internal trips associated with the 70 TAZs added as part of the Westside Mobility Plan TDF model were estimated based on information from the sub-area run. Internal-to-external and external-tointernal trips associated with the 270 TAZs within the Westside study area were checked for reasonableness against observed average trip lengths from the SCAG sponsored 2000 Post-Census Regional Travel Survey. Special Generator Trip Tables In the SCAG RTP model, vehicle trips associated with special generating uses such as air and sea ports are not calculated by the core model procedures. Alternatively, they are accounted for in separate trip tables and appended to the trip tables calculated by the model. Trip tables corresponding to special generator vehicle trips were obtained through the sub-area model run procedure as described above. Within the Westside study area, the resulting OD matrices associated with Los Angeles International Airport (LAX) were further modified to match trip generation and trip distribution data obtained from the 2006 LAX Air Passenger Survey and traffic counts collected in 2008 at the driveways of LAX facilities. 16
26 3. MODEL COMPONENT MODIFICATIONS Upon review of the SCAG RTP model, it was determined that enhancements to key model components could be made to further refine observed travel patterns within the City of Los Angeles and the Westside study area. In general, the structure of the model was not modified as all four primary stages (trip generation, trip distribution, modal split, and trip assignment) of the SCAG RTP model were included with all their sub-procedures. Instead, key model input files and criteria for various model processes were modified so the model could replicate 2008 traffic conditions as discussed below, and replicate trip generation, trip distribution, modal split, and assignment characteristics. The refinement of the model components is discussed below. INITIALIZATION The SCAG RTP model uses a lookup table to determine the capacity of roadway segments based on roadway classification, number of lanes, and number of lanes crossing the roadway segment at the nearest intersection (i.e., a roadway segment s capacity will be lower on a link adjacent to an intersecting major arterial than on a link adjacent to an intersecting minor collector). The capacity lookup table associated with the model was reviewed and found to reflect the general hierarchy of street functional classes in the City of Los Angeles. The model also utilizes a lookup table to determine the travel speed on roadway segments based on the posted speed and facility type to ensure the reasonableness of travel speeds on all model roadway segments. A review of the speed lookup table was performed and it was determined that speeds in the cross-classification table were reasonable and generally matched speed data collected by Fehr & Peers within the Westside study area. NETWORK SKIMMING The SCAG RTP model uses two static variables value of time and auto operating cost to develop link costs associated with each roadway segment. The variables are used to test various routes and modes of travel to determine the lowest cost combination to travel between desired origins and destinations. This data is stored in a matrix, which is used by the trip distribution and modal split stages of the model to distribute person trips and determine the likely mode of travel for each person trip. Consequently, changes to either of these variables directly affect the average trip length as well as the mode split percentages for the model. Due to the static nature of these variables for the entire SCAG region, the default values may not be suitable for modeling travel patterns and modal share for the City of Los Angeles and Westside study area. A sensitivity analysis was performed on these variables to determine whether the model responded reasonably to changes. Based on this sensitivity analysis, it was determined that the model responded in the correct direction. Doubling auto operating cost resulted in an increase in transit and walk/bike trips and a decrease in auto trips; likewise, halving auto operating cost resulted in a similar decrease in transit and walk/bike trips and an increase in auto trips. Doubling value of time resulted in a slight increase in auto trips and a slight decrease in transit and walk/bike trips; likewise, halving value of time resulted in a slight decrease in auto trips and a slight decrease in transit and walk/bike trips. Therefore, it was determined that auto operating cost was the appropriate variable to 17
27 modify should the average vehicle trip length, mode split percentages, or transit ridership need to be modified due to the model s sensitivity to changes in the auto operating cost variable. To determine the appropriate value for the auto operating cost variable, the base year Westside Mobility Plan sub-area model daily bus ridership was compared to 2010 daily bus ridership data on individual Metro routes. Based on this comparison, it was determined that the model was overestimating bus ridership by approximately 25 percent. Therefore, auto operating cost was iteratively adjusted to obtain Metro bus ridership forecasts that were closer to observed data. The auto operating cost was modified from 60 cents per mile to 20 cents per mile. As shown in Table 4 and in more detail in Appendix C, the Westside Mobility Plan sub-area model with the modified roadway network, transit network, TAZ structure, and auto operating cost underestimated Metro bus ridership by 6 percent, overestimated Metro rail ridership by 5 percent, and underestimated total transit ridership by 4 percent. Additionally, with the 2010 daily bus ridership data the base year (2003) SCAG 2008 RTP model underestimated Metro bus ridership by 10 percent. TABLE 4 DAILY TRANSIT RIDERSHIP COMPARISON TO 2010 METRO DATA Daily Transit Ridership Transit Type 2010 Metro Data Westside Model Delta % Change Metro Bus Lines 1,071,350 1,006,828-64,522-6% Metro Rail Lines 284, ,746 13,662 5% All Metro Transit 1,355,434 1,304,574-50,860-4% Since increasing transit ridership in the model may result in unrealistic transit mode share percentages, a peak period comparison of the base year (2008) Westside Mobility Plan sub-area model s transit mode share percentage to the base year (2006) Metro Model s (which is based on the SCAG 2004 RTP model) transit mode share percentage was performed. As shown in Appendix C, the home-base-work (HBW) transit mode share percentage is 8.8 percent compared to 10.4 percent in the Metro model, an underestimation of 1.6 percent. Additionally, the transit mode share percentage for all trip purposes matched the 4.4 percent estimated by the Metro model. TRIP GENERATION The SCAG RTP model uses a vehicle availability model to determine the number of autos available to each household based on a cross-classification table that includes the households income, workers, persons, employment, and head of household age. The output values of the cross-classification table for the SCAG 2008 RTP model were estimated using SCAG 2001 Travel Survey data for the entire SCAG region. However, the average household auto ownership varies across the SCAG region and the output values may need to be adjusted for the City of Los Angeles and Westside Mobility Plan models. Therefore, average auto ownership for the entire SCAG region was compared to the average auto ownership in Los Angeles County based on data from the SCAG 2001 Travel Survey. Based on this data, the existing output values were determined to be suitable for estimating the number of vehicles available to each 18
28 household within the City of Los Angeles and the Westside, and the cross-classification table associated with the auto availability model was not modified. As shown in Table 5, the City of Los Angeles model estimates that the average household produces 4.5 automobile trips per day, compared to 4.3 in the SCAG 2001 Travel Survey. Given that underreporting can occur in household travel surveys because of the self-reporting nature of traditional survey methods, this difference is acceptable. TABLE 5 HOUSEHOLD TRIP GENERATION DATA FOR LOS ANGELES COUNTY Data Westside Model for Los Angeles County SCAG Survey for Los Angeles County Delta Households 3,153, Home-Based Person Trips 24,226, HB Person Trips Per HH Auto Trips (No Trucks) 14,269, Auto Trips Per HH VMT 167,905, VMT Per HH Person trip production rates for the SCAG region were also developed using cross-classification tables. These crossclassification tables utilize various SED along with the number of autos available to a household determined by the vehicle availability model. The output values for the cross-classification tables were compared with SCAG data to determine if daily person trip production rates are reasonable for households within the City of Los Angeles and the Westside. Based on the survey data, it was determined that the home-based work person trip production for households with zero autos was approximately 50 percent higher in Los Angeles County than the SCAG region. Since households with zero autos utilize alternative modes of travel, it was necessary to modify the home-based work person trip production rates associated with zero auto households to more accurately estimate trip generation. The other comparisons of Los Angeles County data to SCAG regional data were reasonable. As shown in Table 5, the City of Los Angeles model estimates that the average household produces 7.7 home-based person trips per day, compared to 7.3 in the SCAG Travel Survey. Given that underreporting can occur in household travel surveys because of the self-reporting nature of traditional survey methods, this difference is acceptable. After person trip productions are calculated, they are allocated to peak and off-peak time periods based on time-ofday factors for each trip purpose. These factors were adjusted by determining the time-of-day factors for all trip purposes included in the SCAG Travel Survey data. Additionally, daily traffic count data provided by LADOT was used to determine if the overall peak and off-peak percentages were reasonable. As shown in Table 6, the model 19
29 estimates 53 percent of person trips are generated in the peak period, compared to 52 percent in the SCAG Travel Survey. TABLE 6 PEAK AND OFF-PEAK PERSON TRIP PRODUCTION FOR LOS ANGELES COUNTY Time Period Los Angeles County Person Trips Los Angeles County Person Trips % SCAG Survey Person Trips % Delta Peak (7-Hour) 18,279,352 53% 52% 1% Off-Peak (17-Hour) 16,123,427 47% 48% -1% Total 34,402, % 100% 0% TRIP DISTRIBUTION The SCAG RTP model uses a standard gravity model to estimate the number of person trips from each TAZ to every other TAZ in the SCAG region. The gravity model utilizes the outputs from the network skimming stage along with friction factor tables for both peak and off-peak conditions regardless of the location of the TAZ. The gravity model was adjusted as part of the Westside Mobility Plan model development process. The number of gravity model iterations was increased to a maximum limit of 999 and the convergence criterion was reduced from 0.1 to This helps with the consistency of results between model runs. The gravity model stage of the model meets the modified convergence criteria of 0.01 for all trip purposes. To account for varying trip lengths by region, a matrix of K-factors is applied to the gravity model results to adjust the attractiveness of one TAZ to another. The friction factor tables along with the K-factor tables were not modified in the model because the average vehicle trip travel time for Los Angeles County was within two minutes of the average vehicle trip travel time for the SCAG region in the SCAG Travel Survey. A model trip distribution summary is provided in Table 7 and more detail is provided in Appendix D, which includes average trip time, average trip length, and average trip speed for peak and off-peak commute and non-commute trips in the Westside Mobility Plan TDF model. 20
30 TABLE 7 TRIP DISTRIBUTION SUMMARY FOR LOS ANGELES COUNTY Trip Type Average Trip Time (Minutes) Westside Model SCAG Survey Average Trip Length (Miles) Average Travel Speed (Miles per Hour) Commute Non-Commute All MODAL SPLIT The SCAG RTP model utilizes a multi-variable (logit) modal choice model to allocate TAZ to TAZ person trips from the trip distribution model to various travel modes including single-occupancy vehicle, dual-occupancy vehicle, three or more occupancy vehicle, walk, bike, and transit. Mode split percentages from the Westside Mobility Plan sub-area model were compared with mode split percentages from the SCAG Travel Survey data for Los Angeles County to ensure the mode split model was appropriately allocating person trips to the various modes of travel included in the model. As shown in Table 8, the Westside Mobility Plan TDF model mode split percentages for Los Angeles County are nearly identical to the mode split percentages from the SCAG Travel Survey. Total person trips and mode split percentages for each mode of travel are shown in Appendix E for the Westside study area. TABLE 8 MODE SPLIT COMPARISON FOR LOS ANGELES COUNTY Mode Westside Mobility Plan Sub-Area Model SCAG Survey Auto 81% 80% Total Non-Auto 19% 20% Transit 3% 3% Walk/Bike 16% 17% An additional test was performed to ensure the mode split model was properly allocating person trips to the various modes of travel included in the model. As shown previously in Table 5 from the trip generation discussion, the City of Los Angeles model estimates the average household produces 4.5 auto trips per day, compared to 4.3 in the SCAG Travel Survey. Given that underreporting can occur in household travel surveys because of the self-reporting nature of traditional survey methods, this difference is acceptable. Additionally, average auto occupancy for the Westside Mobility Plan TDF model was compared with SCAG Travel Survey data to ensure the mode split model was reasonably allocating motorized person trips between singleoccupancy and multi-occupancy vehicles. As shown in Table 9, the Westside Mobility Plan TDF model estimates the 21
31 average peak period (i.e., 7-10 AM and 3-7 PM) auto occupancy is 1.64 persons per vehicle for all trip purposes, compared to 1.58 persons per vehicle in the SCAG Travel Survey, a difference of less than 4 percent. TABLE 9 AVERAGE AUTO OCCUPANCY Time Period Westside Mobility Plan Sub- Area Model SCAG Travel Survey Delta Peak (7-Hour) Off-Peak (17-Hour) PRODUCTION/ATTRACTION (PA) TO ORIGIN/DESTINATION (OD) The PA to OD stage of the SCAG RTP model converts motorized vehicle person trips and transit person trips from PA matrices broken down by trip purpose into OD matrices broken down by mode of travel. The model then converts the OD matrices into AM and PM peak period matrices by using one set of time-of-day (diurnal) factors for the entire SCAG region. Therefore, these time-of-day values were adjusted to match time of day data from the SCAG Travel Survey data. As shown in Table 10, the time-of-day data from the Westside Mobility Plan sub-area model are nearly identical to the time-of-day data from the SCAG Travel Survey. TABLE 10 VEHICLE TIME-OF-TRAVEL SUMMARY Time Period Westside Mobility Plan Sub- Area Model SCAG Survey Delta AM (3-Hour) 22% 22% 0% PM (4-Hour) 31% 30% 1% TRIP ASSIGNMENT The vehicle trip assignment model consists of a series of multi-class simultaneous equilibrium assignments for six classes of vehicles for the AM and PM peak periods. The model currently utilizes 40 iterations with a convergence criterion of However, based on sensitivity testing it was determined that the AM and PM peak period assignment procedures did not reach the specified convergence criteria with additional highway network and TAZ detail included in the model. Additionally, since the model will serve as a tool to implement, manage and monitor the City of Los Angeles transportation plans, projects, and programs, it was determined that a lower convergence criterion was more appropriate for local applications of the model where additional roadway network and TAZ detail may be added, such as the Westside Mobility Plan. 22
32 Given the 40+ hour run time of the SCAG RTP model and the desire to limit the run time to less than 20 hours, the City of Los Angeles Model and Westside Mobility Plan sub-area model utilize 999 iterations with a convergence criterion of The AM peak period assignment procedure reaches the specified convergence criterion in 125 iterations and the PM peak period assignment reaches the specified convergence criterion in 156 iterations. A summary of trip assignment statistics is provided in Table 11. TABLE 11 TRIP ASSIGNMENT STATISTICS Time Period Westside Mobility Plan Sub-Area Model SCAG 2008 RTP Model Max Assignment Iterations Assignment Convergence Criterion Total Model Run Time 13 Hours 40+ Hours Classes of Vehicles 6 6 The highway assignment model was also modified to include turn prohibitions and provide AM and PM peak period turning movement volumes at specified intersections. The ability to perform select link/zone analyzes was also included in the model. A summary of highway network performance measures for Los Angeles County is shown in Table 12 and additional detail is provided in Appendix F. As shown in Table 12, the base year (2008) Westside Mobility Plan TDF model estimates that approximately 167,900,000 vehicle miles are traveled on Los Angeles County roadways on an average weekday. Additionally, the model estimates that approximately 8.4 million hours are spent in vehicles on Los Angeles County roadways on an average weekday, with approximately 4.3 million hours caused by congestion. TABLE 12 LOS ANGELES COUNTY HIGHWAY PERFORMANCE MEASURES Performance Measure AM Peak Period (3-Hour) PM Peak Period (4-Hour) Daily Vehicle Miles Traveled 40,600,000 58,100, ,900,000 Vehicle Hours Traveled 2,400,000 3,600,000 8,400,000 Vehicle Hours of Delay 1,400,000 2,100,000 4,300,000 Average Speed (Mph) VMT Per HH + Jobs The model estimated vehicle miles of travel on Los Angeles County roadways was compared to vehicle miles of travel data from the Highway Performance Monitoring System (HPMS), a nationwide FHWA inventory system that includes data for all of the nation s public road mileage, to ensure the base year model estimated vehicle miles of travel was 23
33 reasonable. This is an important step in the development of the model since vehicle miles of travel estimates from the Westside Mobility Plan TDF model will be used as an input for vehicle emission modeling. A summary of the HPMS comparison is shown in Table 13 and additional detail is provided in Appendix F. TABLE 13 COMPARISON OF LOS ANGELES COUNTY DAILY VMT TO HPMS DATA Performance Measure HPMS (2009) Westside Model (2008) Delta % Difference Miles of Roadway 21,678 18,232-3,446-16% Vehicle Miles Traveled 214,236, ,135,811-26,101,039-12% Gas and Diesel Sold in 2009 (Gallons) 4,378,110,000 4,378,110, Average Miles Per Gallon % As shown in Table 13, the 2008 Westside Mobility Plan sub-area model (with all Los Angeles County roadways including centroid connectors to represent local streets) underestimates 2009 vehicle miles of travel by 12 percent. However, a majority of roadways in Palmdale, Lancaster, and unincorporated portions of Los Angeles County were removed and the TAZs aggregated to reduce model run time, resulting in 16 percent fewer miles of roadway accounted for in the VMT calculation. Due to the one year difference in comparison years and the extensive model aggregation performed to develop the model, vehicle miles of travel data from the original base year SCAG 2008 RTP model was also compared to 2009 HPMS data. As shown in Appendix F, the original base year SCAG 2008 RTP model only underestimates vehicle miles of travel by 4 percent. Additionally, when the vehicle miles of travel data from the base year SCAG 2008 RTP model was factored up to 2009 conditions (based on an observed vehicle trip growth of 0.6 percent from the base year SCAG model to the future year (2035) SCAG model) the model was found to only underestimate vehicle miles of travel by 1 percent. The two sets of comparisons suggest the daily VMT estimates from the Westside Mobility Plan sub-area model are reasonable and appropriate for air quality and greenhouse gas analysis. A summary of transit ridership in the City of Los Angeles model is also provided in Appendix F. As shown in Appendix F, the City of Los Angeles model estimates that approximately 1,400,000 patrons board the bus system on an average weekday, and that approximately 320,000 patrons board the rail system on an average weekday. As mentioned above, only transit routes with a stop within the City of Los Angles were included in the Westside Mobility Plan TDF model. FEEDBACK STAGE The SCAG RTP model uses a model feedback stage to input estimated congested travel speeds from the vehicle assignment stage of the initial model loop back into the network skimming stage of the model to refine estimates from the trip generation, trip distribution, modal split, and PA to OD stages of the model. The resulting OD matrices 24
34 are once again assigned to the roadway network to produce a new set of assignment results and congested speeds. Sensitivity testing was performed to determine the appropriate number of feedback loops for the Westside Mobility Plan TDF model. The first sensitivity test performed for the Westside Mobility Plan sub-area model was to run the base year SCAG RTP model with the number of feedback loops recommended by SCAG to determine the relative change in the network skim matrices from one feedback loop to another. The results from this comparison indicated that the relative change in RMSE falls below one percent after four feedback loops and remains relatively constant up to the SCAG recommended number of feedback loops. Since the network skim matrices directly affect the trip assignment outputs, the second sensitivity test compared the trip assignment results from one feedback loop to another. The results from this comparison indicated that the resulting traffic volumes from four feedback loops are within one percent of the traffic volumes from the SCAG recommended number of feedback loops. Therefore, the Westside Mobility Plan TDF model utilizes four feedback loops. MODEL RUN TIME In general, the structure of the Westside Mobility Plan TDF model was not modified as all four primary stages of the SCAG RTP model were included with all their sub-procedures. Instead, the following modifications were made to key model input files to reduce the model run time without compromising the accuracy of the results. The number of TAZs outside the City of Los Angeles was condensed, reducing the total number of TAZs in the City of Los Angeles model from 4,109 to 2,717. This results in smaller OD matrices and hence the number of zone to zone interactions. Selected roadways outside the City of Los Angeles were included in the City of Los Angeles model, reducing the create vehicle skim matrices procedure run time as well as the gravity model procedure run time and the vehicle assignment procedure run time. Transit routes without a stop within the City of Los Angeles were not included in the City of Los Angeles model, reducing the create transit skim matrices procedure run time as well as the transit assignment procedure run time. The number of feedback loop iterations was set to four. As shown in Table 11, the base year (2008) City of Los Angeles model has a run time of approximately 13 hours running on a computer with Windows 7 32-bit, an Intel Core i7 central processing unit at 3.07 gigahertz, 4 gigabytes of random access memory, and a 120 gigabyte solid-state hard drive. PEAK HOUR TRAFFIC VOLUMES The Westside Mobility Plan TDF model produces AM (7:00 to 10:00 AM) and PM (3:00 to 7:00 PM) peak period OD matrices that are assigned to the roadway network resulting in AM and PM peak period traffic volumes. Since the model does not directly produce AM and PM peak hour traffic volumes, the peak hour volumes need to be developed 25
35 post model run using peak period to peak hour conversion factors. The conversion factors were developed based on 24-hour traffic counts provided by LADOT. The peak period to peak hour conversion factors are shown in Table 14. TABLE 14 PEAK PERIOD TO PEAK HOUR FACTORS Area AM Factor PM Factor San Fernando Valley Gateway Cities Central Los Angeles Westside Cities Westside Study Area Freeways A post-processor excel file was developed to factor AM and PM peak period assigned model volumes to AM and PM peak hour factored traffic volumes. Model users should note that this peak hour post-processor method has the following limitations: The factors are based on traffic counts, which only capture vehicle trips that passed the count location during the specified time period. Vehicles in queue are not accounted for so peak hour demand levels could be higher. This condition occurs on many Los Angeles roadways during peak hours. The use of fixed factors makes the model insensitive to variables that might influence future individual travel behavior during the peak hours. Congestion, tolls, and parking pricing are just some of the variables that could change over time yet the model would still forecast the same proportion of peak hour traffic. 26
36 4. STATIC MODEL VALIDATION Following the modification of the roadway network, transit network and TAZ structure, and enhancements to key model components, the model was validated for the Westside study area to ensure it replicated 2008 traffic conditions and responded in the correct direction and magnitude when making changes to land use and the roadway and transit networks. The validation process involved the calibration of model parameters in the land use and roadway network files, as well as other key model components. The parameters were iteratively adjusted until the model attained validation criteria established by the California Transportation Commission. Two types of model validation were performed static validation and dynamic validation. As part of the validation process, AM and PM peak period vehicle flows were developed based on 24-hour traffic volumes from counts collected by Fehr & Peers for various projects in the City of Los Angeles and from counts provided by LADOT. Traffic counts on freeway facilities were obtained from the California Department of Transportation (Caltrans) Traffic Data Branch and the Performance Measurement System (PeMS) which is conducted by the Department of Electrical Engineering and Computer Sciences at the University of California at Berkeley. The SCAG RTP model produces traffic volumes for each roadway segment represented in the model for the AM (6:00 to 9:00 AM) and PM (3:00 to 7:00 PM) peak periods. However, the peak period of travel for the entire SCAG region may differ from the peak period of travel for the City of Los Angeles or the Westside. Therefore, individual traffic counts collected for the City of Los Angeles model validation process were aggregated by hour to determine the peak hours and periods of travel in the City of Los Angeles. The analysis indicated that the AM peak hour of travel in the City of Los Angeles is generally from 7 AM to 8 AM and the PM peak hour of travel in the City of Los Angeles is generally from 5 PM to 6 PM. Additionally, 6 AM to 9 AM represents the AM peak period of travel in the City of Los Angles and 3 PM to 7 PM represents the PM peak period of travel in the City of Los Angeles, matching the peak periods forecasted by the SCAG RTP model. To determine the peak period of travel in the Westside, individual traffic counts collected for the Westside Mobility Plan TDF model validation process were aggregated by hour to determine the peak hours and periods of travel in the Westside. The results are summarized in Table 15 with light grey shading indicating the AM and PM peak periods and bold indicating the AM and PM peak hours of travel in the Westside. 27
37 TABLE 15 PEAK HOURS OF TRAVEL IN THE WESTSIDE Hour Local Streets Freeway Facilities All Roadways 6 AM to 7 AM 224,745 78, ,911 7 AM to 8 AM 468,934 88, ,995 8 AM to 9 AM 569,966 83, ,791 9 AM to 10 AM 497,026 76, ,675 3 PM to 4 PM 534,840 81, ,572 4 PM to 5 PM 560,995 81, ,582 5 PM to 6 PM 606,834 81, ,596 6 PM to 7 PM 577,617 78, ,604 A comparison of the model time periods for the SCAG RTP model, the City of Los Angeles Model, and the Westside Mobility Plan sub-area model are shown in Table 16. As shown, the AM peak hour of travel in the Westside is 8 AM to 9 AM, one hour later than in the City of Los Angeles, and the PM peak hour of travel in the Westside is 5 PM to 6 PM, the same as in the City of Los Angeles. Additionally, 7 AM to 10 AM represents the AM peak period of travel in the Westside, one hour later than in the City of Los Angeles, and 3 PM to 7 PM represents the PM peak period of travel in the Westside, the same as in the City of Los Angeles. Therefore, the Westside Mobility Plan sub-area model was modified to produce traffic volumes for each roadway segment represented in the model for the AM (7 to 10 AM) and PM (3 to 7 PM) peak periods. TABLE 16 MODEL TIME PERIODS COMPARISON Time Period SCAG 2008 RTP Model City of Los Angles Model Westside Model AM Peak Period (3-Hour) 6 AM to 9 AM 6 AM to 9 AM 7 AM to 10 AM AM Peak Hour 7 AM to 8 AM 7 AM to 8 AM 8 AM to 9 AM PM Peak Period (4-Hour) 3 PM to 7 PM 3 PM to 7 PM 3 PM to 7 PM PM Peak Hour 5 PM to 6 PM 5 PM to 6 PM 5 PM to 6 PM 28
38 Due to these additional model refinements and modifications and the desire for a locally valid model suitable for the Westside Mobility Plan, the model was statically and dynamically validated to observed data within and around the Westside study area. The validation procedures and results are summarized below. MODEL VALIDATION Static validation measures how well the model s base year traffic and transit volume forecasts replicate base year counts. For the Westside Mobility Plan TDF model, the static validation consisted of 643 roadway link locations within and around the Westside study area and 238 transit routes. The 342 traffic count locations are shown on Figure 8 and the traffic count sheets are provided in Appendix G. Model volumes were also compared to peak period traffic counts along 11 model validation screenlines, as shown on Figure 9. The California Transportation Commission has established guidelines for determining whether a model is valid and acceptable for forecasting future year traffic and transit volumes. The sub-area validation results were compared to the validation thresholds discussed in 2010 California Regional Transportation Plan Guidelines (California Transportation Commission, January, 2011). Traffic Forecasts The two-way sum of the volumes on all roadway links for which counts are available should be within 10 percent of the counts. All of the roadway screenlines should be within the maximum desirable deviation of at least 75 percent. At least 75 percent of the roadway links for which counts are available should be within the maximum desirable deviation, which ranges from approximately 14 to 68 percent depending on total volume (the larger the volume, the less deviation is permitted). The correlation coefficient between the actual ground counts and the estimated traffic volumes should be greater than 88 percent. The percent root mean square (RMSE) should not exceed 40 percent. Transit Forecasts The difference between actual counts to model results for a given year by route group (i.e., Local Bus, Express Bus, etc.) should be within 20 percent of the counts. The difference between actual counts to model results for a given year by transit mode (i.e., Light Rail, Bus, etc.) should be within 10 percent of the counts. 29

39 Figure 8 Static Model Validation Traffic Count Locations 30

40 Figure 9 Static Model Validation Screenlines 31
41 Highway Static Model Validation (AM and PM Peak Period Conditions) The highway static validation process began with the unmodified base year SCAG 2008 RTP model. The model was then refined as part of the City of Los Angeles Model and Westside Mobility Plan sub-area model development process in which land use, roadway and transit network, and model component changes were made. The results for AM (7 AM to 10 AM) and PM (3 PM to 7 PM) peak period traffic conditions for the original SCAG RTP model, the City of Los Angeles Model, and the Westside Mobility Plan sub-area model for traffic counts collected within the Westside study area are shown in Tables 17, 18, and 19, respectively. Red shading indicates the acceptance criterion was not met while green shading indicates the acceptance criterion was met. TABLE 17 RESULTS OF PEAK PERIOD HIGHWAY STATIC MODEL VALIDATION WITHIN THE WESTSIDE STUDY AREA: SCAG 2008 RTP MODEL Model Results Validation Statistic Criterion for Acceptance AM (3-Hour) PM (4-Hour) % of Links within Caltrans Standard Deviations 75% 62% 56% % of Screenlines within Caltrans Standard Deviations 100% 76% 71% 2-way Sum of All Links Counted Within 10% 0% 19% Correlation Coefficient Greater than 88% 95% 95% RMSE 40% or less 40% 52% TABLE 18 RESULTS OF PEAK PERIOD HIGHWAY STATIC MODEL VALIDATION WITHIN THE WESTSIDE STUDY AREA: CITY OF LOS ANGELES MODEL Model Results Validation Statistic Criterion for Acceptance AM (3-Hour) PM (4-Hour) % of Links within Caltrans Standard Deviations 75% 70% 71% % of Screenlines within Caltrans Standard Deviations 100% 82% 86% 2-way Sum of All Links Counted Within 10% -2% 1% Correlation Coefficient Greater than 88% 96% 96% RMSE 40% or less 36% 36% 32
42 TABLE 19 RESULTS OF PEAK PERIOD HIGHWAY STATIC MODEL VALIDATION WITHIN THE WESTSIDE STUDY AREA: WESTSIDE MOBILITY PLAN SUB-AREA MODEL Model Results Validation Statistic Criterion for Acceptance AM (3-Hour) PM (4-Hour) % of Links within Caltrans Standard Deviations 75% 79% 82% % of Screenlines within Caltrans Standard Deviations 100% 100% 100% 2-way Sum of All Links Counted Within 10% 5% 8% Correlation Coefficient Greater than 88% 97% 97% RMSE 40% or less 30% 31% As shown in Table 17, the unmodified base year SCAG RTP model did not meet all of the guidelines for model accuracy in the AM or PM peak periods. However, this model served as the starting point for the model development process and did not contain any of the roadway network, transit network, TAZ structure, or model component changes made as part of the City of Los Angeles or Westside Mobility Plan model development processes. As shown in Table 18, the City of Los Angeles Model also did not meet all of the guidelines for model accuracy in the AM or PM peak periods within the Westside study area. However, this model did meet all of the guidelines for model accuracy in the AM and PM peak periods within the City of Los Angeles and provided the basis for additional roadway network, transit network, TAZ structure, and model component changes to develop a locally valid model for the Westside Mobility Plan. The results for AM (7 AM to 10 AM) and PM (3 PM to 7 PM) peak period conditions for the final run of the Westside Mobility Plan TDF model are summarized in Table 19, while the detailed static model validation spreadsheets are presented in Appendix H. This model run contained all roadway network, transit network, TAZ structure, and model component changes made to the SCAG RTP model to develop a travel demand model for the City of Los Angeles and the Westside Mobility Plan and Specific Plan amendments. As shown in Table 19, the Westside Mobility Plan model meets or exceeds the guidelines for model accuracy in the AM and PM peak periods. Therefore, the Westside Mobility Plan base year (2008) model is considered to be valid to 2008 traffic conditions. Additionally, the two-way sum of all link volumes estimated by the model was 5 to 8 percent higher than observed traffic counts. This is appropriate for a demand model that should overestimate constrained (counted) volumes on congested portions of the network. To determine if the model was overestimating on the appropriate roadway segments, the counted roadway segments were divided into groupings of uncongested and congested locations based on field observation and travel speed data. As shown in Table 20, the model overestimated demand by 1 percent or less on roadway segments that were determined to be uncongested during the peak periods. However, as desired, the model s demand volumes are higher than the constrained peak period counts by 9 percent and 14 percent in the AM and PM peak periods, respectively, on 33
43 roadway segments that were determined to be congested during the peak periods. Additionally, the model s demand volumes are higher by 15 percent in the AM peak period and 16 percent in the PM peak period on freeway segments determined to be congested during the peak periods according to the Caltrans 2008 HICOMP Report. TABLE 20 RESULTS WITHIN THE WESTSIDE STUDY AREA FOR CONGESTED AND UNCONGESTED LOCATIONS: WESTSIDE MOBILITY PLAN SUB-AREA MODEL Model Results Validation Statistic AM (3-Hour) PM (4-Hour) Uncongested Locations 2-way Sum of All Links Counted <1% 1% % of Links within Caltrans Standard Deviations 83% 86% Congested Locations 2-way Sum of All Links Counted 9% 14% % of Links within Caltrans Standard Deviations 73% 75% As shown in previous tables, validating along all screenlines indicates the directionality of inbound and outbound trips along major corridors in the study area is appropriate. Highway Static Model Validation (Daily Conditions) Since the base year Westside Mobility Plan TDF model was shown to produce reasonable estimates of 2009 vehicle miles of travel through comparison to HPMS data, the model is suitable for estimating changes in daily vehicle miles of travel based on land use and transportation system changes. However, the model was only validated to AM peak period (3-hour) and PM peak period (4-hour) conditions while vehicle emission modeling is typically performed using daily vehicle miles of travel estimates. Therefore, the base year Westside Mobility Plan TDF model daily forecasts were compared to 2008 daily traffic count data provided by LADOT for the Westside study area. 34
44 TABLE 21 RESULTS OF DAILY HIGHWAY STATIC MODEL VALIDATION WITHIN THE WESTSIDE STUDY AREA: WESTSIDE MOBILITY PLAN SUB-AREA MODEL Model Results Validation Statistic Criterion for Acceptance Daily % of Links within Caltrans Standard Deviations 75% 77% % of Screenlines within Caltrans Standard Deviations 100% 100% 2-way Sum of All Links Counted Within 10% -2% Correlation Coefficient Greater than 88% 98% RMSE 40% or less 29% As shown in Table 21, the Westside Mobility Plan TDF model meets or exceeds the guidelines for model accuracy under daily conditions. Furthermore, the 2-way sum of all links counted being within 2 percent with a %RMSE of less than 30 percent indicates the model is suitable for estimating vehicle miles of travel within and around the Westside study area. Transit Static Model Validation (Peak Period Conditions) The results for peak period (7-hour) transit conditions for the unmodified base year SCAG RTP model are summarized in Table 22 below. This model run did not contain any of the roadway network, transit network, TAZ structure, or model component changes made to the unmodified base year SCAG RTP model to develop a travel demand model for the City of Los Angeles or the Westside Mobility Plan. TABLE 22 RESULTS OF PEAK PERIOD TRANSIT STATIC MODEL VALIDATION WITHIN THE WESTSIDE STUDY AREA: SCAG 2008 RTP MODEL Peak Period (7-Hour) Model Results Westside Study Validation Statistic Criterion for Acceptance Entire Model Area Sum of All Transit Boardings by Route Group Local Bus Within 20% 1.2% 4.3% Express Bus Within 20% 35.0% 4.8% Transitway Within 20% Sum of All Transit Boardings by Transit Mode Within 10% 5.3% 4.4% 35
45 As shown in Table 22, the unmodified base year SCAG RTP model did not meet all of the guidelines for model accuracy in the peak period (7-hour) for transit routes across the entire model. However, the model did meet all of the guidelines for model accuracy for transit routes with a stop within the Westside study area. The results for peak period (7-Hour) transit conditions for the final run of the Westside Mobility Plan TDF model are summarized in Table 23 below, while the detailed transit static model validation spreadsheets are presented in Appendix H. This model run contained all roadway network, transit network, TAZ structure, and model component changes made to the unmodified base year SCAG RTP model to develop a travel demand model for the City of Los Angeles and the Westside Mobility Plan. TABLE 23 RESULTS OF PEAK PERIOD TRANSIT STATIC MODEL VALIDATION WITHIN THE WESTSIDE STUDY AREA: WESTSIDE MOBILITY PLAN SUB-AREA MODEL Peak Period (7-Hour) Model Results Westside Study Validation Statistic Criterion for Acceptance Entire Model Area Sum of All Transit Boardings by Route Group Local Bus Within 20% -1.9% 1.5% Express Bus Within 20% 6.1% -1.0% Transitway Within 20% 7.3% -- Sum of All Transit Boardings by Transit Mode Within 10% -0.7% 1.0% As shown in Table 23, the Westside Mobility Plan TDF model meets or exceeds the guidelines for model accuracy in the peak period (7-hour) by Route Group and Transit Mode for transit routes across the entire model and transit routes with a stop within the Westside study area. Therefore, the base year Westside Mobility Plan sub-area model is considered to be valid to 2008 transit conditions. However, as shown in Appendix H, the %RMSE for individual transit routes is 66 percent and the correlation coefficient is 78 percent. No formal transit static validation criteria has been established by Caltrans for individual transit routes. However, the validation results could suggest limited sensitivity at the corridor level and that future year (2035) corridor-level transit forecasts should be carefully inspected due to potential differences between base year transit forecasts and counts. Therefore, to ensure the model forecasted corridor-level transit boardings were reasonable and that the model was suitable for future year (2035) forecasting, transit routes with a transit stop within a half-mile of each of the Westside study corridors were grouped and the total model estimated transit boardings were compared against traffic counts. No formal transit static validation criteria has been established by the California Transportation Commission for individual transit corridors so the Route Group criteria of 20 percent was chosen to measure the 36
46 model estimated transit boardings against because it provides a relatively conservative criteria since route groups are a more aggregate level than corridors. The results of the corridor-level comparison are show in Table 24. TABLE 24 PEAK PERIOD TRANSIT BOARDINGS FOR ROUTES ALONG THE WESTSIDE STUDY CORRIDORS Westside Study Corridor # of Transit Routes with a Stop within a Half-Mile of the Study Corridor Peak Period (7-Hour) Transit Boardings (Total Boardings along the Entire Route) Model Count Delta % Difference Centinela Avenue , ,860-1,950-2% Culver Boulevard 13 35,859 33,635 2,224 7% Expo Phase I , ,115-71,836-16% Expo Phase II 34 97,125 97, % Jefferson Boulevard 12 46,940 43,385 3,555 8% Lincoln Boulevard , ,428 13,600 9% Olympic Boulevard 23 28,002 33,716-5,714-17% Overland Avenue 19 41,017 46,519-5,502-12% Pico Boulevard 21 39,841 40, % Santa Monica Boulevard 33 72,615 78,549-5,934-8% Sawtelle Boulevard 24 43,690 51,269-7,580-15% Sepulveda Boulevard , ,305 18,784 10% Subway to the Sea Phase I , ,962-4,055-3% Venice Boulevard 17 29,490 31,014-1,524-5% Washington Boulevard 13 35,859 33,635 2,224 7% Wilshire Boulevard 30 75,648 76,729-1,081-1% As shown in Table 24, the Westside Mobility Plan sub-area model meets or exceeds the Route Group guideline for model accuracy (corridor-level transit boardings within 20%) in the peak period (7-hour) for each Westside study corridor. 37
47 5. DYNAMIC MODEL VALIDATION The traditional approach to the validation of travel demand models is to compare the roadway segment volumes for the model s base year to actual traffic counts collected in the same year. This approach provides information on a model s ability to reproduce a static condition. However, models are seldom used for static applications. By far the most common use of models is to forecast how a change in inputs would result in a change in traffic conditions. Therefore, another test of a model s accuracy is to focus on the model s ability to predict realistic differences in outputs as inputs are changed; in other words, dynamic validation rather than static validation. Dynamic validation determines a model s sensitivity to changes in land uses and the transportation system. These tests are recommended in 2010 California Regional Transportation Plan Guidelines (California Transportation Commission, January, 2011). The results of dynamic validation tests are inspected for reasonableness in the direction and magnitude of the changes. The Westside Mobility Plan TDF model was developed to be used as a tool in the evaluation of land use scenarios and transportation system alternatives, as well as to provide vehicle-miles traveled estimates. Therefore, the following tests were conducted on the statically validated base year Westside Mobility Plan TDF model for daily, AM peak period, and PM peak period conditions. A discussion of the reasonableness of the direction and magnitude of the changes is also presented for each test. The detailed results are presented in Appendix I. LAND USE TESTS To determine if the Westside Mobility Plan TDF model would respond reasonably to changes in land use, a series of land use tests were conducted that involved modifying the validated base year model s land use inputs. The results were then compared to the validated base year model s outputs to determine if the magnitude and directionality of the changes were appropriate. Sensitivity tests were also conducted to determine the model s sensitivity to the density built environment variable to ensure changes made as part of the 4D model refinement process were appropriate. To control for as many external variables as possible (surrounding land uses, available transit service, nearby roadway capacity, congestion levels, etc.), land use modifications at various magnitudes were made to a single TAZ in the validated base year (2008) model s SED table. TAZ 2302 located in the West Los Angeles Community Plan area was selected for this analysis due to its central location in the Westside study area as well as its average income, auto ownership, and household size, which generally reflect typical development in the Westside study area. The existing SED associated with TAZ 2302 was removed and replaced with the scenarios discussed below. Add 10, 100, 5,000, and 10,000 Households to a TAZ in the Model As shown in Appendix I, when varying magnitudes of households are added to TAZ 2302, the per-household person trip rate (expressed as productions and attractions) remains relatively constant under peak period (7-hour), off-peak period (17-hour), and daily conditions. The daily per-household person trip rate of approximately 9.2 was then 38
48 compared to data published in the SCAG Regional Travel Survey, which reports an average of 7.3 person trips per household in Los Angeles County. Given that underreporting can occur in household travel surveys because of the self-reporting nature of traditional survey methods, this difference is acceptable. The per-household vehicle trip rate (expressed as origins and destinations) also remains relatively constant under AM (3-hour), PM (4-hour), midday (6-hour), night-time (11-hour), and daily conditions. The daily per-household vehicle trip rate of approximately 6.4 was then compared to data published in the SCAG Regional Travel Survey, which reports an average 4.3 vehicle trips per household in Los Angeles County, to determine if the magnitude was appropriate. Given that underreporting can occur in household travel surveys because of the self-reporting nature of traditional survey methods, this difference is acceptable. Additionally, approximately 68 percent of model person trips are allocated to vehicle trips by the mode split component of the model, compared to 59 percent reported in the Regional Travel Survey. Add 10, 100, 5,000, and 10,000 Jobs to a TAZ in the Model As shown in Appendix I, when varying magnitudes of jobs are added to TAZ 2302 the per-job person trip rate (expressed as productions and attractions) remains relatively constant as does the per-job vehicle trip rate (expressed as origins and destinations) under peak period (7-hour), off-peak period (17-hour), and daily conditions. Unfortunately, the SCAG Regional Travel Survey does not provide employment related data, which could be used to determine if the magnitude of the changes were appropriate. However, given that retail, office, and industrial jobs were added to TAZ 2302, it was expected that the per-job trip rates would be roughly percent higher than the per-household trip rates. Add Land Use Summary The estimated daily person trip generation rates for households and jobs are summarized in the chart below Daily Person Trip Rate - Households Daily Person Trip Rate - Jobs Add 10 Add 100 Add 5,000 Add 10,000 39


49 The estimated daily vehicle trip generation rates for households and jobs are summarized in the chart below Daily Vehicle Trip Rate - Households Daily Vehicle Trip Rate - Jobs Add 10 Add 100 Add 5,000 Add 10,000 Sensitivity to the Density Built Environment Variable Two sets of sensitivity tests were conducted to determine the sensitivity of the Westside Mobility Plan TDF model to the density built environment variable. The first test was to double the land use/sed in the entire model to determine the change in total vehicle trips. This test essentially doubles the land use density across the entire model, which, based on the literature on travel behavior, should influence vehicle travel demand. Based on this literature, a 100 percent change in density in the model should result in a -4 percent change in vehicle trip generation with the corresponding person trips shifting to higher-occupancy vehicles or to other modes of travel such as walk, bike, and transit. The base year model produced approximately 18,700,000 vehicle trips. If the model were not sensitive to density and relied on a static vehicle trip generation rate, approximately 37,400,000 vehicle trips would be expected if the land use were doubled. However, only approximately 36,200,000 vehicle trips were produced by the model, roughly 3 percent lower than the expected number of vehicle trips, indicating the model shows some sensitivity to an overall increase in density. Overall, total trips did not decrease and instead shifted to transit and walk/bike trips as the literature suggests. As shown in the charts below, the auto mode share decreased by 3.4 percent. Validated Base Year 18.5% 21.6% Double Land Use 3.8% 77.7% Auto Transit Walk/Bike 4.1% 74.3% Auto Transit Walk/Bike 40

50 The second test performed to determine the model s sensitivity to built environment variables was to double the density of individual TAZs in various parts of the Westside to see if the model was sensitive to density changes at the local level. The SED associated with three separate TAZs was doubled in independent model runs and the results were compared to the base model. As shown in Appendix I, the resulting vehicle trip reductions were generally larger than the vehicle trip reduction from the model wide test. For instance, doubling the land use in TAZ 525 (Playa Vista) resulted in roughly 8 percent fewer vehicle trips than expected, an elasticity larger than the elasticity from the model-wide test and the observed elasticity related to density. However, this result is not realistic given the existing density and jobs in the vicinity of Playa Vista as well as the presence of transit and existing congestion levels, which make vehicle trips less desirable under existing conditions. Alternatively, doubling the land use in TAZ 2327 (located in a mostly residential part of Westwood) resulted in roughly 3 percent fewer vehicle trips than expected, an elasticity equal to the elasticity from the model wide test and 25 percent lower than the observed elasticity related to density. The results for all three TAZs are summarized in the chart below. Daily Elasticity Related to Density TAZ in Playa Vista TAZ along Expo Line TAZ in Westwood Overall, the model shows some sensitivity to changes in density, suggesting the 4D elasticity value related to the density variable should be reduced to account for the model s sensitivity to a change in density. HIGHWAY NETWORK TESTS To determine if the Westside Mobility Plan TDF model would respond reasonably to changes in the highway network, a series of highway network tests were conducted that involved modifying the validated base year model s highway network. The results were then compared to the validated base year model s outputs to determine if the magnitude and directionality of the changes were appropriate. The following tests were performed and the results are shown in Appendix I. 41
51 Increase/Decrease Posted Speeds To determine if the model was sensitive to changes in posted speeds on individual highway network links, a series of posted speed adjustments were made to select highway links within the Westside study area. In general, the posted speed highway link field is intended to represent the posted or free-flow travel speed on a given roadway segment. However, when calibrating/validating travel demand models these speeds may be adjusted in order for the model to more accurately assign traffic volumes to the highway network link. For instance, the posted speed limit on a roadway segment may be 35 mph but due to on-street parking, a steep grade, or closely spaced traffic control devices the actual free flow travel speed across the segment may only be 30 mph when delay is taken into account. As a result, the posted speed for that highway network link would need to be adjusted accordingly so the model does not overestimate travel demand. As shown in Appendix I, when the posted speed on a highway link is increased, the traffic volume on the highway link generally increases. Similarly, when the posted speed on a highway link is decreased, the traffic volume on the highway link generally decreases, and when the posted speed on a highway link is left unmodified the traffic volume on the highway link generally remains the same. For example, when the posted speed on 14 th Street from Wilshire Boulevard to San Vicente Boulevard is left unmodified the traffic volume only slightly changes due to posted speed changes to nearby facilities. However, when the posted speed is decreased to 25 mph the traffic volume decreases by approximately 75 vehicles, and when the posted speed is decreased to 20 mph the traffic volume decreases by approximately 150 vehicles. Add/Remove Highway Network Capacity To determine if the model was sensitive to highway network capacity changes, roadway modifications were made to select links within the Westside study area and the effects were measured across a screenline, which captured parallel facilities where traffic would likely divert to/from. This represents an important dynamic test to determine how the model responds to roadway network improvements that could potentially be constructed within and around the Westside study area. This controlled test helps to determine whether the model will responds reasonably to capacity changes, ensuring a high level of confidence in the future year (2035) traffic volume forecasts. As shown on Figure 10, when a lane of capacity was added to Olympic Boulevard, traffic shifts from adjacent parallel facilities and traffic along the overall screenline generally increases. When a lane of capacity was removed from Olympic Boulevard, traffic shifts to adjacent parallel facilities and traffic along the overall screenline generally decreases. Additionally, the closer the parallel facility was to Olympic Boulevard the more it was influenced by the change in capacity, such as Pico Boulevard. 42


52 Figure 10 Dynamic Validation Test Add/Remove Highway Network Capacity 43
53 Due to the importance of determining the model s sensitivity to highway network capacity changes, two additional sets of dynamic tests were performed each with their own screenline in a different part of the Westside study area. The first test added two lanes of capacity on a different portion of Olympic Boulevard, then removed two lanes of capacity on a portion of Santa Monica Boulevard, and finally added a new parallel roadway facility between Wilshire Boulevard and Ohio Avenue. The screenline for all three tests generally runs just east of Barrington Avenue from San Vicente Boulevard to I-10. As shown in Appendix I, when two lanes of capacity were added to Olympic Boulevard, traffic shifts from adjacent parallel facilities and traffic along the overall screenline generally increases. When two lanes of capacity were removed from Santa Monica Boulevard, traffic shifts to adjacent parallel facilities and traffic along the overall screenline generally decreases. As shown in Figure 11, when a parallel roadway facility is extended across I-405 between Wilshire Boulevard and Ohio Avenue, traffic shifts from adjacent parallel routes and traffic along the overall screenline generally increases. However, it appears a majority of traffic shifts from Santa Monica Boulevard rather than the two closest parallel facilities, a somewhat counter-intuitive response. However, a more thorough inspection of travel patterns revealed that traffic on Wilshire Boulevard traveling across I-405 rather than utilizing Wilshire Boulevard to access I-405 shifted to the new roadway segment. This freed up capacity along Wilshire Boulevard causing traffic accessing I-405 from Santa Monica Boulevard to shift to Wilshire Boulevard due to the additional I-405 ramp capacity at Wilshire Boulevard. 44
54 Figure 11 Dynamic Validation Test Add a Link 45

55 The second additional test removed a highway network link representing the portion of Washington Boulevard just east of Lincoln Boulevard. As shown on Figure 12, traffic shifts from the deleted facility to adjacent parallel facilities and traffic along the overall screenline generally decreases. Additionally, the parallel facilities on either side of Washington Boulevard experience the largest increase in traffic volume, whereas parallel facilities further away experience very little change. Figure 12 Dynamic Validation Test Delete a Link 46
56 Increase/Decrease Functional Class To determine if the model was sensitive to highway network functional class changes, a series of highway network changes were made to portions of W. Manchester Avenue and Venice Boulevard within the Westside study area and the effects were measured across screenlines to capture parallel facilities where traffic would likely divert to/from. The screenline for increasing the functional class of W. Manchester Avenue generally runs west of Sepulveda Boulevard from W. 76 th Street to Lincoln Boulevard and the screenline for decreasing the functional class of Venice Boulevard generally runs west of Sawtelle Boulevard from National Boulevard to Braddock Drive. As shown in Appendix I, when the functional class of W. Manchester Avenue was increased from a principal arterial to an expressway, traffic shifts from adjacent parallel facilities and traffic along the overall screenline generally increases. When the functional class of Venice Boulevard was decreased from a principal arterial to a minor arterial, traffic shifts to adjacent parallel facilities and traffic along the overall screenline generally decreases. Additionally, the traffic volume changes along the modified corridors increase/decrease at an appropriate magnitude. For example, traffic volumes along the modified portion of W. Manchester Avenue, a moderately congested corridor, increase by approximately 105 to 129 vehicles per hour per lane. The traffic volumes along the modified portion of Venice Boulevard, a congested corridor, decrease by approximately 66 to 83 vehicles per hour per lane, much less than when adding capacity due to the congestion levels. TRANSIT NETWORK TESTS To determine if the Westside Mobility Plan sub-area model would respond reasonably to changes in the transit network, a series of transit network tests were conducted that involved modifying the validated base year (2008) model s transit network. The results were then compared to the validated base year (2008) model s outputs to determine if the magnitude and directionality of the changes were appropriate. The following tests were performed and the results are shown in Appendix I. Increase/Decrease Transit Fare for a Transit Mode To determine if the model was sensitive to transit fare changes, the transit fare for transit mode 11 (Metro Local Bus) was doubled and halved. The peak period, off-peak period, and daily boardings decrease by 20 percent when the transit fare is doubled and the total model transit ridership decreases by 14 percent, indicating that a portion of transit patrons shift to other modes of transit, such as mode 13 (Urban Rail), especially during the peak period, while other transit patrons shift to other modes of travel as expected. When the transit fare is halved, transit ridership on mode 11 increases by 13 percent and the total model transit ridership increases by 7 percent, indicating that a portion of transit patrons shift to mode 11 from other modes due to the lower cost of travel as expected. The results are summarized in the charts below with the changes in mode 11 boardings shown in green and the changes in total model transit boardings shown in yellow. 47


57 % Change in Daily Boardings by Mode - Double Mode 11 Fare All Transit % -20% -9% -10% -4% -2% 3% 3% 2% 5% 6% 12% 40% -30% -20% -10% 0% 10% 20% 30% 40% 50% % Change in Daily Boardings by Mode - Halve Mode 11 Fare All Transit % -15% -1% -1% -2% 0% -1% 0% 2% 2% 6% 8% 13% -20% -15% -10% -5% 0% 5% 10% 15% The absolute elasticity for doubling/halving model transit fare ranges from 0.20 to 0.27, within the range of observed elasticities from the Traveler s Response Handbook which provides an absolute elasticity range of 0.14 to 0.35, suggesting the model responded appropriately. 48
 model.")

58 Increase/Decrease Transit Headway of a Transit Line To determine if the model was sensitive to transit headway changes, the transit headway for transit line 114/115 Culver City 6 was doubled and the transit headway for transit line 997/998 Metro 33 was halved. The resulting transit boardings for each line were compared to the transit boardings from the validated base year (2008) model. As shown in Appendix I and in the charts below, the peak period, off-peak period, and daily boardings decrease by almost 50 percent, roughly 4,000 daily boardings, when the transit headway of transit line 114/115 Culver City 6 was doubled. The total model transit boardings decreases by 218, indicating that a majority of transit patrons shift to other transit lines as expected. Additionally, the daily transit boardings on parallel transit line 439 N/S Metro 439 increases by 119 to capture the additional daily ridership. When the transit headway of transit line 997/998 Metro 33 was halved, the peak period transit boardings increase by 104 percent, off-peak period transit boardings increase by 68 percent, and daily transit boardings increase by 85 percent, roughly 7,000 daily boardings. The total model transit boardings increases by almost 4,700, indicating that more than half of the new transit patrons shifted from another mode of travel, such as auto, and the remaining riders shifted from other transit lines as expected. Additionally, the daily transit boardings on parallel transit line 999/1000 Metro 33 decreased by 1,103 due to the increased headway. The results of doubling and halving the transit headway of a transit line are summarized in the charts below. Double Headway of Culver City Line 6 Halve Headway of Metro Line 33 16,000 14,000 12,000 10,000 8,000 6,000 4,000 2,000 0 Validated Base Year Model Double Headway Model 16,000 14,000 12,000 10,000 8,000 6,000 4,000 2,000 0 Validated Base Year Model Halve Headway Model Off-Peak Period Boardings Peak Period Boardings Off-Peak Period Boardings Peak Period Boardings 49
59 The absolute elasticity for doubling/halving model transit line headways ranges from 0.7 to 1.0. This is within the range of observed elasticities from the Traveler s Response Handbook, which provides an absolute elasticity range of 0.3 to 1.0, suggesting the model responded appropriately. INDUCED AND SUPPRESSED DEMAND TESTS The phenomenon where additional capacity leads to additional demand for travel is known as induced travel. Induced travel occurs when the cost of travel is reduced, such as a travel time reduction due to additional capacity, causing an increase in travel demand on not only the facility where the capacity was added, but potentially on nearby routes due to the overall increase in roadway lane miles in the area. The reduction in travel time causes various responses by travelers, including diversion from other routes, changes in destination, changes in travel mode, changes in departure time (possibly from off-peak to peak conditions), and potentially the creation of new trips all together. The Westside Mobility Plan TDF model is capable of accounting for some of the factors that influence induced travel (i.e., changes in route, mode, and destination), but it cannot account for changes in departure time and can only marginally account for the creation of new trips due to the use of an accessibility and auto availability model in the trip generation stage. Due to the structural limitations of the model, a series of tests were conducted to determine the extent to which the Westside Mobility Plan TDF model was sensitive to induced travel. To ensure the effects of induced demand were not understated, the tests relied on full runs of the model to not only capture potential vehicle routing changes, but also potential changes in person trip generation, mode choice, and destination. The first test performed was a model-wide test to determine if the model was sensitive to overall changes in lane miles and capacity. The results were then analyzed to determine if the model responded in an appropriate direction and magnitude. In other words, did changes in lane miles either induce or suppress trips (suppression would likely occur in the event capacity was removed), which is typically measured through an examination of vehicle-miles traveled (VMT). Model-Wide Tests The Westside Mobility Plan TDF model utilizes a cross classification table to determine the roadway capacity of each link. Input variables such as facility type, area type, number of lanes, and number of lanes crossing the link are used to determine the final capacity. Therefore, it was thought that doubling and halving the final capacity lookup values would simulate the doubling and halving of model lane miles. However, as shown in Appendix I, doubling the roadway capacity values resulted in only a 10 percent increase in daily VMT and halving the roadway capacity table values resulted in only a 4 percent reduction in daily VMT. This suggests that if you were to close half of the lanes in Los Angeles County the VMT would decrease by 4 percent and the number of vehicle trips would decrease by 3 percent. These results were found to be unrealistic; therefore; an additional inspection of the model structure was performed and it was determined that modifications to the roadway capacity table were influenced by ceiling and floor capacities for each facility type in the model script, especially for freeways where a substantial amount of VMT occurs. 50

60 Therefore, a secondary test was performed where the number of lanes on each link in the highway network was doubled, simulating a doubling of roadway miles. It was not possible to halve the number of lanes on each link in the highway network due to roadways with only one lane in each direction. As shown in Appendix I, the model estimated a 23 percent increase in VMT and an 8 percent increase in vehicle trips. Given that the land use was held static, a 100 percent increase in VMT or vehicle trips would not be expected and these results were found to be reasonable. Additionally, the SCAG Regional Travel Survey indicates that approximately 81 percent of person trips in Los Angeles County are in vehicles, suggesting that the largest increase in vehicle trips that could expected would be roughly 20 percent if every household in Los Angeles County owned at least one vehicle. Overall, these results suggest the model is sensitive to changes in highway network capacity when changing the number of travel lanes in the highway network, but not when modifying the highway network capacity lookup table. The results of all three tests are summarized in the chart below. Percent Change in Vehicle Miles Traveled 35% 30% 25% 20% 15% 10% 5% AM Peak Period PM Peak Period Daily 0% -5% -10% Halve Roadway Capacity Table Double Roadway Capacity Table Double Number of Lanes The next test performed to determine if the model was sensitive to the effects of induced and suppressed demand was to model the future year (2035) land use assumptions on the base year (2008) highway network, simulating a scenario where no capacity was added to the highway network over the next 25 or so years. One would expect a substantial reduction in vehicle trips and VMT due to the increased highway network congestion, and a slight reduction in person trips due to trip suppression causing trips not to be made. As shown in Appendix I, the total lane miles were effectively reduced by 5,000 miles, a 3.2 percent reduction, resulting in a daily vehicle trip reduction of roughly 420,000, a daily VMT reduction of roughly 1,475,000, and a reduction of 2,300 daily person trips indicating the model was slightly sensitive to the trip suppression effect of causing trips not to be made. Additionally, over the past few decades research has been conducted on the elasticity of travel demand in an attempt to statistically relate changes in lane miles to changes in VMT. The research data suggests a short-term 51
61 elasticity range of 0.2 to 0.5 and a long-term elasticity of 0.8 with roughly half of that attributed to changes in land use. Since this test utilized a future year analysis period and land use was held static with only the total lane miles being modified, a short-term elasticity of 0.39 was used for comparison purposes. As shown in Appendix I, the estimated elasticity of travel demand was 0.32, very closely resembling the observed elasticity. Local-Level Tests The final test performed to determine if the model was sensitive to the effects of induced and suppressed demand was at the corridor level rather than at the model-wide level. For this test, the number of travel lanes on Santa Monica Boulevard was doubled in each direction from Centinela Avenue to Wilshire Boulevard under base year (2008) conditions to determine the short-term effect of the change in lane miles, and under future year (2035) conditions to determine the long-term effect of the change in lanes miles. The total lane miles and VMT results from each run were then compared to the validated base year (2008) model to determine the elasticity of travel demand estimated by the model. These short-term and long-term elasticities were then compared to research conducted by Professor Robert Cervero. Cervero s 2002 study on induced travel demand is likely the most relevant to this test because it focused on 24 freeway corridors in California and provided short- and long-term elasticities. As shown in Appendix I, the resulting short-term elasticity of travel demand from the model ranged from 0.22 under daily conditions to 0.32 in the AM peak period, falling within the short-term elasticity range of 0.2 to 0.5 from Cervero. The resulting long-term elasticity of travel demand from the model ranged from 0.84 in the AM peak hour to 1.28 in the PM peak hour. This is higher than Cervero s observed long-term elasticity of 0.8, indicating the model may be overly sensitive in the long-term. However, Cervero points out in his research that other factors such as land use, density, income, and gas prices play a role in determining the long-term elasticity of travel demand, some of which the model takes into account but some of which the model is unable to account for. The results of the locallevel tests are shown on Figure 13. AUTO TRIP VARIABLES TESTS The final set of tests performed on the Westside Mobility Plan TDF model were to determine the model s sensitivity to changes in auto operating cost, the cost of parking, and transit frequency. The model utilizes an auto operating cost variable to estimate the per mile cost of traveling by auto through the model. This cost is then added to other costs associated with auto trips such as parking and time costs. The resulting total cost of an auto trip is then compared to the total model estimated cost associated with making the same trip using another mode of travel, such as transit in which transit frequency is a key variable, during the mode splits stage. During this stage a nested logit model is used to determine the final mode of travel for each person trip in the model. To test the sensitivity of the model to each of the three variables, three separate model runs were performed (one for each variable) in which model input values associated with each variable were doubled. In the case of transit frequency, the headway was halved to simulate transit arrivals twice as often. The resulting model outputs were then compared to the validated base year (2008) model and analyzed to determine if the model responded in an appropriate direction and magnitude. Additionally, elasticities relating to changes in each of the three variables to 52
62 changes in vehicle or transit trips were then calculated and compared to observed data presented in the Travelers Response Handbook and on the Sacramento Area Council of Governments (SACOG) wiki page. As shown in Appendix I, when the model auto operating cost was doubled, the number of vehicle trips decreased by 6.9 percent. This results in an elasticity of -0.07, which falls at the lower end of the gas price elasticity range of to When the headway of each model transit line was halved, the number of vehicle trips decreased by 0.6 percent and the overall model transit ridership increased by 19.2 percent. This results in an elasticity of 0.2, which falls just below the transit frequency elasticity range of 0.3 to 1.0 from the Traveler s Response Handbook. When the parking cost associated with each TAZ in the model is doubled, the number of vehicle trips decrease by 0.3 percent. This results in an elasticity of , which is well below the parking cost elasticity range of to in the Traveler s Response Handbook. However, not every TAZ in the model has an associated parking cost. Therefore, an additional run was performed where only TAZs in the Westside study area had their parking cost doubled. Additionally, only data associated with the modified TAZs was compared to the validated base year (2008) model. As shown in Appendix I, the resulting elasticity was for the 74 TAZs, still well below the observed elasticity range of to Local knowledge however suggests that perhaps the model predicted elasticity should be lower than the data observed in other parts of the country due to a locally observed tolerance for congestion and high parking prices. SUMMARY OF DYNAMIC VALIDATION TESTING RESULTS The following is a summary of the dynamic validation testing results, indicating whether or not the Westside Mobility Plan sub-area model responded appropriately in terms of magnitude and direction. The model responded appropriately in terms of magnitude and direction at both the person and vehicle trip level when land use of various magnitudes and types was added to the model. At the model-wide level, the model responded appropriately in terms of direction and magnitude to changes in density, with resulting elasticity values similar to the observed elasticity. At the project- or TAZlevel, the model responded in the appropriate direction but at varying magnitudes due to the variance in land use, congestion, and transit accessibility in the vicinity of the selected TAZs. Upon a more thorough inspection of the areas around the selected TAZs it was determined that the magnitude of change was appropriate and the model was sensitive to the effects of density. Therefore, the elasticity related to density in the 4D model component was modified (discussed in further detail in Chapter 6). 53

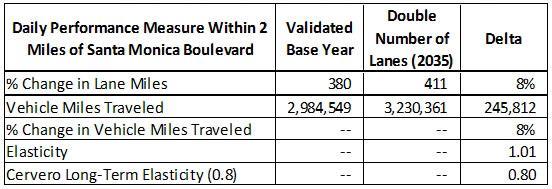
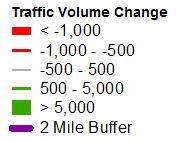
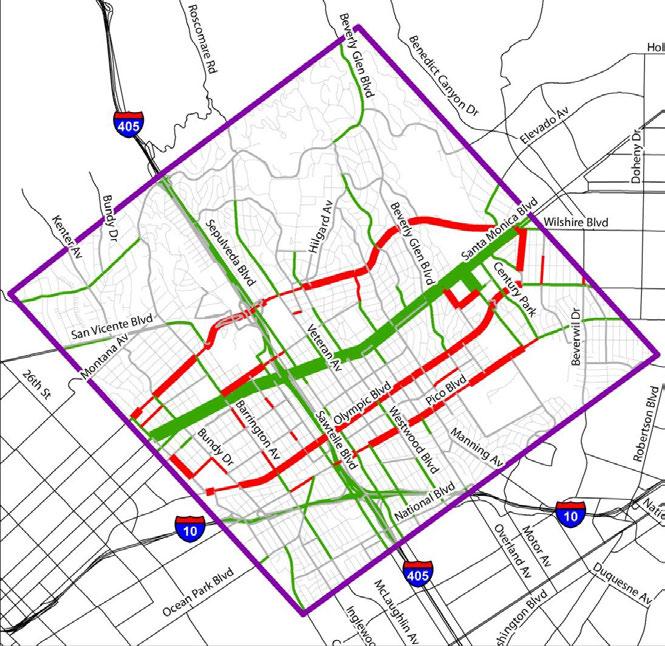
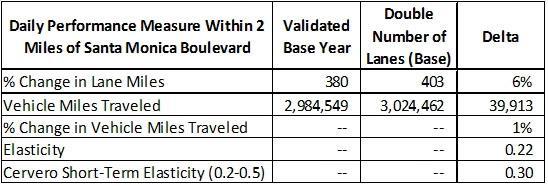
63 Figure 13 Dynamic Validation Test Induced Demand Short-Term: Base Year Model 54
64 The model responded appropriately in terms of magnitude and direction related to changes in model highway network link speeds, capacities, and facility classes. The absolute elasticity for doubling/halving model transit fare was within the range of observed elasticities from the Traveler s Response Handbook, indicating the model is suitable for forecasting the effects of modifying transit fares. The absolute elasticity for doubling/halving model transit headway was within the range of observed elasticities from the Traveler s Response Handbook, indicating the model is suitable for forecasting the effects of modifying transit headways. The model estimated short-term elasticity of travel demand for the entire model was 0.32, very closely resembling the observed short-term elasticity of 0.39 provided by Professor Robert Cervero, suggesting the model is sensitive to some of the effects of induced and suppressed demand. The model estimated short-term elasticity of travel demand along a corridor fell within the short-term elasticity range provided by Professor Robert Cervero. The model estimated long-term elasticity of travel demand along a corridor ranged from 0.84 in the AM peak hour to 1.28 in the PM peak hour, higher than Professor Cervero s observed long-term elasticity of 0.8, indicating the model may be overly sensitive to changes in lane miles in the long-term at the corridor level. The model estimated gas price elasticity fell at the lower end of the gas price elasticity range, indicating the model may be suitable for testing various gas price alternatives but may understate the effects. The model estimated transit frequency elasticity fell just below the transit frequency elasticity range from the Traveler s Response Handbook, indicating the model may understate the effects of changes to transit frequency. The model estimated parking cost elasticity was for TAZs in the Westside with an existing parking cost, below the observed elasticity range of to from the Traveler s Response Handbook. However, local knowledge suggests that perhaps the model predicted elasticity should be lower than the elasticity from the observed data, which was collected based on data from other parts of the United States and Europe, due to a locally observed tolerance for congestion and high parking prices. CONCLUSIONS Based on the static and dynamic validation results, the Westside Mobility Plan TDF model is appropriate for future year scenario forecasting of traffic volumes on roadway segments and transit boardings by route group. Furthermore, the use of the model ensures a high level of confidence in the resulting traffic and transit volume forecasts that will be used in the evaluation of transportation system improvement scenarios to be considered under the Westside Mobility Plan. 55

65 6. THE 4D PROCESS This chapter documents the implementation of the 4D process within the model architecture and describes the analysis used to identify the model s responsiveness to built environment variables. This section also introduces the Ds methodology, explains how the Ds would affect the model outputs, compares the current model to anticipated results, and identifies how the model was enhanced to account for the Ds. INTRODUCTION TO THE D S The literature on neighborhood characteristics that affect trip generation is constantly evolving and additional variables that affect travel behaviors are being investigated. The variables described below define key land use and development characteristics that can be tied to a particular geographic area and that have been shown (through analysis of travel surveys and other empirical research) to affect trip-making and mode choice. These are suitable to be addressed in a regional TDF model. Net Residential and Employment Density Density is defined as the amount of land use within a certain (measurable) area, or how intense the development is within a confined area. This variable is measured in dwelling units or employment per developed acre. A wide body of research suggests that, all else being equal, denser developments generate fewer vehicle-trips per dwelling unit than less dense developments. Change in density is measured according to the following formula: Change in Density = Percent Change in [(Population + Employment) per Square Mile] Jobs/Housing Diversity Diversity is the land use mix within a particular area, whether it is a homogenous residential neighborhood or a mixed-use area with apartments atop ground-floor retail. Research suggests that having residences and jobs in close proximity will reduce the vehicle-trips generated by each, by allowing some trips to be made on foot or by bicycle. This variable measures how closely the neighborhood in question matches the ideal mix of jobs and households, which is assumed to be the ratio of jobs to households measured across the region as a whole. Change in diversity is measured using the following formula: Change in Diversity = Percent Change in {1-[ABS(b*population employment)/(b*population+employment)]} Where: ABS = absolute value; b= regional employment/regional population Walkable Design Design is an indicator for the accessibility for pedestrians and bicyclists to access a given area. Many pedestrian and bicycle improvement projects are based on the assumption that improving the walking/biking environment will result in more non-auto trips and a reduction in auto travel. The difficulty with using this variable in an equation is that there are many factors that influence the pedestrian experience, and it is difficult to identify a single definition that captures them all. The walkable design variable, when isolated, usually has the weakest influence on the overall adjustment of the D variables; although; it also seems to have important synergistic effects in conjunction with density and diversity. Change in design is measured as a percent change in design index as follows: 56
66 Design Index = * street network density * sidewalk completeness * route directness Destination Accessibility Accessibility is an indicator of a location s proximity to major destinations and access to those locations. Research shows that, all else being equal, households situated near the regional center of activity generate fewer auto trips and VMT than households located far from destination centers. When comparing different potential sites for the same type of development, this variable is very important. This variable can be quantified by estimating the total travel time to all destinations/attractions. Sensitivity to variations in regional accessibility is a characteristic of most calibrated and validated TDF models. Changes in destination accessibility are measured as follows: Destinations (accessibility) = Percent Change in Gravity Model denominator for study TAZs I : Sum[Attractions (j) * Travel Impedance(I,j)] for all regional TAZs j The most recent RTP guidelines identify the inclusion of the Ds as a model post-processor to improve sensitivity to changes in travel behavior and emissions as a result of changes to land use in a model area. Furthermore, Regional Targets Advisory Committee (RTAC) identifies the 4Ds as variables with empirical evidence to be included in targetsetting for SB375 best practices. Thus, it is important to identify sensitivity to the Ds and to apply enhancements to these variables, rather than other indicators of land use change. D ELASTICITY VALUES Elasticity is the percentage change in one variable that results from a percentage change in another variable. The D elasticities are defined to reflect the percentage change in vehicle trips or vehicle miles of travel given a percentage change in density, diversity, design, and regional destination. A minus (-) in front of an elasticity number indicates a reduction in vehicle trips or vehicle miles traveled (VMT); otherwise, the elasticity identified increases with the increase of a D variable. Recommended Elasticity Values When selecting appropriate elasticity values, it is important to consider the locational context and existing travel behavior. Although changing land use according to smart growth principles affects travel behavior, there are other factors, such as job types and the regional built form, which will also have an impact on how and where trips are made. While placing office buildings near residents can change the travel behavior for office workers, an agricultural employee s travel behavior would not change since the location of that job type is location-specific. Likewise, an existing urban center may show smaller changes in travel behavior with the implementation of the 4Ds since residents may already be using alternative transit modes. Therefore, it is important to be cognizant of the City of Los Angeles employment profile and select an elasticity value that would reflect foreseeable changes in travel behavior. The recommended starting elasticity values for the D s in the Westside Mobility Plan sub-area model are shown in Table
67 TABLE 25 INITIAL ELASTICITIES 4D MODEL ENHANCEMENTS FOR WESTSIDE MOBILITY PLAN TDF MODEL D Variable Vehicle Trip Elasticity Density Diversity Design INITIAL SENSITIVITY TESTS Before applying elasticity values to the model, tests were conducted to determine the model s sensitivity to 4D changes. The initial review of the model documentation and structure did not indicate built-in sensitivity to the Ds; however, it was determined that the model was already sensitive to changes in destination accessibility due to the nature of the gravity model. The model is structured such that tests could be conducted for determining the model s sensitivity to density and diversity. However, since the model does not include pedestrian design factors, such as sidewalk completeness, it was not possible to conduct a design test. Three sensitivity tests were conducted to examine the two aforementioned Ds: uniform changes in density, changes in density in a select area, and balanced land use (diversity). Model Test #1: Uniform Changes in Density in All TAZs This test was conducted to evaluate the model s sensitivity to density. This variable is measured in dwelling units or employment per acre. A wide body of research suggests that, all else being equal, denser developments generate fewer vehicle trips per dwelling unit than less dense developments. For this particular test, uniform changes in density were applied throughout the model. This creates an infill scenario for the City of Los Angeles, whereby the land use in each TAZ is increased by the same percentage. Each land use category was increased by 100 percent, so as not to disrupt the existing balance of land uses for the diversity to remain unchanged. To conduct this test, the households, jobs, and students in the model SED file were increased by 100 percent. Table 26 identifies the changes to the model s vehicle trip and VMT outputs for the base model and test model. Based on the 4D elasticity values, a 100 percent increase in overall density should result in a 4 percent reduction in the rate of vehicle trip generation. As shown in Table 26, the base model produced approximately 18.7 million peak period vehicle trips. Therefore, doubling the SED should have resulted in approximately 37.4 million vehicle trips but instead resulted in approximately 36.2 million vehicle trips, a difference of approximately -1.2 million vehicle trips or -3.1 percent, indicating that the model is sensitive to changes in density but not to the degree research data has shown. Furthermore, this data suggests the 4D elasticity value related to the Density variable should be reduced 58
68 by 75 percent (from to -0.01) to account for the model s sensitivity to a change in density. The change in density also increased VMT by 50 percent and vehicle minutes traveled by 124 percent. TABLE 26 TEST #1: UNIFORM DENSITY INCREASE PEAK PERIOD (7-HOUR) TRAVEL OUTPUTS Base Model Test 1 Model Change (Test 1 Minus Base) Vehicle Trips 18,682,696 36,192, ,509,467 (+94%) Transit Trips 906,601 1,990,463 +1,083,862 (+120%) Walk/Bike Trips 4,451,990 10,520,794 +6,068,804 (+136%) Total Trips 24,041,287 48,703, ,662,133 (+103%) Vehicle Miles Traveled 89,234, ,013, ,779,828 (+50%) Vehicle Minutes Traveled 183,992, ,265, ,272,596 (+124%) VMT / VT (Average Trip Length) (-22.6%) Model Test #2: Changes in Density in a Select Area This test was conducted to quantify the model s sensitivity to specific changes in development density. This was undertaken by changing SED in one specific area, rather than throughout the entire model. The balance of land uses remained constant for all tests to determine the model s sensitivity to changes in density at the local level. Three versions of this test were conducted to compare the results. In the first sensitivity test, land use in a TAZ was zeroed out and 10 households and 10 jobs were added to use as a comparison scenario. For the second test, the land use was zeroed out, and 100 households and 100 jobs were added to the model and the results were compared to the first test. For the final test, the land use was zeroed out, and 1,000 households and 1,000 jobs were added and the results were compared to the first test. To maintain a consistent land use diversity mix, the same number of households and jobs were added to the same TAZ for each of the three tests. Table 27 identifies the changes to the model s vehicle trip outputs for the three sensitivity tests. Based on the 4D elasticity values, a 100 percent increase in overall density should result in a 4 percent reduction in the rate of vehicle trip generation. The second sensitivity test increases the number of households and jobs by 1,000 percent over the first sensitivity test, which should result in a 40 percent reduction in vehicle trips based on the 4D elasticity values. The third sensitivity test increases the number of households and jobs by 10,000 percent over the first sensitivity test, which should result in a 400 percent reduction in vehicle trips based on the 4D elasticity values. However, with the application of ceiling and floor values, no single D variable can result in a vehicle trip reduction of 59
69 more than 30 percent. Therefore, as shown in Table 27, the expected percent reduction in vehicle trips from the 4D elasticity values is 30 percent. The model estimates a 22 percent vehicle trip reduction from Test 1 to Test 2 and a 23 percent vehicle trip reduction from Test 1 to Test 3, indicating that the model is sensitive to changes in density but not to the degree research data has shown. Furthermore, this data suggests the 4D elasticity value related to the Density variable should be reduced by 75 percent (from to -0.01) to account for the model s sensitivity to a change in density. TABLE 27 TEST #2: DENSITY INCREASE IN A SELECT AREA PEAK PERIOD (7-HOUR) TRAVEL OUTPUTS % Vehicle Trip Test Model Vehicle Trips Model Growth In Vehicle Trips Expected Growth in Vehicle Trips Difference (Model Expected) % Difference (Model Expected) Reduction Expected From 4D Elasticity Values Test 1: 10 HH + 10 Jobs Test 2: 100 HH Jobs Test 3: 1,000 HH + 1,000 Jobs , % -30% 7,822 7,722 10,000-2,278-23% -30% Model Test #3: Optimizing Land Use Mix (Diversity) of a Single Area Model Test 3 is a test for diversity. Research suggests that having residences and jobs in close proximity will reduce the vehicle trips generated by allowing some trips to be made on foot or by bicycle. This variable measures how closely the neighborhood in question matches the ideal mix of jobs and households, which is assumed to be the ratio of jobs to households measured across the region as a whole. To ascertain the degree to which the model was sensitive to the changes in diversity, test were conducted to measure changes in vehicle trips by balancing land use to an optimal mix of employment and residential land uses. A change in the ratio of internal trips to external trips would indicate that the model is sensitive to changes in diversity. If an area is mixed-use in nature, a sensitive model would internalize a greater percentage of trips compared to an area that has only one type of land use. This is because in a mixed-use area, a resident could work and shop in the immediate vicinity, while in a homogenous area the resident would need to travel outside of the TAZ to work or shop. This test was conducted in the area around the Los Angeles State Historic Park due to the current employment-topopulation imbalance and limited roadway access. The selected TAZs had an employment-to-population ratio of 1.44 under base year conditions, more than three times higher than the regional average of The SED was then 60
70 modified to match the employment-to-population ratio to the regional average while maintaining the existing density level in the area to determine the model s sensitivity to diversity at the local level (the total population + employment remained constant between the base and test model). To determine changes in trip types, we used the assignment trip matrices to determine how many trips both originated and terminated in the test area, and how many vehicle trips left the test area. Table 28 identifies the SED changes and results. Based on the 4D elasticity values, a 100 percent increase in overall diversity should result in a 6 percent reduction in vehicle trips. As shown in Table 28, the base model s employment-to-population ratio was improved to match the regional average of 0.43 by adding 1,154 households and removing 3,890 jobs. Based on these SED changes, the diversity formula resulted in a 117 percent change in the diversity variable. Applying the diversity elasticity of results in an expected 7 percent decrease in external vehicle trips. As shown in Table 28, the base model produced 8,700 external vehicle trips in the PM peak hour. With the changes in SED, a total of 6,390 external vehicle trips were expected based on the model vehicle trip generation. However, the model estimated 6,170 external vehicle trips, a difference of -220 vehicle trips or -3.5 percent, indicating that the model is sensitive to changes in diversity but not to the degree research data has shown. Furthermore, this data suggests the 4D elasticity value related to the Diversity variable should be reduced by 50 percent (from to ) to account for the model s sensitivity to a change in diversity. 61
71 TABLE 28 TEST #3: BALANCING LAND USE IN A SINGLE AREA LAND USE INPUTS Population Households Jobs Employmentto-Population Ratio Base Model 5,512 1,635 7, Test 3 Model 9,402 2,789 4, Change (Test 3 Minus Base) +3,890 +1,154-3, PM PEAK HOUR TRAVEL OUTPUTS Base Model Test 3 Model Change (Test 3 Minus Base) Internal Trips 860 1, External Trips 8,700 6,170-2,529 Internal Trips as Percent of Total Trips 9% 15% +6% Summary of Sensitivity Tests Our results of the 4D sensitivity tests are as follows: The model shows some sensitivity to overall increases in density. As a result, this data suggests the 4D elasticity value related to the density variable should be reduced by 75 percent (from to -0.01). The model shows some sensitivity to changes in density in selected TAZs. As a result, this data reaffirmed that the 4D elasticity value related to the Density variable should be reduced by 75 percent (from to The model is sensitive to changes in diversity; with balanced land use, internal trips account for a greater proportion of total trips. As a result, this data suggests the 4D elasticity value related to the Diversity variable should be reduced by 50 percent (from to -0.03). MODEL INTEGRATION The sensitivity tests that were completed for the Westside Mobility Plan sub-area model indicated that the model was not adequately sensitive to changes in density and diversity. As a result, the model enhancement effort focused on improving the model s sensitivity to changes in density and diversity. 62
72 Structure of Model Enhancements The 4D enhancement process was developed as a script that runs in line with the full Westside Mobility Plan subarea model. The script was first tested as a stand-alone script and then integrated into the full model script. The 4D process occurs after the Mode Choice step and before Trip Assignment, as shown on Figure 14 below. Figure 14 4D Enhancement Model Integration Trip Generation Trip Distribution Mode Choice Trip Assignment 4D Enhancements At this stage in the model process, person trip tables have been created by trip purpose (Home-Based Work, School, etc.) and have been separated by mode choice. The trip tables are then converted to origin and destination matrices prior to the trip routing being determined in the trip assignment step. As noted, the model elasticity values being used for the enhancements are consistent with empirical research but have been calibrated based on the results of the sensitivity testing. The calibrated elasticity values and how they are included in the model scripting process are identified in Table
73 TABLE 29 FINAL 4D ELASTICITES FOR WESTSIDE MOBILITY PLAN TDF MODEL D Variable Selected Elasticity (VT) Embedded in Script? Density Yes Diversity Yes Design No data unavailable Destination No model already sensitive 64
74 7. AMENDMENTS TO CTCSP & WLA TIMP The Westside TDF model was used to analyze the operational impacts associated with the proposed amendments to the CTCSP and WLA TIMP. The Specific Plan amendments would not, itself, entitle or otherwise approve any transportation projects or create any operational changes to transportation and mobility. Individual transportation improvements would be studied in further detail prior to implementation. Nevertheless, the amendments would result in a new list of potential transportation improvements for both the CTCSP and WLA TIMP areas, and these projects were analyzed in the EIR prepared for the proposed amendments to the Specific Plans. SCAG RTP CONSISTENCY Since the development of the original development of the Westside TDF model in 2011, SCAG adopted the Regional Transportation Plan and Sustainable Communities Strategy (RTP/SCS). The RTP/SCS is a planning document required under state and federal statute that encompasses the SCAG region, including six counties: Los Angeles, Orange, San Bernardino, Riverside, Ventura, and Imperial. The RTP/SCS forecasts long-term transportation demands and identifies policies, actions, and funding sources to accommodate these demands. The RTP/SCS consists of the construction of new transportation facilities, transportation systems management strategies, transportation demand management and land use strategies. The RTIP, also prepared by SCAG based on the RTP/SCS, lists all of the regional funded/programmed improvements over a six year period. As part of the updates to the CTCSP and WLA TIMP Specific Plans, the socioeconomic data (SED) for the Westside TDF model was updated to reflect the most recent growth forecasts in RTP/SCS within the SCAG region. Within the project area, the latest growth forecasts were verified from the Los Angeles Department of City Planning. Table 30 provides a summary of the SED within the Specific Plan areas. 65
75 TABLE 30 WESTSIDE STUDY AREA SOCIOECONOMIC DATA SED Data Households Location Model Calibration Year 1 Future (2035) Growth % Growth CTCSP Area 68,383 84,552 16,169 24% WLA TIMP Area 88, ,467 18,564 21% Project Area 157, ,019 34,733 22% CTCSP Area 87, ,904 24,225 28% Employment WLA TIMP Area 197, ,980 20,140 10% Project Area 285, ,884 44,365 16% CTCSP Area 157, ,305 24,839 16% Population WLA TIMP Area 197, ,330 22,140 11% Project Area 354, ,635 46,979 13% Notes: 1. The Westside Travel Demand Forecasting Model was originally developed, calibrated and validated to 2008 conditions is the most recent year in which a consistent data set of population, employment and households is available for the SCAG region (reported at the traffic analysis zone (TAZ) level of detail) for use in the model calibration process. A new TAZ data set will be available when SCAG produces its 2016 RTP update, which will reflect year 2012 conditions as a baseline. While the model calibration year reflects 2008, Year 2014 is used for the reporting of Existing Conditions in the impact analysis for the proposed amendments to the Specific Plans. Source: Westside Travel Demand Forecasting Model, In addition to the SED updates in the project area, land use growth projected by SCAG was also updated citywide, as follows: Future Year Land Use/SED: The Westside TDF model future (year 2035) land use and socio-economic data (SED) was updated to reflect the growth in the 2012 SCAG RTP. SED City of LA Model Future Model Data SCAG 2012 RTP Model Households 1.6 million 1.6 million Employment 1.9 million 1.9 million The Westside TDF future transportation network was updated to include the following improvements expected to be implemented by year 2035 from the RTP/SCS (financially constrained) Model. PROJECT LIST UPDATES The proposed CTCSP and WLA TIMP amendments include updating the list of transportation improvements funded in part by the traffic impact fees in each specific plan area. The updated Project Lists are aimed at improving the transportation network, enhancing system capacity, reducing vehicle trips and VMT, and improving transit connectivity. 66
76 The Specific Plan amendments would not, itself, entitle or otherwise approve any transportation projects. Nevertheless, the proposed amendments would result in a new list of transportation improvements for both the CTCSP and WLA TIMP areas. The types of projects and programs that would be included as transportation improvements for each specific plan are described below in Table 31. The projects and programs in this table are representative of the types of improvements proposed for inclusion in the Specific Plan amendments. The Westside TDF model was updated to reflect these potential transportation improvements (Project Lists). Projects that could potentially alter the existing roadway network (i.e., change vehicle capacity or eliminate on-street parking) and the modeling assumptions used to quantify potential impacts are noted in the table. 67
77 Transit TABLE 31 POTENTIAL TRANSPORTATION IMPROVEMENTS (PROJECT LIST UPDATES) All-Day Center Running Bus Rapid Transit (BRT): Lincoln BRT (CTCSP): Center Running BRT on Lincoln Boulevard from the border of the City of Santa Monica to 96th Street Transit Station Sepulveda BRT (CTCSP & WLA TIMP): Center Running BRT on Sepulveda Boulevard from Wilshire Boulevard to 96th Street Transit Station For the purposes of reporting potential traffic impacts, this project type was analyzed as providing all-day center-running bus-only lanes. Parking would be removed from one side of the street along the corridor and from both sides of the street at station locations. In areas where parking is not provided on-street, or prohibited during peak periods, a vehicle lane reduction would be required. Some raised medians along the corridor and left-turn pockets at minor streets would likely need to be removed. The BRT would also include higher frequency peak period service and stop improvements. Peak Period BRT: Santa Monica Boulevard BRT (WLA TIMP): Curb-running peak hour bus-only lanes within the WLA TIMP boundary with enhanced bus stop amenities For the purposes of reporting potential traffic impacts, this project type was analyzed as the buses utilizing the vehicle travel lane closest to the curb during peak travel hours resulting in reduced vehicle capacity. Rapid Bus Enhancements: Olympic Rapid Bus Enhancements (WLA TIMP): Extend the Rapid bus service along Olympic Boulevard from its current terminus in Century City to the future Metro Exposition Line station at Westwood Boulevard Pico Rapid Bus Enhancements (WLA TIMP): Improve existing Rapid bus service on Pico Boulevard through increased frequency, stop improvements, and construction of a new rapid stop in Century City Venice Rapid Bus Enhancements (CTCSP & WLA TIMP): Rebrand existing Rapid bus service on Venice Boulevard to serve Venice Beach area, increase service frequency, and implement stop improvements. For the purposes of reporting potential traffic impacts, the rapid bus improvements included higher frequency peak period service, extension of service hours, and rapid stop improvements. Rapid bus enhancements would not require vehicle capacity reductions, such as travel lane conversions. Local Bus Enhancements & Circulator Routes: Circulator bus/shuttle to connect activity centers to major transit stations: Sawtelle service between Wilshire Blvd and the Expo Sepulveda Station (WLA TIMP) Bundy service between Brentwood, the Expo Bundy Station, and National Blvd (WLA TIMP) Palms Circulator to connect to Expo Station (WLA TIMP) Century City Circulator to connect to Expo Station (WLA TIMP) Loyola Marymount / Westchester Circulator (CTCSP) Venice / Playa Vista / Fox Hills Circulator (CTCSP) Venice Circulator (CTCSP) 68
78 The circulator routes and local bus improvements would travel in mixed-flow lanes with vehicles and would not result in the removal of a vehicle travel lane to the existing roadway network. Bicycle and Pedestrian Mobility Hubs In both CTCSP and WLA TIMP, install a full-service Mobility Hub at or adjacent to major transit stations and Satellite Hubs surrounding the stations. A hub may include secure bike parking and car/bike sharing to bridge the first/last mile of a transit user's commute. Streetscape Improvements Venice Boulevard (CTCSP) between Lincoln Boulevard and Inglewood Boulevard Centinela Avenue (CTCSP) between Washington Boulevard and Jefferson Boulevard Olympic Boulevard (WLA TIMP) from Centinela Avenue to Barrington Avenue Bundy Drive (WLA TIMP) from Missouri Avenue to Pico Boulevard Sepulveda Boulevard (WLA TIMP) from Olympic Boulevard to National Boulevard National Boulevard (WLA TIMP) from Castle Heights Avenue to Mentone Avenue Palms Boulevard (WLA TIMP) from Motor Avenue to National Boulevard Pico Boulevard (WLA TIMP) from I-405 to Patricia Avenue Pico Boulevard (WLA TIMP) from Centinela Avenue to I-405 Motor Avenue (WLA TIMP) from I-10 to Venice Boulevard Streetscape improvements could include amenities such as landscaping, pedestrian crossing enhancements, median treatments and street lighting. These improvements would occur within the existing right-of-way and are not expected to result in reduced vehicle capacity or material removal of on-street parking. Multi-Use Paths Centinela Creek Multi-Use Path: Centinela Creek path from Ballona Creek to Centinela Avenue east of I-405 (CTCSP) Sepulveda Channel Multi-Use Path: Sepulveda Channel path from Ballona Creek to Washington Boulevard (CTCSP) Exposition Light Railway Greenway Improvement Project: Transform existing city-owned vacant parcels into a neighborhood greenway that includes construction of a multi-use path with drought tolerant landscaping, simulated stream to treat urban runoff, educational amenities and interpretive signs along Exposition Boulevard between Westwood and Overland along future Expo LRT Westwood Station. (WLA TIMP) Multi-use paths would be as an off-street network of facilities and are not expected to result in reduced vehicle capacity or removal of on-street parking. Neighborhood Enhanced Networks (NEN) Beethoven Street / McConnell Avenue NEN (CTCSP) Prosser/Westholme Avenue NEN (WLA TIMP) Veteran Avenue NEN (WLA TIMP) 69
79 Gayley Avenue/Montana Avenue (east of I-405) NEN (WLA TIMP) Montana Avenue (west of I-405) NEN (WLA TIMP) Barrington Avenue/McLaughlin Avenue NEN (CTCSP) Ohio Avenue NEN (WLA TIMP) Other corridors identified in City Bicycle Plan/MP 2035 (CTCSP & WLA TIMP) The streets identified as part of the NEN would receive treatments focused on reducing vehicle speeds and providing a safe and convenient place to walk and bike. These treatments are not expected to require the removal of a travel lane or material removal of on-street parking. Cycle Tracks Venice Boulevard Cycle Track (CTCSP and WLA TIMP): Venice Boulevard throughout the CTCSP area. For the purposes of reporting potential traffic impacts, the Venice Boulevard cycle track is assumed to replace the existing bicycle lane to provide a protected bicycle facility in the project area. Santa Monica Boulevard Cycle Track (WLA TIMP): Santa Monica Boulevard in the parkway section east of Sepulveda Boulevard. The cycle track would replace the existing bicycle lane. Washington Boulevard Cycle Track (CTCSP): Washington Boulevard from Admiralty Way to Pacific Avenue. The cycle track would replace the existing bicycle lane. Lincoln Boulevard Cycle Track (CTCSP): Lincoln Boulevard from Jefferson Boulevard to Fiji Way. Additional right-of-way to accommodate cycle track would result from Lincoln Bridge Project. On-Street Bicycle Lanes Culver Boulevard Bike Lane (CTCSP): Culver Boulevard from McConnell Avenue to Playa del Rey Gateway Boulevard (CTCSP): Gateway Boulevard to Ocean Park Boulevard gap closure Other corridors identified in MP 2035 (CTCSP & WLA TIMP) Bicycle Transit Centers In both CTCSP and WLA TIMP, install bike transit centers that offer bicycle parking, bike rentals, bike repair shops, lockers, showers and transit information and amenities. Bikesharing In both CTCSP and WLA TIMP, provide public bicycle rental in "pods" located throughout the specific plan areas. Enhance Pedestrian Access to Major Transit Stations Implement pedestrian connectivity improvements at major Metro transit stations by providing enhanced sidewalk amenities, such as landscaping, shading, lighting, directional signage, shelters, curb extensions, enhanced crosswalks, as feasible. (CTCSP). Sidewalk Network & Pedestrian Enhancements Sepulveda Boulevard (CTCSP): Implement sidewalk and streetscape improvements, bus stop lighting at transit stops, and enhanced crosswalks on Sepulveda Boulevard between 76th Street and 80th Street. In CTCSP and WLA TIMP, complete gaps in the sidewalk network and provide pedestrian enhancements. 70
80 Complete Streets Westwood Boulevard (WLA TIMP): Improvements along Westwood Boulevard between the future Expo LRT station, Westwood Village, and UCLA could include transit, bicycle and pedestrian enhancements (that do not require removal of vehicular travel lanes or on-street parking) or bicycle enhancements on parallel roadways. Roadway & ITS Roadway Capacity Improvements Lincoln Boulevard Bridge Enhancement (CTCSP): Partnering with Caltrans and LA County, improve Lincoln Boulevard between Jefferson Boulevard and Fiji Way to remove the existing bottleneck by replacing the existing bridge with a wider bridge with additional southbound lane, transit lanes and on-street bike lanes. Improvements to serve all modes of travel were assumed to be implemented as follows: 1) an additional southbound lane for vehicles would be provided (currently, Lincoln narrows from three to two travel lanes in the southbound direction just south of Fiji Way whereas three travel lanes are provided in the northbound direction), 2) bus-only lanes would be provided in the median, 3) cycle tracks would be provided on both sides of the roadway to connect the existing bicycle lanes to the south with the Ballona Creek bicycle path, and 4) sidewalks would be provided on both sides of the street (the existing bridge does not provide sidewalks). Culver Boulevard Corridor (CTCSP): Improve traffic flow along Culver Boulevard between Centinela Avenue and I-405 Freeway including providing left-turn lanes at key signalized intersections (including Inglewood Boulevard). Access Improvements to LAX (CTCSP): On-going coordination with LAWA on airport related improvements, which may include a combination of roadway capacity enhancements, streetscape improvements, and multi-modal improvements. For the purposes of modeling potential impacts, improvements already identified in the RTP/SCS in proximity of the airport were included in the Westside TDF model. Sunset Boulevard Operations (WLA TIMP): Implement operational improvements along Sunset Boulevard. Improvements could include the following: ITS corridor improvements; signal upgrades as part of the next evolution of ATSAC; intersection improvements, such as turn-lane or safety improvements. Olympic Boulevard Operations (WLA TIMP): Implement operational improvements along Olympic Boulevard between I- 405 and Purdue Avenue (to the west of I-405). Improvements were assumed to include the following: Convert one westbound travel lane into an eastbound travel lane just west of I-405 by 1) In the westbound direction, provide two travel lanes (three during peak periods with on-street parking restrictions); 2) In the eastbound direction, provide three travel lanes (four during peak periods with on-street parking restrictions); and 3) Remove eastbound and westbound left-turn lanes at Beloit Avenue and eastbound center turn lane at Cotner Avenue to provide additional through lane capacity. Bundy Drive/I-10 Ramp (WLA TIMP): Operational improvements at the I-10 ramp connections to Bundy Drive. Major Intersection Improvements (CTCSP and WLA TIMP): Spot intersection improvements, such as turn-lane or safety improvements. Neighborhood Protection Program In CTCSP and WLA TIMP, the objective of this Program is to discourage through-traffic from using local streets and to encourage, instead, use of the arterial street system. The Program will establish measures to make the primary arterial routes more attractive and local routes less attractive for through traffic, and establish measures designed to facilitate vehicular and pedestrian egress from local streets in the adjacent neighborhoods onto the primary arterial street and highways system. Technology Improvements 71
81 ITS Corridor & Signal Upgrades (CTCSP & WLA TIMP): Install ITS improvements along major corridors. Install signal upgrades as part of the next evolution of ATSAC, including detector loops for traffic volume data and monitoring Congestion Monitoring (CTCSP & WLA TIMP): Install CCTV cameras and necessary infrastructure to improve DOT's ability to monitor and respond to real-time traffic conditions Trip Reduction Programs Parking Management ExpressPark (CTCSP & WLA TIMP): Implement an on-street intelligent parking program that includes vehicle sensors, dynamic demand-based pricing and a real-time parking guidance system to reduce VMT and congestion and improve flow for cars/buses Strategic Parking Program (CTCSP & WLA TIMP): Implement a Westside parking program and update parking requirements to reflect mixed-use developments, shared parking opportunities, and parking needs at developments adjacent to major transit stations Parking Utilization Improvements & Reduced Congestion (CTCSP & WLA TIMP): Develop an on-line system for real-time parking information, including GIS database and mapping. Improve parking, wayfinding and guidance throughout commercial areas. Demand Management Rideshare Toolkit (CTCSP & WLA TIMP): Develop an online Transportation Demand Management (TDM) Toolkit with information for transit users, cyclists, and pedestrians as well as ridesharing. Include incentive programs for employers, schools, and residents. Toolkit would be specific to City businesses, employees, and visitors and would integrate traveler information and also include carpooling/vanpooling and alternative work schedules. Transportation Demand Management Program (CTCSP & WLA TIMP): The program would provide start-up costs for Transportation Management Organizations/Associations (TMOs/TMAs) as well as provide guidance and implementation of a TDM program CTCSP & WLA TIMP IMPACT ANALYSIS Since the proposed amendments to the specific plans do not include any land use changes, the transportation impact analysis reflected the same land use and growth assumptions for both with and without project conditions. The background growth reflected in the Westside TDF model accounts for the expected increased activity levels in the region and study area. If the transportation analysis were to strictly evaluate project-related environmental conditions in the future without including future background growth, and then were to compare that project-related future condition to the existing conditions in 2014, the analysis would not account for the overall cumulative nature of the potential impacts and could understate the expected future conditions. The updated Westside TDF model was used to generate the baseline (Existing Year 2014) and future (Year 2035) conditions data for the proposed amendments to the CTCSP and WLA TIMP. Given the programmatic nature of the impact analysis and large study area, the Westside TDF model reflects the most recent and applicable data at a specific plan level to report baseline and future transportation characteristics. Through the model development and calibration process along with the updates described in this report, the Westside TDF model is consistent with the 72
82 growth and transportation improvements in the adopted SCAG RTP/SCS, which reflects both the City of LA and SCAG region. Appendix J contains model plots illustrating AM and PM peak period traffic operations under Existing, Future without Project and Future with Project conditions. The model simulates base year conditions and can forecast future year conditions for the network, with and without the effects of the proposed Specific Plan amendments, allowing for evaluation of a range of performance measures. Because the travel demand model itself is not sensitive to certain effects of travel demand management (TDM) policies or of changes in bicycle and pedestrian infrastructure defined in the proposed updates to the CTCSP and WLA TIMP Project Lists, a mode split adjustment tool (MSAT) is applied to the model results to quantify the effect of these programs and projects on automobile travel. The MSAT applies mode share elasticities and vehicle trip reduction factors gathered from relevant academic and practitioner literature at the TAZ level to calculate the effects of TDM and active transportation network improvements on mode share and the level of vehicle trip-making. Used together, the travel demand model and mode split adjustment tool outputs provide information on the performance of the transportation system for the overall study area, including: Travel mode shares (mode split) Vehicle miles traveled Vehicle trips Roadway operations (e.g., volume-to-capacity ratios) The analysis tools used to forecast future travel patterns, such as the Westside TDF model, are long range models of travel demand. Their primary focus is on forecasting driving with some additional sensitivity to other ways of traveling. This is consistent with how most cities forecast traffic and how transportation professionals have operated for decades. However, new trends in how we travel have emerged in recent years. Experts are debating what may be driving these trends and how durable they may or may not be. Many forces are pulling in various directions, including recessionary effects on employment, changes in millennial interest in driving and vehicle ownership, baby boomer retirement choices and their continued participation in the workforce and preferences for urban living, fuel prices, new delivery of goods and services through providers like Amazon, and greater travel options through autonomous vehicles and shared use mobility (e.g. Lyft, Uber, bikeshare programs). The transportation analysis approach applied to the Specific Plan amendments included using the established traffic forecasting tools and increasing their sensitivity to the trends that have been empirically proven and previously accepted under CEQA. However, these may prove to be conservative if some of the recent trends in travel persist. It is not clear what direction the trends will take us at this point. VMT per capita has been generally dropping since around 2004, increased for many decades prior, and has now begun to climb again since January Trends in LA are also pulling in multiple directions. If the trends toward higher levels of walking, bicycling, and transit use exceed what is forecast with the Specific Plan amendments, this could result in fewer driving related impacts than the plan conservatively accounts for in the association transportation impact analysis. 73
83 APPENDIX A: LADCP BASE YEAR LAND USE CHANGES
84 Westside Model Base Year (2008) Land Use Changes from LADCP HH Jobs Area TAZ Model LADCP Model LADCP Playa Vista , Notes Palms/Mar Vista Palms/Mar Vista Palms/Mar Vista Palms/Mar Vista Palms/Mar Vista Palms/Mar Vista Venice x x reduce by 50 jobs Venice x x reduce by 50 jobs Venice x x reduce by 50 jobs Venice x x reduce by 50 jobs Venice x x reduce by 50 jobs Venice x x reduce by 50 jobs Venice x x reduce by 50 jobs Venice x x reduce by 50 jobs Venice x x reduce by 50 jobs Venice x x reduce by 50 jobs Venice x x reduce by 50 jobs Venice x x reduce by 50 jobs West LA West LA West LA West LA West LA West LA West LA West LA West LA ,789 3,000 West LA West LA West LA ,000 West LA West LA x Shift to TAZs 2460, 577, 2346, and 2382 Total Delta 2,363 5,680 8,717 8, ,
85 APPENDIX B: SOCIO ECONOMIC DATA
86 Westside Study Area Socio-Economic Data TAZ County TAZ ID District District2 POP RES HH GN HHSize_1 HHSize_2 HHSize_3 HHSize_4plus HHSize_4E age5_17 age18_24 age16_64 age65_over ho18_24 ho25_44 ho45_64 ho65_over HH_w0 HH_w1 HH_w2 HH_w3 K12 COLLEGE median HO<$25k median25k $25k<HO<$50k median25_50 $50k<HO<$100k median50_100 HO>$100k median_100 LINC_WRK MINC_WRK HINC_WRK Tot_emp TotLow_emp TotMed_emp TotHig_emp Ag_emp Const_emp Manu_emp Whole_emp Ret_emp Trans_emp Infor_emp FIRE_emp Prof_emp Educ_emp ArtEnt_emp OthSer_emp PubAdm_emp DailyPark HourlyPark CBD RSA 14 Los Angeles Los Angeles Los Angeles Los Angeles Los Angeles Los Angeles Los Angeles Los Angeles Los Angeles Los Angeles Los Angeles Los Angeles Los Angeles Los Angeles Los Angeles Los Angeles Los Angeles Los Angeles Los Angeles Los Angeles Los Angeles Los Angeles Los Angeles Los Angeles Los Angeles Los Angeles Los Angeles Los Angeles Los Angeles Los Angeles Los Angeles Los Angeles Los Angeles Los Angeles Los Angeles Los Angeles Los Angeles Los Angeles Los Angeles Los Angeles Los Angeles Los Angeles Los Angeles Los Angeles Los Angeles Los Angeles Los Angeles Los Angeles Los Angeles Los Angeles Los Angeles Los Angeles Los Angeles Los Angeles Los Angeles Los Angeles Los Angeles Los Angeles Los Angeles Los Angeles Los Angeles Los Angeles Los Angeles Los Angeles Los Angeles Los Angeles Los Angeles Los Angeles Los Angeles Los Angeles Los Angeles Los Angeles Los Angeles Los Angeles Los Angeles Los Angeles Los Angeles Los Angeles Los Angeles Los Angeles Los Angeles Los Angeles Los Angeles Los Angeles Los Angeles Los Angeles Los Angeles Los Angeles Los Angeles Los Angeles Los Angeles Los Angeles Los Angeles Los Angeles Los Angeles Los Angeles Los Angeles Los Angeles Los Angeles Los Angeles Los Angeles Los Angeles Los Angeles Los Angeles Los Angeles Los Angeles Los Angeles Los Angeles Los Angeles Los Angeles Los Angeles Los Angeles Los Angeles Los Angeles Los Angeles Los Angeles Los Angeles Los Angeles Los Angeles Los Angeles Los Angeles Los Angeles Los Angeles Los Angeles Los Angeles Los Angeles Los Angeles Los Angeles Los Angeles Los Angeles Los Angeles Los Angeles Los Angeles Los Angeles Los Angeles Los Angeles Los Angeles Los Angeles Los Angeles Los Angeles Los Angeles Los Angeles Los Angeles Los Angeles Los Angeles Los Angeles Los Angeles Los Angeles Los Angeles Los Angeles Los Angeles Los Angeles Los Angeles Los Angeles Los Angeles Los Angeles Los Angeles Los Angeles Los Angeles Los Angeles Los Angeles Los Angeles Los Angeles Los Angeles Los Angeles Los Angeles Los Angeles Los Angeles Los Angeles Los Angeles Los Angeles Los Angeles Los Angeles Los Angeles Los Angeles Los Angeles Los Angeles Los Angeles Los Angeles Los Angeles Los Angeles Los Angeles Los Angeles Los Angeles Los Angeles Page 1
87 Westside Study Area Socio-Economic Data TAZ County TAZ ID District District2 POP RES HH GN HHSize_1 HHSize_2 HHSize_3 HHSize_4plus HHSize_4E age5_17 age18_24 age16_64 age65_over ho18_24 ho25_44 ho45_64 ho65_over HH_w0 HH_w1 HH_w2 HH_w3 K12 COLLEGE median HO<$25k median25k $25k<HO<$50k median25_50 $50k<HO<$100k median50_100 HO>$100k median_100 LINC_WRK MINC_WRK HINC_WRK Tot_emp TotLow_emp TotMed_emp TotHig_emp Ag_emp Const_emp Manu_emp Whole_emp Ret_emp Trans_emp Infor_emp FIRE_emp Prof_emp Educ_emp ArtEnt_emp OthSer_emp PubAdm_emp DailyPark HourlyPark CBD RSA 2307 Los Angeles Los Angeles Los Angeles Los Angeles Los Angeles Los Angeles Los Angeles Los Angeles Los Angeles Los Angeles Los Angeles Los Angeles Los Angeles Los Angeles Los Angeles Los Angeles Los Angeles Los Angeles Los Angeles Los Angeles Los Angeles Los Angeles Los Angeles Los Angeles Los Angeles Los Angeles Los Angeles Los Angeles Los Angeles Los Angeles Los Angeles Los Angeles Los Angeles Los Angeles Los Angeles Los Angeles Los Angeles Los Angeles Los Angeles Los Angeles Los Angeles Los Angeles Los Angeles Los Angeles Los Angeles Los Angeles Los Angeles Los Angeles Los Angeles Los Angeles Los Angeles Los Angeles Los Angeles Los Angeles Los Angeles Los Angeles Los Angeles Los Angeles Los Angeles Los Angeles Los Angeles Los Angeles Los Angeles Los Angeles Los Angeles Los Angeles Los Angeles Los Angeles Los Angeles Los Angeles Los Angeles Los Angeles Los Angeles Los Angeles Los Angeles Los Angeles Los Angeles Los Angeles Los Angeles Los Angeles Los Angeles Los Angeles Los Angeles Los Angeles Page 2
88 APPENDIX C: NETWORK SKIMMING
89 Comparison of 2010 Metro Transit Ridership to 2003 SCAG 2008 RTP Model Transit Ridership Number of Lines Daily Ridership Transit Type Metro (2008) 1 SCAG (2003) Delta Metro (2010) 1 SCAG (2003) Delta % Delta MTA Bus ,071, , ,388-10% MTA Rail , ,132-57,952-20% MTA All Transit ,355,434 1,194, ,341-12% 1 Source: Metro
90 Comparison of 2010 Metro Transit Ridership to 2008 City of Los Angeles Model Transit Ridership Number of Lines Daily Ridership Transit Type Metro (2008) 1 TSP Model 2008 Delta Metro (2010) 1 TSP Model 2008 Delta % Delta MTA Bus ,071,350 1,006,828-64,522-6% MTA Rail , ,746 13,662 5% MTA All Transit ,355,434 1,304,574-50,860-4% 1 Source: Metro
91 Comparison of Peak Period Transit Ridership in Metro's 2006 Travel Demand Forecasting Model to the 2008 City of Los Angeles Model Peak Period (7-Hour) Trips District Metro Metro Metro TSP TSP TSP Delta Delta Delta Metro Metro Metro TSP TSP TSP Delta Delta Delta # Metro District HBW Person HBW Transit HBW Transit % HBW Person HBW Transit HBW Transit % HBW Person HBW Transit HBW Transit % Total Person Total Transit Total Transit % Total Person Total Transit Total Transit % Total Person Total Transit Total Transit % 1 Santa Monica N 80,179 10,569 13% 116,373 9,715 8% 36, % 366,704 22,007 6% 396,984 19,542 5% 30,280-2, % 2 Brentwood S 18,735 2,120 11% 29,692 1,828 6% 10, % 84,950 4,997 6% 92,702 3,600 4% 7,752-1, % 3 West LA 40,620 6,261 15% 55,948 3,725 7% 15,328-2, % 174,473 12,736 7% 169,482 6,936 4% -4,991-5, % 4 Westwood W 5,475 1,175 21% 7, % 1, % 19,623 1,799 9% 26,426 1,521 6% 6, % 5 VA 11,439 2,615 23% 6, % -4,680-2, % 41,295 4,311 10% 17, % -23,926-4, % 6 UCLA 31,191 4,708 15% 31,689 4,250 13% % 171,737 17,795 10% 113,514 8,332 7% -58,223-9, % 7 Westwood C 23,578 4,625 20% 34,346 3,374 10% 10,768-1, % 98,848 10,276 10% 102,049 5,388 5% 3,201-4, % 8 Westwood E 13,788 1,198 9% 17,628 1,323 8% 3, % 56,379 2,960 5% 68,350 2,782 4% 11, % 9 Westside N 55,830 13,948 25% 71,778 5,536 8% 15,948-8, % 246,229 27,509 11% 207,205 9,642 5% -39,024-17, % 10 Beverly Hills N 6, % 10, % 4, % 31, % 47,038 1,509 3% 15, % 11 Beverly Hills S 57,754 12,652 22% 65,473 5,428 8% 7,719-7, % 277,650 27,662 10% 246,865 10,841 4% -30,785-16, % 12 S Robertson N 13,837 1,276 9% 18,546 1,468 8% 4, % 60,090 3,106 5% 70,046 2,861 4% 9, % 13 West Hollywood 44,905 6,679 15% 58,227 6,316 11% 13, % 199,278 13,458 7% 205,487 11,241 5% 6,209-2, % 14 Hollywood Hills West S 10,449 1,344 13% 14,685 1,672 11% 4, % 39,714 2,520 6% 51,062 2,730 5% 11, % 15 Mid City West N 21,931 1,972 9% 25,914 2,813 11% 3, % 113,302 4,511 4% 105,366 5,202 5% -7, % 16 Mid City West S 59,746 10,909 18% 68,802 5,946 9% 9,056-4, % 259,400 23,423 9% 245,560 10,970 4% -13,840-12, % 17 PICO 11,467 1,125 10% 14,767 1,198 8% 3, % 50,502 2,591 5% 61,031 2,542 4% 10, % 18 Central Hollywood 42,426 6,957 16% 52,138 7,229 14% 9, % 192,918 13,218 7% 195,544 12,169 6% 2,626-1, % 19 Greater Wilshire N 7, % 11,158 1,026 9% 3, % 36,247 1,436 4% 42,347 1,944 5% 6, % 20 Greater Wilshire S 25,802 3,954 15% 34,419 3,995 12% 8, % 112,426 8,139 7% 130,131 6,938 5% 17,705-1, % 21 Olympic Park 13,207 2,067 16% 16,475 2,225 14% 3, % 64,681 4,076 6% 77,050 4,092 5% 12, % 22 Korean Town NW 4, % 4, % % 21,043 1,457 7% 22,890 1,362 6% 1, % 23 Korean Town SW 22,755 4,741 21% 25,078 4,031 16% 2, % 88,049 8,728 10% 95,942 6,306 7% 7,893-2, % 24 Hollywood Studio 20,873 3,627 17% 28,475 3,638 13% 7, % 95,711 6,262 7% 107,812 6,232 6% 12, % 25 Greater Wilshire NE 4, % 6, % 1, % 18,237 1,125 6% 23,139 1,280 6% 4, % 26 East Hollywood 42,698 7,766 18% 46,680 7,792 17% 3, % 198,007 14,857 8% 206,931 13,714 7% 8,924-1, % 27 Korean Town NE 11,288 2,634 23% 13,467 2,583 19% 2, % 50,075 4,581 9% 67,542 4,226 6% 17, % 28 Korean Town NS 24,968 5,865 23% 27,131 4,713 17% 2,163-1, % 89,278 9,824 11% 102,327 7,200 7% 13,049-2, % 29 West Lake 32,539 5,994 18% 26,430 4,080 15% -6,109-1, % 121,671 10,740 9% 103,906 6,726 6% -17,765-4, % 30 McArthur 12,958 3,148 24% 13,002 2,532 19% % 57,072 5,650 10% 62,942 4,170 7% 5,870-1, % 31 Pico Union 24,994 5,312 21% 22,459 4,198 19% -2,535-1, % 112,388 9,419 8% 111,098 7,134 6% -1,290-2, % 32 Rampart 56,779 15,318 27% 55,164 9,069 16% -1,615-6, % 226,649 26,016 11% 220,535 14,766 7% -6,114-11, % 33 LA CBD 109,813 36,867 34% 128,491 18,292 14% 18,678-18, % 400,816 64,674 16% 353,192 27,712 8% -47,624-36, % 34 LA Central 105,960 29,739 28% 136,482 22,040 16% 30,522-7, % 404,339 54,320 13% 393,828 32,516 8% -10,512-21, % 35 Santa Monica S 26,785 1,644 6% 38,975 2,141 5% 12, % 140,226 7,523 5% 135,714 5,120 4% -4,512-2, % 36 Mar Vista 53,043 4,578 9% 66,880 4,830 7% 13, % 225,521 9,718 4% 251,229 9,438 4% 25, % 37 Westside S 3, % 3, % % 16, % 15, % % 38 S Robertson S 16,191 1,612 10% 18,670 1,380 7% 2, % 72,594 3,355 5% 80,338 2,908 4% 7, % 39 West Adams 43,964 6,379 15% 46,667 5,768 12% 2, % 198,748 11,479 6% 225,906 11,033 5% 27, % 40 Marina Del Rey 41,040 3,699 9% 56,063 3,824 7% 15, % 186,687 7,612 4% 193,109 7,928 4% 6, % 41 Del Rey 25,543 1,821 7% 35,524 2,331 7% 9, % 120,257 3,801 3% 124,909 4,670 4% 4, % 42 Century City 59,217 3,962 7% 68,605 4,496 7% 9, % 271,337 7,789 3% 239,283 9,385 4% -32,054 1, % 43 Ladera/Viewpark 12, % 17, % 5, % 61,340 1,774 3% 62,337 1,863 3% % 44 Crenshaw 41,799 4,974 12% 41,679 5,146 12% % 207,726 9,208 4% 210,150 10,559 5% 2,424 1, % 45 Westchester/LAX 76,155 6,993 9% 88,530 6,133 7% 12, % 361,042 14,793 4% 281,286 11,894 4% -79,756-2, % 46 Inglewood 95,971 10,663 11% 92,771 10,436 11% -3, % 438,115 19,251 4% 414,944 20,206 5% -23, % 47 ML King 50,570 8,618 17% 52,891 9,204 17% 2, % 239,435 18,192 8% 260,784 17,771 7% 21, % 48 Vernon 125,807 21,194 17% 122,576 21,154 17% -3, % 562,142 37,719 7% 617,931 38,195 6% 55, % 49 Westmont 159,322 25,365 16% 159,339 24,111 15% 17-1, % 752,920 45,926 6% 931,415 49,825 5% 178,495 3, % 50 South Bay 743,331 58,230 8% 907,536 57,641 6% 164, % 3,297, ,065 3% 3,379, ,242 4% 81,571 13, % 51 Gateway 1,349,485 97,255 7% 1,559, ,456 8% 209,987 35, % 6,123, ,953 3% 6,485, ,504 4% 362,057 89, % 52 Pacific Palisades 18, % 25, % 7, % 102,014 1,155 1% 106,515 1,965 2% 4, % 53 Malibu Beach Brentwood N 5, % 9, % 4, % 28, % 43, % 15, % 55 Bel Air 18, % 29, % 10, % 90,070 1,506 2% 109,148 1,034 1% 19, % 56 Hollywood HIlls West N 13, % 15, % 1, % 56,690 1,942 3% 50,470 1,732 3% -6, % 57 Hollywood United 17,711 1,882 11% 23,521 1,953 8% 5, % 67,002 3,496 5% 87,376 3,380 4% 20, % 58 Griffith Park 33,542 3,005 9% 39,397 3,562 9% 5, % 138,614 5,800 4% 152,364 6,580 4% 13, % 59 LA Rest 192,454 22,812 12% 211,524 25,775 12% 19,070 2, % 874,215 44,145 5% 934,973 48,689 5% 60,758 4, % 60 East LA 153,023 20,229 13% 162,909 23,239 14% 9,886 3, % 651,904 34,111 5% 720,555 40,725 6% 68,651 6, % 61 Pasadena 316,017 26,624 8% 402,120 31,652 8% 86,103 5, % 1,433,662 52,262 4% 1,519,096 65,532 4% 85,434 13, % 62 Iwindale 322,318 18,686 6% 360,632 22,750 6% 38,314 4, % 1,474,444 33,531 2% 1,485,212 49,513 3% 10,768 15, % 63 Montclair San Gabriel Valley 448,220 24,778 6% 548,233 29,763 5% 100,013 4, % 2,025,724 44,161 2% 2,116,544 59,480 3% 90,820 15, % 65 Encino 72,148 6,922 10% 98,709 4,349 4% 26,561-2, % 361,677 13,527 4% 357,236 9,973 3% -4,441-3, % 66 Sherman Oaks 72,041 6,604 9% 100,432 6,979 7% 28, % 333,959 13,804 4% 357,669 13,620 4% 23, % 67 Chatsworth 414,585 32,170 8% 478,615 31,516 7% 64, % 1,895,525 57,964 3% 1,827,718 70,072 4% -67,807 12, % 68 North Hollywood 312,073 32,873 11% 361,523 38,494 11% 49,450 5, % 1,403,317 60,298 4% 1,614,844 74,612 5% 211,527 14, % 69 San Fernando 185,742 12,443 7% 236,419 17,361 7% 50,677 4, % 851,573 21,967 3% 1,029,718 37,104 4% 178,145 15, % 70 Burbank 128,080 13,776 11% 150,682 12,033 8% 22,602-1, % 493,569 22,223 5% 506,648 22,817 5% 13, % 71 Glendale 190,414 15,588 8% 228,990 18,806 8% 38,576 3, % 888,241 29,480 3% 897,393 34,319 4% 9,152 4, % 72 North LA Ventura Co Orange Co San Bernardino Co Riverside Co Total 6,909, , % 8,157, , % 1,247, % 31,027,540 1,369, % 32,370,435 1,411, % 1,342,895 42, %
92 APPENDIX D: TRIP DISTRIBUTION
93 2008 City of Los Angeles Model Trip Distribution Summary Average Trip Time, Trip Length, and Travel Speed LA County Weighted Average Trip Weighted Average Trip Average Travel Trip Purpose Average Trip Time Average Trip Length (Miles) Productions + Attractions Time (Min) Length (Miles) Speed (Mph) HBWD1 PK ,251 25,487,381 8,543, HBWD2 PK ,810,089 52,148,672 16,942, HBWD3 PK ,353, ,032,481 56,289, HBWS1 PK ,163 6,663,565 2,125, HBWS2 PK ,092 16,124,247 5,148, HBWS3 PK ,281,204 47,814,547 15,566, HBSP PK ,678, ,286,853 35,322, HBSC PK ,929,317 88,802,571 28,408, HBCU PK ,052 12,466,663 4,404, HBSH PK ,331,794 54,120,929 16,159, HBSR PK HBO PK ,689, ,542,998 49,612, OBO PK ,920, ,112,618 65,194, WBO PK ,386,171 72,778,230 29,039, HBWD1 OP ,453 8,405,256 4,156, HBWD2 OP ,064 17,880,635 9,166, HBWD3 OP ,227,030 51,088,068 27,347, HBWS1 OP ,946 2,795,616 1,352, HBWS2 OP ,531 5,703,856 2,821, HBWS3 OP ,535 17,384,690 9,054, HBSP OP ,061,039 43,681,021 20,692, HBSC OP ,387,704 20,121,706 9,741, HBCU OP ,334 6,619,851 3,315, HBSH OP ,435,310 50,155,527 23,360, HBSR OP HBO OP ,050, ,070,434 60,620, OBO OP ,986, ,945,533 93,370, WBO OP ,071,209 44,096,041 23,528, All Trips 68,847, Commute Trips 18,574, Non-Commute Trips 50,273,
94 APPENDIX E: MODE SPLIT
95 2008 City of Los Angeles Model Peak Period Mode Split Percentages Peak Period (7-Hour) Mode Split Percentages # Area HBW Auto Person Trips HBW Auto % HBW Transit Person Trips HBW Transit % HBW Walk/Bike Person Trips HBW Walk/Bike % Total Auto Person Trips Total Auto % Total Transit Person Trips Total Transit % Total Walk/Bike Person Trips Total Walk/Bike % Total Non-Auto Person Trips Total Non-Auto % 1 TSP Model 12,725, % 561, % 1,462, % 47,879, % 940, % 10,127, % 11,068, % 2 LA County 7,059, % 554, % 648, % 26,569, % 930, % 5,298, % 6,229, % 3 LA City 2,928, % 287, % 279, % 11,260, % 463, % 2,247, % 2,710, % 4 Westside Study Area 434, % 29, % 44, % 1,359, % 47, % 293, % 341, % 5 Santa Monica 132, % 8, % 14, % 420, % 13, % 98, % 112, %
96 APPENDIX F: TRIP ASSIGNMENT
97 2008 City of Los Angeles Model Highway Performance Measures LA County Highway Performance Measures City of Los Angeles Model AM Peak Period MD Peak Period PM Peak Period NT Peak Period Speed Bin AB BA Total AB BA Total AB BA Total AB BA Total Daily Daily % , , , ,897 35, , , , ,125 1, ,331 1,486, % ,123, ,601 1,798, , , ,699 2,435, ,461 3,214,199 13,115 1,159 14,274 5,505, % ,069,182 2,206,364 6,275, , ,307 1,070,258 7,796,309 3,214,312 11,010, ,687 10, ,210 18,467, % ,007,949 3,845,826 10,853,775 2,775,730 1,946,260 4,721,990 12,197,879 5,008,640 17,206, , , ,458 33,629, % ,042,679 3,070,673 11,113,352 5,483,037 3,825,462 9,308,499 9,580,565 3,739,212 13,319,778 1,521,888 1,176,399 2,698,288 36,439, % ,420, ,519 5,152,423 6,031,090 2,482,797 8,513,887 5,377,833 1,062,045 6,439,878 1,710,423 1,292,528 3,002,951 23,109, % ,187,661 88,163 2,275,825 6,363, ,840 6,912,162 2,973, ,000 3,123,782 1,685,032 1,046,349 2,731,381 15,043, % ,177,754 23,586 1,201,340 5,007, ,267 5,115,623 1,633,441 58,713 1,692,154 1,249, ,708 1,552,097 9,561, % ,128 3, ,777 3,562,858 20,201 3,583, ,755 4, ,414 1,390,146 55,796 1,445,942 6,773, % , ,375 2,143,954 3,109 2,147, , ,189 4,314,675 21,076 4,335,751 7,221, % , ,065 1,362, ,362,323 84, ,117 4,634, ,634,018 6,197, % , , , ,239 72, ,005 2,570, ,570,476 3,217, % , ,064 76, ,859 1, ,953 1,102, ,102,541 1,182, % > , ,300 70, % Total VMT 29,880,819 10,783,943 40,664,763 34,563,397 9,405,207 43,968,604 43,980,198 14,173,534 58,153,732 20,928,284 4,189,734 25,118, ,905, % Miles of Roadway 10,313 7,776 18,088 10,313 7,776 18,088 10,313 7,776 18,088 10,313 7,776 18,088 18, VMT Per Mile of Roadway 2,897 1,387 2,248 3,351 1,210 2,431 4,265 1,823 3,215 2, ,389 9, Total VHT 99,914,426 43,945, ,859,594 76,509,815 27,485, ,995, ,467,221 55,328, ,795,979 31,715,341 9,355,692 41,071, ,721, Total Free-Flow VHT 40,835,468 20,919,642 61,755,110 44,942,410 17,983,186 62,925,596 61,587,331 27,659,735 89,247,066 25,573,917 7,804,414 33,378, ,306, Total VHD 59,078,958 23,025,526 82,104,484 31,567,405 9,502,372 41,069,778 98,879,889 27,669, ,548,913 6,141,424 1,551,278 7,692, ,415, Average Speed HH in LA County ,156, ,156, ,156, ,156,606 3,156, Jobs in LA County ,323, ,323, ,323, ,323,957 4,323, HH + Jobs in LA County ,480, ,480, ,480, ,480,563 7,480, VMT Per HH + Jobs in LA County
98 HPMS Comparison All Los Angeles County Roadways Including Centroid Connectors (Westside Base Year 2008 Model) HPMS 2009 Westside Model 2008 Delta % Difference Miles of Roadway 21,678 18,232-3,446-16% Daily Vehicle Miles Traveled 214,236, ,135,811-26,101,039-12% Gas and Diesel Sold in 2009 (gallons) 4,378,110,000 4,378,110, Average Miles Per Gallon % National Average Note: Portions of Palmadale, Lancaster, and Unincorporated Los Angeles County were aggregated to reduce model run time. All Los Angeles County Roadways Including Centroid Connectors (Raw SCAG Base Year 2003 Model) HPMS 2009 SCAG Model 2003 Delta % Difference Miles of Roadway 21,678 21, % Daily Vehicle Miles Traveled 214,236, ,038,712-9,198,138-4% Gas and Diesel Sold in 2009 (gallons) 4,378,110,000 4,378,110, Average Miles Per Gallon % National Average SCAG Model 2003 Factored to 2009 Conditions (0.6% per year) Daily Vehicle Miles Traveled 214,236, ,420,106-1,816,744-1%
99 2008 City of Los Angeles Model Transit Ridership Summary Transit Ridership Summary Peak Period Off-Peak Period Total Daily Peak Passenger Off-Peak Total Daily Average Trip Peak Passenger Off-Peak Total Daily Average Trip Average Speed Mode # Transit Mode # of Routes Miles of Transit Daily Capacity Boardings Boardings Boardings Miles Passenger Miles Passenger Miles Length (Miles) Hours Passenger Hours Passenger Hours Time (Minutes) (Mph) 10 Commuter Rail 27 1, ,341 26,472 1,315 27, ,869 26, , , , Local Bus 415 6,823 3,338, , , ,041 1,696,317 1,211,645 2,907, ,237 88, , MTA Express Bus ,423 61,448 20,190 81, , , , ,427 9,379 40, Urban Rail ,256, ,378 76, ,274 1,529, ,177 2,097, ,936 20,139 74, Los Angeles County Express Bus 102 2, ,004 40,569 15,337 55, , , , ,735 7,370 29, Los Angeles County Local Bus (Group 1) ,923 19,937 16,394 36,331 71,178 68, , ,929 4,475 10, Los Angeles County Local Bus (Group 2) 176 1,702 1,288, ,880 83, , , , , ,535 16,053 43, Los Angeles County Local Bus (Group 3) ,241,106 25,089 15,326 40,415 39,108 31,119 70, ,168 1,863 5, Los Angeles County Local Bus (Group 4) , , , All Other Local Bus , ,178 1, , All Other Express Bus , , , High Speed Rail MTA Rapid Bus ,484 34,673 13,975 48, , , , ,374 6,045 23, Total Bus Total Rail Total ,908 7,735, , ,396 1,407,906 3,231,414 2,060,581 5,291, , , , ,722 1,391, ,849 78, ,061 2,067, ,765 2,662, ,828 20,832 88, ,630 9,126,807 1,115, ,608 1,725,967 5,298,828 2,655,346 7,954, , , ,
100 APPENDIX G: TRAFFIC COUNTS
101 APPENDIX H: PEAK PERIOD STATIC MODEL VALIDATION AND SCREENLINE RESULTS
102 Initial Static Highway Validation - Summary Validation Statistic AM Peak Period (3-Hour) PM Peak Period (4-Hour) Threshold Model/Count Ratio = Within 10% Percent Within Maximum Deviation 1 = 70.1% 70.6% > 75% Percent Root Mean Square Error 1 = 35.6% 35.9% < 40% Correlation Coefficient 1 = > 0.88 Screenlines = 82% 86% 100% Validation Locations = Validation Statistic Uncongested Locations AM Peak Period (3-Hour) PM Peak Period (4-Hour) Threshold Model/Count Ratio = Within 10% Percent Within Maximum Deviation 1 = 67.7% 71.1% > 75% Percent Root Mean Square Error 1 = 36.3% 36.4% < 40% Correlation Coefficient 1 = > 0.88 Screenlines = 71% 81% 100% Validation Locations = Validation Statistic Congested Locations AM Peak Period (3-Hour) PM Peak Period (4-Hour) Threshold Model/Count Ratio = Within 10% Percent Within Maximum Deviation 1 = 73.6% 69.9% > 75% Percent Root Mean Square Error 1 = 33.4% 33.7% < 40% Correlation Coefficient 1 = > 0.88 Screenlines = 94% 100% 100% Validation Locations = Static Validation Criteria and Thresholds, 2010 California Regional Transportation Plan Guidelines Model/Count Count Year AM Peak Period PM Peak Period Caltrans 2008 HICOMP Report Congested Facilities AM PM Model/Count Locations 12 16
103 Static Highway Validation - Summary Validation Statistic AM Peak Period (3-Hour) PM Peak Period (4-Hour) Threshold Model/Count Ratio = Within 10% Percent Within Maximum Deviation 1 = 78.4% 82.0% > 75% Percent Root Mean Square Error 1 = 29.9% 30.9% < 40% Correlation Coefficient 1 = > 0.88 Screenlines = 100% 100% 100% Validation Locations = Validation Statistic Uncongested Locations AM Peak Period (3-Hour) PM Peak Period (4-Hour) Threshold Model/Count Ratio = Within 10% Percent Within Maximum Deviation 1 = 82.9% 87.8% > 75% Percent Root Mean Square Error 1 = 28.4% 27.8% < 40% Correlation Coefficient 1 = > 0.88 Screenlines = 100% 95% 100% Validation Locations = Validation Statistic Congested Locations AM Peak Period (3-Hour) PM Peak Period (4-Hour) Threshold Model/Count Ratio = Within 10% Percent Within Maximum Deviation 1 = 71.7% 73.4% > 75% Percent Root Mean Square Error 1 = 29.7% 31.2% < 40% Correlation Coefficient 1 = > 0.88 Screenlines = 100% 81% 100% Validation Locations = Static Validation Criteria and Thresholds, 2010 California Regional Transportation Plan Guidelines Model/Count Count Year AM Peak Period PM Peak Period Caltrans 2008 HICOMP Report Congested Facilities AM PM Model/Count Locations 12 16
104 Static Highway Validation - Highway Links ALL Count AM ALL Count PM Delta AM Delta PM # Direction Count Date Location Model AM Model PM Count AM Count PM Max Dev AM Max Dev PM Dif Squared PM Pass AM? Pass PM? Total 1 E 4/24/ th St E/o Lacienega Bl 476 1,320 1 W 4/24/ th St E/o Lacienega Bl E 7/29/ st St At 5th St W 7/29/ st St At 5th St E 4/12/2007 3rd St E/o La Cienega Bl 2,312 5,382 3 W 4/12/2007 3rd St E/o La Cienega Bl 3,475 3,586 4 E 4/22/2008 3rd St E/o La Cienega Bl 2,032 4,319 1,753 4,645 1,753 4, YES YES 77, , W 4/22/2008 3rd St E/o La Cienega Bl 2,907 3,387 3,561 3,350 3,561 3, YES YES 427,864 1, E 3/12/2008 3rd St At Robertson Bl 1,458 2,775 5 W 3/12/2008 3rd St At Robertson Bl 2,544 2,575 6 E 1/31/ th Av (kittyhawk) E/o Osage Av W 1/31/ th Av (kittyhawk) E/o Osage Av E 9/16/ th St At Fordham Rd W 9/16/ th St At Fordham Rd E 7/1/ rd St At Truxton Av 620 1, , , YES YES 11,356 43, W 7/1/ rd St At Truxton Av 713 1, YES NO 38, , E 2/26/ th St E/o Sepulveda Bl 894 1,157 9 W 2/26/ th St E/o Sepulveda Bl N 1/18/2007 Abbot Kinney Bl At Palms Bl 2,236 2,551 2,532 2,823 2,532 2, YES YES 87,788 74, S 1/18/2007 Abbot Kinney Bl At Palms Bl 1,634 3,000 1,227 4,016 1,227 4, , YES YES 165,782 1,033, N 1/18/2007 Abbot Kinney Bl At Rialto Av 2,236 2,551 2,503 2,761 2,503 2, YES YES 71,444 44, S 1/18/2007 Abbot Kinney Bl At Rialto Av 1,634 3,000 1,185 3,570 1,185 3, YES YES 201, , N 8/28/2007 Abbot Kinney Bl N/o Venice Bl 2,236 2,551 2,204 2,563 2,204 2, YES YES 1, S 8/28/2007 Abbot Kinney Bl N/o Venice Bl 1,634 3,000 1,326 3,536 1,326 3, YES YES 94, , N 5/8/2008 Abott Kinney Bl S/o Venice Bl 1,579 1, , , NO YES 455, , S 5/8/2008 Abott Kinney Bl S/o Venice Bl 1,185 2,132 1,070 3,080 1,070 3, YES YES 13, , E 11/14/2007 Airdrome St At Bedford Av W 11/14/2007 Airdrome St At Bedford Av YES YES 84, E 10/18/2007 Airdrome St At La Cienega Bl W 10/18/2007 Airdrome St At La Cienega Bl YES YES , E 4/24/2008 Airdrome St E/o La Cienega Bl W 4/24/2008 Airdrome St E/o La Cienega Bl E 10/11/2007 Airdrome St At Preuss Rd W 10/11/2007 Airdrome St At Preuss Rd YES YES 187,165 17, E 10/3/2007 Airdrome St At Robertson Bl 506 1, , , YES YES 148, , W 10/3/2007 Airdrome St At Robertson Bl , , YES YES 129,454 73, E 10/11/2007 Alcott St At Beverly Dr W 10/11/2007 Alcott St At Beverly Dr E 10/16/2007 Alcott St At Rexford Dr W 10/16/2007 Alcott St At Rexford Dr N 5/17/2007 Alma Real Dr At Alva Dr S 5/17/2007 Alma Real Dr At Alva Dr E 3/29/2007 Almoloya Av At Chautauqua Bl W 3/29/2007 Almoloya Av At Chautauqua Bl N 1/2/2007 Amherst Av At Texas Av S 1/2/2007 Amherst Av At Texas Av N 10/18/2007 Armacost Av At Nebraska Av S 10/18/2007 Armacost Av At Nebraska Av E 10/10/2007 Ashton Av At Beverly Glen Bl W 10/10/2007 Ashton Av At Beverly Glen Bl E 10/4/2007 Ashton Av At Comstock Av W 10/4/2007 Ashton Av At Comstock Av E 10/10/2007 Ashton Av At Fairburn Av W 10/10/2007 Ashton Av At Fairburn Av E 10/16/2007 Ayres Av At Barrington Av W 10/16/2007 Ayres Av At Barrington Av N 4/29/2008 Bagley Av At Kincardine Av 1,537 1,798 1,093 1,805 1,093 1, YES YES 196, S 4/29/2008 Bagley Av At Kincardine Av 1,156 2,289 1,758 2,870 1,758 2, YES YES 362, , N 5/17/2007 Bagley Av S/o Venice Bl 987 2, , , YES YES 4,646 34, S 5/17/2007 Bagley Av S/o Venice Bl YES YES 9,227 14, N 6/4/2007 Barrington Av S/o Ayres Av 3,691 3,176 3,407 2,380 3,407 2, YES YES 80, , S 6/4/2007 Barrington Av S/o Ayres Av 2,162 5,681 1,549 5,411 1,549 5, YES YES 375,950 73, N 7/24/2008 Barrington Av S/o Ayres Av 3,294 2, S 7/24/2008 Barrington Av S/o Ayres Av 1,442 5, N 10/11/2007 Barrington Pl At Chayote St 1,701 2, S 10/11/2007 Barrington Pl At Chayote St 752 1, N 9/16/2008 Barry Av At Rochester Av S 9/16/2008 Barry Av At Rochester Av N 8/28/2007 Barrington Av At Victoria Av S 8/28/2007 Barrington Av At Victoria Av N 1/16/2008 Barrington Av At Wilshire Bl 2,039 3,013 1,692 2,453 1,692 2, YES YES 120, , S 1/16/2008 Barrington Av At Wilshire Bl 1,525 2, , , NO YES 868,731 45, N 11/14/2007 Bedford St At Airdrome St S 11/14/2007 Bedford St At Airdrome St N 9/6/2007 Bedford St At Cashio St S 9/6/2007 Bedford St At Cashio St N 10/17/2007 Bedford St At Chalmers Dr 1,038 1, YES YES 31,556 65, S 10/17/2007 Bedford St At Chalmers Dr 565 1, , , YES YES , N 9/6/2007 Bedford St At Pico Bl S 9/6/2007 Bedford St At Pico Bl Delta/Count AM Delta/Count PM Within Dev AM Within Dev PM Dif Squared AM
105 Static Highway Validation - Highway Links # Direction Count Date Location Model AM Model PM Count AM Count PM ALL Count AM ALL Count PM Delta AM Delta PM Delta/Count AM Delta/Count PM Max Dev AM Max Dev PM Within Dev AM Within Dev PM Dif Squared AM Dif Squared PM Pass AM? Pass PM? Total 41 N 3/11/2008 Bedford St N/o Whitworth Dr 1,162 1, NO NO 285, , S 3/11/2008 Bedford St N/o Whitworth Dr 277 1, N 3/12/2008 Bedford St N/o Whitworth Dr S 3/12/2008 Bedford St N/o Whitworth Dr 276 1, N 3/13/2008 Bedford St N/o Whitworth Dr S 3/13/2008 Bedford St N/o Whitworth Dr 286 1, N 9/4/2007 Beethoven St At Palms Bl 1,037 1,289 1,345 1,066 1,345 1, YES YES 94,655 49, S 9/4/2007 Beethoven St At Palms Bl 1,037 1, , , NO YES 384, , N 8/15/2007 Bentley Bl At Mississippi Av S 8/15/2007 Bentley Bl At Mississippi Av N 1/3/2007 Bentley Av At Tennessee Av S 1/3/2007 Bentley Av At Tennessee Av N 10/11/2007 Beverly Dr At Alcott St S 10/11/2007 Beverly Dr At Alcott St 876 2, , , YES YES 2,686 32, N 3/4/2008 Beverly Dr S/o Alcott St 1,276 1,245 1,568 1,449 1,567 1, YES YES 85,178 41, S 3/4/2008 Beverly Dr S/o Alcott St 705 1, , , YES YES , N 3/5/2008 Beverly Dr S/o Alcott St 1,543 1, S 3/5/2008 Beverly Dr S/o Alcott St 727 2, N 3/6/2008 Beverly Dr S/o Alcott St 1,594 1, S 3/6/2008 Beverly Dr S/o Alcott St 648 2, N 3/12/2008 Beverwil Dr S/o Alcott St 2,933 2,184 2,705 1,639 2,707 1, YES YES 52, , S 3/12/2008 Beverwil Dr S/o Alcott St 1,164 4, , , NO YES 189, , N 3/13/2008 Beverwil Dr S/o Alcott St 2,702 1, S 3/13/2008 Beverwil Dr S/o Alcott St 717 3, N 10/10/2007 Beverly Glen Bl At Ashton Av 2,469 3,890 2,003 4,041 2,003 4, YES YES 217,386 22, S 10/10/2007 Beverly Glen Bl At Ashton Av 2,455 3,871 2,906 3,595 2,906 3, YES YES 203,639 76, N 9/11/2007 Beverwill Dr At Cashio St 2,933 2,184 2,224 1,478 2,224 1, YES YES 502, , S 9/11/2007 Beverwill Dr At Cashio St 1,164 4, , , , NO NO 187,863 1,579, E 4/12/2007 Beverly Bl E/o La Cienega Bl 2,395 6, W 4/12/2007 Beverly Bl E/o La Cienega Bl 4,241 4, E 4/22/2008 Beverly Bl E/o La Cienega Bl 2,291 4,705 2,249 6,110 2,249 6, , YES YES 1,734 1,974, W 4/22/2008 Beverly Bl E/o La Cienega Bl 3,576 3,710 4,029 4,362 4,029 4, YES YES 205, , N 9/11/2007 Beverwil Dr At Oakmore Rd 3,041 2,595 1,913 1,263 1,913 1,263 1,128 1, NO NO 1,272,339 1,775, S 9/11/2007 Beverwil Dr At Oakmore Rd 1,465 4, , , , NO YES 477,944 1,091, N 1/31/2008 Beverly Glen Bl At Olympic Bl 2,907 2,927 2,197 2,321 2,197 2, YES YES 504, , S 1/31/2008 Beverly Glen Bl At Olympic Bl 1,615 4,193 2,385 4,564 2,385 4, YES YES 593, , N 3/11/2008 Beverwil Dr S/o Rodeo Dr 2,559 3,337 2,069 1,705 1,981 1, , YES NO 240,494 2,665, S 3/11/2008 Beverwil Dr S/o Rodeo Dr 1,358 3, , , YES YES 145, , N 3/12/2008 Beverwil Dr S/o Rodeo Dr 2,141 1, S 3/12/2008 Beverwil Dr S/o Rodeo Dr 999 2, N 3/13/2008 Beverwil Dr S/o Rodeo Dr 2,084 1, S 3/13/2008 Beverwil Dr S/o Rodeo Dr 971 2, N 1/31/2008 Beverly Glen Bl At Strathmore Dr 1,209 2, , , NO YES 436, S 1/31/2008 Beverly Glen Bl At Strathmore Dr 1,637 2,058 2,033 2,414 2,033 2, YES YES 156, , N 9/5/2007 Bundy Dr At Olympic Bl 4,156 4,553 4,383 4,370 4,383 4, YES YES 51,719 33, S 9/5/2007 Bundy Dr At Olympic Bl 2,886 4,102 3,447 4,695 3,447 4, YES YES 314, , N 7/24/2008 Bundy Dr S/o Pico Bl 5,077 4,956 5,052 5,979 5,052 5, , YES YES 612 1,047, S 7/24/2008 Bundy Dr S/o Pico Bl 3,944 7,710 3,382 7,331 3,382 7, YES YES 315, , N 9/5/2007 Bundy Dr At Rochester Av 2,016 3,346 3,053 4,342 3,053 4,342-1, YES YES 1,074, , S 9/5/2007 Bundy Dr At Rochester Av 2,371 3,474 2,449 3,805 2,449 3, YES YES 6, , N 7/11/2007 Bundy Dr At Wilshire Bl 2,390 3,701 2,433 3,814 2,433 3, YES YES 1,826 12, S 7/11/2007 Bundy Dr At Wilshire Bl 2,886 4,223 2,019 3,417 2,019 3, NO YES 751, , N 7/2/2008 Cabrillo Bl At Dewey St S 7/2/2008 Cabrillo Bl At Dewey St E 4/24/2008 Cadillac Av E/o La Cienega Bl 614 1, , , YES YES 24,128 7, W 4/24/2008 Cadillac Av E/o La Cienega Bl 1,822 2,392 2,417 3,580 2,417 3, , YES YES 354,288 1,411, N 1/2/2007 Camden Av At Tennessee Av S 1/2/2007 Camden Av At Tennessee Av N 3/11/2008 Canfield Av S/o Alcott St S 3/11/2008 Canfield Av S/o Alcott St N 3/12/2008 Canfield Av S/o Alcott St S 3/12/2008 Canfield Av S/o Alcott St N 3/13/2008 Canfield Av S/o Alcott St S 3/13/2008 Canfield Av S/o Alcott St N 6/18/2008 Canfield Av At Hargis St S 6/18/2008 Canfield Av At Hargis St E 2/28/2008 Carthage St W/o Haverford Av W 2/28/2008 Carthage St W/o Haverford Av E 9/6/2007 Cashio St At Bedford St W 9/6/2007 Cashio St At Bedford St YES NO 92, , E 9/11/2007 Cashio St At Beverwil Dr W 9/11/2007 Cashio St At Beverwil Dr 1, E 3/4/2008 Cashio St E/o Beverwil Av W 3/4/2008 Cashio St E/o Beverwil Av 1, E 3/5/2008 Cashio St E/o Beverwil Av 174 1, W 3/5/2008 Cashio St E/o Beverwil Av 1, E 3/17/2008 Cashio St E/o Beverwil Av 184 1, W 3/17/2008 Cashio St E/o Beverwil Av 1, E 3/19/2008 Cashio St At Edris Dr 184 1, W 3/19/2008 Cashio St At Edris Dr 1,
106 Static Highway Validation - Highway Links # Direction Count Date Location Model AM Model PM Count AM Count PM ALL Count AM ALL Count PM Delta AM Delta PM Delta/Count AM Delta/Count PM Max Dev AM Max Dev PM Within Dev AM Within Dev PM Dif Squared AM Dif Squared PM Pass AM? Pass PM? Total 81 E 10/2/2007 Cashio St At Robertson Bl 285 1, W 10/2/2007 Cashio St At Robertson Bl ,371 1,040 1,371 1, YES YES 278,362 74, E 3/11/2008 Cashio St W/o Robertson Bl W 3/11/2008 Cashio St W/o Robertson Bl E 3/12/2008 Cashio St W/o Robertson Bl W 3/12/2008 Cashio St W/o Robertson Bl E 3/13/2008 Cashio St W/o Robertson Bl W 3/13/2008 Cashio St W/o Robertson Bl N Corrupt 85 S Corrupt 86 E 2/26/2008 Century Bl W/o Avion Dr 3,900 6,312 4,031 5,653 4,031 5, YES YES 17, , W 2/26/2008 Century Bl W/o Avion Dr 4,196 6,456 4,127 5,227 4,127 5, , YES YES 4,796 1,510, N 8/21/2008 Centinela Av At Braddock Dr 3,572 6,329 3,315 5,270 3,315 5, , YES YES 65,798 1,120, S 8/21/2008 Centinela Av At Braddock Dr 3,799 5,485 2,910 7,167 2,910 7, , YES YES 790,167 2,827, N 8/20/2008 Centinela Av At Culver Dr 3,662 5, S 8/20/2008 Centinela Av At Culver Dr 4, N 8/21/2008 Centinela Av At Gilmore Av 3,853 5,274 4,078 5,870 4,078 5, YES YES 50, , S 8/21/2008 Centinela Av At Gilmore Av 3,266 5,763 1,648 4,722 1,648 4,722 1,618 1, NO YES 2,617,603 1,083, N 2/8/2007 Centinela Av At Louise Av 4,081 5,064 4,093 4,729 4,093 4, YES YES , S 2/8/2007 Centinela Av At Louise Av 3,134 6,188 2,330 5,854 2,330 5, YES YES 646, , E 11/13/2008 Palms Dr At Centinela Av 1,280 2,693 1,523 2,446 1,523 2, YES YES 59,106 61, W 11/13/2008 Palms Dr At Centinela Av 2,226 2,428 1,855 2,272 1,855 2, YES YES 137,969 24, N 7/23/2008 Centinela Av S/o Pico Bl 2,057 2,251 1,957 2,011 1,957 2, YES YES 9,971 57, S 7/23/2008 Centinela Av S/o Pico Bl 3,668 5,981 2,415 5,080 2,415 5,080 1, NO YES 1,569, , E 2/27/2008 Century Fwy Wb E/o Sepulveda Bl W 2/27/2008 Century Fwy Wb E/o Sepulveda Bl 5,720 5, N 11/13/2008 Centinela Av At Stanwood Dr 4,769 5,178 6,667 6,508 6,667 6,508-1,898-1, NO YES 3,603,157 1,769, S 11/13/2008 Centinela Av At Stanwood Dr 3,376 6,205 2,797 8,852 2,797 8, , YES NO 335,680 7,008, N 8/28/2007 Centinela Av N/o Venice Bl 4,336 4,924 5,160 4,898 5,160 4, YES YES 678, S 8/28/2007 Centinela Av N/o Venice Bl 2,928 5,527 2,228 5,844 2,228 5, YES YES 490, , N 4/1/2008 Centinela Av S/o Venice Bl 3,416 6,989 2,687 6,785 2,687 6, YES YES 531,024 41, S 4/1/2008 Centinela Av S/o Venice Bl 4,232 4,826 4,298 4,845 4,298 4, YES YES 4, E 4/25/2007 Century Bl At Wilmington Bl 97 W 4/25/2007 Century Bl At Wilmington Bl 115 1, N Corrupt 98 S Corrupt 99 E 10/11/2007 Chayote St At Barrington Pl W 10/11/2007 Chayote St At Barrington Pl E 10/17/2007 Chalmers Dr At Bedford St W 10/17/2007 Chalmers Dr At Bedford St E 8/30/2007 Charnock Rd At Inglewood Bl W 8/30/2007 Charnock Rd At Inglewood Bl E 9/4/2007 Charnock Rd At Overland Av 758 1, NO NO 87, , W 9/4/2007 Charnock Rd At Overland Av E 10/17/2007 Chalmers Dr At Shenandoah St W 10/17/2007 Chalmers Dr At Shenandoah St N 10/4/2007 Club View Dr At Rochester Av S 10/4/2007 Club View Dr At Rochester Av N 10/4/2007 Comstock Av At Ashton Av S 10/4/2007 Comstock Av At Ashton Av E 8/29/2007 Culver Bl At Inglewood Bl 3,253 3,883 2,407 2,427 2,407 2, , YES NO 715,017 2,120, W 8/29/2007 Culver Bl At Inglewood Bl 2,347 4,610 1,309 2,794 1,309 2,794 1,038 1, NO NO 1,076,532 3,296, N 5/9/2007 Culver Bl S/o Marina Fwy Wb Off Ramp 2,366 3,090 4,135 2,957 4,135 2,957-1, NO YES 3,128,186 17, S 5/9/2007 Culver Bl S/o Marina Fwy Wb Off Ramp 2,513 3,852 1,069 4,931 1,069 4,931 1,444-1, NO YES 2,086,262 1,163, N 7/17/2008 Culver Bl S/o Marina Fwy Wb Off 6,325 5, S 7/17/2008 Culver Bl S/o Marina Fwy Wb Off 2,725 10, N 5/1/2007 Culver Bl S/o Venice Bl 1,710 2,472 2,260 4,488 2,260 4, , YES NO 302,753 4,063, S 5/1/2007 Culver Bl S/o Venice Bl 2,453 3,167 2,045 2,207 2,045 2, YES YES 166, , E 7/2/2008 Dewey St At Cabrillo Bl W 7/2/2008 Dewey St At Cabrillo Bl E 7/2/2008 Dewey St At Walgrove Av W 7/2/2008 Dewey St At Walgrove Av N 3/19/2008 Edris Dr At Cashio St S 3/19/2008 Edris Dr At Cashio St N 12/30/2008 El Medio Av At Northfield St S 12/30/2008 El Medio Av At Northfield St E 6/11/2008 Entrada Dr At Mesa Rd W 6/11/2008 Entrada Dr At Mesa Rd E 6/11/2008 Entrada Dr At Pacific Coast Hwy 1,884 1,494 1,191 1,445 1,191 1, NO YES 479,674 2, W 6/11/2008 Entrada Dr At Pacific Coast Hwy 2,162 2, N 10/10/2007 Fairburn Av At Ashton Av S 10/10/2007 Fairburn Av At Ashton Av N 11/15/2007 Federal Ave At Wilshire Bl 1,388 2, S 11/15/2007 Federal Ave At Wilshire Bl 3,772 5, N 9/16/2008 Fordham Rd At 80th St S 9/16/2008 Fordham Rd At 80th St E 4/11/2007 Fountain Av At La Cienega Bl 1,472 4, W 4/11/2007 Fountain Av At La Cienega Bl 4,536 3, E 5/6/2008 Fountain Av At La Cienega Bl 2,032 5,107 1,456 4,686 1,456 4, YES YES 331, , W 5/6/2008 Fountain Av At La Cienega Bl 3,721 3,764 4,500 3,489 4,500 3, YES YES 607,288 75,
107 Static Highway Validation - Highway Links # Direction Count Date Location Model AM Model PM Count AM Count PM ALL Count AM ALL Count PM Delta AM Delta PM Delta/Count AM Delta/Count PM Max Dev AM Max Dev PM Within Dev AM Within Dev PM Dif Squared AM Dif Squared PM Pass AM? Pass PM? Total 121 N 7/24/2008 Gateway Bl N/o Barrington Av 3,181 3,265 2,279 2,549 2,279 2, YES YES 814, , S 7/24/2008 Gateway Bl N/o Barrington Av 2,019 4,772 2,601 3,475 2,601 3, , YES YES 338,708 1,683, N 8/24/2007 Glendon Av E S/o Charnock Rd S 8/24/2007 Glendon Av E S/o Charnock Rd N 8/23/2007 Glendon Av At Francis Pl S 8/23/2007 Glendon Av At Francis Pl N 3/18/2008 Glendon Av At La Grange Av S 3/18/2008 Glendon Av At La Grange Av N 12/9/2008 Glendon Av At Missouri Av S 12/9/2008 Glendon Av At Missouri Av N 10/14/2008 Glendon Av At Ohio Av S 10/14/2008 Glendon Av At Ohio Av N 8/22/2007 Glendon Av At Tabor St S 8/22/2007 Glendon Av At Tabor St N 8/22/2007 Glendon Av At Wesminister Av S 8/22/2007 Glendon Av At Wesminister Av E 12/30/2008 Goshen Av At Amherst Av W 12/30/2008 Goshen Av At Amherst Av N 3/27/2008 Gra\ndview Bl S/o National Bl S 3/27/2008 Gra\ndview Bl S/o National Bl N 3/27/2008 Grandview Bl At Palms Bl S 3/27/2008 Grandview Bl At Palms Bl 276 1, N 10/23/2007 Grand View Bl At Venice Bl 1,760 1, S 10/23/2007 Grand View Bl At Venice Bl 623 1, N 4/1/2008 Grandview Bl At Washington Pl S 4/1/2008 Grandview Bl At Washington Pl 589 1, N 10/14/2008 Greenfield Av At Massachusetts Av S 10/14/2008 Greenfield Av At Massachusetts Av N 8/15/2007 Greenfield Av At Ohio Av S 8/15/2007 Greenfield Av At Ohio Av E 6/18/2008 Hargis St At Canfield Av W 6/18/2008 Hargis St At Canfield Av N 2/6/2007 Hilgard Av At Manning Av 2,223 2,905 2,113 2,935 2,113 2, YES YES 12, S 2/6/2007 Hilgard Av At Manning Av 2,006 3,032 1,607 3,131 1,607 3, YES YES 159,094 9, N 2/6/2007 Hilgard Av S/o Sunset Bl 1,514 3, , , NO YES 324, S 2/6/2007 Hilgard Av S/o Sunset Bl 2,234 2,328 2,199 1,877 2,199 1, YES YES 1, , E 5/17/2007 Holloway Dr E/o La Cienega Bl 1,420 2, , , , NO NO 467,784 1,154, W 5/17/2007 Holloway Dr E/o La Cienega Bl 1,669 1, NO NO 713, , N 10/18/2007 Holt Av At Sawyer St S 10/18/2007 Holt Av At Sawyer St E 7/31/2007 Idaho Av At Bundy Dr 830 1, , , YES YES 39,229 21, W 7/31/2007 Idaho Av At Bundy Dr 830 1, YES NO 6, , E 2/26/2008 Imperial Hwy E/o Sepulveda Bl 3,716 6, W 2/26/2008 Imperial Hwy E/o Sepulveda Bl 2,227 2, N 8/30/2007 Inglewood Bl At Charnock Rd 1,405 1,199 1, , YES YES 9, , S 8/30/2007 Inglewood Bl At Charnock Rd 277 1, N 8/29/2007 Inglewood Bl At Culver Bl 3,034 3,641 2,602 2,720 2,602 2, YES YES 186, , S 8/29/2007 Inglewood Bl At Culver Bl 2,563 4,735 1,216 3,409 1,216 3,409 1,347 1, NO NO 1,813,934 1,759, N 7/17/2008 Inglewood Bl N/o Culver Dr 2,063 2, S 7/17/2008 Inglewood Bl N/o Culver Dr 1,469 3, N 1/10/2007 Inglewood Bl S/o National Bl 1,657 1,128 1,848 1,073 1,848 1, YES YES 36,570 3, S 1/10/2007 Inglewood Bl S/o National Bl 232 1, N 1/16/2007 Inglewood Bl At Palms Bl 1,658 1,144 1, , YES YES 307,783 67, S 1/16/2007 Inglewood Bl At Palms Bl 242 1, N 4/1/2008 Inglewood Bl S/o Venice Bl 1,483 1,551 1,796 1,552 1,796 1, YES YES 97, S 4/1/2008 Inglewood Bl S/o Venice Bl 1,101 2, , , YES YES 115,465 19, E 4/24/2008 Jefferson Bl E/o Lacienega Bl 2,392 4,434 1,650 4,290 1,650 4, NO YES 550,330 20, W 4/24/2008 Jefferson Bl E/o Lacienega Bl 2,933 3,724 3,830 2,674 3,830 2, , YES YES 805,342 1,101, N 4/3/2007 Kelton Av At Levering Av S 4/3/2007 Kelton Av At Levering Av N 5/15/2008 Kelton Av At Levering St S 5/15/2008 Kelton Av At Levering St N 7/1/2008 Kentwood Av At 80th St S 7/1/2008 Kentwood Av At 80th St N 7/1/2008 Kentwood Av At Henefer Av S 7/1/2008 Kentwood Av At Henefer Av N 7/1/2008 Kentwood Av At Manchester Av S 7/1/2008 Kentwood Av At Manchester Av N 3/11/2008 Kerwood Av S/o Tennessee Av S 3/11/2008 Kerwood Av S/o Tennessee Av N 3/12/2008 Kerwood Av S/o Tennessee Av S 3/12/2008 Kerwood Av S/o Tennessee Av N 3/13/2008 Kerwood Av S/o Tennessee Av S 3/13/2008 Kerwood Av S/o Tennessee Av E 4/29/2008 Kincardine Av At Bagley Av W 4/29/2008 Kincardine Av At Bagley Av N 6/12/2008 Kingman Av At Entrada Dr S 6/12/2008 Kingman Av At Entrada Dr E 2/12/2008 Kiowa Ave At Westgate Ave W 2/12/2008 Kiowa Ave At Westgate Ave
108 Static Highway Validation - Highway Links # Direction Count Date Location Model AM Model PM Count AM Count PM ALL Count AM ALL Count PM Delta AM Delta PM Delta/Count AM Delta/Count PM Max Dev AM Max Dev PM Within Dev AM Within Dev PM Dif Squared AM Dif Squared PM Pass AM? Pass PM? Total 161 E 1/31/2008 Kittyhawk Av (osage) W/o 76th St W 1/31/2008 Kittyhawk Av (osage) W/o 76th St N 10/18/2007 La Cienega Bl At Airdrome St 6,547 6,929 6,429 8,069 6,429 8, , YES YES 13,816 1,299, S 10/18/2007 La Cienega Bl At Airdrome St 4,600 9,210 4,356 7,400 4,356 7, , YES YES 59,424 3,275, N 5/10/2007 La Cienega Bl N/o Fairview Bl 6,885 10,440 8,770 9,965 8,770 9,965-1, YES YES 3,554, , S 5/10/2007 La Cienega Bl N/o Fairview Bl 7,416 11,169 7,669 10,678 7,669 10, YES YES 63, , N 5/16/2007 La Cienega Bl At Pico Bl 5,705 7,120 5,784 7,115 5,784 7, YES YES 6, S 5/16/2007 La Cienega Bl At Pico Bl 4,704 8,937 3,893 6,333 3,893 6, , YES NO 657,122 6,783, N 5/8/2008 La Cienega Bl At Venice Bl 6,526 7,307 5,312 5,197 5,312 5,197 1,214 2, YES NO 1,473,850 4,451, S 5/8/2008 La Cienega Bl At Venice Bl 5,998 10,993 4,109 6,305 4,109 6,305 1,889 4, NO NO 3,566,900 21,973, N 8/28/2008 La Cienega Bl S/o Venice Bl 7,264 7,774 5,510 5,546 5,510 5,546 1,754 2, NO NO 3,076,243 4,962, S 8/28/2008 La Cienega Bl S/o Venice Bl 4,978 10,944 3,525 6,974 3,525 6,974 1,453 3, NO NO 2,111,106 15,758, E 3/18/2008 La Grange Av At Glendon Av W 3/18/2008 La Grange Av At Glendon Av E 5/2/2007 Lake St W/o Penmar St W 5/2/2007 Lake St W/o Penmar St 704 1, E 2/26/2018 La Tijera Bl E/o Sepulveda Bl 1,241 2, W 2/26/2018 La Tijera Bl E/o Sepulveda Bl 1,504 2, E 4/3/2007 Levering And Kelton W 4/3/2007 Levering And Kelton E 5/15/2008 Levering St At Kelton Av 881 1, W 5/15/2008 Levering St At Kelton Av 696 2, N 5/8/2007 Lincoln Bl S/o Venice Bl 3,510 5, S 5/8/2007 Lincoln Bl S/o Venice Bl 4,075 7, N 4/15/2008 Lincoln Bl S/o Venice Bl 5,470 6, S 4/15/2008 Lincoln Bl S/o Venice Bl 4,023 6, E 4/11/2007 Little Santa Monica Bl At Prosser Av 845 1, YES YES 102, , W 4/11/2007 Little Santa Monica Bl At Prosser Av E 2/8/2007 Louise Av At Centinela Av W 2/8/2007 Louise Av At Centinela Av N 10/9/2008 Malcolm Av At Rochester Av S 10/9/2008 Malcolm Av At Rochester Av N 3/4/2008 Malcom Av S/o Tennessee Av S 3/4/2008 Malcom Av S/o Tennessee Av N 3/5/2008 Malcom Av S/o Tennessee Av S 3/5/2008 Malcom Av S/o Tennessee Av N 3/6/2008 Malcom Av S/o Tennessee Av S 3/6/2008 Malcom Av S/o Tennessee Av N 3/4/2008 Manning Av S/o Ayres Av 1,118 2, , NO NO 419,016 5,668, S 3/4/2008 Manning Av S/o Ayres Av 350 1, N 3/5/2008 Manning Av S/o Ayres Av S 3/5/2008 Manning Av S/o Ayres Av 333 1, N 3/6/2008 Manning Av S/o Ayres Av S 3/6/2008 Manning Av S/o Ayres Av 348 1, E 7/23/2008 Manchester Av At Gulana Av 1,206 1, W 7/23/2008 Manchester Av At Gulana Av 785 1, E 8/20/2008 Manchester Av At Hastings Av 580 1,039 1,041 1,386 1,041 1, YES YES 212, , W 8/20/2008 Manchester Av At Hastings Av 579 1, , , YES YES 17, , E 2/6/2007 Manning Av At Hilgard Av W 2/6/2007 Manning Av At Hilgard Av E 7/23/2008 Manchester Av At Lincoln Bl 1,494 1,605 1,357 1,601 1,357 1, YES YES 18, W 7/23/2008 Manchester Av At Lincoln Bl 2,412 3,676 2,594 3,273 2,594 3, YES YES 33, , N 7/23/2008 Manning Av At Missouri Av S 7/23/2008 Manning Av At Missouri Av E 8/20/2008 Manchester Av At Pershing Dr W 8/20/2008 Manchester Av At Pershing Dr ,474 1,520 1,474 1, NO YES 703, , N 3/4/2008 Manning Av S/o Tennessee Av S 3/4/2008 Manning Av S/o Tennessee Av N 3/5/2008 Manning Av S/o Tennessee Av S 3/5/2008 Manning Av S/o Tennessee Av N 3/6/2008 Manning Av S/o Tennessee Av S 3/6/2008 Manning Av S/o Tennessee Av N 8/16/2007 Manning Av At Wilkins Av S 8/16/2007 Manning Av At Wilkins Av E 10/14/2008 Massachusetts Av At Greenfield Av W 10/14/2008 Massachusetts Av At Greenfield Av E 6/18/2008 Massachusetts Av At Pontius Av W 6/18/2008 Massachusetts Av At Pontius Av N 4/1/2008 Mc Laughlin Av S/o Venice Bl 1,826 1,958 1,766 1,525 1,766 1, YES YES 3, , S 4/1/2008 Mc Laughlin Av S/o Venice Bl 1,143 2, , , NO YES 212, N 6/11/2008 Mesa Rd At Entrada Dr 852 1, S 6/11/2008 Mesa Rd At Entrada Dr 885 1, N 4/3/2007 Midvale Av At Mississippi Av S 4/3/2007 Midvale Av At Mississippi Av N 3/4/2008 Midvale Av S/o Tennessee Av S 3/4/2008 Midvale Av S/o Tennessee Av N 3/5/2008 Midvale Av S/o Tennessee Av S 3/5/2008 Midvale Av S/o Tennessee Av N 3/6/2008 Midvale Av S/o Tennessee Av S 3/6/2008 Midvale Av S/o Tennessee Av 13 68
109 Static Highway Validation - Highway Links # Direction Count Date Location Model AM Model PM Count AM Count PM ALL Count AM ALL Count PM Delta AM Delta PM Delta/Count AM Delta/Count PM Max Dev AM Max Dev PM Within Dev AM Within Dev PM Dif Squared AM Dif Squared PM Pass AM? Pass PM? Total 201 E 8/14/2008 Mindanao Wy At Redwood Av 1,418 2,478 1,122 1,964 1,122 1, YES YES 87, , W 8/14/2008 Mindanao Wy At Redwood Av 1,254 1, , , YES YES 177, , E 8/15/2007 Mississippi Av At Bentley Av W 8/15/2007 Mississippi Av At Bentley Av 509 1, E 12/9/2008 Missouri Av At Glendon Av W 12/9/2008 Missouri Av At Glendon Av E 7/22/2008 Missouri Av At Manning Av W 7/22/2008 Missouri Av At Manning Av E 4/3/2007 Mississippi Av At Midvale Av W 4/3/2007 Mississippi Av At Midvale Av E 3/4/2008 Monte Mar Dr E/o Beverwil Av W 3/4/2008 Monte Mar Dr E/o Beverwil Av E 3/5/2008 Monte Mar Dr E/o Beverwil Av W 3/5/2008 Monte Mar Dr E/o Beverwil Av E 3/6/2008 Monte Mar Dr E/o Beverwil Av W 3/6/2008 Monte Mar Dr E/o Beverwil Av E 3/2/2007 Montana Av E/o Sepulveda Bl 3,048 1, W 3/2/2007 Montana Av E/o Sepulveda Bl 749 2, N 3/29/2007 Moreno Dr S/o Santa Monica Bl YES NO 7, , S 3/29/2007 Moreno Dr S/o Santa Monica Bl NO YES 184, , N 9/2/2008 Motor Av S/o Wala Vista Road 2,204 1,895 1,548 1,761 1,548 1, YES YES 430,110 18, S 9/2/2008 Motor Av S/o Wala Vista Road 1,082 2, , , YES YES 10,353 38, E 3/27/2008 National Bl E/o Grandview Bl 1,849 3,337 1,849 2,595 1,849 2, YES YES 0 549, W 3/27/2008 National Bl E/o Grandview Bl 1,882 2,692 1,703 2,843 1,703 2, YES YES 31,909 22, E 9/2/2008 National Bl E/o Manning Av 3,535 5,026 3,284 4,444 3,284 4, YES YES 63, , W 9/2/2008 National Bl E/o Manning Av 3,174 4,346 3,383 4,235 3,383 4, YES YES 43,841 12, E 6/5/2007 National Bl W/o Overland Av 1,494 2,766 2,656 2,934 2,656 2,934-1, NO YES 1,350,622 28, W 6/5/2007 National Bl W/o Overland Av 1,916 2,056 1,228 2,347 1,228 2, NO YES 473,473 84, E 8/28/2008 National Bl E/o Robertson Bl 3,302 6,094 2,757 2,619 2,757 2, , YES NO 296,896 12,073, W 8/28/2008 National Bl E/o Robertson Bl 4,294 5,288 3,708 6,466 3,708 6, , YES YES 343,822 1,387, E 9/2/2008 National Bl At Sawtelle Av 3,061 4,577 2,199 3,885 2,199 3, YES YES 743, , W 9/2/2008 National Bl At Sawtelle Av 2,253 3,460 2,726 3,684 2,726 3, YES YES 223,739 49, E 3/1/2007 National Bl W/o Sepulveda Bl 3,205 4, W 3/1/2007 National Bl W/o Sepulveda Bl 3,528 6, E 2/21/2008 National Bl W/o Sepulveda Bl 2,575 3, W 2/21/2008 National Bl W/o Sepulveda Bl 2,540 4, N 5/1/2007 National Bl S/o Venice Bl 3,110 3,814 2,553 2,640 2,553 2, , YES NO 310,432 1,378, S 5/1/2007 National Bl S/o Venice Bl 3,038 5,573 2,214 4,003 2,214 4, , YES NO 678,349 2,465, E 10/18/2007 Nebraska Av At Armacost Av W 10/18/2007 Nebraska Av At Armacost Av E 12/30/2008 Northfield St At El Medio Av W 12/30/2008 Northfield St At El Medio Av N 10/9/2007 Oakhurst Dr At Alcott St S 10/9/2007 Oakhurst Dr At Alcott St N 5/8/2007 Ocean Av S/o Venice Bl 1,152 4, S 5/8/2007 Ocean Av S/o Venice Bl E 9/4/2007 Ohio Av At Camden Av 1,949 2,104 2,620 2,619 2,620 2, YES YES 449, , W 9/4/2007 Ohio Av At Camden Av 1,253 2,524 1,538 2,547 1,538 2, YES YES 81, E 2/28/2007 Ohio Av E/o Cotner Av 2,831 2, W 2/28/2007 Ohio Av E/o Cotner Av 2,015 3, E 2/12/2008 Ohio Av E/o Cotner Av 2,762 2, W 2/12/2008 Ohio Av E/o Cotner Av 1,709 2, E 10/9/2008 Ohio Av At Glendon Av 782 1, , , YES YES 28, , W 10/9/2008 Ohio Av At Glendon Av 1,053 1, YES YES 25,497 43, E 8/15/2007 Ohio Av At Greenfield Av 2,169 2,299 2,441 2,728 2,441 2, YES YES 73, , W 8/15/2007 Ohio Av At Greenfield Av 1,559 2,988 1,495 2,589 1,495 2, YES YES 4, , E 9/5/2007 Olympic Bl At Bundy Dr 4,151 6,734 2,919 6,339 2,919 6,339 1, NO YES 1,518, , W 9/5/2007 Olympic Bl At Bundy Dr 3,895 6,424 4,513 6,139 4,513 6, YES YES 382,476 81, E 3/1/2007 Olympic Bl W/o Cotner Av 6,178 9, W 3/1/2007 Olympic Bl W/o Cotner Av 5,445 8, E 2/12/2008 Olympic Bl W/o Cotner Av 5,617 8, W 2/12/2008 Olympic Bl W/o Cotner Av 5,294 8, E 4/23/2008 Olympic Bl E/o La Cienega Bl 4,151 9,073 3,068 7,220 3,068 7,220 1,083 1, NO YES 1,172,238 3,434, W 4/23/2008 Olympic Bl E/o La Cienega Bl 6,033 6,167 5,674 4,749 5,674 4, , YES YES 128,733 2,010, E 4/17/2007 Olympic Bl At Overland Av 5,949 7,654 6,897 7,813 6,897 7, YES YES 899,166 25, W 4/17/2007 Olympic Bl At Overland Av 4,922 11,326 6,026 10,097 6,026 10,097-1,104 1, YES YES 1,218,989 1,510, N 1/31/2008 Osage Av (kittyhawk) At 76th St 725 1,220 1, , YES YES 120, , S 1/31/2008 Osage Av (kittyhawk) At 76th St N 8/30/2007 Overland Av At Charnock Rd 3,510 3,900 4,321 5,329 4,321 5, , YES YES 657,414 2,042, S 8/30/2007 Overland Av At Charnock Rd 2,410 4,785 2,203 6,106 2,203 6, , YES YES 43,004 1,745, N 4/17/2007 Overland Av N/o Olympic Bl 1,276 1, , , YES YES 155, S 4/17/2007 Overland Av N/o Olympic Bl 687 1, N 3/4/2008 Overland Av S/o Tennessee Av 1,382 1,583 1,651 2,581 1,683 2, YES YES 72, , S 3/4/2008 Overland Av S/o Tennessee Av 1,041 2,001 1,372 2,973 1,304 3, YES YES 109, , N 3/5/2008 Overland Av S/o Tennessee Av 1,615 2, S 3/5/2008 Overland Av S/o Tennessee Av 1,398 2, N 3/6/2008 Overland Av S/o Tennessee Av 1,656 2, S 3/6/2008 Overland Av S/o Tennessee Av 1,414 2, N 6/11/2008 Pacific Coast Hwy At Entrada Dr 7,356 12,514 5,922 11,495 14,468 23,300 1,434 1, YES YES 2,056,702 1,037, S 6/11/2008 Pacific Coast Hwy At Entrada Dr 9,812 11,512 9,519 9,138 20,995 21, , YES NO 85,786 5,638,
110 Static Highway Validation - Highway Links # Direction Count Date Location Model AM Model PM Count AM Count PM ALL Count AM ALL Count PM Delta AM Delta PM Delta/Count AM Delta/Count PM Max Dev AM Max Dev PM Within Dev AM Within Dev PM Dif Squared AM Dif Squared PM Pass AM? Pass PM? Total 241 N 10/14/2008 Pacific Av At Spinnaker St S 10/14/2008 Pacific Av At Spinnaker St , , YES YES 24,132 63, N 5/8/2007 Pacific Av S/o Venice Bl 2,282 2, S 5/8/2007 Pacific Av S/o Venice Bl 1,496 3, E 1/18/2007 Palms Bl At Abbot Kinney Bl W 1/18/2007 Palms Bl At Abbot Kinney Bl E 9/4/2007 Palms Bl At Beethoven St 1,341 1,686 1,015 1,340 1,015 1, YES YES 106, , W 9/4/2007 Palms Bl At Beethoven St 1,306 2,504 1,238 2,163 1,238 2, YES YES 4, , E 11/13/2008 Palms Dr At Centinela Av 1,523 2, W 11/13/2008 Palms Dr At Centinela Av 1,855 2, E 3/27/2008 Palms Bl At Grandview Bl 2,429 2,560 1,127 2,045 1,127 2,045 1, NO YES 1,695, , W 3/27/2008 Palms Bl At Grandview Bl 1,366 2,980 1,178 2,003 1,178 2, YES NO 35, , E 1/10/2007 Palms Bl At Inglewood Bl 2,034 2,224 1,151 2,040 1,151 2, NO YES 779,079 34, W 1/10/2007 Palms Bl At Inglewood Bl 1,290 2,721 1,230 2,412 1,230 2, YES YES 3,602 95, E 5/2/2007 Palm Bl W/o Penmar Av NO YES 90,491 89, W 5/2/2007 Palm Bl W/o Penmar Av E 2/19/2008 Palms Bl W/o Sepulveda Bl 2,640 4, W 2/19/2008 Palms Bl W/o Sepulveda Bl 2,463 3, N 3/4/2008 Patricia Av S/o Ayres Av YES YES 2,531 16, S 3/4/2008 Patricia Av S/o Ayres Av 387 1, N 3/5/2008 Patricia Av S/o Ayres Av S 3/5/2008 Patricia Av S/o Ayres Av 345 1, N 3/6/2008 Patricia Av S/o Ayres Av S 3/6/2008 Patricia Av S/o Ayres Av 354 1, N 10/9/2007 Patricia Av At Tennessee Av S 10/9/2007 Patricia Av At Tennessee Av N 3/18/2008 Patricia Av S/o Tennessee Av S 3/18/2008 Patricia Av S/o Tennessee Av N 3/19/2008 Patricia Av S/o Tennessee Av S 3/19/2008 Patricia Av S/o Tennessee Av N 3/20/2008 Patricia Av S/o Tennessee Av S 3/20/2008 Patricia Av S/o Tennessee Av N 2/5/2007 Penmar Av At Rose Av NO NO 131, , S 2/5/2007 Penmar Av At Rose Av E 6/5/2007 Pico Bl At Bundy Dr 2,937 4,672 2,692 4,993 2,692 4, YES YES 60, , W 6/5/2007 Pico Bl At Bundy Dr 2,564 3,838 2,544 3,944 2,544 3, YES YES , E 3/1/2007 Pico Bl W/o Cotner Av 5,254 7, W 3/1/2007 Pico Bl W/o Cotner Av 3,305 6, E 2/21/2008 Pico Bl W/o Cotner Av 5,384 7, W 2/21/2008 Pico Bl W/o Cotner Av 3,554 6, E 5/16/2007 Pico Bl At La Cienega Bl 2,687 5,947 2,520 5,090 2,520 5, YES YES 27, , W 5/16/2007 Pico Bl At La Cienega Bl 5,966 4,239 4,379 3,392 4,379 3,392 1, NO YES 2,517, , E 4/23/2008 Pico Bl E/o La Cienega Bl 2,128 4,907 1,897 4,825 1,897 4, YES YES 53,486 6, W 4/23/2008 Pico Bl E/o La Cienega Bl 3,573 3,339 4,927 3,495 4,927 3,495-1, YES YES 1,833,210 24, E 5/16/2007 Pico Bl At Robertson Bl 2,380 6,177 2,468 5,475 2,468 5, YES YES 7, , W 5/16/2007 Pico Bl At Robertson Bl 6,714 4,058 4,757 3,680 4,757 3,680 1, NO YES 3,829, , E 6/21/2007 Pico Bl At Sawtelle Bl 3,901 7, W 6/21/2007 Pico Bl At Sawtelle Bl 3,349 6, E 6/5/2007 Pico Bl At Sepulveda Bl 4,885 6,901 4,021 5,334 4,021 5, , YES YES 747,018 2,454, W 6/5/2007 Pico Bl At Sepulveda Bl 3,853 6, N 6/18/2008 Pontius Av At Massachusetts Av S 6/18/2008 Pontius Av At Massachusetts Av 2,197 1, N 10/11/2007 Preuss Rd At Airdrome St S 10/11/2007 Preuss Rd At Airdrome St N 4/11/2007 Prosser Av At Little Santa Monica Bl S 4/11/2007 Prosser Av At Little Santa Monica Bl N 3/4/2008 Prosser Av S/o Tennessee Av S 3/4/2008 Prosser Av S/o Tennessee Av N 3/5/2008 Prosser Av S/o Tennessee Av S 3/5/2008 Prosser Av S/o Tennessee Av N 3/6/2008 Prosser Av S/o Tennessee Av S 3/6/2008 Prosser Av S/o Tennessee Av N 6/20/2007 Radcliffe Av At Haverford Av S 6/20/2007 Radcliffe Av At Haverford Av N 6/20/2007 Radcliffe Av At Mount Holyoke Av S 6/20/2007 Radcliffe Av At Mount Holyoke Av N 8/14/2008 Redwood Av At Mindanao Wy S 8/14/2008 Redwood Av At Mindanao Wy N 10/17/2007 Rexford Dr At Alcott St S 10/17/2007 Rexford Dr At Alcott St E 1/18/2007 Rialto Av At Abbot Kinney Bl W 1/18/2007 Rialto Av At Abbot Kinney Bl N 3/12/2008 Robertson Bl At 3rd St 1,538 2,341 2,038 2,823 2,038 2, YES YES 250, , S 3/12/2008 Robertson Bl At 3rd St 1,563 2,219 2,025 3,219 2,025 3, , YES YES 213,407 1,000, N 10/2/2007 Robertson Bl At Airdrome St 4,269 4,564 4,134 5,461 4,134 5, YES YES 18, , S 10/2/2007 Robertson Bl At Airdrome St 2,805 6,001 3,362 5,230 3,362 5, YES YES 310, , N 10/2/2007 Robertson Bl At Cashio St 3,603 3,472 3,739 5,049 3,739 5, , YES YES 18,461 2,487, S 10/2/2007 Robertson Bl At Cashio St 1,961 4,777 2,910 4,651 2,910 4, YES YES 900,081 15, N 5/16/2007 Robertson Bl At Pico Bl 3,706 3,649 3,896 5,156 3,896 5, , YES YES 35,977 2,269, S 5/16/2007 Robertson Bl At Pico Bl 2,752 5,471 2,065 3,124 2,065 3, , YES NO 471,909 5,507,
111 Static Highway Validation - Highway Links # Direction Count Date Location Model AM Model PM Count AM Count PM ALL Count AM ALL Count PM Delta AM Delta PM Delta/Count AM Delta/Count PM Max Dev AM Max Dev PM Within Dev AM Within Dev PM Dif Squared AM Dif Squared PM Pass AM? Pass PM? Total 281 N 5/1/2007 Robertson Bl S/o Venice Bl 3,156 4,012 1,375 1,765 1,375 1,765 1,781 2, NO NO 3,170,968 5,051, S 5/1/2007 Robertson Bl S/o Venice Bl 820 1,857 1,185 1,825 1,185 1, YES YES 133,137 1, N 8/28/2008 Robertson Bl S/o Venice Bl 1,396 1, S 8/28/2008 Robertson Bl S/o Venice Bl 1,460 1, E 9/16/2008 Rochester Av At Barry Av W 9/16/2008 Rochester Av At Barry Av E 9/5/2007 Rochester Av At Bundy Dr W 9/5/2007 Rochester Av At Bundy Dr N Corrupt 285 S Corrupt 286 E 10/4/2007 Rochester Av At Club View Dr W 10/4/2007 Rochester Av At Club View Dr E 11/12/2008 Rochester Av At Malcolm Av W 11/12/2008 Rochester Av At Malcolm Av E 2/5/2007 Rose Av At Penmar Av 1,033 1,844 1,012 2,148 1,012 2, YES YES , W 2/5/2007 Rose Av At Penmar Av 1,260 1,619 1,081 1,449 1,081 1, YES YES 31,865 28, E 5/2/2007 Rose Av At Sunset Av 738 1, , , YES YES 60,114 57, W 5/2/2007 Rose Av At Sunset Av 1,335 1,163 1,272 1,315 1,272 1, YES YES 4,029 23, N 3/11/2008 Roxbury Dr S/o Vidor Dr , , YES YES 4, , S 3/11/2008 Roxbury Dr S/o Vidor Dr 545 1, , , YES YES 49, , N 3/12/2008 Roxbury Dr S/o Vidor Dr S 3/12/2008 Roxbury Dr S/o Vidor Dr 748 1, N 3/13/2008 Roxbury Dr S/o Vidor Dr S 3/13/2008 Roxbury Dr S/o Vidor Dr 732 1, E 3/1/2007 Santa Monica Bl E/o Cotner Av 6,685 7, W 3/1/2007 Santa Monica Bl E/o Cotner Av 4,915 7, E 2/12/2008 Santa Monica Bl E/o Cotner Av 6,549 7,437 6,360 7,855 6,360 7, YES YES 35, , W 2/12/2008 Santa Monica Bl E/o Cotner Av 4,949 9,116 5,281 7,997 5,281 7, , YES YES 110,456 1,251, E 4/23/2008 San Vicente Bl E/o La Cienega Bl 4,206 7,965 5,139 7,385 1,875 4, YES YES 870, , W 4/23/2008 San Vicente Bl E/o La Cienega Bl 4,828 6,343 2,901 3,167 1,347 1,292 1,927 3, NO NO 3,714,483 10,086, E 8/26/2008 San Vicente Bl E/o La Cienega Bl 1,477 4, W 8/26/2008 San Vicente Bl E/o La Cienega Bl 2,098 2, N 10/14/2008 San Diego Fw Nb Off Ramp Nr Montana Av 2,087 1,720 1, , NO NO 768,504 1,209, S 10/14/2008 San Diego Fw Nb Off Ramp Nr Montana Av N 10/15/2008 San Diego Fw Nb Off Ramp Nr Montana Av 1, S 10/15/2008 San Diego Fw Nb Off Ramp Nr Montana Av N 10/16/2008 San Diego Fw Nb Off Ramp Nr Montana Av 1, S 10/16/2008 San Diego Fw Nb Off Ramp Nr Montana Av E 10/18/2007 Sawyer St E/o Corning St W 10/18/2007 Sawyer St E/o Corning St E 10/18/2007 Sawyer St At Holt Av W 10/18/2007 Sawyer St At Holt Av N 6/6/2007 Sawtelle Bl At Pico Bl 3,958 2,986 3,358 3,443 3,358 3, YES YES 360, , S 6/6/2007 Sawtelle Bl At Pico Bl 1,788 5,833 2,303 6,533 2,303 6, YES YES 265, , N 7/24/2008 Sawtelle Bl S/o Pico Bl 3,958 2,986 4,156 3,997 4,156 3, , YES YES 39,136 1,021, S 7/24/2008 Sawtelle Bl S/o Pico Bl 1,788 5,833 1,676 6,781 1,676 6, YES YES 12, , N 5/9/2007 Sawtelle Bl S/o Utopia Av 1,775 1, S 5/9/2007 Sawtelle Bl S/o Utopia Av 1,026 2, N 7/17/2008 Sawtelle Bl S/o Utopia Av 1,120 1,648 1,017 1,393 1,017 1, YES YES 10,520 65, S 7/17/2008 Sawtelle Bl S/o Utopia Av 1,275 2, , , YES YES 140,134 86, N 4/15/2008 Sawtelle Bl S/o Venice Bl 2,210 2, S 4/15/2008 Sawtelle Bl S/o Venice Bl 2,203 3, N 8/14/2008 Sepulveda Bl N/o Century Fwy 7,822 10,759 10,952 14,177 10,952 14,177-3,130-3, NO NO 9,798,696 11,681, S 8/14/2008 Sepulveda Bl N/o Century Fwy 5,959 8,729 8,031 15,021 8,031 15,021-2,072-6, NO NO 4,294,451 39,587, N 8/14/2008 Sepulveda Bl At Lincoln Bl 8,461 13, S 8/14/2008 Sepulveda Bl At Lincoln Bl 4,065 7, N 5/9/2007 Sepulveda Bl S/o Lucerne Av 3,343 4,550 4,038 4,638 4,038 4, YES YES 482,375 7, S 5/9/2007 Sepulveda Bl S/o Lucerne Av 2,674 4,643 1,740 4,258 1,740 4, NO YES 872, , N 7/17/2008 Sepulveda Bl S/o Lucerne Av 2,940 4, S 7/17/2008 Sepulveda Bl S/o Lucerne Av 1,376 3, N 6/5/2007 Sepulveda Bl At Pico Bl 4,790 5, S 6/5/2007 Sepulveda Bl At Pico Bl 7,724 8, N 6/5/2007 Sepulveda Bl S/o Richland Av 4,523 4,237 4,663 5,067 4,663 5, YES YES 19, , S 6/5/2007 Sepulveda Bl S/o Richland Av 2,648 6,355 1,972 6,347 1,972 6, YES YES 457, N 4/15/2008 Sepulveda Bl S/o Venice Bl 4,438 5,317 3,587 5,737 3,587 5, YES YES 724, , S 4/15/2008 Sepulveda Bl S/o Venice Bl 3,306 5,855 2,727 4,010 2,727 4, , YES NO 334,848 3,405, N 2/27/2008 Sepulveda East Wy S/o Westchester P 586 1, , , YES YES 124,159 7, S 2/27/2008 Sepulveda East Wy S/o Westchester P N 3/11/2008 Sherbourne Dr N/o Cashio St S 3/11/2008 Sherbourne Dr N/o Cashio St N 3/12/2008 Sherbourne Dr N/o Cashio St S 3/12/2008 Sherbourne Dr N/o Cashio St N 3/13/2008 Sherbourne Dr N/o Cashio St S 3/13/2008 Sherbourne Dr N/o Cashio St N 10/17/2007 Shenandoah St At Chalmers Dr S 10/17/2007 Shenandoah St At Chalmers Dr N 3/4/2008 Sherborne Dr S/o Whitworth Dr S 3/4/2008 Sherborne Dr S/o Whitworth Dr 354 1, N 3/5/2008 Sherborne Dr S/o Whitworth Dr S 3/5/2008 Sherborne Dr S/o Whitworth Dr 350 1,019
112 Static Highway Validation - Highway Links # Direction Count Date Location Model AM Model PM Count AM Count PM ALL Count AM ALL Count PM Delta AM Delta PM Delta/Count AM Delta/Count PM Max Dev AM Max Dev PM Within Dev AM Within Dev PM Dif Squared AM Dif Squared PM Pass AM? Pass PM? Total 321 N 3/6/2008 Sherborne Dr S/o Whitworth Dr S 3/6/2008 Sherborne Dr S/o Whitworth Dr N 5/2/2007 Sunset Av At Rose Av S 5/2/2007 Sunset Av At Rose Av N 10/23/2007 Temescal Cyn Rd N/o Pacific Coast Hw 1,223 1,745 2,001 1,964 2,001 1, YES YES 605,913 47, S 10/23/2007 Temescal Cyn Rd N/o Pacific Coast Hw 1,739 2,295 2,040 2,109 2,040 2, YES YES 90,339 34, N 10/23/2007 Temescal Cyn Rd S/o Sunset Bl 1,513 1, S 10/23/2007 Temescal Cyn Rd S/o Sunset Bl 1,471 1, E 1/2/2007 Tennessee Av At Bentley Av W 1/2/2007 Tennessee Av At Bentley Av E 1/2/2007 Tennessee Av At Camden Av W 1/2/2007 Tennessee Av At Camden Av E 10/9/2007 Tennessee Av At Patricia Av W 10/9/2007 Tennessee Av At Patricia Av E 1/2/2007 Texas Av At Amherst Av W 1/2/2007 Texas Av At Amherst Av YES YES 12,036 13, N 7/1/2008 Truxton Av At 83rd St S 7/1/2008 Truxton Av At 83rd St E 4/16/2008 Venice Bl E/o La Cienega Bl 5,956 8,669 3,976 6,638 3,976 6,638 1,980 2, NO NO 3,922,284 4,126, W 4/16/2008 Venice Bl E/o La Cienega Bl 4,659 7,186 4,973 5,121 4,973 5, , YES NO 98,518 4,262, E 5/8/2008 Venice Bl At La Cienega Bl 5,646 9,490 4,865 8,079 4,865 8, , YES YES 609,428 1,990, W 5/8/2008 Venice Bl At La Cienega Bl 6,058 8,326 5,299 5,293 5,299 5, , YES NO 575,333 9,197, E 2/19/2008 Venice Bl E/o Sepulveda Bl 4,564 7, W 2/19/2008 Venice Bl E/o Sepulveda Bl 5,879 6, N 3/4/2008 Veteran Av S/o Ayres Av S 3/4/2008 Veteran Av S/o Ayres Av N 3/5/2008 Veteran Av S/o Ayres Av S 3/5/2008 Veteran Av S/o Ayres Av N 3/6/2008 Veteran Av S/o Ayres Av S 3/6/2008 Veteran Av S/o Ayres Av N 10/15/2008 Veteran Av At Levering Av 817 2, S 10/15/2008 Veteran Av At Levering Av 1,312 1, N 10/15/2008 Veteran Av At Santa Monica Bl 1,488 1,630 1,149 1,338 1,149 1, YES YES 115,258 85, S 10/15/2008 Veteran Av At Santa Monica Bl 952 2, , , YES YES , N 3/4/2008 Veteran Av S/o Tenessee Av 1, NO YES 409,573 52, S 3/4/2008 Veteran Av S/o Tenessee Av 292 1, N 3/5/2008 Veteran Av S/o Tenessee Av S 3/5/2008 Veteran Av S/o Tenessee Av 279 1, N 3/6/2008 Veteran Av S/o Tenessee Av S 3/6/2008 Veteran Av S/o Tenessee Av 323 1, N 10/15/2008 Veteran Av At Wilshire Bl 2,493 3,853 2,331 3,568 2,331 3, YES YES 26,146 81, S 10/15/2008 Veteran Av At Wilshire Bl 2,128 3,480 2,493 5,866 2,493 5, , YES NO 132,991 5,694, N 2/8/2007 Via Dolce Av S/o Washington Bl YES YES 87,675 7, S 2/8/2007 Via Dolce Av S/o Washington Bl N 8/20/2008 Vista Del Mar Bl At Waterview St 2,520 3,783 2,941 2,081 2,941 2, , YES NO 177,557 2,895, S 8/20/2008 Vista Del Mar Bl At Waterview St 2,597 3,959 1,087 3,677 1,087 3,677 1, NO YES 2,278,734 79, N 7/2/2008 Walgrove Av At Dewey St 9,973 6, S 7/2/2008 Walgrove Av At Dewey St 2,969 13, N 7/31/2007 Walgrove Av At Palms Bl 1,260 1,731 2,079 2,011 2,079 2, YES YES 671,434 78, S 7/31/2007 Walgrove Av At Palms Bl 1,014 1, , , , YES NO 999 2,101, N 7/31/2007 Walgrove Av At Rose Av 2,094 2,374 2,128 1,814 2,128 1, YES YES 1, , S 7/31/2007 Walgrove Av At Rose Av 1,622 3,157 1,189 4,215 1,189 4, , YES YES 187,090 1,118, N 4/15/2008 Walgrove Av S/o Venice Bl 1,601 1, S 4/15/2008 Walgrove Av S/o Venice Bl 723 2, N 7/31/2007 Walgrove Av At Victoria Av 1,417 2,074 1,948 1,955 1,948 1, YES YES 281,468 14, S 7/31/2007 Walgrove Av At Victoria Av 1,195 1,853 1,123 3,018 1,123 3, , YES YES 5,144 1,357, N 6/5/2007 Westwood Bl S/o Coventry Pl 3,767 2,658 2,412 2,567 2,412 2,567 1, NO YES 1,835,367 8, S 6/5/2007 Westwood Bl S/o Coventry Pl 2,007 5,820 1,467 4,600 1,467 4, , YES YES 292,131 1,488, N 5/1/2008 Westgate Av At Dorothy Av 824 1, S 5/1/2008 Westgate Av At Dorothy Av N 2/12/2008 Westgate Av At Kiowa Ave S 2/12/2008 Westgate Av At Kiowa Ave N 9/16/2008 Westgate Av At Kiowa Av S 9/16/2008 Westgate Av At Kiowa Av E 8/14/2008 Westchester Pkwy E/o Sepulveda Bl 896 1, W 8/14/2008 Westchester Pkwy E/o Sepulveda Bl 1,411 2, E 7/5/2007 Whitworth Dr At Wooster St W 7/5/2007 Whitworth Dr At Wooster St E 1/16/2008 Wilshire Bl At Barrington Ave 4,414 7,091 4,005 4,328 4,005 4, , YES NO 167,418 7,633, W 1/16/2008 Wilshire Bl At Barrington Ave 4,845 6,785 4,948 6,650 4,948 6, YES YES 10,616 18, E 7/11/2007 Wilshire Bl At Bundy Dr 3,450 5, W 7/11/2007 Wilshire Bl At Bundy Dr 4,324 6, E 1/17/2008 Wilshire Bl At Bundy Dr 4,150 6,230 3,637 5,198 3,637 5, , YES YES 262,668 1,064, W 1/17/2008 Wilshire Bl At Bundy Dr 4,549 6,777 4,364 6,250 4,364 6, YES YES 34, , E 7/10/2007 Wilshire Bl At Centinela Av 3,739 5,660 3,552 5,577 3,552 5, YES YES 34,961 6, W 7/10/2007 Wilshire Bl At Centinela Av 3,651 5,685 4,026 6,096 4,026 6, YES YES 140, , E 11/15/2007 Wilshire Bl At Federal Av 4,510 7,217 4,405 4,112 4,405 4, , YES NO 10,974 9,643, W 11/15/2007 Wilshire Bl At Federal Av 5,928 8,379 8,384 10,030 8,384 10,030-2,456-1, NO YES 6,030,989 2,724, E 8/16/2015 Wilkins Av At Manning Av W 8/16/2015 Wilkins Av At Manning Av
113 Static Highway Validation - Highway Links # Direction Count Date Location Model AM Model PM Count AM Count PM ALL Count AM ALL Count PM Delta AM Delta PM Delta/Count AM Delta/Count PM Max Dev AM Max Dev PM Within Dev AM Within Dev PM Dif Squared AM Dif Squared PM Pass AM? Pass PM? Total 361 E 2/28/2007 Wilshire Bl W/o Veteran Av 12,047 11, W 2/28/2007 Wilshire Bl W/o Veteran Av 5,227 4, N 7/5/2007 Wooster St At Whitworth Dr S 7/5/2007 Wooster St At Whitworth Dr N 1/8/2009 Century Park East At Galaxy Wy 3,228 1,884 3,128 1,315 3,128 1, YES YES 9, , S 1/8/2009 Century Park East At Galaxy Wy 696 3, , , YES YES 30, , E 1/8/2009 Galaxy Wy At Century Park East W 1/8/2009 Galaxy Wy At Century Park East E 1/8/2009 Missouri Av At Selby Av W 1/8/2009 Missouri Av At Selby Av N 1/8/2009 Selby Av At Missouri Av S 1/8/2009 Selby Av At Missouri Av N 1/15/2009 Armacost Av At Idaho Av S 1/15/2009 Armacost Av At Idaho Av N 1/15/2009 Fordham Av At 80th Street S 1/15/2009 Fordham Av At 80th Street N 1/22/2009 Sepulveda Bl At Howard Hughes Pkwy 6,959 9,363 10,753 8,542 10,753 8,542-3, NO YES 14,396, , S 1/22/2009 Sepulveda Bl At Howard Hughes Pkwy 6,030 10,280 2,780 7,792 2,780 7,792 3,250 2, NO NO 10,560,149 6,190, E 2/12/2009 La Tijera Bl E/o Sepulveda Bl 1,449 2,592 1,087 2,430 1,087 2, YES YES 130,806 26, W 2/12/2009 La Tijera Bl E/o Sepulveda Bl 1,897 2,492 1,810 2,801 1,810 2, YES YES 7,503 95, N 2/12/2009 Sepulveda Eastway S/o Westchester Pkwy 608 1,136 1,164 1,657 1,164 1, YES YES 309, , S 2/12/2009 Sepulveda Eastway S/o Westchester Pkwy E 2/12/2009 Westchester Pkwy E/o Sepulveda Bl 1,650 1, , , NO YES 529,257 3, W 2/12/2009 Westchester Pkwy E/o Sepulveda Bl 1,857 3,569 1,948 2,805 1,948 2, YES YES 8, , N 1/13/2009 Butler Av At Olympic Bl S 1/13/2009 Butler Av At Olympic Bl N 1/13/2009 Butler Av At Tenessee Av S 1/13/2009 Butler Av At Tenessee Av E 1/13/2009 La Grange Av At Sawtelle Bl , , YES NO 75, , W 1/13/2009 La Grange Av At Sawtelle Bl N 1/13/2009 Sawtelle Bl At La Grange Av 1,264 1,756 1,515 2,045 1,515 2, YES YES 62,950 83, S 1/13/2009 Sawtelle Bl At La Grange Av 1,158 1,791 1,726 3,021 1,726 3, , YES YES 322,305 1,513, N 1/27/2009 Sepulveda Bl At Manchester Av 4,554 6,959 4,361 5,027 4,361 5, , YES NO 37,149 3,733, S 1/27/2009 Sepulveda Bl At Manchester Av 4,996 7,152 3,481 5,870 3,481 5,870 1,515 1, NO YES 2,294,578 1,644, N 1/27/2009 Veteran Av At Ohio Av 1,686 1,636 1,146 1,624 1,146 1, YES YES 291, S 1/27/2009 Veteran Av At Ohio Av 888 2, , , YES YES , N 1/27/2009 Veteran Av At Olympic Bl 1,336 1, NO YES 251,477 90, S 1/27/2009 Veteran Av At Olympic Bl 845 1, , , YES YES 31, N 1/27/2009 Veteran Av At Strathmore Dr 2,480 3,793 1,122 3,472 1,122 3,472 1, NO YES 1,843, , S 1/27/2009 Veteran Av At Strathmore Dr 2,066 3,454 2,531 1,884 2,531 1, , YES NO 216,170 2,463, E 2/10/2009 National Bl W/o Sepulveda Bl 3,707 4,793 3,341 3,945 3,341 3, YES YES 133, , W 2/10/2009 National Bl W/o Sepulveda Bl 3,017 4,778 2,978 4,192 2,978 4, YES YES 1, , E 2/10/2009 Palms Bl W/o Sepulveda Bl 3,653 4,670 2,613 5,295 2,613 5,295 1, NO YES 1,080, , W 2/10/2009 Palms Bl W/o Sepulveda Bl 2,942 5,240 2,678 3,881 2,678 3, , YES YES 69,539 1,847, E 2/10/2009 Pico Bl W/o Cotner Av 5,979 8,044 5,706 7,130 5,706 7, YES YES 74, , W 2/10/2009 Pico Bl W/o Cotner Av 3,770 7,580 3,801 6,735 3,801 6, YES YES , E 2/10/2009 Santa Monica Bl E/o Cotner Av 6,391 7,598 6,663 8,239 6,663 8, YES YES 73, , W 2/10/2009 Santa Monica Bl E/o Cotner Av 5,052 8,740 5,044 7,521 5,044 7, , YES YES 69 1,486, E 2/24/2009 Tennessee Av W/o Overland Av W 2/24/2009 Tennessee Av W/o Overland Av N 3/24/2009 Century Park West S/o Santa Monica Bl 1,298 2, , , NO YES 295,256 9, S 3/24/2009 Century Park West S/o Santa Monica Bl 1,547 1,718 1,559 1,180 1,559 1, YES YES , E 3/24/2009 Santa Monica Bl At Century Park West 6,207 6, W 3/24/2009 Santa Monica Bl At Century Park West 5,011 8,452 5,361 9,210 5,361 9, YES YES 122, , E 3/24/2009 Short Av W/o Centinela Av 1,116 1,614 1,186 1,652 1,186 1, YES YES 4,855 1, W 3/24/2009 Short Av W/o Centinela Av 1,053 1, , , YES YES 35, , E 3/24/2009 Short Av At Mcconnell Av 1,154 1, , , YES YES 74,029 2, W 3/24/2009 Short Av At Mcconnell Av 1,042 1, , , YES YES 12, , E 1/7/ th St At Fordham Av W 1/7/ th St At Fordham Av E 1/7/2009 Idaho Av At Armacost Av 373 1, , , YES YES 2, , W 1/7/2009 Idaho Av At Armacost Av YES YES 11,068 10, N 1/14/2009 Butler Av At Nebraska Av S 1/14/2009 Butler Av At Nebraska Av E 1/14/2009 Iowa Av At Sawtelle Bl 488 1, W 1/14/2009 Iowa Av At Sawtelle Bl E 1/14/2009 Nebraska Av At Butler Av W 1/14/2009 Nebraska Av At Butler Av N 1/14/2009 Sawtelle Bl At Iowa Av 1,516 2,112 1,340 2,206 1,340 2, YES YES 30,999 8, S 1/14/2009 Sawtelle Bl At Iowa Av 1,172 2, , , NO YES 196, , E 1/14/2009 Tenessee Av At Butler Av 145 1, W 1/14/2009 Tenessee Av At Butler Av 1, N 1/21/2009 Sepulveda Bl At 77 Th St 6,512 6, S 1/21/2009 Sepulveda Bl At 77 Th St 3,688 8, N 1/21/2009 Sepulveda Bl At La Tijera Bl 4,554 6,959 4,341 5,101 4,341 5, , YES NO 45,259 3,453, S 1/21/2009 Sepulveda Bl At La Tijera Bl 4,996 7,152 3,546 5,830 3,546 5,830 1,450 1, NO YES 2,101,881 1,748, N 1/28/2009 Veteran Av At Montana Av 646 2, , , YES YES 73, , S 1/28/2009 Veteran Av At Montana Av 1, ,289 2,330 2,289 2, , YES NO 559,629 2,053, N 1/28/2009 Veteran Av S/o Sunset Av 646 2,049 1,216 3,043 1,216 3, YES YES 325, , S 1/28/2009 Veteran Av S/o Sunset Av 1, ,479 1,476 1,479 1, YES YES 3, ,
114 Static Highway Validation - Highway Links # Direction Count Date Location Model AM Model PM Count AM Count PM ALL Count AM ALL Count PM Delta AM Delta PM Delta/Count AM Delta/Count PM Max Dev AM Max Dev PM Within Dev AM Within Dev PM Dif Squared AM Dif Squared PM Pass AM? Pass PM? Total 401 E 2/4/2009 Montana Av E/o Sepulveda Bl 2,707 2,240 3,283 1,948 3,283 1, YES YES 331,225 85, W 2/4/2009 Montana Av E/o Sepulveda Bl 916 2, , , YES YES 6, , E 2/4/2009 Ohio Av E/o Cotner Av 1,937 2,424 2,712 2,911 2,712 2, YES YES 600, , W 2/4/2009 Ohio Av E/o Cotner Av 1,702 3,073 2,242 3,185 2,242 3, YES YES 291,662 12, E 2/4/2009 Olympic Bl W/o Cotner Av 6,148 9,799 5,437 8,928 5,437 8, YES YES 506, , W 2/4/2009 Olympic Bl W/o Cotner Av 5,097 8,703 6,348 9,248 6,348 9,248-1, YES YES 1,564, , N 2/4/2009 Westwood Bl At Holman Av 3,387 4, S 2/4/2009 Westwood Bl At Holman Av 1,951 5, E 2/4/2009 Wilshire Bl W/o Veteran Av 11,798 10,302 13,254 12,850 13,254 12,850-1,456-2, YES YES 2,121,390 6,490, W 2/4/2009 Wilshire Bl W/o Veteran Av 5,632 15,149 9,107 15,092 9,107 15,092-3, NO YES 12,077,507 3, E 2/11/2009 Centinela Av E/o Sepulveda Bl 2,431 4,786 1,562 3,746 1,562 3, , NO YES 755,395 1,081, W 2/11/2009 Centinela Av E/o Sepulveda Bl 3,191 3,818 4,173 3,747 4,173 3, YES YES 964,242 5, E 2/11/2009 Jefferson Bl E/o San Diego Fwy 3,954 5,169 2,782 4,924 2,782 4,924 1, NO YES 1,373,323 60, W 2/11/2009 Jefferson Bl E/o San Diego Fwy 4,084 6,025 4,279 5,494 4,279 5, YES YES 38, , E 2/11/2009 Manchester Av E/o Sepulveda Bl 2,028 4, W 2/11/2009 Manchester Av E/o Sepulveda Bl 3,401 2, E 2/11/2009 Venice Bl E/o Sepulveda Bl 5,230 7,637 4,070 6,497 4,070 6,497 1,160 1, YES YES 1,345,922 1,299, W 2/11/2009 Venice Bl E/o Sepulveda Bl 5,243 7,772 5,219 6,673 5,219 6, , YES YES 583 1,208, E 2/18/ th St E/o Sepulveda Bl 785 1, W 2/18/ th St E/o Sepulveda Bl N Corrupt 411 S Corrupt 412 E 2/18/2009 Century Fwy W/b Off Ramp E/o Sepulveda Bl W 2/18/2009 Century Fwy W/b Off Ramp E/o Sepulveda Bl 4,278 5,256 5,969 5,188 5,969 5,188-1, NO YES 2,859,634 4, E 2/18/2009 Imperial Hwy E/o Sepulveda Bl 3,282 5,396 3,723 6,361 3,723 6, YES YES 194, , W 2/18/2009 Imperial Hwy E/o Sepulveda Bl 1,734 2,895 3,519 3,956 3,519 3,956-1,785-1, NO YES 3,187,202 1,124, N 2/25/2009 Century Park West N/o Constellation Bl 774 2, S 2/25/2009 Century Park West N/o Constellation Bl 1,329 1, N 2/25/2009 Century Park West S/o Constellation Bl 2,198 1,027 1,509 1,156 1,509 1, YES YES 474,692 16, S 2/25/2009 Century Park West S/o Constellation Bl 322 3, , , , YES NO 47,073 1,544, E 2/25/2009 Constellation Bl E/o Century Park West 3,821 2,772 1, , ,180 2, NO NO 4,753,710 4,048, W 2/25/2009 Constellation Bl E/o Century Park West 1,743 6, , ,239 1,236 3, NO NO 1,527,097 9,067, N 3/11/2009 Doheny Dr N/o Alden Dr 1,333 2,194 1,721 3,167 1,721 3, YES YES 150, , S 3/11/2009 Doheny Dr N/o Alden Dr 1,454 2,385 1,654 2,350 1,654 2, YES YES 40,022 1, N 6/12/ th Street North Of Ocean Park Boulevard S 6/12/ th Street North Of Ocean Park Boulevard N 6/12/ th Street South Of Pico Boulevard S 6/12/ th Street South Of Pico Boulevard 450 1, N 6/20/2007 3rd Street Between Pico Boulevard And Bay Street S 6/20/2007 3rd Street Between Pico Boulevard And Bay Street N 12/11/2008 Armacost Avenue North Of National Boulevard S 12/11/2008 Armacost Avenue North Of National Boulevard E 6/20/2007 Bay Street Between Main Street And 3rd Street W 6/20/2007 Bay Street Between Main Street And 3rd Street N 9/11/2008 Berkeley Street Between Wilshire Boulevard And Lipton Avenue S 9/11/2008 Berkeley Street Between Wilshire Boulevard And Lipton Avenue N 12/10/2008 Bundy Drive North Of Ocean Park Boulevard 3,914 4,080 4,539 5,172 4,539 5, , YES YES 390,145 1,193, S 12/10/2008 Bundy Drive North Of Ocean Park Boulevard 2,547 5,325 3,049 6,508 3,049 6, , YES YES 251,578 1,398, N 12/10/2008 Bundy Drive North Of Pico Boulevard 4,343 4,494 5,033 6,017 5,033 6, , YES YES 476,725 2,319, S 12/10/2008 Bundy Drive North Of Pico Boulevard 2,852 6,202 3,341 5,459 3,341 5, YES YES 239, , N 12/10/2008 Grand View Boulevard North Of Stanwood Drive S 12/10/2008 Grand View Boulevard North Of Stanwood Drive N 12/11/2008 Lincoln Boulevard North Of Culver Boulevard 7,191 8,823 6,805 8,774 6,805 8, YES YES 149,037 2, S 12/11/2008 Lincoln Boulevard North Of Culver Boulevard 5,585 9,311 3,739 8,307 3,739 8,307 1,846 1, NO YES 3,408,904 1,007, N 12/10/2008 Lincoln Boulevard North Of Maxella Avenue / Marina Pointe Drive 6,392 8,907 6,509 8,859 6,509 8, YES YES 13,697 2, S 12/10/2008 Lincoln Boulevard North Of Maxella Avenue / Marina Pointe Drive 5,354 8,557 4,711 8,480 4,711 8, YES YES 412,904 5, E 9/11/2008 Lipton Avenue Between Stanford Street And Berkeley Street W 9/11/2008 Lipton Avenue Between Stanford Street And Berkeley Street E 12/10/2008 Ocean Park Boulevard West Of Armacost Avenue 1,639 4,161 1,775 3,612 1,775 3, YES YES 18, , W 12/10/2008 Ocean Park Boulevard West Of Armacost Avenue 3,164 3,285 1,644 2,224 1,644 2,224 1,520 1, NO NO 2,311,837 1,125, E 12/10/2008 Olympic Boulevard West Of Bundy Drive 3,965 7,291 2,907 6,139 2,907 6,139 1,058 1, NO YES 1,119,717 1,326, W 12/10/2008 Olympic Boulevard West Of Bundy Drive 4,235 6,368 4,417 5,564 4,417 5, YES YES 33, , E 6/12/2007 Pearl Street East Of 28th Street W 6/12/2007 Pearl Street East Of 28th Street 394 1, E 6/12/2007 Pearl Street West Of 28th Street 336 1, W 6/12/2007 Pearl Street West Of 28th Street N 9/11/2008 Stanford Street Between Wilshire Boulevard And Lipton Avenue S 9/11/2008 Stanford Street Between Wilshire Boulevard And Lipton Avenue N 6/12/2007 Stewart Street North Of Pico Boulevard 1,145 1, S 6/12/2007 Stewart Street North Of Pico Boulevard 786 1, E 12/10/2008 Venice Boulevard East Of Centinela Avenue 5,457 6,915 3,626 5,808 3,626 5,808 1,831 1, NO YES 3,351,030 1,226, W 12/10/2008 Venice Boulevard East Of Centinela Avenue 4,745 8,094 4,288 6,412 4,288 6, , YES YES 208,976 2,827, E 12/10/2008 Venice Boulevard East Of Lincoln Boulevard 4,619 7,278 3,446 5,019 3,446 5,019 1,173 2, NO NO 1,376,698 5,101, W 12/10/2008 Venice Boulevard East Of Lincoln Boulevard 4,800 6,974 3,186 4,305 3,186 4,305 1,614 2, NO NO 2,604,729 7,124, E 4/19/2007 Virginia Avenue Between 20th Street And Cloverfield Boulevard W 4/19/2007 Virginia Avenue Between 20th Street And Cloverfield Boulevard E 4/19/2007 Virginia Avenue Between Cloverfield Boulevard And High Place W 4/19/2007 Virginia Avenue Between Cloverfield Boulevard And High Place E 4/19/2007 Virginia Avenue Between High Place And 27th Street W 4/19/2007 Virginia Avenue Between High Place And 27th Street
115 Static Highway Validation - Highway Links # Direction Count Date Location Model AM Model PM Count AM Count PM ALL Count AM ALL Count PM Delta AM Delta PM Delta/Count AM Delta/Count PM Max Dev AM Max Dev PM Within Dev AM Within Dev PM Dif Squared AM Dif Squared PM Pass AM? Pass PM? Total 441 N 2/24/2009 Pacific Coast Hwy N/o Chatauqua Blvd 7,420 12,307 6,321 11,352 6,321 11,352 1, YES YES 1,208, , S 2/24/2009 Pacific Coast Hwy N/o Chatauqua Blvd 9,079 11,283 12,291 11,135 12,291 11,135-3, NO YES 10,318,658 21, N 2/18/2009 Sunset Blvd S/o Hartzell St 3,148 6,623 2,181 3,873 2,181 3, , NO NO 935,162 7,561, S 2/18/2009 Sunset Blvd S/o Hartzell St 4,246 4,417 3,630 3,833 3,630 3, YES YES 379, , N 2/18/2009 Kenter Ave N/o Sunset Blvd 880 1, , , YES YES 2 120, S 2/18/2009 Kenter Ave N/o Sunset Blvd 1,010 1,394 1,192 1,116 1,192 1, YES YES 33,201 77, N 2/18/2009 Barrington Ave N/o Sunset Blvd S 2/18/2009 Barrington Ave N/o Sunset Blvd 541 1, E 2/18/2009 Sunset Blvd E/o S Barrington Pl 4,338 7,316 6,395 5,640 6,395 5,640-2,057 1, NO YES 4,232,265 2,808, W 2/18/2009 Sunset Blvd E/o S Barrington Pl 4,959 5,901 6,108 6,830 6,108 6,830-1, YES YES 1,320, , E 2/12/2009 Wilshire Blvd E/o Federal Ave 7,205 8, W 2/12/2009 Wilshire Blvd E/o Federal Ave 7,955 9, E 2/12/2009 Ohio Ave E/o Federal Ave 1,657 2,156 1,488 1,817 1,488 1, YES YES 28, , W 2/12/2009 Ohio Ave E/o Federal Ave 1,321 2,452 1,267 2,263 1,267 2, YES YES 2,898 35, E 2/24/2009 Santa Monica Blvd E/o Federal Ave 6,313 9,352 3,574 5,189 3,574 5,189 2,739 4, NO NO 7,504,275 17,332, W 2/24/2009 Santa Monica Blvd E/o Federal Ave 5,139 8,123 4,295 5,153 4,295 5, , YES NO 711,625 8,823, E 2/24/2009 Olympic Blvd E/o Federal Ave 3,792 6,042 4,234 6,034 4,234 6, YES YES 195, W 2/24/2009 Olympic Blvd E/o Federal Ave 3,717 6,424 3,775 6,379 3,775 6, YES YES 3,369 2, E 2/12/2009 Pico Blvd E/o Barrington Ave 2,178 4,002 2,383 3,349 2,383 3, YES YES 42, , W 2/12/2009 Pico Blvd E/o Barrington Ave 2,181 2,902 2,224 4,282 2,224 4, , YES YES 1,889 1,903, E 2/24/2009 Gateway Blvd E/o Barrington Ave 3,181 3,265 2,285 2,948 2,285 2, YES YES 803, , W 2/24/2009 Gateway Blvd E/o Barrington Ave 2,019 4,772 1,439 2,805 1,439 2, , YES NO 336,416 3,870, E 2/12/2009 National Blvd E/o Barrington Ave 1,649 3,701 1,449 3,538 1,449 3, YES YES 39,955 26, W 2/12/2009 National Blvd E/o Barrington Ave 1,959 2,030 1,583 2,350 1,583 2, YES YES 141, , E 2/12/2009 Palms Blvd E/o Mclaughlin Ave 2,613 3,668 1,771 3,445 1,771 3, NO YES 708,976 49, W 2/12/2009 Palms Blvd E/o Mclaughlin Ave 2,068 3,671 1,989 3,073 1,989 3, YES YES 6, , E 2/24/2009 Venice Blvd E/o Mclaughlin Ave 5,911 8,018 4,719 6,030 4,719 6,030 1,192 1, YES NO 1,419,676 3,952, W 2/24/2009 Venice Blvd E/o Mclaughlin Ave 5,588 8,430 4,053 5,941 4,053 5,941 1,535 2, NO NO 2,356,561 6,193, N 2/12/2009 Walgrove Ave S/o Venice Blvd 1,673 2,387 1,304 1,743 1,304 1, YES YES 136, , S 2/12/2009 Walgrove Ave S/o Venice Blvd 1,777 2, , , NO YES 908,320 12, N 2/12/2009 Lincoln Blvd S/o Venice Blvd 4,851 6,246 6,393 7,690 6,393 7,690-1,542-1, YES YES 2,377,895 2,085, S 2/12/2009 Lincoln Blvd S/o Venice Blvd 4,127 6,218 4,564 7,628 4,564 7, , YES YES 191,060 1,989, N 2/12/2009 Abbot Kinney Blvd Btwn Washington Wy & Victoria Ave 1,197 2,032 2,337 2,403 2,337 2,403-1, NO YES 1,299, , S 2/12/2009 Abbot Kinney Blvd Btwn Washington Wy & Victoria Ave 1,533 1,873 1,106 2,880 1,106 2, , YES YES 182,662 1,013, N 2/12/2009 Ocean Ave S/o Venice Blvd 1,292 1, S 2/12/2009 Ocean Ave S/o Venice Blvd 572 2, N 2/12/2009 Pacific Ave S/o Venice Blvd 1,421 1,447 2,010 1,721 2,010 1, YES YES 346,606 75, S 2/12/2009 Pacific Ave S/o Venice Blvd 920 2,142 1,201 3,161 1,201 3, , YES YES 79,044 1,038, E 2/24/2009 Pico Blvd W/o Purdue Ave 5,359 7,266 5,176 6,220 5,176 6, , YES YES 33,496 1,093, W 2/24/2009 Pico Blvd W/o Purdue Ave 4,200 7,674 3,596 6,929 3,596 6, YES YES 364, , E 3/25/2009 Wilshire Blvd W/o Lincoln Blvd 2,505 3,532 2,327 3,955 2,327 3, YES YES 31, , W 3/25/2009 Wilshire Blvd W/o Lincoln Blvd 1,902 3,254 2,017 4,252 2,017 4, YES YES 13, , E 3/25/2009 Santa Monica Blvd W/o Lincoln Blvd 2,061 4,447 1,048 2,659 1,048 2,659 1,013 1, NO NO 1,025,932 3,196, W 3/25/2009 Santa Monica Blvd W/o Lincoln Blvd 1,867 2,792 1,220 2,680 1,220 2, NO YES 418,642 12, E 3/25/2009 Colorado Ave W/o Lincoln Blvd 2,036 3,835 1,395 2,827 1,395 2, , YES YES 410,283 1,016, W 3/25/2009 Colorado Ave W/o Lincoln Blvd 1,190 2,245 1,182 2,367 1,182 2, YES YES 65 14, E 3/25/2009 Pico Blvd W/o Lincoln Blvd 1,459 2,378 1,887 3,073 1,887 3, YES YES 183, , W 3/25/2009 Pico Blvd W/o Lincoln Blvd 1,457 2,240 1,841 3,033 1,841 3, YES YES 147, , E 3/25/2009 Ocean Park Blvd W/o Lincoln Blvd 1,659 2,563 1,441 3,003 1,441 3, YES YES 47, , W 3/25/2009 Ocean Park Blvd W/o Lincoln Blvd 1,403 2,355 1,935 2,816 1,935 2, YES YES 282, , E 3/25/2009 Colorado Ave W/o Cloverfield Blvd 2,398 3,553 2,168 2,974 2,168 2, YES YES 53, , W 3/25/2009 Colorado Ave W/o Cloverfield Blvd 2,335 3,781 1,937 2,922 1,937 2, YES YES 158, , E 3/25/2009 Olympic Blvd W/o Cloverfield Blvd 2,814 3,979 2,899 3,898 2,899 3, YES YES 7,274 6, W 3/25/2009 Olympic Blvd W/o Cloverfield Blvd 2,696 4,337 2,681 4,440 2,681 4, YES YES , E 3/25/2009 Pico Blvd W/o Cloverfield Blvd 3,160 5,009 3,510 5,044 3,510 5, YES YES 122,569 1, W 3/25/2009 Pico Blvd W/o Cloverfield Blvd 3,253 4,660 3,655 5,793 3,655 5, , YES YES 161,919 1,284, E 3/25/2009 Ocean Park Blvd W/o Cloverfield Blvd 2,475 2,421 2,799 3,313 2,799 3, YES YES 105, , W 3/25/2009 Ocean Park Blvd W/o Cloverfield Blvd 1,311 3,442 2,246 4,203 2,246 4, NO YES 873, , N 3/25/2009 Ocean Ave S/o Santa Monica Blvd 2,522 3,321 2,492 4,056 2,492 4, YES YES , S 3/25/2009 Ocean Ave S/o Santa Monica Blvd 2,417 3,589 1,681 4,102 1,681 4, YES YES 541, , N 3/26/2009 4th St S/o Santa Monica Blvd 1,499 1, , , , YES NO 272,349 1,584, S 3/26/2009 4th St S/o Santa Monica Blvd 1,147 2,467 1,003 2,526 1,003 2, YES YES 20,612 3, N 3/26/2009 Lincoln Blvd S/o Santa Monica Blvd 2,518 4,365 3,053 5,009 3,053 5, YES YES 286, , S 3/26/2009 Lincoln Blvd S/o Santa Monica Blvd 3,088 4,558 2,796 4,009 2,796 4, YES YES 85, , N 3/26/ th St S/o Santa Monica Blvd 1,213 1,873 1,701 2,817 1,701 2, YES YES 238, , S 3/26/ th St S/o Santa Monica Blvd 1,361 1,928 1,948 2,635 1,948 2, YES YES 344, , N 3/26/2009 Lincoln Blvd S/o Pico Blvd 4,014 3,954 5,046 5,596 5,046 5,596-1,032-1, YES YES 1,064,794 2,695, S 3/26/2009 Lincoln Blvd S/o Pico Blvd 2,658 5,598 3,298 6,344 3,298 6, YES YES 410, , N 3/26/2009 Lincoln Blvd S/o Ocean Park Blvd 5,416 4,952 4,879 5,919 4,879 5, YES YES 287, , S 3/26/2009 Lincoln Blvd S/o Ocean Park Blvd 3,264 7,606 3,343 6,446 3,343 6, , YES YES 6,233 1,346, E 11/18/ Block Sunset Boulevard Between Sepulveda Boulevard And South Beverly Glen Boulevard 3,211 3,892 3,110 4,384 3,110 4, YES YES 10, , W 11/18/ Block Sunset Boulevard Between Sepulveda Boulevard And South Beverly Glen Boulevard 2,648 5,113 3,272 4,536 3,272 4, YES YES 388, , E 11/18/2010 Sunset Boulevard Between South Beverly Glen Boulevard And North Beverly Glen Boulevard 2,263 8,864 3,237 7,218 3,237 7, , YES YES 947,832 2,709, W 11/18/2010 Sunset Boulevard Between South Beverly Glen Boulevard And North Beverly Glen Boulevard 7,532 5,194 6,278 7,510 6,278 7,510 1,254-2, YES NO 1,572,565 5,363, E 11/18/ Block San Vicente Boulevard Between 26th Street And Bundy Drive 3,916 4,625 3,599 5,762 3,599 5, , YES YES 100,580 1,293, W 11/18/ Block San Vicente Boulevard Between 26th Street And Bundy Drive 2,626 5,135 3,592 4,646 3,592 4, YES YES 933, , N 11/18/2010 Bundy Drive Between San Vicente Boulevard And Wilshire Boulevard 1,668 2,597 1,944 3,560 1,944 3, YES YES 76, , S 11/18/2010 Bundy Drive Between San Vicente Boulevard And Wilshire Boulevard 1,679 2,257 1,570 2,255 1,570 2, YES YES 11, E 11/18/ San Vicente Boulevard Between Bundy Drive And Wilshire Boulevard 3,250 3,523 4,578 4,662 4,578 4,662-1,328-1, YES YES 1,763,602 1,297, W 11/18/ San Vicente Boulevard Between Bundy Drive And Wilshire Boulevard 2,302 4,246 3,206 5,540 3,206 5, , YES YES 817,959 1,675,
116 Static Highway Validation - Highway Links # Direction Count Date Location Model AM Model PM Count AM Count PM ALL Count AM ALL Count PM Delta AM Delta PM Delta/Count AM Delta/Count PM Max Dev AM Max Dev PM Within Dev AM Within Dev PM Dif Squared AM Dif Squared PM Pass AM? Pass PM? Total 481 E 11/18/2010 Wilshire Boulevard Between San Vicente Boulevard And Sepulveda Boulevard 7,873 11,371 8,550 9,442 8,550 9, , YES YES 457,837 3,719, W 11/18/2010 Wilshire Boulevard Between San Vicente Boulevard And Sepulveda Boulevard 7,819 12,006 8,237 9,067 8,237 9, , YES NO 174,556 8,639, E 11/18/ Block Wilshire Boulevard Between Westwood Boulevard And Beverly Glen Boulevard 4,876 9,430 5,552 7,962 5,552 7, , YES YES 457,439 2,153, W 11/18/ Block Wilshire Boulevard Between Westwood Boulevard And Beverly Glen Boulevard 6,652 8,108 6,766 5,883 6,766 5, , YES NO 13,021 4,951, E 11/18/ Block Wilshire Boulevard Between Beverly Glen Boulevard And Comstock Avenue 4,684 8,127 5,476 7,658 5,476 7, YES YES 627, , W 11/18/ Block Wilshire Boulevard Between Beverly Glen Boulevard And Comstock Avenue 6,242 7,650 6,156 7,247 6,156 7, YES YES 7, , E 11/18/ Block Santa Monica Boulevard Between Centinela Avenue And Bundy Drive 2,833 4,775 2,340 4,699 2,340 4, YES YES 243,381 5, W 11/18/ Block Santa Monica Boulevard Between Centinela Avenue And Bundy Drive 3,095 3,981 3,081 3,683 3,081 3, YES YES , N 11/18/2010 Sawtelle Boulevard Between Ohio Avenue And Santa Monica Bnoulevard 1,768 2,194 1, , , YES NO 262,400 1,629, S 11/18/2010 Sawtelle Boulevard Between Ohio Avenue And Santa Monica Bnoulevard 1,194 2, , , NO NO 340, , N 11/18/ Block Sepulveda Boulevard Between Wilshire Boulevard And Santa Monica Boulevard 2,948 4,688 2,415 4,080 2,415 4, YES YES 284, , S 11/18/ Block Sepulveda Boulevard Between Wilshire Boulevard And Santa Monica Boulevard 3,459 4,923 2,061 2,876 2,061 2,876 1,398 2, NO NO 1,955,537 4,191, E 11/18/ Block Santa Monica Boulevard Between Sepulveda Boulevard And Westwood Boulevard 5,788 6,820 5,484 6,628 5,484 6, YES YES 92,513 36, W 11/18/ Block Santa Monica Boulevard Between Sepulveda Boulevard And Westwood Boulevard 4,429 7,746 4,302 5,205 4,302 5, , YES NO 16,041 6,457, N 11/18/ Block Westwood Boulevard Between Wilshire Boulevard And Santa Monica Boulevard 4,393 4,228 3,697 4,627 3,697 4, YES YES 484, , S 11/18/ Block Westwood Boulevard Between Wilshire Boulevard And Santa Monica Boulevard 2,398 6,030 2,066 5,023 2,066 5, , YES YES 110,374 1,014, E 11/18/ Block Santa Monica Boulevard Between Westwood Boulevard And Overland Avenue 5,170 6,189 5,468 6,336 5,468 6, YES YES 89,053 21, W 11/18/ Block Santa Monica Boulevard Between Westwood Boulevard And Overland Avenue 4,648 7,458 4,875 6,853 4,875 6, YES YES 51, , E 11/18/ Block Santa Monica Boulevard Between Overland Avenue And Beverly Glen Boulevard 5,544 6,993 5,514 6,642 5,514 6, YES YES , W 11/18/ Block Santa Monica Boulevard Between Overland Avenue And Beverly Glen Boulevard 5,215 8,629 4,593 7,323 4,593 7, , YES YES 386,844 1,706, E 11/18/ Block Santa Monica Boulevard Between Beverly Glen Boulevard And Club View Drive 6,903 7,856 6,938 7,220 6,938 7, YES YES 1, , W 11/18/ Block Santa Monica Boulevard Between Beverly Glen Boulevard And Club View Drive 6,198 10,754 4,607 9,047 4,607 9,047 1,591 1, NO YES 2,530,385 2,912, N 11/18/ Block Bundy Drive Between Santa Monica Boulevard And Olympic Boulevard 2,951 4,603 3,407 5,364 3,407 5, YES YES 208, , S 11/18/ Block Bundy Drive Between Santa Monica Boulevard And Olympic Boulevard 2,993 4,190 3,586 4,576 3,586 4, YES YES 351, , N 11/18/ Block Sawtelle Boulevard Between Santa Monica Boulevard And Olympic Boulevard 2,987 3, S 11/18/ Block Sawtelle Boulevard Between Santa Monica Boulevard And Olympic Boulevard 2,296 5, N 11/18/ Block Sepulveda Boulevard Between Santa Monica Boulevard And Olympic Boulevard 3,154 4,108 3,057 4,422 3,057 4, YES YES 9,452 98, S 11/18/ Block Sepulveda Boulevard Between Santa Monica Boulevard And Olympic Boulevard 2,424 4,316 1,719 3,398 1,719 3, YES YES 496, , E 11/18/ Block Olympic Boulevard Between Sepulveda Boulevard And Westwood Boulevard 5,280 7,369 5,424 7,087 5,424 7, YES YES 20,728 79, W 11/18/ Block Olympic Boulevard Between Sepulveda Boulevard And Westwood Boulevard 5,253 10,098 5,890 8,902 5,890 8, , YES YES 406,101 1,429, N 11/18/ Block Westwood Boulevard Between Santa Monica Boulevard And Olympic Boulevard 4,145 4,670 2,406 3,757 2,406 3,757 1, NO YES 3,023, , S 11/18/ Block Westwood Boulevard Between Santa Monica Boulevard And Olympic Boulevard 2,729 5,501 2,038 5,345 2,038 5, YES YES 477,030 24, N 11/18/ Block Overland Avenue Between Santa Monica Boulevard And Olympic Boulevard 1,493 1, , , NO YES 367,619 91, S 11/18/ Block Overland Avenue Between Santa Monica Boulevard And Olympic Boulevard 1,031 2, , , NO NO 393, , E 11/18/ Block Olympic Boulevard Between Overland Avenue And Beverly Glen Boulevard 6,550 7,994 6,237 7,759 6,237 7, YES YES 97,834 55, W 11/18/ Block Olympic Boulevard Between Overland Avenue And Beverly Glen Boulevard 5,289 12,847 6,318 10,325 6,318 10,325-1,029 2, YES NO 1,058,072 6,358, N 11/18/ Block Beverly Glen Boulevard Between Santa Monica Boulevard And Olympic Boulevard 3,046 2,802 2,141 3,058 2,141 3, NO YES 818,956 65, S 11/18/ Block Beverly Glen Boulevard Between Santa Monica Boulevard And Olympic Boulevard 1,565 4,234 2,642 4,197 2,642 4,197-1, NO YES 1,160,422 1, E 11/18/ Block Olympic Boulevard Between Beverly Glen Boulevard And Avenue Of The Stars 6,643 7,012 6,895 7,324 6,895 7, YES YES 63,294 97, W 11/18/ Block Olympic Boulevard Between Beverly Glen Boulevard And Avenue Of The Stars 4,886 12,375 4,590 8,352 4,590 8, , YES NO 87,501 16,184, N 11/18/ Block Sawtelle Boulevard Between Olympic Boulevard And Pico Boulevard 4,184 3,002 4,125 3,778 4,125 3, YES YES 3, , S 11/18/ Block Sawtelle Boulevard Between Olympic Boulevard And Pico Boulevard 3,065 6,722 1,167 3,436 1,167 3,436 1,898 3, NO NO 3,602,756 10,799, N 11/18/ Block Sepulveda Boulevard Between Olympic Boulevard And Pico Boulevard 4,637 4,174 3,787 5,089 3,787 5, YES YES 722, , S 11/18/ Block Sepulveda Boulevard Between Olympic Boulevard And Pico Boulevard 3,097 6,215 1,459 3,566 1,459 3,566 1,638 2, NO NO 2,681,503 7,019, E 11/18/ Block Pico Boulevard Between Sepulveda Boulevard And Westwood Boulevard 4,726 7,009 3,793 5,853 3,793 5, , YES YES 870,723 1,335, W 11/18/ Block Pico Boulevard Between Sepulveda Boulevard And Westwood Boulevard 4,062 7,067 3,997 5,678 3,997 5, , YES YES 4,276 1,930, N 11/18/ Block Westwood Boulevard Between Olympic Boulevard And Pico Boulevard 3,520 3,529 2,906 3,953 2,906 3, YES YES 376, , S 11/18/ Block Westwood Boulevard Between Olympic Boulevard And Pico Boulevard 2,013 5,490 1,796 5,042 1,796 5, YES YES 47, , E 11/18/ Block Pico Boulevard Between Westwood Boulevard And Overland Avenue 4,733 4,835 4,036 5,401 4,036 5, YES YES 486, , W 11/18/ Block Pico Boulevard Between Westwood Boulevard And Overland Avenue 3,022 5,939 4,213 6,208 4,213 6,208-1, YES YES 1,419,035 72, E 11/18/ Block Pico Boulevard Between Overland Avenue And Beverly Glen Boulevard 7,080 5,909 4,457 5,611 4,457 5,611 2, NO YES 6,878,800 88, W 11/18/ Block Pico Boulevard Between Overland Avenue And Beverly Glen Boulevard 3,771 9,115 4,397 8,356 4,397 8, YES YES 392, , E 11/18/2010 Pico Boulevard Between Beverly Glen Boulevard And Motor Avenue 5,872 5,939 5,701 5,980 5,701 5, YES YES 29,207 1, W 11/18/2010 Pico Boulevard Between Beverly Glen Boulevard And Motor Avenue 3,527 8,119 4,568 8,485 4,568 8,485-1, YES YES 1,084, , E 11/18/2010 Pico Boulevard Between Motor Avenue And Beverwill Drive 3,493 8,048 3,870 6,544 3,870 6, , YES YES 142,005 2,262, W 11/18/2010 Pico Boulevard Between Motor Avenue And Beverwill Drive 5,414 5,662 5,445 6,066 5,445 6, YES YES , E 11/18/ Block Ocean Park Boulevard Between Centinela Avenue And Bundy Drive 2,542 7,319 1,992 5,778 1,992 5, , YES YES 302,217 2,375, W 11/18/ Block Ocean Park Boulevard Between Centinela Avenue And Bundy Drive 5,067 4,978 4,586 3,976 4,586 3, , YES YES 231,633 1,004, N 11/18/ Block Sawtelle Boulevard Between Pico Boulevard And National Boulevard 3,677 2,935 3,246 3,610 3,246 3, YES YES 185, , S 11/18/ Block Sawtelle Boulevard Between Pico Boulevard And National Boulevard 1,830 5,478 1,535 6,078 1,535 6, YES YES 86, , E 11/18/ Block National Boulevard Between Sepulveda Boulevard And Westwood Boulevard 2,758 3,758 3,418 4,633 3,418 4, YES YES 435, , W 11/18/ Block National Boulevard Between Sepulveda Boulevard And Westwood Boulevard 2,350 3,270 1,807 3,546 1,807 3, YES YES 294,357 76, N 11/18/ Block Overland Avenue Between Pico Boulevard And National Boulevard 4,979 4,439 5,512 6,239 5,512 6, , YES NO 284,459 3,240, S 11/18/ Block Overland Avenue Between Pico Boulevard And National Boulevard 3,142 7,222 3,292 7,053 3,292 7, YES YES 22,413 28, E 11/18/ National Boulevard Between Overland Avenue And Motor Avenue 2,562 4,360 2,105 1,807 2,105 1, , YES NO 209,251 6,517, W 11/18/ National Boulevard Between Overland Avenue And Motor Avenue 2,401 3,042 1,338 3,696 1,338 3,696 1, NO YES 1,129, , N 11/18/ Block Pacific Avenue Between Dewey Street And Rose Avenue 3,216 2,849 2,450 2,613 2,450 2, YES YES 587,365 55, S 11/18/ Block Pacific Avenue Between Dewey Street And Rose Avenue 1,792 4, , , , NO NO 920,111 2,320, E 11/18/ Block Rose Avenue Between Pacific Avenue And Lincoln Boulevard 536 1, , , YES YES 142, , W 11/18/ Block Rose Avenue Between Pacific Avenue And Lincoln Boulevard 1,338 1,183 1,143 1,905 1,143 1, YES YES 37, , N 11/18/ Block Lincoln Boulevard Between Dewey Street And Rose Avenue 5,099 6,225 5,396 6,502 5,396 6, YES YES 88,011 76, S 11/18/ Block Lincoln Boulevard Between Dewey Street And Rose Avenue 4,303 7,526 3,680 7,254 3,680 7, YES YES 388,693 74, N 11/18/ Block Pacific Avenue Between Rose Avenue And Brooks Avenue 2,907 2,791 2,563 2,777 2,563 2, YES YES 118, S 11/18/ Block Pacific Avenue Between Rose Avenue And Brooks Avenue 1,791 4,342 1,426 4,572 1,426 4, YES YES 133,494 52, N 11/18/ Pacific Avenue Between Brooks Avenue And Venice Boulevard 1,937 1,995 2,192 2,219 2,192 2, YES YES 65,275 50, S 11/18/ Pacific Avenue Between Brooks Avenue And Venice Boulevard 1,090 2,422 1,113 3,182 1,113 3, YES YES , E 11/18/ Block Venice Boulevard Between Pacific Avenue And Abbot Kinney Boulevard 1,465 1,390 1,796 2,626 1,796 2, , YES NO 109,505 1,528, W 11/18/ Block Venice Boulevard Between Pacific Avenue And Abbot Kinney Boulevard 788 2,260 1,199 2,499 1,199 2, YES YES 168,981 57, N 11/18/ Lincoln Boulevard Between Rose Avenue And Venice Boulevard 5,466 6,470 6,105 5,434 6,105 5, , YES YES 408,188 1,072, S 11/18/ Lincoln Boulevard Between Rose Avenue And Venice Boulevard 4,350 7,196 3,714 5,696 3,714 5, , YES YES 404,363 2,250,
117 Static Highway Validation - Highway Links # Direction Count Date Location Model AM Model PM Count AM Count PM ALL Count AM ALL Count PM Delta AM Delta PM Delta/Count AM Delta/Count PM Max Dev AM Max Dev PM Within Dev AM Within Dev PM Dif Squared AM Dif Squared PM Pass AM? Pass PM? Total 521 E 11/18/ Block Venice Boulevard Between Abbot Kinney Boulevard And Lincoln Boulevard 2,540 4,207 2,801 4,168 2,801 4, YES YES 67,993 1, W 11/18/ Block Venice Boulevard Between Abbot Kinney Boulevard And Lincoln Boulevard 2,797 3,709 1,930 3,186 1,930 3, NO YES 752, , E 11/18/ Block Venice Boulevard Between Walgrove Avenue And Centinela Avenue 4,809 7,332 3,767 5,563 3,767 5,563 1,042 1, YES NO 1,086,178 3,130, W 11/18/ Block Venice Boulevard Between Walgrove Avenue And Centinela Avenue 4,910 7,797 3,249 4,867 3,249 4,867 1,661 2, NO NO 2,758,094 8,584, N 11/18/ Block Sawtelle Boulevard Between National Boulevard And Venice Boulevard 3,402 2,539 3,078 3,381 3,078 3, YES YES 105, , S 11/18/ Block Sawtelle Boulevard Between National Boulevard And Venice Boulevard 1,404 4,478 1,140 4,235 1,140 4, YES YES 69,663 59, N 11/18/ Block Sepulveda Boulevard Between National Boulevard And Venice Boulevard 4,120 3,976 4,691 6,641 4,691 6, , YES NO 325,928 7,100, S 11/18/ Block Sepulveda Boulevard Between National Boulevard And Venice Boulevard 2,413 5,528 2,635 5,301 2,635 5, YES YES 49,109 51, E 11/18/ Block Venice Boulevard Between Overland Avenue And Hughes Avenue 5,655 7,400 4,368 7,283 4,368 7,283 1, NO YES 1,656,894 13, W 11/18/ Block Venice Boulevard Between Overland Avenue And Hughes Avenue 5,320 8,616 4,515 6,412 4,515 6, , YES NO 647,225 4,855, N 11/18/ Block Centinela Avenue Between Venice Boulevard And Washington Boulevard 4,198 4,821 4,232 5,164 4,232 5, YES YES 1, , S 11/18/ Block Centinela Avenue Between Venice Boulevard And Washington Boulevard 3,129 5,750 2,774 5,469 2,774 5, YES YES 126,053 79, E 11/18/ Block Washington Bulevard Between Pacific Avenue And Abbot Kinney Boulevard 2,679 3,165 2,538 3,152 2,538 3, YES YES 19, W 11/18/ Block Washington Bulevard Between Pacific Avenue And Abbot Kinney Boulevard 2,180 4,115 1,476 3,333 1,476 3, NO YES 495, , E 11/18/ Block Washington Boulevard Between Lincoln Boulevard And Centinela Avenue 3,083 5,349 2,897 5,322 2,897 5, YES YES 34, W 11/18/ Block Washington Boulevard Between Lincoln Boulevard And Centinela Avenue 3,524 4,420 2,607 5,160 2,607 5, YES YES 840, , E 11/18/ Block Washington Boulevard Between Centinela Avenue And Sawtelle Boulevard 3,131 3,918 2,207 3,605 2,207 3, NO YES 853,804 98, W 11/18/ Block Washington Boulevard Between Centinela Avenue And Sawtelle Boulevard 2,649 4,592 1,676 3,552 1,676 3, , NO YES 945,794 1,082, N 11/18/ Block Sawtelle Boulevard Between Venice Boulevard And Washington Boulevard 2,822 3,050 1,628 2,685 1,628 2,685 1, NO YES 1,425, , S 11/18/ Block Sawtelle Boulevard Between Venice Boulevard And Washington Boulevard 1,690 4,273 1,402 2,220 1,402 2, , YES NO 83,138 4,216, N 11/18/ Block Sawtelle Boulevard Between Washington Boulevard And Culver Boulevard 2,345 2,621 1,789 2,963 1,789 2, YES YES 309, , S 11/18/ Block Sawtelle Boulevard Between Washington Boulevard And Culver Boulevard 1,202 3,134 1,766 3,016 1,766 3, YES YES 317,768 13, E 11/18/2010 Culver Boulevard Between Nicholson Street And Jefferson Boulevard 4,608 5,911 6,340 4,056 6,340 4,056-1,732 1, NO NO 3,001,280 3,441, W 11/18/2010 Culver Boulevard Between Nicholson Street And Jefferson Boulevard 4,276 7,074 1,718 6,295 1,718 6,295 2, NO YES 6,544, , E 11/18/2010 Culver Boulevard Between Jefferson Boulevard And Lincoln Boulevard 2,366 3,090 5,016 2,928 5,016 2,928-2, NO YES 7,020,739 26, W 11/18/2010 Culver Boulevard Between Jefferson Boulevard And Lincoln Boulevard 2,369 3, , ,170 1, NO YES 2,100, , E 11/18/2010 Jefferson Boulevard Between Culver Boulevard Nad Lincoln Boulevard 2,497 3,132 1, , ,228 2, NO NO 1,508,703 6,076, W 11/18/2010 Jefferson Boulevard Between Culver Boulevard Nad Lincoln Boulevard 2,083 3, , ,452 1,213 1, NO NO 1,471,368 1,752, N 11/18/2010 Lincoln Boulevard Between Culver Boulevard And Jefferson Boulevard 7,191 8,822 7,139 8,419 7,139 8, YES YES 2, , S 11/18/2010 Lincoln Boulevard Between Culver Boulevard And Jefferson Boulevard 5,729 9,467 4,644 9,321 4,644 9,321 1, YES YES 1,177,648 21, E 11/18/ Block Jefferson Boulevard Between Lincoln Boulevard And Centinela Avenue 2,790 3,187 3,779 3,395 3,779 3, YES YES 979,039 43, W 11/18/ Block Jefferson Boulevard Between Lincoln Boulevard And Centinela Avenue 2,120 4,786 2,381 4,860 2,381 4, YES YES 68,089 5, E 11/18/ Block Jefferson Boulevard Between Centinela Avenue And Mesmer Avenue 2,239 3,131 2,325 3,856 2,325 3, YES YES 7, , W 11/18/ Block Jefferson Boulevard Between Centinela Avenue And Mesmer Avenue 1,818 2,688 2,548 3,289 2,548 3, YES YES 533, , N 11/18/ Block Lincoln Boulevard Between Jefferson Boulevard And Manchester Avenue 4,735 6,355 5,939 6,465 5,939 6,465-1, YES YES 1,450,626 12, S 11/18/ Block Lincoln Boulevard Between Jefferson Boulevard And Manchester Avenue 4,097 6,671 3,431 6,929 3,431 6, YES YES 444,081 66, E 11/18/ Block Manchester Between Lincoln Boulevard And Sepulveda Boulevard 2,343 3,519 2,581 4,492 2,581 4, YES YES 56, , W 11/18/ Block Manchester Between Lincoln Boulevard And Sepulveda Boulevard 2,426 3,354 2,775 3,374 2,775 3, YES YES 121, N 11/18/ Block Sepulveda Boulevard Between Centinela Avenue And Manchester Boulevard 4,950 7,108 6,165 6,493 6,165 6,493-1, YES YES 1,475, , S 11/18/ Block Sepulveda Boulevard Between Centinela Avenue And Manchester Boulevard 4,944 8,005 3,608 7,556 3,608 7,556 1, NO YES 1,785, , E 11/18/ Block Manchester Boulevard Between Sepulveda Boulevard And La Tijera Boulevard 2,255 3,482 2,030 4,546 2,030 4, , YES YES 50,705 1,131, W 11/18/ Block Manchester Boulevard Between Sepulveda Boulevard And La Tijera Boulevard 2,434 3,357 3,916 3,466 3,916 3,466-1, NO YES 2,197,441 11, N 11/18/ Block La Tijera Boulevard Between Manchester Avenue And Airport Boulevard 1,483 3,113 1,288 2,637 1,288 2, YES YES 38, , S 11/18/ Block La Tijera Boulevard Between Manchester Avenue And Airport Boulevard 2,249 2,855 2,137 2,440 2,137 2, YES YES 12, , N 11/18/ Block La Tijera Boulevard Between Airport Boulevard And Centinela Avenue 2,952 6,239 2,773 5,015 2,773 5, , YES YES 31,981 1,498, S 11/18/ Block La Tijera Boulevard Between Airport Boulevard And Centinela Avenue 4,861 5,900 3,891 4,406 3,891 4, , YES NO 941,848 2,232, E 11/18/ Block Manchester Avenue Between La Tijera Boulevard And Airport Boulevard 2,602 3,963 1,978 4,645 1,978 4, YES YES 388, , W 11/18/ Block Manchester Avenue Between La Tijera Boulevard And Airport Boulevard 2,795 3,768 3,520 3,003 3,520 3, YES YES 525, , N 11/18/2010 Airport Boulevard Between Manchester Avenue And La Tijera Boulevard 2,218 3,557 2,846 3,937 2,846 3, YES YES 394, , S 11/18/2010 Airport Boulevard Between Manchester Avenue And La Tijera Boulevard 2,812 3,961 2,145 3,713 2,145 3, YES YES 445,102 61, E 11/18/ Block Manchester Avenue Between Airport Boulevard And Aviation Boulevard 3,349 6,369 2,526 5,351 2,526 5, , YES YES 676,652 1,035, W 11/18/ Block Manchester Avenue Between Airport Boulevard And Aviation Boulevard 4,368 5,553 4,127 3,893 4,127 3, , YES NO 58,252 2,754, N 11/18/ Block Pershing Drive Between Manchester Avenue And Westchester Parkway 1,953 2,658 2,138 1,921 2,138 1, YES YES 34, , S 11/18/ Block Pershing Drive Between Manchester Avenue And Westchester Parkway 2,032 3, , ,930 1,064 1, NO NO 1,132,887 1,795, E 11/18/2010 Westchester Parkway Between Pershing Drive And Lincoln Boulevard 964 1,190 1,552 1,619 1,552 1, YES YES 345, , W 11/18/2010 Westchester Parkway Between Pershing Drive And Lincoln Boulevard 797 1, , , YES YES 3,686 39, N 11/18/ Block Lincoln Boulevard Between Manchester Avenue And Westchester Parkway 4,023 5,565 4,762 5,820 4,762 5, YES YES 545,762 65, S 11/18/ Block Lincoln Boulevard Between Manchester Avenue And Westchester Parkway 3,569 5,613 3,211 5,723 3,211 5, YES YES 127,811 12, N 11/18/2010 Lincoln Boulevard Between Westchester Parkway And Sepulveda Boulevard 4,077 5,662 4,716 5,746 4,716 5, YES YES 408,936 7, S 11/18/2010 Lincoln Boulevard Between Westchester Parkway And Sepulveda Boulevard 3,964 5,554 3,852 5,877 3,852 5, YES YES 12, , E 11/18/2010 Westchester Parkway Between Lincoln Boulevard And Sepulveda Boulevard 1,182 1, , , YES YES 76, , W 11/18/2010 Westchester Parkway Between Lincoln Boulevard And Sepulveda Boulevard 1,139 2,037 1,024 1,451 1,024 1, YES YES 13, , N 11/18/ Block Sepulveda Boulevard Between La Tijera Boulevard And Westchester Parkway 4,457 7,005 4,835 6,234 4,835 6, YES YES 142, , S 11/18/ Block Sepulveda Boulevard Between La Tijera Boulevard And Westchester Parkway 5,217 7,206 3,782 6,599 3,782 6,599 1, NO YES 2,059, , N 11/18/ Block Sepulveda Boulevard Between Westchester Parkway And Lincoln Boulevard 4,264 5,966 5,235 7,003 5,235 7, , YES YES 943,717 1,074, S 11/18/ Block Sepulveda Boulevard Between Westchester Parkway And Lincoln Boulevard 5,500 7,719 3,985 6,786 3,985 6,786 1, NO YES 2,294, , N 11/18/ Block Sepulveda Boulevard Between Lincoln Boulevard And Century Boulevard 8,948 12,763 11,576 14,287 11,576 14,287-2,628-1, NO YES 6,907,363 2,322, S 11/18/ Block Sepulveda Boulevard Between Lincoln Boulevard And Century Boulevard 8,283 11,578 5,957 10,745 5,957 10,745 2, NO YES 5,408, , N 11/18/ Block Airport Boulevard Between Manchester Avenue And Century Boulevard 1,788 3,314 1,772 3,382 1,772 3, YES YES 264 4, S 11/18/ Block Airport Boulevard Between Manchester Avenue And Century Boulevard 2,735 3,921 2,128 2,389 2,128 2, , YES NO 367,877 2,346, E 11/18/ Block Century Boulevard Between Airport Boulevard And Aviation Boulevard 4,832 9,480 3,600 7,191 3,600 7,191 1,232 2, NO NO 1,517,461 5,239, W 11/18/ Block Century Boulevard Between Airport Boulevard And Aviation Boulevard 5,245 7,702 5,509 5,847 5,509 5, , YES NO 69,437 3,440, N 11/18/ Block Aviation Boulevard Between Arbor Vitae Street And Century Boulevard 1,790 3,110 2,102 2,677 2,102 2, YES YES 97, , S 11/18/ Block Aviation Boulevard Between Arbor Vitae Street And Century Boulevard 2,113 2,683 1,330 2,456 1,330 2, NO YES 613,705 51, E 11/18/ Block Century Boulevard Between Aviation Boulevard And La Cienega Boulevard 3,894 8,383 2,925 6,531 2,925 6, , YES YES 938,783 3,428, W 11/18/ Block Century Boulevard Between Aviation Boulevard And La Cienega Boulevard 4,881 7,008 5,092 4,897 5,092 4, , YES NO 44,561 4,454, N 11/18/2010 Pershing Drive Between Westchester Parkway And Imperial Highway 2,164 3,749 2,384 2,944 2,384 2, YES YES 48, , S 11/18/2010 Pershing Drive Between Westchester Parkway And Imperial Highway 2,848 3,455 1,372 1,729 1,372 1,729 1,476 1, NO NO 2,178,286 2,978, E 11/18/ Block Imperial Highway Between Pershing Drive And Sepulveda Boulevard 3,187 5,221 2,748 3,833 2,748 3, , YES NO 192,805 1,927, W 11/18/ Block Imperial Highway Between Pershing Drive And Sepulveda Boulevard 4,213 5,095 3,854 4,524 3,854 4, YES YES 129, ,
118 Static Highway Validation - Highway Links # Direction Count Date Location Model AM Model PM Count AM Count PM ALL Count AM ALL Count PM Delta AM Delta PM Delta/Count AM Delta/Count PM Max Dev AM Max Dev PM Within Dev AM Within Dev PM Dif Squared AM Dif Squared PM Pass AM? Pass PM? Total 561 N 11/18/2010 Aviation Boulevard Between Century Boulevard And Imperial Highway 3,336 5,219 3,715 4,015 3,715 4, , YES YES 143,374 1,450, S 11/18/2010 Aviation Boulevard Between Century Boulevard And Imperial Highway 3,267 4,345 2,234 4,815 2,234 4,815 1, NO YES 1,067, , E 11/18/ Block Imperial Highway Between Aviation Boulevard And La Cienega Boulevard 1,213 4,495 1,679 4,591 1,679 4, YES YES 217,521 9, W 11/18/ Block Imperial Highway Between Aviation Boulevard And La Cienega Boulevard 3,329 2,143 2,514 2,665 2,514 2, YES YES 664, , E 11/18/ Block Slauson Avenue Between Bristol Parkway And Buckingham Parkway 4,140 9,723 3,275 7,737 3,275 7, , YES YES 748,071 3,945, W 11/18/ Block Slauson Avenue Between Bristol Parkway And Buckingham Parkway 6,888 6,857 6,302 5,190 6,302 5, , YES NO 343,402 2,778, N 11/18/ Block Sepulveda Boulevard Between Machado Road And Lucerne Avenue 3,585 4,758 3,816 4,319 3,816 4, YES YES 53, , S 11/18/ Block Sepulveda Boulevard Between Machado Road And Lucerne Avenue 2,625 4,676 1,632 3,991 1,632 3, NO YES 985, , N 11/18/2010 Sepulveda Boulevard Between Culver Boulevard And Washington Boulevard 2,649 3,272 3,555 4,719 3,555 4, , YES YES 821,164 2,092, S 11/18/2010 Sepulveda Boulevard Between Culver Boulevard And Washington Boulevard 2,246 4,248 1,557 4,160 1,557 4, YES YES 474,610 7, E 11/18/2010 Washington Boulevard Between Elenda Street And Girard Avenue 3,696 4,764 2,813 3,490 2,813 3, , YES YES 779,857 1,622, W 11/18/2010 Washington Boulevard Between Elenda Street And Girard Avenue 3,110 5,390 1,697 3,862 1,697 3,862 1,413 1, NO NO 1,996,954 2,334, E 11/18/2010 Culver Boulevard Between Elenda Street And Coombs Avenue 3,059 4,053 4,077 4,944 4,077 4,944-1, YES YES 1,036, , W 11/18/2010 Culver Boulevard Between Elenda Street And Coombs Avenue 2,627 4,209 2,489 4,466 2,489 4, YES YES 19,097 66, E 11/18/ Block Jefferson Boulevard Between Cota Street And Kinston Avenue 3,274 4,502 3,604 4,495 3,604 4, YES YES 108, W 11/18/ Block Jefferson Boulevard Between Cota Street And Kinston Avenue 2,993 4,744 2,920 4,344 2,920 4, YES YES 5, , E 11/18/ Block Jefferson Boulevard Between Duquesne Avenue And Rodeo Road 3,515 5,947 2,889 5,434 2,889 5, YES YES 392, , W 11/18/ Block Jefferson Boulevard Between Duquesne Avenue And Rodeo Road 3,454 4,756 3,933 3,497 3,933 3, , YES YES 229,561 1,584, N 11/18/ Block Overland Avenue Between Farragut Drive And Garfield Avenue 3,659 4,786 3,910 4,433 3,910 4, YES YES 63, , S 11/18/ Block Overland Avenue Between Farragut Drive And Garfield Avenue 3,088 5,226 2,530 5,464 2,530 5, YES YES 311,427 56, N 11/18/2010 La Cienega Boulevard Between Stocker Streeet And Fairfax Avenue 6,642 7,696 6,599 8,527 6,599 8, YES YES 1, , S 11/18/2010 La Cienega Boulevard Between Stocker Streeet And Fairfax Avenue 5,735 10,769 6,307 10,738 6,307 10, YES YES 326, N 11/18/ Block 7th Street Between Montana Avenue And San Vicente Boulevard 840 1, , , YES YES 5,330 7, S 11/18/ Block 7th Street Between Montana Avenue And San Vicente Boulevard 1,177 1, NO YES 206, , E 11/18/ Block Montana Avenue Between 7th Street And 14th Street 1,454 2,726 1,673 2,777 1,673 2, YES YES 48,070 2, W 11/18/ Block Montana Avenue Between 7th Street And 14th Street 1,730 2,062 1,305 2,355 1,305 2, YES YES 181,041 85, E 11/18/ Block San Vicente Avenue Between 7th Street And 14th Street 1,836 2,766 2,610 3,455 2,610 3, YES YES 599, , W 11/18/ Block San Vicente Avenue Between 7th Street And 14th Street 1,705 2,938 2,284 3,245 2,284 3, YES YES 334,866 94, N 11/18/ Block 14th Street Between Montana Avenue And San Vicente Boulevard S 11/18/ Block 14th Street Between Montana Avenue And San Vicente Boulevard YES YES 3,435 98, N 11/18/ Block 26th Street Between Montana Avenue And San Vicente Boulevard 779 1,628 1,489 2,642 1,489 2, , NO YES 503,688 1,028, S 11/18/ Block 26th Street Between Montana Avenue And San Vicente Boulevard 1,238 1,304 1,794 2,400 1,794 2, , YES NO 308,897 1,201, E 11/18/ Block Montana Avenue Between 26th Street And Bundy Drive 1,626 2,554 1,151 2,393 1,151 2, YES YES 225,780 25, W 11/18/ Block Montana Avenue Between 26th Street And Bundy Drive 938 2, , , YES NO , E 11/18/ Block Olympic Boulevard Between Avenue Of The Stars And Beverwil Drive 4,342 7,434 6,556 7,862 6,556 7,862-2, NO YES 4,899, , W 11/18/ Block Olympic Boulevard Between Avenue Of The Stars And Beverwil Drive 5,715 9,153 5,164 10,261 5,164 10, , YES YES 303,291 1,226, E 11/18/2010 Wilshire Boulevard Between Comstock Avenue And Santa Monica Boulevard 5,617 9,669 5,379 7,965 5,379 7, , YES YES 56,419 2,904, W 11/18/2010 Wilshire Boulevard Between Comstock Avenue And Santa Monica Boulevard 7,279 9,284 5,893 7,212 5,893 7,212 1,386 2, YES NO 1,919,912 4,292, N 11/18/ Block Beverwill Drive Between Olympic Boulevard And Wilshire Boulevard 4,084 4,358 3,008 3,640 3,008 3,640 1, NO YES 1,157, , S 11/18/ Block Beverwill Drive Between Olympic Boulevard And Wilshire Boulevard 2,511 5,731 1,860 4,300 1,860 4, , YES YES 424,275 2,046, N 11/18/ Block Beverly Boulevard Between Santa Monica Boulevard And Sunset Boulevard 592 1, , , YES YES 6, , S 11/18/ Block Beverly Boulevard Between Santa Monica Boulevard And Sunset Boulevard 1,424 1,020 1,905 1,953 1,905 1, YES NO 231, , E 11/18/ Block Burton Way Between Beverly Drive And Doheny Drive 2,468 7,128 2,000 5,484 2,000 5, , YES YES 218,617 2,702, W 11/18/ Block Burton Way Between Beverly Drive And Doheny Drive 3,641 3,914 3,569 3,576 3,569 3, YES YES 5, , E 11/18/2010 Santa Monica Boulevard Between Beverly Drive And Beverly Boulevard 3,819 7,406 3,413 6,475 3,413 6, YES YES 164, , W 11/18/2010 Santa Monica Boulevard Between Beverly Drive And Beverly Boulevard 5,007 5,321 5,553 6,654 5,553 6, , YES YES 297,725 1,777, N 12/31/2008 Route 1 - Los Angeles, North Of 98th Str 11,713 14, S 12/31/2008 Route 1 - Los Angeles, North Of 98th Str 6,733 12, N 12/31/2008 Route 1 - Santa Monica, Mcclure Tunnel 7,530 10,984 5,977 8,925 5,977 8,925 1,553 2, YES YES 2,412,643 4,238, S 12/31/2008 Route 1 - Santa Monica, Mcclure Tunnel 8,212 11,354 9,438 8,838 9,438 8,838-1,226 2, YES NO 1,502,379 6,328, E 12/31/2008 Route 10 - East Of Lincoln Blvd 12,037 18,567 8,896 9,187 8,896 9,187 3,141 9, NO NO 9,865,924 87,980, W 12/31/2008 Route 10 - East Of Lincoln Blvd 14,330 17,895 11,504 13,055 11,504 13,055 2,826 4, NO NO 7,986,504 23,422, E 12/31/2008 Route 10 - East Of Cloverfield Blvd 13,933 22,187 14,899 21,676 14,899 21, YES YES 932, , W 12/31/2008 Route 10 - East Of Cloverfield Blvd 15,938 19,540 16,263 13,769 16,263 13, , YES NO 105,472 33,306, E 12/31/2008 Route 10 - East Of Bundy Blvd 17,482 28,881 16,207 21,479 16,207 21,479 1,275 7, YES NO 1,625,431 54,785, W 12/31/2008 Route 10 - East Of Bundy Blvd 23,611 25,791 18,888 16,716 18,888 16,716 4,723 9, NO NO 22,302,602 82,359, E 12/31/2008 Route 10 - East Of ,573 31,655 14,884 21,862 14,884 21,862 4,689 9, NO NO 21,990,090 95,899, W 12/31/2008 Route 10 - East Of ,942 28,745 25,191 29,382 25,191 29,382-3, YES YES 10,553, , E 12/31/2008 Route 10 - At Palms Blvd 22,209 35,916 19,572 29,553 19,572 29,553 2,637 6, YES NO 6,954,847 40,490, W 12/31/2008 Route 10 - At Palms Blvd 24,244 31,099 23,106 28,833 23,106 28,833 1,138 2, YES YES 1,296,174 5,134, E 12/31/2008 Route 10 - West Of La Cienega 22,689 36,624 18,876 29,123 18,876 29,123 3,813 7, NO NO 14,538,441 56,268, W 12/31/2008 Route 10 - West Of La Cienega 24,180 30,817 20,713 27,978 20,713 27,978 3,467 2, NO YES 12,022,641 8,060, E 12/31/2008 Route W/o Nash St 4,609 8,142 4,448 9,223 4,448 9, , YES YES 25,913 1,167, W 12/31/2008 Route W/o Nash St 9,122 11,068 9,209 8,905 9,209 8, , YES YES 7,629 4,680, E 12/31/2008 Route E/o Jct Rte ,203 27,816 16,483 27,269 16,483 27, YES YES 78, , W 12/31/2008 Route E/o Jct Rte ,711 23,997 24,281 22,528 24,281 22,528-4,570 1, NO YES 20,883,086 2,159, E 12/31/2008 Route E/o Crenshaw Blvd 19,524 24,489 21,689 33,783 21,689 33,783-2,165-9, YES NO 4,687,181 86,373, W 12/31/2008 Route E/o Crenshaw Blvd 20,597 21,805 22,843 26,533 22,843 26,533-2,246-4, YES NO 5,044,865 22,354, E 12/31/2008 Route 2 - Bundy Drive 2,764 6, W 12/31/2008 Route 2 - Bundy Drive 3,130 4, N 12/31/2008 Route S/o Jct Rte ,460 25,404 22,632 26,620 22,632 26, , YES YES 29,492 1,477, S 12/31/2008 Route S/o Jct Rte ,297 27,824 17,475 24,817 17,475 24,817 3,822 3, NO YES 14,610,358 9,039, N 12/31/2008 Route S/o Florence 28,547 35,992 21,311 28,052 21,311 28,052 7,236 7, NO NO 52,357,024 63,042, S 12/31/2008 Route N/o Florence 24,554 37,500 22,429 34,143 22,429 34,143 2,125 3, YES YES 4,513,756 11,268, N 12/31/2008 Route S/o Jct Rte Centinella 27,519 35,215 21,805 31,786 21,805 31,786 5,714 3, NO YES 32,645,733 11,755, S 12/31/2008 Route S/o Jct Rte Centinella 25,585 38,675 26,268 35,578 26,268 35, , YES YES 467,028 9,594, N 12/31/2008 Route North Of Venice Boulevard 26,657 34,419 27,731 27,450 27,731 27,450-1,074 6, YES NO 1,152,923 48,567, S 12/31/2008 Route North Of Venice Boulevard 1016 N 12/31/2008 Route Los Angeles, Mulholland Drive 21,657 46,034 23,218 39,346 23,218 39,346-1,561 6, YES NO 2,436,849 44,727, S 12/31/2008 Route Los Angeles, Mulholland Drive 34,776 28,749 26,855 29,143 26,855 29,143 7, NO YES 62,738, ,
119 Static Highway Validation - Highway Links # Direction Count Date Location Model AM Model PM Count AM Count PM ALL Count AM ALL Count PM Delta AM Delta PM Delta/Count AM Delta/Count PM Max Dev AM Max Dev PM Within Dev AM Within Dev PM Dif Squared AM Dif Squared PM Pass AM? Pass PM? Total 1017 E 12/31/2008 Route 90 - West Of Jct. Rte. 405, Inglewo 6,265 9,551 8,129 11,616 8,129 11,616-1,864-2, YES YES 3,475,492 4,264, W 12/31/2008 Route 90 - West Of Jct. Rte. 405, Inglewo 8,017 11,051 8,743 11,012 8,743 11, YES YES 527,322 1, Total 2,409,687 3,521,927 2,295,229 3,265, , , % 82%
120 Static Highway Validation - Screenlines Screenline # DirectionSL Sum of Model AM Sum of Model PM Sum of Count AM Sum of Count PM Delta AM Delta PM Delta/Count AM Delta/Count PM Max Dev AM Max Dev PM Within Dev AM Within Dev PM Dif Squared AM Dif Squared PM Pass AM? Pass PM? Total 1 E 18,540 32,181 18,081 29, , YES YES 210,526 5,523, W 14,282 20,730 12,023 20,307 2, YES YES 5,104, , E 50,952 63,520 51,486 61, , YES YES 285,129 5,367, W 34,456 62,391 40,794 60,203-6,338 2, YES YES 40,165,923 4,788, E 17,345 21,444 19,057 22,484-1,712-1, YES YES 2,929,760 1,080, W 9,586 15,452 10,316 15, YES YES 532,811 1, E 14,099 29,541 12,648 27,018 1,451 2, YES YES 2,105,750 6,366, W 19,827 21,638 17,928 16,631 1,899 5, YES YES 3,604,804 25,071, E 8,643 14,616 6,496 11,728 2,147 2, YES YES 4,611,631 8,340, W 12,353 13,232 10,749 9,644 1,604 3, YES YES 2,572,458 12,876, E 1,213 4,495 1,679 4, YES YES 217,521 9, W 3,329 2,143 2,514 2, YES YES 664, , N 2,390 3,701 2,433 3, YES YES 1,826 12, S 2,886 4,223 2,019 3, YES YES 751, , N 1,038 1, YES YES 31,556 65, S 565 1, , YES YES , N 21,043 19,943 20,097 21, , YES YES 895,751 1,549, S 14,874 33,593 11,959 32,229 2,915 1, YES YES 8,496,436 1,860, N 14,424 20,478 15,094 22, , YES YES 449,471 3,456, S 13,342 20,001 12,718 23, , YES YES 389,547 11,745, N 21,020 25,279 19,150 25,556 1, YES YES 3,495,331 76, S 16,920 30,998 13,354 24,095 3,566 6, YES YES 12,718,855 47,656, Total % 100%
121 Raw SCAG Static Transit Validation - Summary Carrier Number of Lines Raw SCAG 2003 Transit Validation (Routes with Counts) Peak Period (7-Hour) Model Peak Period (7-Hour) Count Model - Count Model/Count % Difference Threshold 1 Metro , ,211 23, % -- Santa Monica Big Blue Bus 25 34,878 29,255 5, % -- Torrance Transit 2 1,554 1, % -- Total , ,495 29, % 10.0% 1. Static Validation Criteria and Thresholds, 2010 California Regional Transportation Plan Guidelines Carrier Number of Lines Raw SCAG 2003 Transit Validation (Westside Study Area Only) Peak Period (7-Hour) Model Peak Period (7-Hour) Count Model - Count Model/Count % Difference Threshold 1 Metro , ,875 1, % -- Santa Monica Big Blue Bus 25 34,878 29,255 5, % -- Torrance Transit 2 1,554 1, % -- Total , ,159 7, % 10.0% 1. Static Validation Criteria and Thresholds, 2010 California Regional Transportation Plan Guidelines Carrier Number of Lines Peak Period (7-Hour) Model Raw SCAG 2003 Transit Validation (By Route Group) Peak Period (7-Hour) Count Model - Count Model/Count % Difference Threshold 1 Local Bus , ,987 6, % 20.0% Express Bus 39 89,777 66,508 23, % 20.0% Transitway % Total , ,495 29, % 10.0% 1. Static Validation Criteria and Thresholds, 2010 California Regional Transportation Plan Guidelines Carrier Number of Lines Raw SCAG 2003 Transit Validation (Westside Study Area Only - By Route Group) Peak Period (7-Hour) Model Peak Period (7-Hour) Count Model - Count Model/Count % Difference Threshold 1 Local Bus , ,173 5, % 20.0% Express Bus 10 29,332 27,985 1, % 20.0% Transitway % Total , ,159 7, % 10.0% 1. Static Validation Criteria and Thresholds, 2010 California Regional Transportation Plan Guidelines
122 Static Transit Validation - Summary Carrier Number of Lines Westside Model 2008 Transit Validation (Routes with Counts) Peak Period (7-Hour) Model Peak Period (7-Hour) Count Model - Count Model/Count % Difference Threshold 1 Metro , ,530-3, % -- Santa Monica Big Blue Bus 25 28,965 29, % -- Torrance Transit 2 1,275 1, % -- Total , ,814-3, % 10.0% 1. Static Validation Criteria and Thresholds, 2010 California Regional Transportation Plan Guidelines Carrier Number of Lines Westside Model 2008 Transit Validation (Westside Study Area Only) Peak Period (7-Hour) Model Peak Period (7-Hour) Count Model - Count Model/Count % Difference Threshold 1 Metro , ,466 1, % -- Santa Monica Big Blue Bus 25 28,965 29, % -- Torrance Transit 2 1,275 1, % -- Total , ,750 1, % 10.0% 1. Static Validation Criteria and Thresholds, 2010 California Regional Transportation Plan Guidelines Carrier Number of Lines Westside Model 2008 Transit Validation (By Route Group) Peak Period (7-Hour) Model Peak Period (7-Hour) Count Model - Count Model/Count % Difference Threshold 1 Local Bus , ,578-8, % 20.0% Express Bus 39 70,593 66,508 4, % 20.0% Transitway 2 16,957 15,728 1, % 20.0% Total , ,814-3, % 10.0% 1. Static Validation Criteria and Thresholds, 2010 California Regional Transportation Plan Guidelines Carrier Number of Lines Westside Model 2008 Transit Validation (Westside Study Area Only - By Route Group) Peak Period (7-Hour) Model Peak Period (7-Hour) Count Model - Count Model/Count % Difference Threshold 1 Local Bus , ,765 2, % 20.0% Express Bus 10 27,682 27, % 20.0% Transitway % Total , ,750 1, % 10.0% 1. Static Validation Criteria and Thresholds, 2010 California Regional Transportation Plan Guidelines
123 Static Transit Validation - Transit Routes Study Area? Carrier Line Line # Lookup AM PP (3-Hour) Boardings PM PP (4-Hour) Boardings Peak Period (7-Hour) Boardings Model Peak Period (7-Hour) Peak Period Count (7-Hour) Delta Delta Squared Notes %RMSE 66% Corr Metro 102E 102 MT_ ,265 0 Metro 102W 102 MT_ ,528 0 Metro 105N 105 MT_ ,837 2,663 5,491 5, ,843 0 Metro 105S 105 MT_105 1,076 1,684 2,760 5,491 5, ,579 1 Metro 108E 108 MT_108 2,220 2,459 4,679 3,994 4, ,553 1 Metro 108W 108 MT_108 1,822 2,738 4,561 3,994 4, ,046 0 Metro 10E 10 MT_10 1,366 2,105 3,471 1,631 3,471-1,840 3,386,119 0 Metro 10W 10 MT_10 1,894 1,921 3,815 1,631 3,815-2,184 4,768,725 1 Metro 110E 110 MT_ ,820 2,608 3,525 2, ,980 1 Metro 110W 110 MT_110 1,151 1,395 2,546 3,525 2, ,559 1 Metro 111E 111 MT_111 1,268 2,039 3,307 4,877 3,307 1,569 2,463,249 1 Metro 111W 111 MT_111 1,432 2,006 3,438 4,877 3,438 1,438 2,069,207 1 Metro 115E 115 MT_115 1,095 2,222 3,317 6,402 3,317 3,086 9,520,742 1 Metro 115W 115 MT_115 1,862 1,526 3,389 6,402 3,389 3,013 9,080,399 1 Metro 117E 117 MT_ ,556 2,236 1,969 2, ,323 1 Metro 117W 117 MT_117 1,015 1,230 2,245 1,969 2, ,991 1 Metro 120E 120 MT_ ,265 1 Metro 120W 120 MT_ ,314 0 Metro 121E 121 MT_ ,868 0 Metro 121W 121 MT_ ,977 0 Metro 126E 126 MT_ ,282 0 Metro 126W 126 MT_ ,161 0 Metro 127E 127 MT_ , ,292 1,668,034 0 Metro 127W 127 MT_ , ,292 1,670,360 0 Metro 14N 14 MT_14 2,056 2,281 4,337 4,493 4, ,173 0 Metro 14S 14 MT_14 1,515 2,749 4,264 4,493 4, ,430 0 Metro 150E 150 MT_ ,723 2,680 1,466 2,680-1,214 1,474,237 0 Metro 150W 150 MT_150 1,201 1,580 2,780 1,466 2,780-1,314 1,726,810 0 Metro 152E 152 MT_152 1,351 2,141 3,492 3,824 3, ,755 0 Metro 152W 152 MT_152 1,754 1,866 3,620 3,824 3, ,656 0 Metro 154E 154 MT_ , ,236 1,528,785 0 Metro 154W 154 MT_ , ,204 1,448,750 Metro 155E 155 MT_ included as 92 Metro 155W 155 MT_ included as 92 0 Metro 156N 156 MT_ , ,023 16,187,679 0 Metro 156S 156 MT_ , ,067 16,538,793 0 Metro 158E 158 MT_ , ,935 0 Metro 158W 158 MT_ , ,137 0 Metro 161E 161 MT_ ,069 0 Metro 161W 161 MT_ ,408 0 Metro 163E 163 MT_163 1,095 1,566 2,660 2,687 3, ,196 0 Metro 163W 163 MT_163 1,131 1,598 2,729 2,687 3, ,821 0 Metro 164E 164 MT_ ,389 1,974 3,439 1,974 1,465 2,147,337 0 Metro 164W 164 MT_164 1,036 1,000 2,035 3,439 2,035 1,404 1,970,316 0 Metro 165E 165 MT_ ,794 2,604 2,081 2, ,686 0 Metro 165W 165 MT_165 1,197 1,241 2,438 2,081 2, ,199 0 Metro 166E 166 MT_ ,397 1,872 5,717 1,872 3,845 14,784,333 0 Metro 166W 166 MT_166 1, ,920 5,717 1,920 3,797 14,419,032 0 Metro 168E 168 MT_ ,483 0 Metro 168W 168 MT_ ,797 0 Metro 169E 169 MT_ , ,189 1,414,467 0 Metro 169W 169 MT_ , ,229 1,510,720 0 Metro 16E 16 MT_16 2,738 3,784 6,522 3,887 6,522-2,635 6,943,404 0 Metro 16W 16 MT_16 2,375 4,454 6,829 3,887 6,829-2,942 8,657,329 0 Metro 175E 175 MT_ ,694 0 Metro 175W 175 MT_ ,703 0 Metro 176E 176 MT_ , ,224 0 Metro 176W 176 MT_ , ,260 0 Metro 180E 180 MT_ ,486 2,184 3,431 5,415-1,985 3,939,074 0 Metro 180W 180 MT_ ,379 2,036 3,431 4,997-1,566 2,452,387 0 Metro 183E 183 MT_ , ,776 3,153,187 0 Metro 183W 183 MT_ , ,726 2,978,115
124 Static Transit Validation - Transit Routes Study Area? Carrier Line Line # Lookup AM PP (3-Hour) Boardings PM PP (4-Hour) Boardings Peak Period (7-Hour) Boardings Model Peak Period (7-Hour) Peak Period Count (7-Hour) Delta Delta Squared Notes %RMSE 66% Corr Metro 18E 18 MT_18 3,268 3,486 6,754 3,909 6,754-2,845 8,095,206 0 Metro 18W 18 MT_18 1,492 4,256 5,748 3,909 5,748-1,839 3,382,316 0 Metro 190E 190 MT_ ,265 2,216 5,976 2,216 3,760 14,135,844 0 Metro 190W 190 MT_ ,028 1,976 5,976 1,976 4,000 15,998,132 0 Metro 200N 200 MT_200 1,287 2,586 3, ,873-3,271 10,700,606 0 Metro 200S 200 MT_200 1,451 2,259 3, ,709-3,107 9,656,420 0 Metro 201N 201 MT_ Metro 201S 201 MT_ Metro 202N 202 MT_ , ,600 2,558,528 0 Metro 202S 202 MT_ , ,560 2,433,101 0 Metro 204N 204 MT_204 2,588 3,417 6,005 3,456 6,005-2,549 6,497,794 0 Metro 204S 204 MT_204 1,512 4,686 6,198 3,456 6,198-2,741 7,514,600 0 Metro 206N 206 MT_206 1,708 2,152 3,860 2,842 3,860-1,017 1,035,225 0 Metro 206S 206 MT_206 1,489 2,450 3,938 2,842 3,938-1,096 1,201,348 0 Metro 207N 207 MT_207 2,584 3,521 6,104 5,030 8,961-3,931 15,449,809 0 Metro 207S 207 MT_207 1,888 4,226 6,113 5,030 8,929-3,899 15,202,392 0 Metro 209N 209 MT_ ,022 0 Metro 209S 209 MT_ ,924 1 Metro 20E 20 MT_20 1,033 2,525 3,557 4,544 3, ,021 1 Metro 20W 20 MT_20 1,816 2,125 3,942 4,544 3, ,398 0 Metro 210N 210 MT_210 1,215 1,806 3,021 4,975 5, ,317 0 Metro 210S 210 MT_ ,961 2,933 4,975 5, ,871 0 Metro 211N 211 MT_ ,388 0 Metro 211S 211 MT_ ,105 0 Metro 212N 212 MT_212 1,516 1,589 3,104 2,983 3, ,797 0 Metro 212S 212 MT_ ,291 3,156 2,983 3, ,152 0 Metro 217N 217 MT_ ,505 2,056 1,576 2, ,317 0 Metro 217S 217 MT_ ,444 2,074 1,576 2, ,017 1 Metro 220N 220 MT_ ,256 1 Metro 220S 220 MT_ ,179 Metro 222N 222 MT_ included as 163 Metro 222S 222 MT_ included as 163 Metro 224N 224 MT_224 1,107 1,464 2,571 included as 94 Metro 224S 224 MT_224 1,177 1,242 2,420 included as 94 0 Metro 230E 230 MT_ ,426 1,377 1, ,395 0 Metro 230W 230 MT_ ,543 1,377 1, ,470 0 Metro 233N 233 MT_ ,488 2,002 2,402 2, ,902 0 Metro 233S 233 MT_ ,186 1,878 2,402 1, ,866 0 Metro 234N 234 MT_ ,053 1,622 2,538 2, ,554 0 Metro 234S 234 MT_ ,583 2,538 2, ,920 0 Metro 236E 236 MT_ , ,408 0 Metro 236W 236 MT_ , ,837 0 Metro 243E 243 MT_ , ,071 0 Metro 243W 243 MT_ , ,681 0 Metro 245E 245 MT_ , , ,633 0 Metro 245W 245 MT_ , , ,175 0 Metro 246N 246 MT_ ,388 0 Metro 246S 246 MT_ ,490 0 Metro 251N 251 MT_ ,324 2,157 3,256 3, ,358 0 Metro 251S 251 MT_ ,219 2,164 3,256 3, ,226 0 Metro 252N 252 MT_ , ,361 1,852,867 0 Metro 252S 252 MT_ , ,471 2,164,431 0 Metro 258N 258 MT_ ,363 0 Metro 258S 258 MT_ ,141 0 Metro 260N 260 MT_260 1,289 1,593 2,882 6,784 4,120 2,664 7,095,042 0 Metro 260S 260 MT_260 1,042 1,768 2,809 6,784 4,021 2,762 7,631,141 0 Metro 265N 265 MT_ ,706 0 Metro 265S 265 MT_ ,352 0 Metro 267N 267 MT_ , ,304 0 Metro 267S 267 MT_ , ,285 0 Metro 268N 268 MT_ , ,496 2,236,658 0 Metro 268S 268 MT_ , ,430 2,045,604
125 Static Transit Validation - Transit Routes Study Area? Carrier Line Line # Lookup AM PP (3-Hour) Boardings PM PP (4-Hour) Boardings Peak Period (7-Hour) Boardings Model Peak Period (7-Hour) Peak Period Count (7-Hour) Delta Delta Squared Notes %RMSE 66% Corr Metro 26N 26 MT_260 3,249 4,706 7,955 6,784 7,955-1,171 1,372,056 0 Metro 26S 26 MT_260 3,977 4,588 8,566 6,784 8,566-1,782 3,174,982 0 Metro 287N 287 MT_ ,890 0 Metro 287S 287 MT_ ,427 1 Metro 28E 28 MT_ ,339 2,057 1,997 4,474-2,477 6,136,857 1 Metro 28W 28 MT_ ,149 2,017 1,997 4,473-2,476 6,128,932 Metro 290N 290 MT_ small shuttle Metro 290S 290 MT_ small shuttle Metro 292N 292 MT_ no longer exists Metro 292S 292 MT_ no longer exists 1 Metro 2E 2 MT_2 1,255 3,557 4,812 6,436 4,812 1,624 2,636,642 1 Metro 2W 2 MT_2 2,624 3,184 5,809 6,436 5, ,096 1 Metro 305N 305 MT_ ,167 1 Metro 305S 305 MT_ ,893 0 Metro 30E 30 MT_30 1,328 1,984 3,312 2,123 5,004-2,880 8,296,065 0 Metro 30W 30 MT_30 1,085 2,199 3,284 2,123 4,976-2,852 8,136,123 1 Metro 33E 33 MT_ ,848 2,621 2,030 2, ,894 1 Metro 33W 33 MT_33 1,497 1,349 2,845 2,030 2, ,669 0 Metro 344N 344 MT_ , ,795 3,223,134 0 Metro 344S 344 MT_ , ,616 2,612,778 1 Metro 35E 35 MT_ ,157 2,147 1,690 2, ,062 1 Metro 35W 35 MT_ ,235 1,964 1,690 1, ,875 0 Metro 38E 38 MT_ ,358 1,636 1, ,333 0 Metro 38W 38 MT_ ,534 1,636 1, ,483 1 Metro 40N 40 MT_40 1,557 2,128 3,685 3,119 3, ,323 1 Metro 40S 40 MT_40 1,385 2,515 3,901 3,119 3, ,479 1 Metro 42N 42 MT_ , , ,318 1 Metro 42S 42 MT_ , , ,291 1 Metro 439N 439 MT_ ,697 1 Metro 439S 439 MT_ ,255 Metro 442N 442 MT_ small shuttle Metro 442S 442 MT_ small shuttle 0 Metro 445N 445 MT_ ,598 0 Metro 445S 445 MT_ ,939 Metro 450C 450 MT_ only operates part of the day 0 Metro 45N 45 MT_45 2,384 2,778 5,162 2,242 5,162-2,920 8,527,051 0 Metro 45S 45 MT_45 2,023 3,619 5,642 2,242 5,642-3,399 11,555,319 0 Metro 460E 460 MT_ , , ,396 0 Metro 460W 460 MT_ , , ,331 0 Metro 485N 485 MT_ , ,922 3,692,952 0 Metro 485S 485 MT_ , ,798 3,232,464 0 Metro 487E 487 MT_ ,229 1,485 1, ,678 0 Metro 487W 487 MT_ ,207 1,485 1, ,382 1 Metro 4E 4 MT_4 1,374 2,644 4,018 6,251 7,474-1,223 1,495,607 1 Metro 4W 4 MT_4 1,461 2,533 3,994 6,251 7,363-1,112 1,236,433 1 Metro 534E 534 MT_ ,421 1 Metro 534W 534 MT_ ,852 0 Metro 53N 53 MT_53 1,390 1,316 2,705 2,598 2, ,564 0 Metro 53S 53 MT_ ,015 3,014 2,598 3, ,251 0 Metro 550N 550 MT_ , ,764 3,112,449 0 Metro 550S 550 MT_ , ,696 2,877,140 0 Metro 55N 55 MT_55 1,747 1,133 2,880 2,723 2, ,725 0 Metro 55S 55 MT_ ,925 2,636 2,723 2, ,544 0 Metro 60N 60 MT_60 1,992 2,826 4,818 5,541 7,357-1,815 3,295,679 0 Metro 60S 60 MT_60 1,940 3,333 5,273 5,541 7,662-2,121 4,499,492 Metro 611C 611 MT_ small shuttle Metro 611CC 611 MT_ small shuttle Metro 612C 612 MT_ small shuttle Metro 612CC 612 MT_ small shuttle 0 Metro 620CC 620 MT_ ,633 Metro 62E 62 MT_ ,303 not in model Metro 62W 62 MT_ ,279 not in model
126 Static Transit Validation - Transit Routes Study Area? Carrier Line Line # Lookup AM PP (3-Hour) Boardings PM PP (4-Hour) Boardings Peak Period (7-Hour) Boardings Model Peak Period (7-Hour) Peak Period Count (7-Hour) Delta Delta Squared Notes %RMSE 66% Corr Metro 645E 645 MT_ ,778 0 Metro 645W 645 MT_ ,008 0 Metro 665E 665 MT_ ,357 0 Metro 665W 665 MT_ ,991 0 Metro 66E 66 MT_66 4,201 2,349 6,550 4,000 6,550-2,549 6,499,555 0 Metro 66W 66 MT_66 1,498 4,716 6,214 4,000 6,214-2,214 4,902,338 0 Metro 685N 685 MT_ ,236 0 Metro 685S 685 MT_ ,234 Metro 687N 687 MT_ included as 30 Metro 687S 687 MT_ included as 30 Metro 704E 704 MT_ ,657 3,456 included as 4 Metro 704W 704 MT_704 1,765 1,605 3,369 included as 4 Metro 705N 705 MT_705 1,262 1,356 2,618 included as 105 Metro 705S 705 MT_ ,521 2,408 included as Metro 70E 70 MT_70 1,169 1,606 2,775 3,407 5,229-1,822 3,320,837 0 Metro 70W 70 MT_70 1,241 1,393 2,634 3,407 4,871-1,464 2,144,516 Metro 710N 710 MT_ ,271 2,131 included as 210 Metro 710S 710 MT_ ,319 2,186 included as Metro 711E 711 MT_711: Flo 484 1,006 1,490 2,091 1, ,527 0 Metro 711W 711 MT_711: Flo ,447 2,091 1, ,601 Metro 714E 714 MT_ ,102 no longer exists Metro 714W 714 MT_ ,181 no longer exists Metro 715E 715 MT_ ,219 no longer exists Metro 715W 715 MT_ ,394 no longer exists 0 Metro 71E 71 MT_ ,234 0 Metro 71W 71 MT_ ,170 1 Metro 720E 720 MT_720: Wi 1,811 6,697 8,507 8,569 8, ,820 1 Metro 720W 720 MT_720: Wi 5,875 3,671 9,546 8,569 9, ,911 Metro 728E 728 MT_ ,683 2,417 included as 28 Metro 728W 728 MT_728 1,294 1,161 2,455 included as 28 Metro 730E 730 MT_ ,295 included as 30 Metro 730W 730 MT_ ,267 included as 30 Metro 733E 733 MT_ ,141 2,959 included as 33 Metro 733W 733 MT_733 1,671 1,535 3,206 included as 33 Metro 734N 734 MT_ ,070 included as 234 Metro 734S 734 MT_ ,165 included as 234 Metro 740N 740 MT_740 1,267 1,446 2,713 included as 40 Metro 740S 740 MT_ ,753 2,531 included as 40 Metro 741N 741 MT_ not in model Metro 741S 741 MT_ not in model 0 Metro 745N 745 MT_745: So 1, , ,618-2,009 4,035,398 0 Metro 745S 745 MT_745: So 581 1,580 2, ,161-1,551 2,406,935 0 Metro 750E 750 MT_750: Ve 442 1,084 1, , ,433 0 Metro 750W 750 MT_750: Ve 1, , ,059-1,334 1,778,677 Metro 751N 751 MT_ ,023 1,643 included as 251 Metro 751S 751 MT_ ,688 included as 251 Metro 753N 753 MT_ ,002 no longer exists Metro 753S 753 MT_ no longer exists 0 Metro 754N 754 MT_754: Ve 3,013 3,636 6,650 3,580 6,650-3,069 9,420,946 0 Metro 754S 754 MT_754: Ve 2,284 3,941 6,225 3,580 6,225-2,645 6,994,734 Metro 757N 757 MT_757 1,237 1,620 2,856 included as 207 Metro 757S 757 MT_757 1,009 1,806 2,816 included as 207 Metro 760N 760 MT_760 1,238 1,302 2,539 included as 60 Metro 760S 760 MT_ ,539 2,389 included as 60 1 Metro 761N 761 MT_761: Va 660 2,171 2,832 3,000 2, ,257 1 Metro 761S 761 MT_761: Va 1,875 1,345 3,220 3,000 3, ,622 Metro 762N 762 MT_ ,238 included as 260 Metro 762S 762 MT_ ,212 included as Metro 76E 76 MT_ ,547 2,463 3,009 2, ,318 0 Metro 76W 76 MT_76 1,175 1,224 2,399 3,009 2, ,203 Metro 770E 770 MT_ ,540 2,454 included as 70 Metro 770W 770 MT_770 1,118 1,119 2,237 included as 70
127 Static Transit Validation - Transit Routes Study Area? Carrier Line Line # Lookup AM PP (3-Hour) Boardings PM PP (4-Hour) Boardings Peak Period (7-Hour) Boardings Model Peak Period (7-Hour) Peak Period Count (7-Hour) Delta Delta Squared Notes %RMSE 66% Corr 0.78 Metro 780E 780 MT_780 1,311 1,921 3,231 included as 180 Metro 780W 780 MT_780 1,216 1,744 2,961 included as Metro 78E 78 MT_ ,993 2,971 1,746 2,971-1,225 1,499,733 0 Metro 78W 78 MT_78 1,436 1,418 2,854 1,746 2,854-1,108 1,227,522 0 Metro 794N 794 MT_ ,641 1,688 1, ,238 0 Metro 794S 794 MT_ ,702 1,688 1, Metro 81N 81 MT_81 1,683 2,502 4,185 4,752 4, ,712 0 Metro 81S 81 MT_81 1,652 2,470 4,121 4,752 4, ,044 0 Metro 83N 83 MT_ ,175 1,416 1, ,092 0 Metro 83S 83 MT_ ,125 1,416 1, ,810 0 Metro 84N 84 MT_ ,103 2, ,025-1,393 1,941,274 0 Metro 84S 84 MT_ ,334 2, ,141-1,509 2,277,371 0 Metro 901E 901 MT_Orange 2,550 3,350 5,900 8,478 7, ,530 0 Metro 901W 901 MT_Orange 2,581 3,422 6,003 8,478 7, ,623 Metro 902N 902 MT_ ,280 1,985 included as 901 Metro 902S 902 MT_ ,840 included as Metro 90N 90 MT_ ,038 1,713 1,372 1, ,436 0 Metro 90S 90 MT_ ,446 1,372 1, ,480 Metro 910N 910 MT_ ,632 2,346 not in model Metro 910S 910 MT_910 1,529 1,007 2,535 not in model Metro 920E 920 MT_ ,044 not in model Metro 920W 920 MT_920 1, ,521 not in model 0 Metro 92N 92 MT_ ,394 2,651 1,566 1,086 1,178,744 0 Metro 92S 92 MT_ ,415 2,651 1,574 1,077 1,160,144 0 Metro 94N 94 MT_ ,000 1,775 4,854 4, ,222 0 Metro 94S 94 MT_ ,378 4,854 3,798 1,057 1,116,908 1 SM 1 EB 1 SM_ , ,105-1,637 2,679,730 1 SM 1 WB 1 SM_ , ,814-1,346 1,811,684 1 SM 2 NB 2 SM_ , , ,886 1 SM 2 SB 2 SM_ , , ,699 1 SM 3 Rapid NB 3 SM_ , ,169 1,367,675 1 SM 3 Rapid SB 3 SM_ , ,188 1,412,476 1 SM 3 NB 3 SM_ ,770 1,954 1, ,032 1 SM 3 SB 3 SM_ ,863 1,954 1, ,368 1 SM 4 EB 4 SM_ ,318 1 SM 4 WB 4 SM_ ,021 1 SM 5 EB 5 SM_ ,256 1 SM 5 WB 5 SM_ ,805 1 SM 7 Super EB 7 in model as 7 1 SM 7 Super WB 7 in model as 7 1 SM 7 EB 7 SM_ ,726 1,435 2,726-1,291 1,665,508 1 SM 7 WB 7 SM_ ,040 1,435 3,040-1,605 2,574,566 1 SM 8 EB 8 SM_ ,298 1,473 1, ,668 1 SM 8 WB 8 SM_ ,115 1,473 1, ,251 1 SM 9 NB 9 SM_ ,815 1 SM 9 SB 9 SM_ ,295 1 SM 10 EB 10 SM_ , ,652 2,730,404 1 SM 10 WB 10 SM_ , ,439 2,071,854 1 SM 11 Loop 11 SM_ SM 12 EB 12 SM_ ,378 1,819 1, ,389 1 SM 12 WB 12 SM_ ,708 1,819 1, ,298 1 SM 12 Super EB 12 in model as 12 1 SM 12 Super WB 12 in model as 12 1 SM 14 NB 14 SM_ , , ,509 1 SM 14 SB 14 SM_ , , ,321 1 TT 2 2 TT_ ,747 1 TT 8 8 TT_ ,828


128 APPENDIX I: PEAK PERIOD DYNAMIC MODEL VALIDATION RESULTS
129 Dynamic Validation - Land Use Productions and Attractions Scenario Period Productions Attractions Total Rate Peak (7-Hour) Add 10 Households Off-Peak (17-Hour) Daily Peak (7-Hour) Add 100 Households Off-Peak (17-Hour) Daily Peak (7-Hour) 18,464 6,183 24, Add 5,000 Households Off-Peak (17-Hour) 15,475 6,112 21, Daily 33,938 12,295 46, Peak (7-Hour) 36,930 12,368 49, Add 10,000 Households Off-Peak (17-Hour) 30,952 12,227 43, Daily 67,883 24,595 92, Note: The SCAG sponsored 2000 Regional Travel Survey shows an average of 7.3 person trips per household in Los Angeles County. Peak (7-Hour) Add 10 Jobs Off-Peak (17-Hour) Daily Peak (7-Hour) Add 100 Jobs Off-Peak (17-Hour) Daily , Peak (7-Hour) 6,866 19,589 26, Add 5,000 Jobs Off-Peak (17-Hour) 8,303 21,439 29, Daily 15,169 41,028 56, Peak (7-Hour) 13,716 39,010 52, Add 10,000 Jobs Off-Peak (17-Hour) 16,586 42,642 59, Daily 30,302 81, , Origins and Destinations - Peak Period (7-Hour) Scenario Period Origins Destinations Total Rate % of Person Trips AM (3-Hour) Add 10 Households PM (4-Hour) Peak (7-Hour) % AM (3-Hour) Add 100 Households PM (4-Hour) Peak (7-Hour) % AM (3-Hour) 5,850 1,780 7, Add 5,000 Households PM (4-Hour) 3,237 7,446 10, Peak (7-Hour) 9,087 9,226 18, % AM (3-Hour) 11,556 3,477 15, Add 10,000 Households PM (4-Hour) 6,294 14,675 20, Peak (7-Hour) 17,850 18,152 36, % Add 10 Jobs Add 100 Jobs Add 5,000 Jobs Add 10,000 Jobs AM (3-Hour) PM (4-Hour) Peak (7-Hour) % AM (3-Hour) PM (4-Hour) Peak (7-Hour) % AM (3-Hour) 1,713 4,208 5, PM (4-Hour) 7,351 4,567 11, Peak (7-Hour) 9,064 8,775 17, % AM (3-Hour) 3,151 8,098 11, PM (4-Hour) 13,900 8,445 22, Peak (7-Hour) 17,051 16,543 33, %
130 Origins and Destinations - Off-Peak Period (17-Hour) Scenario Period Origins Destinations Total Rate % of Person Trips MD (6-Hour) Add 10 Households NT (11-Hour) Off-Peak (17-Hour) % MD (6-Hour) Add 100 Households NT (11-Hour) Off-Peak (17-Hour) % MD (6-Hour) 4,476 4,059 8, Add 5,000 Households NT (11-Hour) 2,258 3,174 5, Off-Peak (17-Hour) 6,734 7,233 13, % MD (6-Hour) 8,829 7,976 16, Add 10,000 Households NT (11-Hour) 4,369 6,197 10, Off-Peak (17-Hour) 13,198 14,173 27, % Add 10 Jobs Add 100 Jobs Add 5,000 Jobs Add 10,000 Jobs MD (6-Hour) NT (11-Hour) Off-Peak (17-Hour) % MD (6-Hour) NT (11-Hour) Off-Peak (17-Hour) % MD (6-Hour) 6,375 6,865 13, NT (11-Hour) 2,809 1,960 4, Off-Peak (17-Hour) 9,183 8,825 18, % MD (6-Hour) 12,063 13,011 25, NT (11-Hour) 5,330 3,714 9, Off-Peak (17-Hour) 17,392 16,725 34, % Note: The MD (6-hour) and NT (11-hour) time-of-day factors were modified during the daily base year validation process, which occurred after the dynamic validation runs had been completed. Therefore, an additional run of the "Add 10,000 Households" scenario was performed with the modified time-of-day factors and used to develop factors for the other scenarios. Origins and Destinations - Daily Scenario Period Origins Destinations Total Rate % of Person Trips Add 10 Households Daily % Add 100 Households Daily % Add 5,000 Households Daily 15,821 16,459 32, % Add 10,000 Households Daily 31,048 32,325 63, % Note: The SCAG sponsored 2000 Regional Travel Survey shows an average of 4.3 vehicle trips per household in Los Angeles County and that 59% of person trips are vehicle trips. Add 10 Jobs Daily % Add 100 Jobs Daily % Add 5,000 Jobs Daily 18,247 17,600 35, % Add 10,000 Jobs Daily 34,443 33,268 67, %
131 Westside Household Trip Generation Survey LINK Average Income Average Auto Ownership Average Household Size AM PP Veh Trip Rate PM PP Veh Trip Rate Daily Veh Trip Rate Site Units Type Location Status 1 28 SF Palms Good 70, MF Westchester Alley 59, SF Westchester Good 77, SF Brentwood Good 127, MF Brentwood Vacancies 71, MF West LA Good 88, SF Cheviot Hills Good 138, MF Palms Alley 47, MF Mar Vista Alley 38, SF Mar Vista Good 69, Single-Family Average Multi-Family Average Total Average Average for Households with Average Income 40k to 80k Average Vehicle Trip Rate for TAZ 2302 Low Value High Value 1.5 Average Income $63,213 Average Auto Ownership Average Household Size
132 Dynamic Validation - Sensitivity to Density Total Daily Trips Trip Type Base Trips Trips Double Land Use Delta % of Base Vehicle Trips 18,682,696 36,192,162 17,509,467 94% Transit Person Trips 906,601 1,990,463 1,083, % Walk/Bike Person Trips 4,451,990 10,520,794 6,068, % Total 24,041,287 48,703,420 24,662, % Expected vehicle trip increase if model not sensitive to Density 37,365,392 Difference -1,173,229 Base Population 17,601,511 % Difference -3.1% Doubled Population 35,203,022 Elasticity D Elasticity Related to Density % of Trips By Trip Type Trip Type Base Trips Trips Double Land Use Delta % of Base Vehicle Trips 77.7% 74.3% -3.4% -- Transit Person Trips 3.8% 4.1% 0.3% -- Walk/Bike Person Trips 18.5% 21.6% 3.1% -- Total 100.0% 100.0% 0.0% --
133 Dynamic Validation - Sensitivity to Density for a Single Zone Total Daily Trips (TAZ 525 in Playa Vista) Trip Type Base Trips Trips Double Land Use Delta % of Base VMT Person Trips 5,545 11,108 5, % Base 30,242 Vehicle Trips 3,765 6,955 3,189 85% Double 54,219 Expected vehicle trip increase if model not sensitive to Density 7,530 Expected 60,484 Difference -576 Difference -6,265 Base Population 1,678 % Difference -7.6% % Difference -10.4% Base Households 679 Elasticity Elasticity Base Employment 0 D Elasticity Related to Density D Elasticity Total AM Peak Period (3-Hour) Trips (TAZ 525 in Playa Vista) Trip Type Base Trips Trips Double Land Use Delta % of Base Person Trips Vehicle Trips 933 1, % Expected vehicle trip increase if model not sensitive to Density 1,866 Difference -164 % Difference -8.8% Elasticity D Elasticity Related to Density Total PM Peak Period (4-Hour) Trips (TAZ 525 in Playa Vista) Trip Type Base Trips Trips Double Land Use Delta % of Base Person Trips Vehicle Trips 1,405 2,556 1,151 82% Expected vehicle trip increase if model not sensitive to Density 2,811 Difference -255 % Difference -9.1% Elasticity D Elasticity Related to Density -0.04
134 Total Daily Trips (TAZ 2296 along Expo Line) Trip Type Base Trips Trips Double Land Use Delta % of Base VMT Person Trips 12,821 25,613 12, % Base 48,173 Vehicle Trips 8,169 15,375 7,206 88% Double 87,586 Expected vehicle trip increase if model not sensitive to Density 16,338 Expected 96,346 Difference -962 Difference -8,760 Base Population 160 % Difference -5.9% % Difference -9.1% Base Households 66 Elasticity Elasticity Base Employment 1,082 D Elasticity Related to Density D Elasticity Total AM Peak Period (3-Hour) Trips (TAZ 2296 along Expo Line) Trip Type Base Trips Trips Double Land Use Delta % of Base Person Trips Vehicle Trips 1,554 2,884 1,330 86% Expected vehicle trip increase if model not sensitive to Density 3,108 Difference -224 % Difference -7.2% Elasticity D Elasticity Related to Density Total PM Peak Period (4-Hour) Trips (TAZ 2296 along Expo Line) Trip Type Base Trips Trips Double Land Use Delta % of Base Person Trips Vehicle Trips 3,049 5,687 2,639 87% Expected vehicle trip increase if model not sensitive to Density 6,097 Difference -410 % Difference -6.7% Elasticity D Elasticity Related to Density -0.04
135 Total Daily Trips (TAZ 2327 in Westwood) Trip Type Base Trips Trips Double Land Use Delta % of Base VMT Person Trips 25,193 50,330 25, % Base 94,660 Vehicle Trips 16,052 31,150 15,099 94% Double 177,449 Expected vehicle trip increase if model not sensitive to Density 32,104 Expected 189,320 Difference -953 Difference -11,871 Base Population 300 % Difference -3.0% % Difference -6.3% Base Households 120 Elasticity Elasticity Base Employment 1,998 D Elasticity Related to Density D Elasticity Total AM Peak Period (3-Hour) Trips (TAZ 2327 in Westwood) Trip Type Base Trips Trips Double Land Use Delta % of Base Person Trips Vehicle Trips 3,054 5,898 2,845 93% Expected vehicle trip increase if model not sensitive to Density 6,107 Difference -209 % Difference -3.4% Elasticity D Elasticity Related to Density Total PM Peak Period (4-Hour) Trips (TAZ 2327 in Westwood) Trip Type Base Trips Trips Double Land Use Delta % of Base Person Trips Vehicle Trips 5,991 11,631 5,640 94% Expected vehicle trip increase if model not sensitive to Density 11,981 Difference -351 % Difference -2.9% Elasticity D Elasticity Related to Density -0.04
136 Roadway From To Base Speed (Mph) NB/EB Volume SB/WB Volume Adjusted Speed (Mph) NB/EB Volume SB/WB NB/EB Volume Delta Decrease Speed Ocean Park Boulevard Lincoln Boulevard 23rd Street 30 2,445 1, , , , Inglewood Boulevard Braddock Drive Centinela Avenue 30 3,420 3, ,341 3, ,252 3, ,251 3, Pershing Drive Westchester Parkway Imperial Highway 35 2,932 3, ,955 3, ,836 3, ,529 2, th Street Wilshire Boulevard San Vicente Boulevard Increase Speed Centinela Avenue Palms Boulevard National Boulevard 45 5,102 2, ,038 2, ,081 2, ,134 2, Overland Avenue Venice Boulevard Palms Avenue 30 3,629 2, ,721 2, ,770 2, ,890 2, Walgrove Avenue Venice Boulevard Palms Avenue 15 1, ,245 1, ,248 1, , Culver Boulevard Sepulveda Boulevard Overland Avenue 30 2,835 2, ,812 2, ,902 2, ,029 2, Roadway From To Base Speed (Mph) NB/EB Volume SB/WB Volume Adjusted Speed (Mph) Dynamic Validation - Increase/Decrease Speeds NB/EB Volume AM Peak Period (3-Hour) PM Peak Period (4-Hour) SB/WB NB/EB Volume Delta Decrease Speed Ocean Park Boulevard Lincoln Boulevard 23rd Street 30 2,206 3, ,067 3, ,070 3, ,003 2, Inglewood Boulevard Braddock Drive Centinela Avenue 30 4,555 5, ,382 5, ,262 5, ,259 5, Pershing Drive Westchester Parkway Imperial Highway 35 4,420 4, ,595 4, ,321 4, ,636 4, th Street Wilshire Boulevard San Vicente Boulevard 30 1,057 1, , Increase Speed Centinela Avenue Palms Boulevard National Boulevard 45 4,509 6, ,394 6, ,495 6, ,523 6, Overland Avenue Venice Boulevard Palms Avenue 30 3,672 5, ,833 5, ,890 5, ,063 5, Walgrove Avenue Venice Boulevard Palms Avenue 15 1,492 1, ,647 1, ,684 1, ,685 1, Culver Boulevard Sepulveda Boulevard Overland Avenue 30 3,701 3, ,674 3, ,807 4, ,003 4, SB/WB Delta SB/WB Delta Adjusted Speed (Mph) Adjusted Speed (Mph) NB/EB Volume NB/EB Volume SB/WB Volume SB/WB Volume NB/EB Delta NB/EB Delta SB/WB Delta SB/WB Delta Adjusted Speed (Mph) Adjusted Speed (Mph) NB/EB Volume NB/EB Volume SB/WB Volume SB/WB Volume NB/EB Delta NB/EB Delta SB/WB Delta SB/WB Delta
137 Dynamic Validation - Add/Remove Capacity Roadway Segment Eastbound AM Peak Period (3-Hour) Westbound Validated Base Year Add Capacity Remove Capacity Validated Base Year Add Capacity Remove Capacity Volume Volume Delta Volume Delta Volume Volume Delta Volume Delta Wilshire Boulevard - West of I-405 7,021 6, , ,995 7, , Santa Monica Boulevard - West of I-405 6,016 5, , ,268 5, , Olympic Boulevard - West of I-405 5,371 6, ,684-1,687 4,292 4, ,868-1,424 Pico Boulevard - West of I-405 6,134 5, , ,837 2, , National Boulevard - West of I-405 2,726 2, , ,905 1, , Total 27,268 27, , ,297 21, , Wilshire Boulevard - East of I ,700 10, , ,439 6, , Santa Monica Boulevard - East of I-405 5,095 5, , ,937 4, , Olympic Boulevard - East of I-405 4,976 5, ,374-1,603 4,447 5, ,068-1,379 Pico Boulevard - East of I-405 4,845 4, , ,166 2, , National Boulevard - East of I-405 3,397 3, , ,950 2, , Total 29,013 29, , ,939 22, , Note: A lane of capacity was add/removed in each direction on Olympic Boulevard from Cloverfield Boulevard to Avenue of the Stars. Roadway Segment Eastbound PM Peak Period (4-Hour) Westbound Validated Base Year Add Capacity Remove Capacity Validated Base Year Add Capacity Remove Capacity Volume Volume Delta Volume Delta Volume Volume Delta Volume Delta Wilshire Boulevard - West of I-405 9,850 9, , ,554 9, , Santa Monica Boulevard - West of I-405 8,671 8, , ,482 7, , Olympic Boulevard - West of I-405 6,968 8,421 1,454 4,936-2,032 6,504 7, ,857-1,646 Pico Boulevard - West of I-405 7,411 6, , ,407 6, , National Boulevard - West of I-405 3,664 3, , ,554 2, , Total 36,564 36, , ,500 32, , Wilshire Boulevard - East of I ,589 10, , ,186 14, , Santa Monica Boulevard - East of I-405 6,246 6, , ,107 8, , Olympic Boulevard - East of I-405 5,893 7,157 1,264 4,086-1,807 7,543 8, ,904-1,639 Pico Boulevard - East of I-405 5,861 5, , ,675 5, , National Boulevard - East of I-405 4,482 4, , ,468 4, , Total 33,071 33, , ,979 40, , Note: A lane of capacity was add/removed in each direction on Olympic Boulevard from Cloverfield Boulevard to Avenue of the Stars.
138 Dynamic Validation - Delete A Link Roadway Segment AM Peak Period (3-Hour) Eastbound Westbound Validated Base Year Delete A Link Validated Base Year Delete A Link Volume Volume Delta Volume Volume Delta Rose Avenue East of Lincoln Boulevard ,158 1, Venice Boulevard East of Lincoln Boulevard 4,638 6,509 1,871 4,208 5,611 1,403 Washington Boulevard East of Lincoln Boulevard 3, ,383 2, ,667 Maxella Avenue East of Lincoln Boulevard 1,229 1, , Mindanao Way East of Lincoln Boulevard 1,752 1, ,446 1, Culver Boulevard East of Lincoln Boulevard 2,284 2, ,611 2,608-3 Jefferson Boulevard East of Lincoln Boulevard 2,179 2, ,785 1, Total 16,234 15, ,845 14, Note: The segment of Washington Boulevard immedietly east of Lincoln Boulevard was deleted from the base year highway network. Roadway Segment PM Peak Period (4-Hour) Eastbound Westbound Validated Base Year Delete A Link Validated Base Year Delete A Link Volume Volume Delta Volume Volume Delta Rose Avenue East of Lincoln Boulevard 1,786 1, ,099 1, Venice Boulevard East of Lincoln Boulevard 6,878 9,245 2,368 6,655 9,034 2,380 Washington Boulevard East of Lincoln Boulevard 4, ,623 4, ,783 Maxella Avenue East of Lincoln Boulevard 999 2,105 1,107 1,906 2,937 1,031 Mindanao Way East of Lincoln Boulevard 2,471 2, ,335 2, Culver Boulevard East of Lincoln Boulevard 3,083 3, ,743 3, Jefferson Boulevard East of Lincoln Boulevard 2,546 2, ,933 4, Total 22,386 21,326-1,059 24,454 23,164-1,289 Note: The segment of Washington Boulevard immedietly east of Lincoln Boulevard was deleted from the base year highway network.
139 Dynamic Validation - Increase Functional Class Roadway Segment AM Peak Period (3-Hour) Eastbound Westbound Validated Base Year Increase Functional Class Validated Base Year Increase Functional Class Volume Volume Delta Volume Volume Delta W 76th Street West of Sepulveda Boulevard th Street West of Sepulveda Boulevard W 83rd Street West of Sepulveda Boulevard W Manchester Avenue West of Sepulveda Boulevard 2,101 2, ,495 3, W 88th Street West of Sepulveda Boulevard , Westchester Parkway West of Sepulveda Boulevard 1,243 1, , Lincoln Boulevard West of Sepulveda Boulevard 3,691 3, ,951 3, Total 9,953 10, ,569 10, Note: The functional class of W Manchester Avenue from Pershing Drive to Airport Boulevard was increased from a principal arterial to a an expressway. Roadway Segment PM Peak Period (4-Hour) Eastbound Westbound Validated Base Year Increase Functional Class Validated Base Year Increase Functional Class Volume Volume Delta Volume Volume Delta W 76th Street West of Sepulveda Boulevard ,259 1, th Street West of Sepulveda Boulevard W 83rd Street West of Sepulveda Boulevard 1, ,211 1, W Manchester Avenue West of Sepulveda Boulevard 3,130 3, ,378 4,411 1,033 W 88th Street West of Sepulveda Boulevard 1,622 1, ,514 1, Westchester Parkway West of Sepulveda Boulevard 1,728 1, ,831 1, Lincoln Boulevard West of Sepulveda Boulevard 5,350 5, ,302 5, Total 14,594 14, ,176 15, Note: The functional class of W Manchester Avenue from Pershing Drive to Airport Boulevard was increased from a principal arterial to a an expressway.
140 Dynamic Validation - Decrease Functional Class Roadway Segment AM Peak Period (3-Hour) Eastbound Westbound Validated Base Year Decrease Functional Class Validated Base Year Decrease Functional Class Volume Volume Delta Volume Volume Delta National Boulevard West of Sawtelle Boulevard 1,297 1, ,305 1, Palms Boulevard West of Sawtelle Boulevard 2,738 2, ,976 2, Venice Boulevard West of Sawtelle Boulevard 6,030 5, ,201 4, Washington Place West of Sawtelle Boulevard 3,192 3, ,860 2,861 0 Washington Boulevard West of Sawtelle Boulevard 2,838 2, ,188 2, Culver Boulevard West of Sawtelle Boulevard 3,463 3, ,426 2, Braddock Drive West of Sawtelle Boulevard 1,659 1, Total 21,218 20, ,703 16, Note: The functional class of Venice Boulevard from Lincoln Boulevard to Overland Boulevard was decreased from a principal arterial to a minor arterial. Roadway Segment PM Peak Period (4-Hour) Eastbound Westbound Validated Base Year Decrease Functional Class Validated Base Year Decrease Functional Class Volume Volume Delta Volume Volume Delta National Boulevard West of Sawtelle Boulevard 2,131 2, ,681 1, Palms Boulevard West of Sawtelle Boulevard 3,577 3, ,673 3, Venice Boulevard West of Sawtelle Boulevard 7,799 6, ,365 7, Washington Place West of Sawtelle Boulevard 4,051 4, ,880 4, Washington Boulevard West of Sawtelle Boulevard 3,381 3, ,146 4, Culver Boulevard West of Sawtelle Boulevard 3,988 3, ,773 4, Braddock Drive West of Sawtelle Boulevard 1,656 1, ,796 1,800 4 Total 26,583 25, ,312 28, Note: The functional class of Venice Boulevard from Lincoln Boulevard to Overland Boulevard was decreased from a principal arterial to a minor arterial.
141 Dynamic Validation - Transit Fare Double Fare of a Transit Mode Validated Base Year Model Double Mode 11 Fare Delta % Change Peak Period Off-Peak Period Peak Period Off-Peak Period Peak Period Off-Peak Period Peak Period Off-Peak Period Mode Boardings Boardings Daily Boardings Boardings Boardings Daily Boardings Boardings Boardings Daily Boardings Boardings Boardings Daily Boardings 10 25,820 1,638 27,458 26,872 1,204 28,076 1, % -26% 2% , , , , , , ,026-75, ,038-20% -20% -20% 12 61,457 20,293 81,749 60,380 20,047 80,427-1, ,322-2% -1% -2% ,354 77, , ,135 85, ,969 9,781 8,213 17,995 5% 11% 6% 14 41,336 15,926 57,262 39,401 15,613 55,014-1, ,248-5% -2% -4% 15 19,952 16,406 36,358 20,618 16,908 37, ,167 3% 3% 3% ,813 83, , ,078 85, ,646 3,264 1,873 5,137 3% 2% 3% 17 24,843 15,402 40,246 34,722 21,733 56,455 9,879 6,331 16,210 40% 41% 40% % -21% -10% , , % -43% -22% % -1% 5% 22 34,903 14,321 49,224 39,233 16,130 55,363 4,330 1,808 6,138 12% 13% 12% TOTAL 1,117, ,794 1,733,197 1,025, ,208 1,583,480-92,131-57, ,717-8% -9% -9% Validated Base Year Model Halve Fare of a Transit Mode Halve Mode 11 Fare Delta % Change Peak Period Off-Peak Period Peak Period Off-Peak Period Peak Period Off-Peak Period Peak Period Off-Peak Period Mode Boardings Boardings Daily Boardings Boardings Boardings Daily Boardings Boardings Boardings Daily Boardings Boardings Boardings Daily Boardings 10 25,820 1,638 27,458 26,257 1,169 27, % -29% 0% , , , , ,081 1,067,818 76,886 44, ,218 13% 12% 13% 12 61,457 20,293 81,749 62,743 20,574 83,317 1, ,567 2% 1% 2% ,354 77, , ,175 74, ,318-2,179-3,478-5,657-1% -4% -2% 14 41,336 15,926 57,262 42,468 16,219 58,688 1, ,426 3% 2% 2% 15 19,952 16,406 36,358 19,780 16,239 36, % -1% -1% ,813 83, , ,353 83, , % -1% 0% 17 24,843 15,402 40,246 21,251 12,992 34,243-3,592-2,411-6,003-14% -16% -15% % 14% 8% , , % -39% -18% % 0% -1% 22 34,903 14,321 49,224 34,566 14,010 48, % -2% -1% TOTAL 1,117, ,794 1,733,197 1,190, ,158 1,843,639 73,077 37, ,441 7% 6% 6% Elasticity Peak Period Boardings Off-Peak Period Boardings Daily Boardings Elasticity for Double Mode Fare Elasticity for Halve Mode Fare Travelers Response Handbook to -0.35
142 Dynamic Validation - Transit Headway Double Headway of a Transit Line Paralell Route for Double Headway of a Transit Line Peak Period Off-Peak Period Peak Period Off-Peak Period Scenario Transit Line Boardings Boardings Daily Boardings Scenario Transit Line Boardings Boardings Daily Boardings Validated Base Year Model Line 114/115 CC 6 4,865 3,292 8,158 Validated Base Year Model Line 439 N/S MT 439 1, ,343 Double Headway Model Line 114/115 CC 6 2,464 1,765 4,229 Double Headway Model Line 439 N/S MT 439 1, ,461 Delta Line 114/115 CC 6-2,401-1,527-3,928 Delta Line 439 N/S MT % Change Line 114/115 CC 6-49% -46% -48% % Change Line 439 N/S MT 439 7% 3% 5% Elasticity Line 114/115 CC Elasticity Line 439 N/S MT Halve Headway of a Transit Line Paralell Route for Halve Headway of a Transit Line Peak Period Off-Peak Period Peak Period Off-Peak Period Scenario Transit Line Boardings Boardings Daily Boardings Scenario Transit Line Boardings Boardings Daily Boardings Validated Base Year Model Line 997/998 MT 33 3,973 4,490 8,463 Validated Base Year Model Line 999/1000 MT 333 3, ,987 Halve Headway Model Line 997/998 MT 33 8,108 7,546 15,654 Halve Headway Model Line 999/1000 MT 333 2, ,884 Delta Line 997/998 MT 33 4,134 3,057 7,191 Delta Line 999/1000 MT ,103 % Change Line 997/998 MT % 68% 85% % Change Line 999/1000 MT % -42% -28% Elasticity Line 997/998 MT Elasticity Line 999/1000 MT *The Travelers Response Handbook provides an elasticity of 0.3 to 1.0 with an average of 0.5. Scenario Validated Base Year Model Double Headway Model Delta % Change Halve Headway Model Delta % Change Total Model Transit Trips Peak Period Off-Peak Period Boardings Boardings Daily Boardings 1,117, ,794 1,733,197 1,119, ,663 1,732,979 1,913-2, % -0.3% 0.0% 1,122, ,131 1,737,820 5, , % -0.1% 0.3%
143 Validated Base Year Double Number of Lanes Double Roadway Capacity Table Halve Roadway Capacity Table Daily Delta Delta Delta % Change in Lane Miles % % % Vehicle Miles Traveled 236,664, ,550,200 53,885, ,467,800 23,803, ,761,800-8,902,700 % Change in Vehicle Miles Traveled % -- 10% -- -4% Elasticity External Vehicle Trips 42,412,373 45,824,585 3,412,212 44,600,168 2,187,794 41,156,835-1,255,538 % Change in External Vehicle Trips % -- 5% -- -3% Elasticity Validated Base Year Double Number of Lanes Double Roadway Capacity Table Halve Roadway Capacity Table AM Peak Period (3-Hour) Delta Delta Delta % Change in Lane Miles % % % Vehicle Miles Traveled 56,068,900 72,169,600 16,100,700 62,684,200 6,615,300 52,265,400-3,803,500 % Change in Vehicle Miles Traveled % -- 12% -- -7% Elasticity External Vehicle Trips 10,300,379 11,335,264 1,034,885 10,876, ,022 9,819, ,505 % Change in External Vehicle Trips % -- 6% -- -5% Elasticity Validated Base Year Dynamic Validation - Induced and Suppressed Demand Double Number of Lanes Double Roadway Capacity Table Halve Roadway Capacity Table PM Peak Period (3-Hour) Delta Delta Delta % Change in Lane Miles % % % Vehicle Miles Traveled 79,293, ,847,200 24,554,200 89,332,900 10,039,900 73,444,100-5,848,900 % Change in Vehicle Miles Traveled % -- 13% -- -7% Elasticity External Vehicle Trips 15,253,746 16,848,771 1,595,025 16,164, ,970 14,529, ,494 % Change in External Vehicle Trips % -- 6% -- -5% Elasticity Note: Modifications to the roadway capacity table are influenced by capacity ceilings and floors hard coded into the script.
144 Dynamic Validation - Future Demand on Base Network Future Land Use on Future Network Future Land Use on Base Network Delta % Change Measure Peak Off-Peak Daily Peak Off-Peak Daily Peak Off-Peak Daily Peak Off-Peak Daily Lane Miles 155, , , , , ,320-5,041-5,041-10, % -3.2% -3.2% Person Trips 75,847,456 67,740, ,587,871 75,846,444 67,739, ,585,576-1,012-1,283-2, % 0.0% 0.0% Vehicle Trips 45,886,896 29,764,696 75,651,592 45,538,608 29,694,506 75,233, ,288-70, , % -0.2% -0.6% % Vehicel Trips 60.5% 43.9% 52.7% 60.0% 43.8% 52.4% -0.5% -0.1% -0.3% -0.8% -0.2% -0.6% Vehicle Miles Traveled 151,719, ,265, ,985, ,141, ,370, ,512,700-1,577, ,200-1,472, % 0.1% -0.6% Vehicle Minutes Traveled 9,403,200 3,449,800 12,853,000 9,176,800 3,582,600 12,759, , ,800-93, % 3.8% -0.7% Vehicle Minutes of Delay 5,526, ,200 6,243,000 5,310, ,100 6,138, , , , % 15.6% -1.7% VMT Elasticity Cervero Elasticity
145 Dynamic Validation - Induced and Suppressed Demand Along a Corridor The number of lanes along Santa Monica Blvd were doubled in each direction from Centinela Ave to Wilshire Blvd and the VMT was measured within 2-miles of the corridor. Validated Base Year Double Number of Lanes (Base) Daily Delta % Change in Lane Miles % Vehicle Miles Traveled 2,984,549 3,024,462 39,913 % Change in Vehicle Miles Traveled % Elasticity Cervero Short-Term Elasticity ( ) Validated Base Year Double Number of Lanes AM Peak Period (3-Hour) Delta % Change in Lane Miles % Vehicle Miles Traveled 701, ,504 13,675 % Change in Vehicle Miles Traveled % Elasticity Cervero Short-Term Elasticity ( ) Validated Base Year Double Number of Lanes (Base) PM Peak Period (3-Hour) Delta % Change in Lane Miles % Vehicle Miles Traveled 1,024,882 1,043,002 18,120 % Change in Vehicle Miles Traveled % Elasticity Cervero Short-Term Elasticity ( )
146 Dynamic Validation - Induced and Suppressed Demand Along a Corridor The number of lanes along Santa Monica Blvd were doubled in each direction from Centinela Ave to Wilshire Blvd and the VMT was measured within 2-miles of the corridor. Validated Base Year Double Number of Lanes (2035) Daily Delta % Change in Lane Miles % Vehicle Miles Traveled 2,984,549 3,230, ,812 % Change in Vehicle Miles Traveled % Elasticity Cervero Long-Term Elasticity (0.8) Validated Base Year Double Number of Lanes (2035) AM Peak Period (3-Hour) Delta % Change in Lane Miles % Vehicle Miles Traveled 701, ,798 47,969 % Change in Vehicle Miles Traveled % Elasticity Cervero Long-Term Elasticity (0.8) Validated Base Year Double Number of Lanes (2035) PM Peak Period (3-Hour) Delta % Change in Lane Miles % Vehicle Miles Traveled 1,024,882 1,131, ,856 % Change in Vehicle Miles Traveled % Elasticity Cervero Long-Term Elasticity (0.8)
147 Dynamic Validation - Auto Trip Variables Total Trips Trip Type Base Trips Trips Double Operating Cost Delta % of Base Trips Double Parking Cost Delta % of Base Trips Half Headway Delta % of Base Vehicle Trips 18,682,696 17,391,222-1,291, % 18,624,008-58, % 18,574, , % Transit Person Trips 906,601 1,130, , % 916,914 10, % 1,080, , % Walk/Bike Person Trips 4,451,990 4,825, , % 4,478,447 26, % 4,432,785-19, % Total 24,041,287 23,347, , % 24,019,369-21, % 24,088,251 46, % Gas Price Elasticity Parking Demand Elasticity Transit Ridership Elasticity 0.2 SACOG Wiki to Travelers Response Handbook to Travelers Response Handbook 0.3 to 1.0 % of Trips by Trip Type Trip Type Base Trips Trips Double Operating Cost Delta % of Base Trips Double Parking Cost Delta % of Base Trips Half Headway Delta % of Base Vehicle Trips 77.7% 74.5% -3.2% % -0.2% % -0.6% -- Transit Person Trips 3.8% 4.8% 1.1% % 0.0% % 0.7% -- Walk/Bike Person Trips 18.5% 20.7% 2.2% % 0.1% % -0.1% -- Total 100.0% 100.0% 0.0% % 0.0% % 0.0% -- All TAZs in Westside Study Area (266 TAZs) Only TAZs with Base Parking Cost (74 TAZs) Base Double Parking Cost in Westside Study Area Base Double Parking Cost in Westside Study Area Trip Type Trips Trips Delta % of Base Trips Trips Delta % of Base Vehicle Trips 996, ,706-10, % 450, ,705-18, % Transit Person Trips 46,233 47,752 1, % 22,364 26,625 4, % Walk/Bike Person Trips 204, ,083 5, % 91, ,361 10, % Total 1,246,618 1,242,541-4, % 563, ,691-4, % Parking Demand Elasticity Parking Demand Elasticity Travelers Response Handbook to Travelers Response Handbook to Average Daily Parking Cost in Westside Study Area (Base) Average Hourly Parking Cost in Westside Study Area (Base) Note: Only 74 of 266 TAZs have a parking cost in the base model $26 $10 Local knowledge suggests the parking demand elasticity should be lower than the elasticities in the Travelers Response Handbook due to local tolerance to congestion and increased parking prices.

148 APPENDIX J: WESTSIDE TDF MODEL PLOTS FOR EXISTING, 2035 WITHOUT PROJECT, AND 2035 PLUS PROJECT CONDITIONS
149 Mapbox 2014 AM Peak Period LOS E LOS F Coastal Transportation Corridor West Los Angeles
150 Mapbox 2014 AM Peak Period LOS E LOS F Coastal Transportation Corridor West Los Angeles
151 Mapbox 2014 AM PM Peak Period LOS E LOS F Coastal Transportation Corridor West Los Angeles
152 Mapbox 2014 PM AM Peak Period LOS E LOS F Coastal Transportation Corridor West Los Angeles
153 Mapbox AM No Project Peak Period AM Peak Period LOS E Coastal Transportation Coastal Transportation Corridor Corridor LOS F West Los Angeles West Los Angeles
154 Mapbox 2035 No 2014 AM Project Peak Period AM Peak Period LOS E Coastal Transportation Coastal Transportation Corridor Corridor LOS F West Los Angeles West Los Angeles
155 Mapbox AM No Project Peak Period PM Peak Period LOS E Coastal Transportation Coastal Transportation Corridor Corridor LOS F West Los Angeles West Los Angeles
156 Mapbox 2035 No 2014 AM Project Peak Period PM Peak Period LOS E Coastal Transportation Coastal Transportation Corridor Corridor LOS F West Los Angeles West Los Angeles
157 Mapbox AM Plus Peak Project Period AM Peak Period LOS E Coastal Transportation Coastal Transportation Corridor Corridor LOS F West Los Angeles West Los Angeles
158 Mapbox 2035 Plus 2014 AM Peak Project Period AM Peak Period LOS E Coastal Transportation Coastal Transportation Corridor Corridor LOS F West Los Angeles West Los Angeles

159 Mapbox AM Plus Peak Project Period PM Peak Period LOS E Coastal Transportation Coastal Transportation Corridor Corridor LOS F West Los Angeles West Los Angeles

160 Mapbox 2035 Plus 2014 AM Peak Project Period PM Peak Period LOS E Coastal Transportation Coastal Transportation Corridor Corridor LOS F West Los Angeles West Los Angeles
DEVELOPMENT OF RIDERSHIP FORECASTS FOR THE SAN BERNARDINO INFRASTRUCTURE IMPROVEMENT STUDY
 APPENDIX 1 DEVELOPMENT OF RIDERSHIP FORECASTS FOR THE SAN BERNARDINO INFRASTRUCTURE IMPROVEMENT STUDY INTRODUCTION: This Appendix presents a general description of the analysis method used in forecasting
Travel Demand Modeling at NCTCOG
 Travel Demand Modeling at NCTCOG Arash Mirzaei North Central Texas Council Of Governments for Southern Methodist University The ASCE Student Chapter October 24, 2005 Contents NCTCOG DFW Regional Model
Travel Forecasting Methodology
 Travel Forecasting Methodology Introduction This technical memorandum documents the travel demand forecasting methodology used for the SH7 BRT Study. This memorandum includes discussion of the following:
Executive Summary. Draft Environmental Impact Statement/Environmental Impact Report ES-1
 Executive Summary Introduction The Eastside Transit Corridor Phase 2 Project is a vital public transit infrastructure investment that would provide a transit connection to the existing Metro Gold Line
WESTSIDE SUBWAY EXTENSION. Final Smart Growth Evaluation Report
 Final Smart Growth Evaluation Report August 2010 Table of Contents Table of Contents 1.0 INTRODUCTION... 1-1 1.1 4Ds... 1-2 1.2 Direct Ridership Model (DRM)... 1-2 2.0 4DS... 2-1 2.1 Inputs... 2-1 2.2
Appendix G Traffic Study Methodology
 REVISED DRAFT ENVIRONMENTAL IMPACT REPORT/ Appendix G Traffic Forecasting Model Methodology In addition to the existing/baseline condition (year 2005), a level of service (LOS) analysis was conducted for
Alpine Highway to North County Boulevard Connector Study
 Alpine Highway to North County Boulevard Connector Study prepared by Avenue Consultants March 16, 2017 North County Boulevard Connector Study March 16, 2017 Table of Contents 1 Summary of Findings... 1
Subarea Study. Manning Avenue (CSAH 15) Corridor Management and Safety Improvement Project. Final Version 1. Washington County.
 Corridor Management and Safety Improvement Project. Final Version 1. Washington County.") Subarea Study Manning Avenue (CSAH 15) Corridor Management and Safety Improvement Project Final Version 1 Washington County June 12, 214 SRF No. 138141 Table of Contents Introduction... 1 Forecast Methodology
Subarea Study Manning Avenue (CSAH 15) Corridor Management and Safety Improvement Project Final Version 1 Washington County June 12, 214 SRF No. 138141 Table of Contents Introduction... 1 Forecast Methodology
TRAVEL DEMAND FORECASTS
 Jiangxi Ji an Sustainable Urban Transport Project (RRP PRC 45022) TRAVEL DEMAND FORECASTS A. Introduction 1. The purpose of the travel demand forecasts is to assess the impact of the project components
TEXAS CITY PARK & RIDE RIDERSHIP ANALYSIS
 TEXAS CITY PARK & RIDE RIDERSHIP ANALYSIS This document reviews the methodologies and tools used to calculate the projected ridership and parking space needs from the proposed Texas City Park & Ride to
Mobile Area Transportation Study Urban Area and Planning Boundary
 Mobile Origin- Destination Study Mobile Origin- Destination Study Trip Distribution Calibration WHY? Some background on Mobile Long Range Transportation Plan Crash course in travel demand forecasting HOW?
CSTM Improvements. AITPM Canberra 11 May 2017
 CSTM Improvements AITPM Canberra 11 May 2017 7 December 2016 1 Introduction Josh Everett SMEC Australia Worked on modelling in Canberra for 11 years Used TransCAD, then EMME, now back to TransCAD Presentation
Bi-County Transitway/ Bethesda Station Access Demand Analysis
 Bi-County Transitway/ Bethesda Station Access Demand Analysis Prepared for: Washington Metropolitan Area Transit Authority Office of Planning and Project Development May 2005 Prepared by: in conjunction
Appendix B: Travel Demand Forecasts July 2017
 Appendix B: Travel Demand Forecasts July 2017 Table of Contents 1 Introduction... 2 2 Model Review and Updates... 2 2.1 Overview of Smart Moves Model ( City of London Model )... 2 2.1.1 Network and Zone
The Boston South Station HSIPR Expansion Project Cost-Benefit Analysis. High Speed Intercity Passenger Rail Technical Appendix
 The Boston South Station HSIPR Expansion Project Cost-Benefit Analysis High Speed Intercity Passenger Rail Technical Appendix Prepared by HDR August 5, 2010 The Boston South Station HSIPR Expansion Project
The major roadways in the study area are State Route 166 and State Route 33, which are shown on Figure 1-1 and described below:
 3.5 TRAFFIC AND CIRCULATION 3.5.1 Existing Conditions 3.5.1.1 Street Network DRAFT ENVIRONMENTAL IMPACT REPORT The major roadways in the study area are State Route 166 and State Route 33, which are shown
Development of the Idaho Statewide Travel Demand Model Trip Matrices Using Cell Phone OD Data and Origin Destination Matrix Estimation
 Portland State University PDXScholar TREC Friday Seminar Series Transportation Research and Education Center (TREC) 10-24-2016 Development of the Idaho Statewide Travel Demand Model Trip Matrices Using
Mountain Area Transportation Study Model Methodology and Assumptions Final
 Model Methodology and Assumptions Final February 19, 2017 Submitted to: 17J17-1768.17 Prepared by Iteris, Inc. Innovating Through Informatics TABLE OF CONTENTS 1.0 OVERVIEW... 1 1.1 Project Objective and
Interstate Operations Study: Fargo-Moorhead Metropolitan Area Simulation Output
 NDSU Dept #2880 PO Box 6050 Fargo, ND 58108-6050 Tel 701-231-8058 Fax 701-231-6265 www.ugpti.org www.atacenter.org Interstate Operations Study: Fargo-Moorhead Metropolitan Area 2015 Simulation Output Technical
Transit Modeling Update District One Implementation & Status Report. Purpose and Need
 Transit Modeling Update District One Implementation & Status Report presented to MTF Transit & Rail Committee presented by Dan Macmurphy, Traf-O-Data Corp. June 17, 2013 Purpose and Need Developed by FDOT
SAN BERNARDINO COUNTY TRANSPORTATION ANALYSIS MODEL SBTAM
 SAN BERNARDINO COUNTY TRANSPORTATION ANALYSIS MODEL SBTAM MODEL DEVELOPMENT AND VALIDATION Report and User s Guide Submitted to: San Bernardino Associated Governments 1170 W. 3rd Street, 2nd Floor San
BERKELEY DOWNTOWN AREA PLAN PROGRAM ENVIRONMENTAL IMPACT REPORT TRAFFIC IMPACT ANALYSIS
 BERKELEY DOWNTOWN AREA PLAN PROGRAM ENVIRONMENTAL IMPACT REPORT TRAFFIC IMPACT ANALYSIS Prepared for: City of Berkeley Prepared by: REVISED JANUARY 9, 2009 Berkeley Downtown Area Plan Program EIR Traffic
Michigan/Grand River Avenue Transportation Study TECHNICAL MEMORANDUM #18 PROJECTED CARBON DIOXIDE (CO 2 ) EMISSIONS
 EMISSIONS") TECHNICAL MEMORANDUM #18 PROJECTED CARBON DIOXIDE (CO 2 ) EMISSIONS Michigan / Grand River Avenue TECHNICAL MEMORANDUM #18 From: URS Consultant Team To: CATA Project Staff and Technical Committee Topic:
TECHNICAL MEMORANDUM #18 PROJECTED CARBON DIOXIDE (CO 2 ) EMISSIONS Michigan / Grand River Avenue TECHNICAL MEMORANDUM #18 From: URS Consultant Team To: CATA Project Staff and Technical Committee Topic:
Travel Time Savings Memorandum
 04-05-2018 TABLE OF CONTENTS 1 Background 3 Methodology 3 Inputs and Calculation 3 Assumptions 4 Light Rail Transit (LRT) Travel Times 5 Auto Travel Times 5 Bus Travel Times 6 Findings 7 Generalized Cost
2030 Multimodal Transportation Study
 2030 Multimodal Transportation Study City of Jacksonville Planning and Development Department Prepared by Ghyabi & Associates April 29,2010 Introduction Presentation Components 1. Study Basis 2. Study
AGENDA ITEM 1: IMPROVED BPM FORECASTING WITH OUT OF REGION ANALYSIS (ORA)
") April 12, 2013 NYBPM 2010 - Approach to External & Truck Model Update 1 AGENDA ITEM 1: IMPROVED BPM FORECASTING WITH OUT OF REGION ANALYSIS (ORA) Core BPM and External Models April 12, 2013 NYBPM 2010
April 12, 2013 NYBPM 2010 - Approach to External & Truck Model Update 1 AGENDA ITEM 1: IMPROVED BPM FORECASTING WITH OUT OF REGION ANALYSIS (ORA) Core BPM and External Models April 12, 2013 NYBPM 2010
2. Valley Circle Boulevard/Andora Avenue/Baden Avenue and Lassen Street
 IV.J TRANSPORTATION 1. INTRODUCTION This section presents an overview of the existing traffic and circulation system in and surrounding the project site. This section also discusses the potential impacts
Appendix 3 CUUATS Transportation Model Report
 Appendix 3 CUUATS Transportation Model Report TRANSPORTATION MODEL LONG RANGE TRANSPORTATION PLAN 2025 Champaign-Urbana Urbanized Area Transportation Study (CUUATS) TABLE OF CONTENTS I. INTRODUCTION...1
ConnectGreaterWashington: Can the Region Grow Differently?
 Washington Metropolitan Area Transit Authority ConnectGreaterWashington: Can the Region Grow Differently? Transportation Planning Board (TPB) Travel Forecasting Subcommittee July 17, 2015 1 Alternatives
Table Existing Traffic Conditions for Arterial Segments along Construction Access Route. Daily
 5.8 TRAFFIC, ACCESS, AND CIRCULATION This section describes existing traffic conditions in the project area; summarizes applicable regulations; and analyzes the potential traffic, access, and circulation
HALTON REGION SUB-MODEL
 WORKING DRAFT GTA P.M. PEAK MODEL Version 2.0 And HALTON REGION SUB-MODEL Documentation & Users' Guide Prepared by Peter Dalton July 2001 Contents 1.0 P.M. Peak Period Model for the GTA... 4 Table 1 -
TRANSPORTATION STUDY FOR THE 8899 BEVERLY BOULEVARD PROJECT
 DRAFT TRANSPORTATION STUDY FOR THE 8899 BEVERLY BOULEVARD PROJECT WEST HOLLYWOOD, CALIFORNIA NOVEMBER 2013 PREPARED FOR BEVERLY BOULEVARD ASSOCIATION PREPARED BY DRAFT TRANSPORTATION STUDY FOR THE 8899
UTA Transportation Equity Study and Staff Analysis. Board Workshop January 6, 2018
 UTA Transportation Equity Study and Staff Analysis Board Workshop January 6, 2018 1 Executive Summary UTA ranks DART 6 th out of top 20 Transit Agencies in the country for ridership. UTA Study confirms
APPLICATION OF A PARCEL-BASED SUSTAINABILITY TOOL TO ANALYZE GHG EMISSIONS
 APPLICATION OF A PARCEL-BASED SUSTAINABILITY TOOL TO ANALYZE GHG EMISSIONS Jung Seo, Hsi-Hwa Hu, Frank Wen, Simon Choi, Cheol-Ho Lee Research & Analysis Southern California Association of Governments 2012
APPENDIX B Traffic Analysis
 APPENDIX B Traffic Analysis Rim of the World Unified School District Reconfiguration Prepared for: Rim of the World School District 27315 North Bay Road, Blue Jay, CA 92317 Prepared by: 400 Oceangate,
Transportation Statistical Data Development Report BAY COUNTY 2035 LONG RANGE TRANSPORTATION PLAN
 Transportation Statistical Data Development Report BAY COUNTY 2035 LONG RANGE TRANSPORTATION PLAN Prepared for Bay County Transportation Planning Organization and The Florida Department of Transportation,
Performance Measure Summary - Pittsburgh PA. Performance Measures and Definition of Terms
 Performance Measure Summary - Pittsburgh PA There are several inventory and performance measures listed in the pages of this Urban Area Report for the years from 1982 to 2014. There is no single performance
Performance Measure Summary - New Orleans LA. Performance Measures and Definition of Terms
 Performance Measure Summary - New Orleans LA There are several inventory and performance measures listed in the pages of this Urban Area Report for the years from 1982 to 2014. There is no single performance
IV. ENVIRONMENTAL IMPACT ANALYSIS K.2. PARKING
 IV. ENVIRONMENTAL IMPACT ANALYSIS K.2. PARKING ENVIRONMENTAL SETTING The following analysis summarizes the findings and conclusions of the Traffic Analysis (Traffic Study), prepared by The Mobility Group,
2012 Air Emissions Inventory
 SECTION 6 HEAVY-DUTY VEHICLES This section presents emissions estimates for the heavy-duty vehicles (HDV) source category, including source description (6.1), geographical delineation (6.2), data and information
Performance Measure Summary - Grand Rapids MI. Performance Measures and Definition of Terms
 Performance Measure Summary - Grand Rapids MI There are several inventory and performance measures listed in the pages of this Urban Area Report for the years from 1982 to 2014. There is no single performance
Performance Measure Summary - Allentown PA-NJ. Performance Measures and Definition of Terms
 Performance Measure Summary - Allentown PA-NJ There are several inventory and performance measures listed in the pages of this Urban Area Report for the years from 1982 to 2014. There is no single performance
CEDAR AVENUE TRANSITWAY Implementation Plan Update
 CEDAR AVENUE TRANSITWAY Implementation Plan Update EECUTIVE SUMMARY DECEMBER 2015 Executive Summary In 2013, the Twin Cities metropolitan area s first bus rapid transit (BRT) line, the METRO Red Line,
Performance Measure Summary - Louisville-Jefferson County KY-IN. Performance Measures and Definition of Terms
 Performance Measure Summary - Louisville-Jefferson County KY-IN There are several inventory and performance measures listed in the pages of this Urban Area Report for the years from 1982 to 2014. There
Traffic and Toll Revenue Estimates
 The results of WSA s assessment of traffic and toll revenue characteristics of the proposed LBJ (MLs) are presented in this chapter. As discussed in Chapter 1, Alternatives 2 and 6 were selected as the
Community Meetings June 2018
 Community Meetings June 2018 1 Welcome and Agenda Thank you for joining us! 6:00 pm Open House 6:30 pm Welcome & Presentation 7:00 pm Q&A 7:15 pm Open House Resumes 8:00 pm Meeting Concludes 2 Purpose
Welcome and Agenda. Thank you for joining us! 6:00 pm Open House. 6:30 pm Welcome & Presentation. 7:00 pm Q&A. 7:15 pm Open House Resumes
 1 Welcome and Agenda Thank you for joining us! 6:00 pm Open House 6:30 pm Welcome & Presentation 7:00 pm Q&A 7:15 pm Open House Resumes 8:00 pm Meeting Concludes 2 Purpose of this Meeting Introduce project
Performance Measure Summary - Large Area Sum. Performance Measures and Definition of Terms
 Performance Measure Summary - Large Area Sum There are several inventory and performance measures listed in the pages of this Urban Area Report for the years from 1982 to 2014. There is no single performance
Performance Measure Summary - Medium Area Sum. Performance Measures and Definition of Terms
 Performance Measure Summary - Medium Area Sum There are several inventory and performance measures listed in the pages of this Urban Area Report for the years from 1982 to 2014. There is no single performance
Performance Measures and Definition of Terms
 Performance Measure Summary - All 471 Areas Sum There are several inventory and performance measures listed in the pages of this Urban Area Report for the years from 1982 to 2014. There is no single performance
Performance Measure Summary - Austin TX. Performance Measures and Definition of Terms
 Performance Measure Summary - Austin TX There are several inventory and performance measures listed in the pages of this Urban Area Report for the years from 1982 to 2014. There is no single performance
Performance Measure Summary - Portland OR-WA. Performance Measures and Definition of Terms
 Performance Measure Summary - Portland OR-WA There are several inventory and performance measures listed in the pages of this Urban Area Report for the years from 1982 to 2014. There is no single performance
Performance Measure Summary - Oklahoma City OK. Performance Measures and Definition of Terms
 Performance Measure Summary - Oklahoma City OK There are several inventory and performance measures listed in the pages of this Urban Area Report for the years from 1982 to 2014. There is no single performance
2016 Congestion Report
 2016 Congestion Report Metropolitan Freeway System May 2017 2016 Congestion Report 1 Table of Contents Purpose and Need...3 Introduction...3 Methodology...4 2016 Results...5 Explanation of Percentage Miles
Performance Measure Summary - Seattle WA. Performance Measures and Definition of Terms
 Performance Measure Summary - Seattle WA There are several inventory and performance measures listed in the pages of this Urban Area Report for the years from 1982 to 2014. There is no single performance
Performance Measure Summary - Buffalo NY. Performance Measures and Definition of Terms
 Performance Measure Summary - Buffalo NY There are several inventory and performance measures listed in the pages of this Urban Area Report for the years from 1982 to 2014. There is no single performance
Performance Measure Summary - Fresno CA. Performance Measures and Definition of Terms
 Performance Measure Summary - Fresno CA There are several inventory and performance measures listed in the pages of this Urban Area Report for the years from 1982 to 2014. There is no single performance
Performance Measure Summary - Hartford CT. Performance Measures and Definition of Terms
 Performance Measure Summary - Hartford CT There are several inventory and performance measures listed in the pages of this Urban Area Report for the years from 1982 to 2014. There is no single performance
Performance Measure Summary - Boise ID. Performance Measures and Definition of Terms
 Performance Measure Summary - Boise ID There are several inventory and performance measures listed in the pages of this Urban Area Report for the years from 1982 to 2014. There is no single performance
Performance Measure Summary - Tucson AZ. Performance Measures and Definition of Terms
 Performance Measure Summary - Tucson AZ There are several inventory and performance measures listed in the pages of this Urban Area Report for the years from 1982 to 2014. There is no single performance
Performance Measure Summary - Wichita KS. Performance Measures and Definition of Terms
 Performance Measure Summary - Wichita KS There are several inventory and performance measures listed in the pages of this Urban Area Report for the years from 1982 to 2014. There is no single performance
Performance Measure Summary - Spokane WA. Performance Measures and Definition of Terms
 Performance Measure Summary - Spokane WA There are several inventory and performance measures listed in the pages of this Urban Area Report for the years from 1982 to 2014. There is no single performance
2 VALUE PROPOSITION VALUE PROPOSITION DEVELOPMENT
 2 VALUE PROPOSITION The purpose of the Value Proposition is to define a number of metrics or interesting facts that clearly demonstrate the value of the existing Xpress system to external audiences including
I-405 Corridor Master Plan
 Southern California Association of Governments I-405 Corridor Master Plan Presentation to Streets and Freeways Subcommittee October 13, 2015 1 Presentation Overview Expectations and Approach Corridor Performance
APPENDIX H. Transportation Impact Study
 APPENDIX H Transportation Impact Study BUENA VISTA LAGOON ENHANCEMENT PROJECT TRANSPORTATION IMPACT STUDY Prepared for: San Diego Association of Governments Prepared by: VRPA Technologies, Inc. 9520 Padgett
IV. ENVIRONMENTAL IMPACT ANALYSIS B. TRAFFIC AND CIRCULATION
 IV. ENVIRONMENTAL IMPACT ANALYSIS B. TRAFFIC AND CIRCULATION 1. INTRODUCTION This section is based on the technical report, Traffic Study for 10131 Constellation Boulevard Residential Project, prepared
Performance Measure Summary - Washington DC-VA-MD. Performance Measures and Definition of Terms
 Performance Measure Summary - Washington DC-VA-MD There are several inventory and performance measures listed in the pages of this Urban Area Report for the years from 1982 to 2014. There is no single
Performance Measure Summary - Charlotte NC-SC. Performance Measures and Definition of Terms
 Performance Measure Summary - Charlotte NC-SC There are several inventory and performance measures listed in the pages of this Urban Area Report for the years from 1982 to 2014. There is no single performance
Performance Measure Summary - Toledo OH-MI. Performance Measures and Definition of Terms
 Performance Measure Summary - Toledo OH-MI There are several inventory and performance measures listed in the pages of this Urban Area Report for the years from 1982 to 2014. There is no single performance
Performance Measure Summary - Pensacola FL-AL. Performance Measures and Definition of Terms
 Performance Measure Summary - Pensacola FL-AL There are several inventory and performance measures listed in the pages of this Urban Area Report for the years from 1982 to 2014. There is no single performance
Performance Measure Summary - Omaha NE-IA. Performance Measures and Definition of Terms
 Performance Measure Summary - Omaha NE-IA There are several inventory and performance measures listed in the pages of this Urban Area Report for the years from 1982 to 2014. There is no single performance
Performance Measure Summary - Nashville-Davidson TN. Performance Measures and Definition of Terms
 Performance Measure Summary - Nashville-Davidson TN There are several inventory and performance measures listed in the pages of this Urban Area Report for the years from 1982 to 2014. There is no single
Performance Measure Summary - Corpus Christi TX. Performance Measures and Definition of Terms
 Performance Measure Summary - Corpus Christi TX There are several inventory and performance measures listed in the pages of this Urban Area Report for the years from 1982 to 2014. There is no single performance
Letter EL652 City of Mercer Island. Page 1. No comments n/a
 Letter EL652 City of Mercer Island Page 1 No comments n/a Page 2 Response to comment EL652 1 Section 4.5.3 of the Final EIS presents the range of potential impacts of the project. This project also lists
Green Line Long-Term Investments
 Enhancements Short-term improvements to keep Austin moving. Investments Long-term projects to support our future. Mobility Hubs MetroRapid MetroRail MetroExpress Connectors Circulators Project Connect
6/6/2018. June 7, Item #1 CITIZENS PARTICIPATION
 June 7, 2018 Item #1 CITIZENS PARTICIPATION 1 Item #2 APPROVAL OF MINUTES Item #3 TRAC GOALS, FRAMEWORK & AGENDA REVIEW 2 COMMITTEE GOALS Learn about Southern Nevada s mobility challenges, new developments
Performance Measure Summary - Boston MA-NH-RI. Performance Measures and Definition of Terms
 Performance Measure Summary - Boston MA-NH-RI There are several inventory and performance measures listed in the pages of this Urban Area Report for the years from 1982 to 2014. There is no single performance
Performance Measure Summary - El Paso TX-NM. Performance Measures and Definition of Terms
 Performance Measure Summary - El Paso TX-NM There are several inventory and performance measures listed in the pages of this Urban Area Report for the years from 1982 to 2014. There is no single performance
Performance Measure Summary - Minneapolis-St. Paul MN-WI. Performance Measures and Definition of Terms
 Performance Measure Summary - Minneapolis-St. Paul MN-WI There are several inventory and performance measures listed in the pages of this Urban Area Report for the years from 1982 to 2014. There is no
Sepulveda Pass Corridor Systems Planning Study Final Compendium Report. Connecting the San Fernando Valley and the Westside
 Los Angeles County Metropolitan Transportation Authority November 2012 Connecting the San Fernando Valley and the Westside Interstate 405 Sepulveda Pass THIS PAGE INTENTIONALLY LEFT BLANK Sepulveda Pass
Metropolitan Freeway System 2013 Congestion Report
 Metropolitan Freeway System 2013 Congestion Report Metro District Office of Operations and Maintenance Regional Transportation Management Center May 2014 Table of Contents PURPOSE AND NEED... 1 INTRODUCTION...
Performance Measure Summary - New York-Newark NY-NJ-CT. Performance Measures and Definition of Terms
 Performance Measure Summary - New York-Newark NY-NJ-CT There are several inventory and performance measures listed in the pages of this Urban Area Report for the years from 1982 to 2014. There is no single
Escondido Marriott Hotel and Mixed-Use Condominium Project TRAFFIC IMPACT ANALYSIS REPORT
 Escondido Marriott Hotel and Mixed-Use Condominium Project TRAFFIC IMPACT ANALYSIS REPORT Prepared for Phelps Program Management 420 Sixth Avenue, Greeley, CO 80632 Prepared by 5050 Avenida Encinas, Suite
Craig Scheffler, P.E., PTOE HNTB North Carolina, P.C. HNTB Project File: Subject
 TECHNICAL MEMORANDUM To Kumar Neppalli Traffic Engineering Manager Town of Chapel Hill From Craig Scheffler, P.E., PTOE HNTB North Carolina, P.C. Cc HNTB Project File: 38435 Subject Obey Creek TIS 2022
Missouri Seat Belt Usage Survey for 2017
 Missouri Seat Belt Usage Survey for 2017 Conducted for the Highway Safety & Traffic Division of the Missouri Department of Transportation by The Missouri Safety Center University of Central Missouri Final
Valley Metro Overview. ITE/IMSA Spring Conference March 6, 2014
 Valley Metro Overview ITE/IMSA Spring Conference March 6, 2014 Valley Metro Who Are We? Operate Regional Transit Services Valley Metro and Phoenix are region s primary service providers Light Rail and
DRAFT TRANSPORTATION IMPACT STUDY CASTILIAN REDEVELOPMENT PROJECT
 DRAFT TRANSPORTATION IMPACT STUDY CASTILIAN REDEVELOPMENT PROJECT Prepared for: Submitted by: 299 Lava Ridge Ct. Suite 2 Roseville, CA. 95661 June 212 TABLE OF CONTENTS 1. Introduction... 1 Project Location
APPENDIX C1 TRAFFIC ANALYSIS DESIGN YEAR TRAFFIC ANALYSIS
 APPENDIX C1 TRAFFIC ANALYSIS DESIGN YEAR TRAFFIC ANALYSIS DESIGN YEAR TRAFFIC ANALYSIS February 2018 Highway & Bridge Project PIN 6754.12 Route 13 Connector Road Chemung County February 2018 Appendix
Spatial and Temporal Analysis of Real-World Empirical Fuel Use and Emissions
 Spatial and Temporal Analysis of Real-World Empirical Fuel Use and Emissions Extended Abstract 27-A-285-AWMA H. Christopher Frey, Kaishan Zhang Department of Civil, Construction and Environmental Engineering,
Green Line Extension to Torrance Supplemental Alternatives Analysis. 2. Purpose and Need 2. PURPOSE AND NEED
 2. PURPOSE AND NEED This chapter characterizes the transportation and mobility problems and identifies project goals, objectives, and evaluation criteria to improve these problems for the Green Line Extension
Alameda Countywide Transportation Model Update Final Model Documentation
 Alameda Countywide Transportation Model Update Final Model Documentation August, 2015 1 Table of Contents 1.0 Introduction... 5 1.1 Objectives of the Model Update... 5 2.0 Traffic Analysis Zone Structure...
Develop ground transportation improvements to make the Airport a multi-modal regional
 Project Overview TRANSPORTATION IMPROVEMENTS WHAT ARE THE PROJECT GOALS? Transportation transportation hub. Develop ground transportation improvements to make the Airport a multi-modal regional Land Use
Technical Memorandum Analysis Procedures and Mobility Performance Measures 100 Most Congested Texas Road Sections What s New for 2015
 Technical Memorandum Analysis Procedures and Mobility Performance Measures 100 Most Congested Texas Road Sections Prepared by Texas A&M Transportation Institute August 2015 This memo documents the analysis
Energy Technical Memorandum
 Southeast Extension Project Lincoln Station to RidgeGate Parkway Prepared for: Federal Transit Administration Prepared by: Denver Regional Transportation District May 2014 Table of Contents Page No. Chapter
Introduction and Background Study Purpose
 Introduction and Background The Brent Spence Bridge on I-71/75 across the Ohio River is arguably the single most important piece of transportation infrastructure the Ohio-Kentucky-Indiana (OKI) region.
4 COSTS AND OPERATIONS
 4 COSTS AND OPERATIONS 4.1 INTRODUCTION This chapter summarizes the estimated capital and operations and maintenance (O&M) costs for the Modal and High-Speed Train (HST) Alternatives evaluated in this
Toll Impact Study Tier 1 Environmental Impact Statement
 PPMS: 67587 PROJECT NO: 0081-961-111 PPMS: 67588 PROJECT NO: 0081-962-116 PPMS: 67589 PROJECT NO: 0081-968-123 Tier 1 Environmental Impact Statement This technical report was prepared to support the Tier
CHAPTER 7: EMISSION FACTORS/MOVES MODEL
 CHAPTER 7: EMISSION FACTORS/MOVES MODEL 7.1 Overview This chapter discusses development of the regional motor vehicle emissions analysis for the North Central Texas nonattainment area, including all key
BROWARD BOULEVARD CORRIDOR TRANSIT STUDY
 BROWARD BOULEVARD CORRIDOR TRANSIT STUDY FM # 42802411201 EXECUTIVE SUMMARY July 2012 GOBROWARD Broward Boulevard Corridor Transit Study FM # 42802411201 Executive Summary Prepared For: Ms. Khalilah Ffrench,
3.1 Introduction Transportation Elements and Study Area Meeting the Need for the Project
 Chapter 3 Transportation Environment and Consequences 3. Introduction This chapter summarizes the characteristics of the transportation system in the East Link Project vicinity and discusses potential