Trip Generation & Parking Occupancy Data Collection: Grocery Stores Student Chapter of Institute of Transportation Engineers at UCLA Spring 2014
|
|
|
- Agnes Stephens
- 6 years ago
- Views:
Transcription


1 Trip Generation & Parking Occupancy Data Collection: Grocery Stores Student Chapter of Institute of Transportation Engineers at UCLA Spring 2014 Page 1


2 Introduction The UCLA Institute of Transportation Engineers Student Chapter conducted a trip and parking generation study at two separate urban grocery stores operated by Whole Foods Market. The Gayley store is located at 1050 Gayley Avenue in the Westwood community of Los Angeles, California. The store is contained within a single tenant building providing a total gross floor area of 25,000 square Feet (sf) and provides 84 vehicle and 8 bike parking spaces on the ground level of the attached parking structure. Westwood serves as a commercial district for the nearby UCLA campus and adjacent residential neighborhoods. The Wilshire store is located at 2201 Wilshire Boulevard in Santa Monica, California. The total gross floor area of the store is 30,828 sf in a single tenant free-standing building. A total of 137 vehicle and 6 bike parking spaces are provided in a two level subterranean garage; additionally, 16 metered parking spaces are available on the curbs immediately adjacent to the store. This store is located along the active Wilshire Boulevard commercial corridor with residential neighborhoods located immediately to the north and south. Figures 1 and 2 respectively illustrate the locations of the Gayley and Wilshire stores, relative to their adjacent neighborhoods. Figure 1 Figure 2 Page 2
3 Data Collection Process This project required about 150 total person-hours of effort to complete successfully, which demanded collaborative efforts from chapter members and other student volunteers. The data collection process consisted of two components: parking occupancy surveys and trip generation surveys. In order to examine the difference in parking demands between weekdays and weekends, we counted on two weekdays and on one Saturday. The parking occupancy surveys were performed from January 8 11, For each store, two students counted occupied bicycle and car parking spaces every 30 minutes from 10:00 am to 10:00 pm. Due to logistical issues, the trip generation surveys were conducted from February 25 27, Both locations were counted for three consecutive weekdays (Tuesday through Thursday), during the morning (7:00 AM to 10:00 AM) and afternoon (5:00 PM to 8:00 PM) peak periods. A group of three students counted the number of cars, bicycles and pedestrians entering and exiting the site every 15 minutes. For the purposes of these surveys, the parking and trip generation surveys at the Gayley store included all vehicles entering/exiting and parking in the attached parking structure; this decision was based on a pre-survey field observation. At the Wilshire store, however, the parking and trip generation surveys included both on- and off-site vehicles; the pre-survey observation indicated store related activity occurred at the curbs of the adjacent streets. To the extent that the on-street activity was observed to be store related, that activity was counted as part of the surveys. Because observation of the on-street activity was limited to the adjacent curbs, there was some potential for under counting any activity extending into the residential neighborhood. Page 3
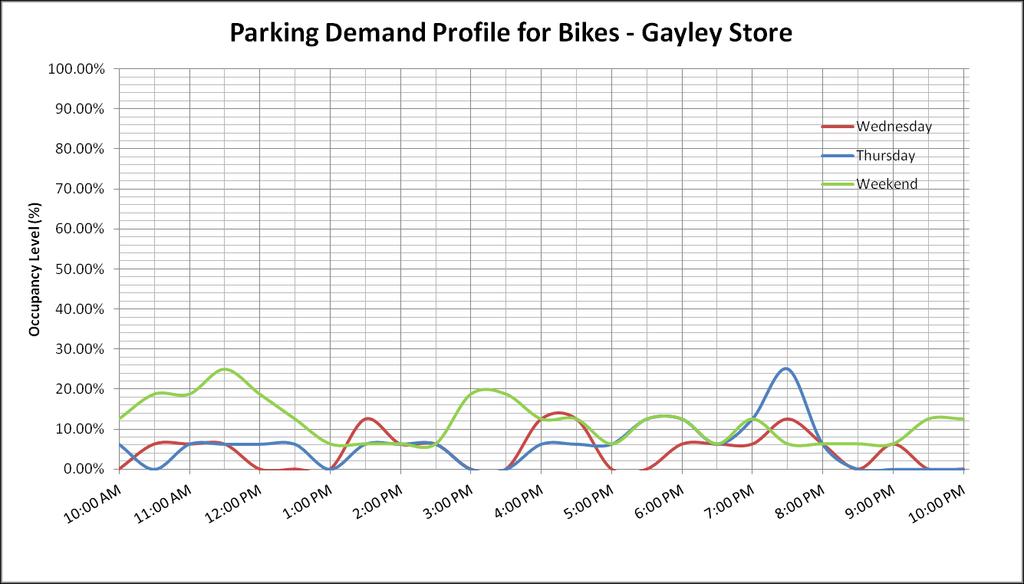
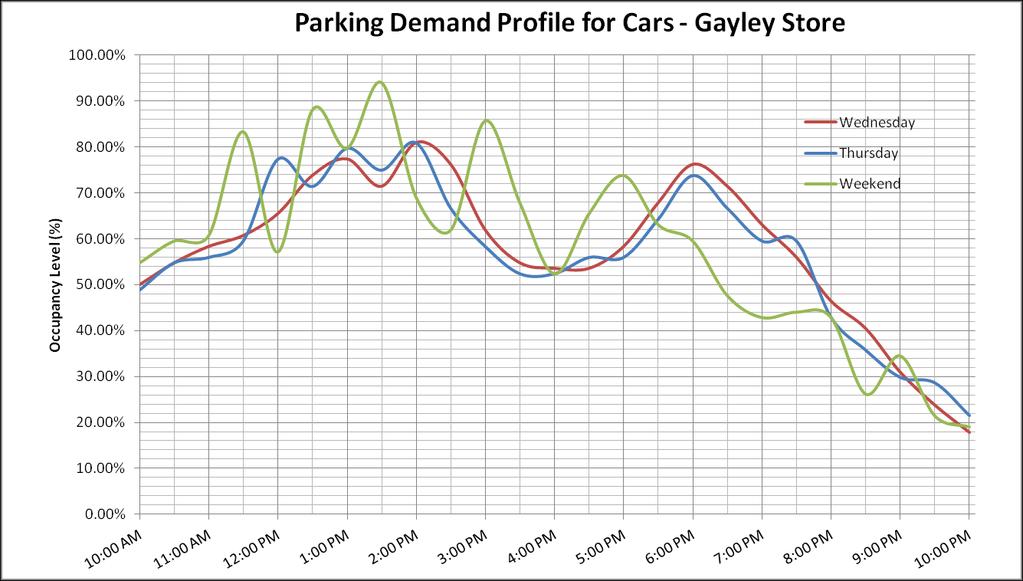
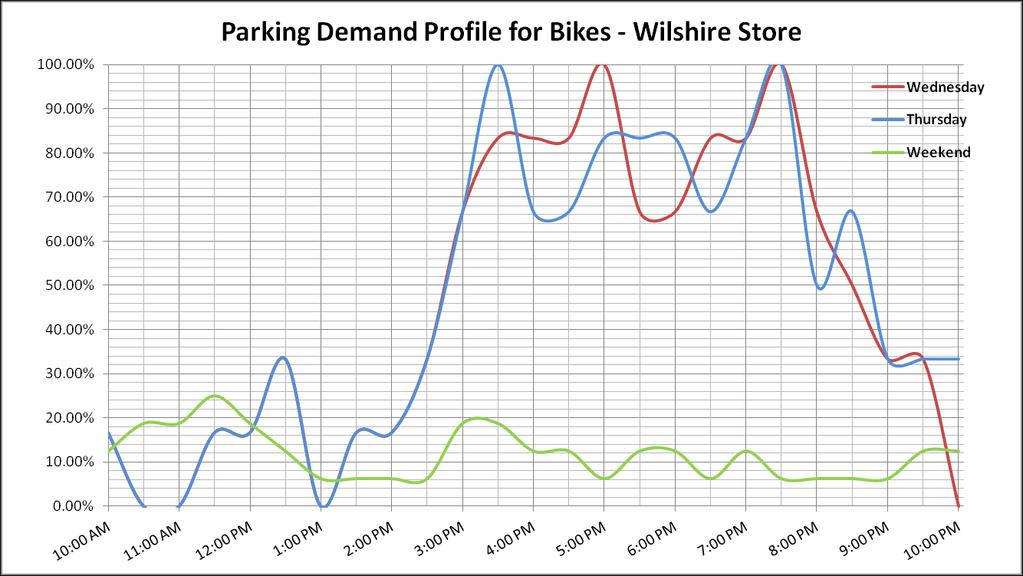
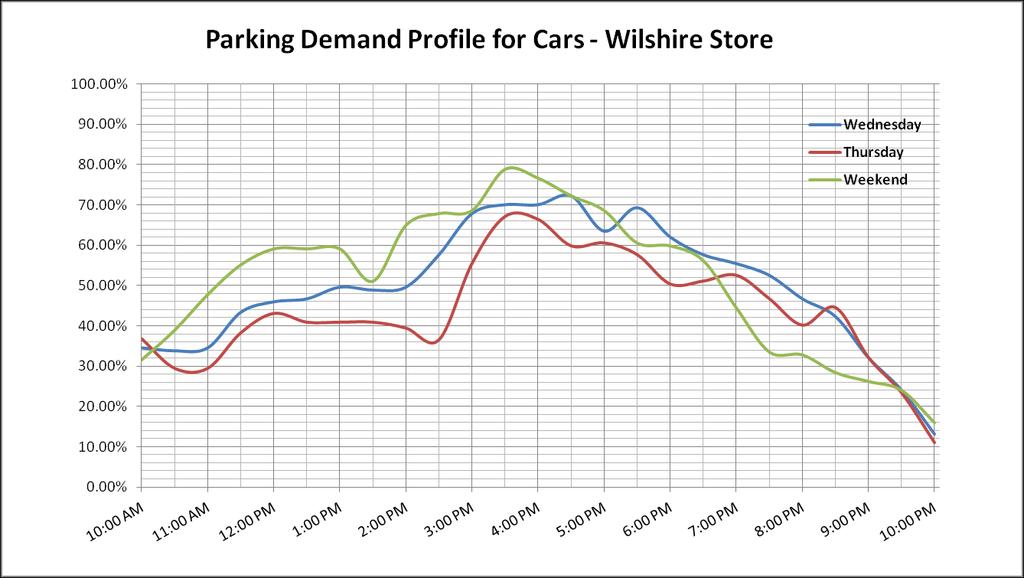
4 Results 1) Parking Demand Cars Bikes Weekday Weekend Weekday Weekend Gayley Wilshire Gayley Wilshire The survey data was reviewed to identify the peak parking demand observed during each day; an average peak demand was calculated from the survey days. This average peak demand was then used to calculate the parking demand rate per 1,000 square feet (ksf). This was applied to both the bicycle and car parking. For cars, we found that the highest weekday parking demand rate at the Gayley store was 2.7 spaces per 1,000 square feet (ksf) and 3.1 spaces/ksf at the Wilshire store. Similarly, the highest weekend parking demand rate at the Gayley store was calculated at 2.9 spaces/ksf and 3.5 spaces/ksf at the Wilshire store. For bikes, the highest weekday demand rate at the Gayley store was 0.1 spaces/ksf and 0.2 spaces/ksf at the Wilshire store. The highest weekend demand rate was 0.1 spaces/ksf at the Gayley store and 0.1 spaces/ksf at the Wilshire store. For urban locations of ITE Land Use Code 850, Parking Generation 4 th Edition identifies the average weekday and weekend parking demand rates as 2.27 spaces/ksf and 2.32 spaces/ksf, respectively. The results of the vehicle parking surveys indicate parking demand rates that are higher than the reference rates. The graphs below display the observed parking occupancy levels during the surveys. Page 4
5 Page 5
6 Page 6
7 2) Trip Generation The trip generation rates were calculated in a similar manner as the parking demand rates. The peak trips for each peak period of each survey day were identified; an average of the peak trips was identified and developed into a trip generation rate expressed per ksf. At the Gayley store, the average AM and PM peak hour trip rate was calculated at 6.16 and 11.6 trips/ksf, respectively. At the Wilshire store, the average AM and PM peak hour trip rate was calculated at 7.43 and 10.7 trips/ksf, respectively. For ITE Land Use Code 850, Trip Generation Manual 9 th Edition identifies the AM and PM peak hour trip rates at 3.40 and 9.48 trips/ksf, respectively. The results of the trip generation surveys indicate trips rates which are higher than the reference rates. The differences between the national average and our calculated rates are especially notable during the AM peak hour, where the surveyed rates nearly double the reference AM peak hour trip rate. This trend continues into the PM peak hour, where the surveyed trip rates are higher than the reference rate. The table below summarizes the peak hour trip generation observed on each survey day of each site, in addition to the average peak hour trip generation. The graphs illustrate the hourly profile of the trip generation (expressed as trips) during the surveys. Cars Gayley Tue Peak Hour Wed Peak Hour Thu Peak Hour Average Rate AM 123 8:15-9: :15-9: :00-9: PM 273 6:15-7: :30-7: :30-7: Wilshire Tue Peak Hour Wed Peak Hour Thu Peak Hour Average Rate AM 203 8:15-9: :00-10: :15-9: PM 350 6:15-7: :30-7: :00-7: Page 7
8 Page 8
9 Analysis From our observations, the discrepancies of national average with our calculations can be attributed to several factors: Size The size of these stores is generally defined by their urban location. While the surveyed stores are smaller relative to other supermarkets, the total number of trips may be similar. As the trip generation rates are calculated based on the gross square footage, a smaller store will naturally yield more trips per square foot; the trip rates may be higher as a result. Store Concept Whole Foods Market does not typically offer the same selection of products as a standard supermarket. Combined with the low number of other Whole Foods Market stores in the area, higher trip generation characteristics may be induced. In other words, customers may be more willing to drive further to shop at these stores. Location The two surveyed stores are conveniently located in a commercial corridor/district, adjacent to major employment centers with high daytime populations. The combination of commuter trips and regular customers may contribute towards the higher than average trip generation rates. Parking - Another significant factor is that both stores provide free parking for all of their customers. The availability of free and ample parking spaces may encourage customers to make trips more frequently via cars. This increased tendency to drive to the supermarket in combination, combined with the commuter demand described above may be contributing factors towards higher than average parking demand rate. The factors described above are believed to contribute towards the higher than average parking demand and trip generation rates that were calculated from our surveys. Page 9
10 UCLA ITE 2014 Data Collection Project Trip Generation Data Forms
11 Institute of Transportation Engineers Trip Generation Data Form (Part 1) Land Use/Building Type: Grocery Store ITE Land Use Code: 850 Source: Source No. (ITE use only): Name of Development: Whole Foods Market Day of the Week: Tuesday City: Los Angeles State/Province: CA Zip/Postal Code: Day: 25th Month: February Year: 2014 Country: USA Metropolitan Area: Los Angeles 1. For fast-food land use, please specify if hamburger- or nonhamburger-based. Location Within Area: (1) CBD (3) Suburban (Non-CBD) (5) Rural (2) Urban (Non-CBD) (4) Suburban CBD (6) Freeway Interchange Area (Rural) (7) Not Given Independent Variable: (include data for as many as possible) 2 Actual Estimated Actual Estimated (1) Employees (#) _84 (9) Parking Spaces (% occupied: ) (2) Persons (#) (10) Beds (% occupied: ) (3) Total Units (#) (indicate unit: ) (11) Seats (#) (4) Occupied Units (#) (indicate unit: ) (12) Servicing Positions/Vehicle Fueling 25,000 (5) Gross Floor Area (gross sq. ft.) Positions (% of development occupied ) (13) Shopping Center % Out-parcels/pads 12,000 (6) Net Rentable Area (sq. ft.) (14) A.M. Peak Hour Volume of Adjacent Street Traffic (7) Gross Leasable Area (sq. ft.) (15) P.M. Peak Hour Volume of Adjacent Street Traffic (% of development occupied ) (16) Other (8) Total Acres (% developed: ) (17) Other Detailed Description of Development: Gayley Ave Los Angeles, CA Definitions for several independent variables can be found in the Trip Generation, Second Edition, User s Guide Glossary. 3. Please provide all pertinent information to describe the subject project, including the presence of bicycle/pedestrian facilities. To report bicycle/pedestrian volumes, please refer to Part 4 of this data form. Other Data: Vehicle Occupancy (#): A.M. P.M. 24-hour % Percent by Transit: A.M. % P.M. % 24-hour % Percent by Carpool/Vanpool: A.M. % P.M. % 24-hour % Transportation Demand Management (TDM) Information: At the time of this study, was there a TDM program (that may have impacted the trip generation characteristics of this site) underway? No Yes (If yes, please check appropriate box/boxes, describe the nature of the TDM program(s) and provide a source for any studies that may help quantify this impact. Attach additional sheets if necessary) Employees by Shift: (1) Transit Service (5) Employer Support Measures (9) Tolls and Congestion Pricing Start End (2) Carpool Programs (6) Preferential HOV Treatments (10) Variable Work Hours/Compressed Work Weeks First Shift: Time Time Employees (#) (3) Vanpool Programs (7) Transit and Ridesharing Incentives (11) Telecommuting Start End (4) Bicycle/Pedestrian (8) Parking Supply and Pricing (12) Other Second Shift: Time Time Employees (#) Facilities and Site Management Start End Third Shift: Time Time Employees (#) Improvements Parking Cost on Site: Hourly Daily Please Complete Form on Other Side
12 Institute of Transportation Engineers Trip Generation Data Form (Part 2) Summary of Driveway Volumes (All = All Vehicles Counted, Including Trucks; Trucks = Heavy Duty Trucks and Buses) Average Weekday (M-F) Saturday Sunday Enter Exit Total Enter Exit Total Enter Exit Total All Trucks All Trucks All Trucks All Trucks All Trucks All Trucks All Trucks All Trucks All Trucks 24-Hour Volume A.M. Peak Hour of Adjacent 1 Street Traffic (7 10) Time: 8:15-9:15 P.M. Peak Hour of Adjacent 1 Street Traffic (5 8) Time: 6:15-7:15 A.M. Peak Hour Generator 2 Time: 8:15-9:15 P.M. Peak Hour Generator 2 Time: 6:15 7:15 Peak Hour Generator 3 Time (Weekend): Highest hourly volume between 7 a.m. and 9 a.m. (4 p.m. and 6 p.m.). Please specify the peak hour. 2. Highest hourly volume during the a.m. or p.m. period. Please specify the peak hour. 3. Highest hourly volume during the entire day. Please specify the peak hour. Please refer to the Trip Generation User s Guide for full definition of terms. Hourly Driveway Volumes- Average Weekday (M-F) A.M. Period Enter Exit Total Mid-Day Period Enter Exit Total P.M. Period Enter Exit Total All Trucks All Trucks All Trucks All Trucks All Trucks All Trucks All Trucks All Trucks All Trucks 7:00-8: :00-12:00 5:00-6: :15-8: :15-12:15 5:15-6: :30-8: :30-12:30 5:30-6: :45-8: :45-12:45 5:45-6: :00-9: :00-1:00 6:00-7: :15-9: :15-1:15 6:15-7: :30-9: :30-1:30 6:30-7: :45-9: :45-1:45 6:45-7: :00-10: :00-2:00 7:00-8: Check if Part 3, 4 and/or additional information is attached. Survey conducted by: Name: Organization: Address: City/State/Zip: Telephone #: Fax #: Please return to: Institute of Transportation Engineers Technical Projects Division 1627 Eye Street, NW, Suite 600 Washington, DC USA Telephone: Fax: ITE on the Web:
13 Name/Organization: UCLA ITE Telephone Number: Institute of Transportation Engineers Trip Generation Data Form (Part 3) City/State: Los Angeles / CA Detailed Driveway Volumes: Attach this sheet to Parts 1 and 2 if you are providing additional information. Day of the week: (All = All Vehicles Counted, Including Trucks; Trucks = Heavy Duty Trucks and Buses) A.M. Period Enter Exit Total P.M. Period Enter Exit Total All Trucks All Trucks All Trucks All Trucks All Trucks All Trucks 12:00-12:15 12:00-12:15 12:15-12:30 12:15-12:30 12:30-12:45 12:30-12:45 12:45-1:00 12:45-1:00 1:00-1:15 1:00-1:15 1:15-1:30 1:15-1:30 1:30-1:45 1:30-1:45 1:45-2:00 1:45-2:00 2:00-2:15 2:00-2:15 2:15-2:30 2:15-2:30 2:30-2:45 2:30-2:45 2:45-3:00 2:45-3:00 3:00-3:15 3:00-3:15 3:15-3:30 3:15-3:30 3:30-3:45 3:30-3:45 3:45-4:00 3:45-4:00 4:00-4:15 4:00-4:15 4:15-4:30 4:15-4:30 4:30-4:45 4:30-4:45 4:45-5:00 4:45-5:00 5:00-5:15 5:00-5: :15-5:30 5:15-5: :30-5:45 5:30-5: :45-6:00 5:45-6: :00-6:15 6:00-6: :15-6:30 6:15-6: :30-6:45 6:30-6: :45-7:00 6:45-7: :00-7: :00-7: :15-7: :15-7: :30-7: :30-7: :45-8: :45-8: :00-8: :00-8:15 8:15-8: :15-8:30 8:30-8: :30-8:45 8:45-9: :45-9:00 9:00-9: :00-9:15 9:15-9: :15-9:30 9:30-9: :30-9:45 9:45-10: :45-10:00 10:00-10:15 10:00-10:15 10:15-10:30 10:15-10:30 10:30-10:45 10:30-10:45 10:45-11:00 10:45-11:00 11:00-11:15 11:00-11:15 11:15-11:30 11:15-11:30 11:30-11:45 11:30-11:45 11:45-12:00 11:45-12:00
14 Summary of Bicycle Volumes Institute of Transportation Engineers Trip Generation Data Form (Part 4) Average Weekday (M-F) Saturday Sunday Enter Exit Total Enter Exit Total Enter Exit Total 24-Hour Volume A.M. Peak Hour of Adjacent 1 Street Traffic (8 10) Time: 7:00 8:00 P.M. Peak Hour of Adjacent 1 Street Traffic (5 8) Time: 5:00 6:00 A.M. Peak Hour Generator 2 Time: 7:00 8:00 P.M. Peak Hour Generator 2 Time: 5:00 6:00 Peak Hour Generator 3 Time (Weekend): Highest hourly volume between 7 a.m. and 9 a.m. (4 p.m. and 6 p.m.) as defined in Trip Generation Data Form (Part 2). Please specify the peak hour. 2. Highest hourly volume during the a.m. or p.m. period. Please specify the peak hour. 3. Highest hourly volume during the entire day. Please specify the peak hour. Please attach supplemental hourly volumes. Please refer to the Trip Generation User s Guide for full definition of terms. Summary of Pedestrian Volumes Average Weekday (M-F) Saturday Sunday Enter Exit Total Enter Exit Total Enter Exit Total 24-Hour Volume A.M. Peak Hour of Adjacent 1 Street Traffic (7 10) Time: 7:00 8:00 P.M. Peak Hour of Adjacent 1 Street Traffic (5 8) Time: 6:00 7:00 A.M. Peak Hour Generator 2 Time: 7:00 8:00 P.M. Peak Hour Generator 2 Time: 6:00 7:00 Peak Hour Generator 3 Time (Weekend):
15 Institute of Transportation Engineers Trip Generation Data Form (Part 1) Land Use/Building Type: Grocery Store ITE Land Use Code: 850 Source: Source No. (ITE use only): Name of Development: Whole Foods Market Day of the Week: Wednesday City: Los Angeles State/Province: CA Zip/Postal Code: Day: 26th Month: February Year: 2014 Country: USA Metropolitan Area: Los Angeles 1. For fast-food land use, please specify if hamburger- or nonhamburger-based. Location Within Area: (1) CBD (3) Suburban (Non-CBD) (5) Rural (2) Urban (Non-CBD) (4) Suburban CBD (6) Freeway Interchange Area (Rural) (7) Not Given Independent Variable: (include data for as many as possible) 2 Actual Estimated Actual Estimated (1) Employees (#) _84 (9) Parking Spaces (% occupied: ) (2) Persons (#) (10) Beds (% occupied: ) (3) Total Units (#) (indicate unit: ) (11) Seats (#) (4) Occupied Units (#) (indicate unit: ) (12) Servicing Positions/Vehicle Fueling 25,000 (5) Gross Floor Area (gross sq. ft.) Positions (% of development occupied ) (13) Shopping Center % Out-parcels/pads 12,000 (6) Net Rentable Area (sq. ft.) (14) A.M. Peak Hour Volume of Adjacent Street Traffic (7) Gross Leasable Area (sq. ft.) (15) P.M. Peak Hour Volume of Adjacent Street Traffic (% of development occupied ) (16) Other (8) Total Acres (% developed: ) (17) Other Detailed Description of Development: Gayley Ave Los Angeles, CA Definitions for several independent variables can be found in the Trip Generation, Second Edition, User s Guide Glossary. 3. Please provide all pertinent information to describe the subject project, including the presence of bicycle/pedestrian facilities. To report bicycle/pedestrian volumes, please refer to Part 4 of this data form. Other Data: Vehicle Occupancy (#): A.M. P.M. 24-hour % Percent by Transit: A.M. % P.M. % 24-hour % Percent by Carpool/Vanpool: A.M. % P.M. % 24-hour % Transportation Demand Management (TDM) Information: At the time of this study, was there a TDM program (that may have impacted the trip generation characteristics of this site) underway? No Yes (If yes, please check appropriate box/boxes, describe the nature of the TDM program(s) and provide a source for any studies that may help quantify this impact. Attach additional sheets if necessary) Employees by Shift: (1) Transit Service (5) Employer Support Measures (9) Tolls and Congestion Pricing Start End (2) Carpool Programs (6) Preferential HOV Treatments (10) Variable Work Hours/Compressed Work Weeks First Shift: Time Time Employees (#) (3) Vanpool Programs (7) Transit and Ridesharing Incentives (11) Telecommuting Start End (4) Bicycle/Pedestrian (8) Parking Supply and Pricing (12) Other Second Shift: Time Time Employees (#) Facilities and Site Management Start End Third Shift: Time Time Employees (#) Improvements Parking Cost on Site: Hourly Daily Please Complete Form on Other Side
16 Institute of Transportation Engineers Trip Generation Data Form (Part 2) Summary of Driveway Volumes (All = All Vehicles Counted, Including Trucks; Trucks = Heavy Duty Trucks and Buses) Average Weekday (M-F) Saturday Sunday Enter Exit Total Enter Exit Total Enter Exit Total All Trucks All Trucks All Trucks All Trucks All Trucks All Trucks All Trucks All Trucks All Trucks 24-Hour Volume A.M. Peak Hour of Adjacent 1 Street Traffic (7 10) Time: 8:15-9:15 P.M. Peak Hour of Adjacent 1 Street Traffic (5 8) Time: 6:30-7:30 A.M. Peak Hour Generator 2 Time: 8:15-9:15 P.M. Peak Hour Generator 2 Time: 6:30-7:30 Peak Hour Generator 3 Time (Weekend): Highest hourly volume between 7 a.m. and 9 a.m. (4 p.m. and 6 p.m.). Please specify the peak hour. 2. Highest hourly volume during the a.m. or p.m. period. Please specify the peak hour. 3. Highest hourly volume during the entire day. Please specify the peak hour. Please refer to the Trip Generation User s Guide for full definition of terms. Hourly Driveway Volumes- Average Weekday (M-F) A.M. Period Enter Exit Total Mid-Day Period Enter Exit Total P.M. Period Enter Exit Total All Trucks All Trucks All Trucks All Trucks All Trucks All Trucks All Trucks All Trucks All Trucks 7:00-8: :00-12:00 5:00-6: :15-8: :15-12:15 5:15-6: :30-8: :30-12:30 5:30-6: :45-8: :45-12:45 5:45-6: :00-9: :00-1:00 6:00-7: :15-9: :15-1:15 6:15-7: :30-9: :30-1:30 6:30-7: :45-9: :45-1:45 6:45-7: :00-10: :00-2:00 7:00-8: Check if Part 3, 4 and/or additional information is attached. Survey conducted by: Name: Organization: Address: City/State/Zip: Telephone #: Fax #: Please return to: Institute of Transportation Engineers Technical Projects Division 1627 Eye Street, NW, Suite 600 Washington, DC USA Telephone: Fax: ITE on the Web:
17 Name/Organization: UCLA ITE Telephone Number: Institute of Transportation Engineers Trip Generation Data Form (Part 3) City/State: Los Angeles / CA Detailed Driveway Volumes: Attach this sheet to Parts 1 and 2 if you are providing additional information. Day of the week: (All = All Vehicles Counted, Including Trucks; Trucks = Heavy Duty Trucks and Buses) A.M. Period Enter Exit Total P.M. Period Enter Exit Total All Trucks All Trucks All Trucks All Trucks All Trucks All Trucks 12:00-12:15 12:00-12:15 12:15-12:30 12:15-12:30 12:30-12:45 12:30-12:45 12:45-1:00 12:45-1:00 1:00-1:15 1:00-1:15 1:15-1:30 1:15-1:30 1:30-1:45 1:30-1:45 1:45-2:00 1:45-2:00 2:00-2:15 2:00-2:15 2:15-2:30 2:15-2:30 2:30-2:45 2:30-2:45 2:45-3:00 2:45-3:00 3:00-3:15 3:00-3:15 3:15-3:30 3:15-3:30 3:30-3:45 3:30-3:45 3:45-4:00 3:45-4:00 4:00-4:15 4:00-4:15 4:15-4:30 4:15-4:30 4:30-4:45 4:30-4:45 4:45-5:00 4:45-5:00 5:00-5:15 5:00-5: :15-5:30 5:15-5: :30-5:45 5:30-5: :45-6:00 5:45-6: :00-6:15 6:00-6: :15-6:30 6:15-6: :30-6:45 6:30-6: :45-7:00 6:45-7: :00-7: :00-7: :15-7: :15-7: :30-7: :30-7: :45-8: :45-8: :00-8: :00-8:15 8:15-8: :15-8:30 8:30-8: :30-8:45 8:45-9: :45-9:00 9:00-9: :00-9:15 9:15-9: :15-9:30 9:30-9: :30-9:45 9:45-10: :45-10:00 10:00-10:15 10:00-10:15 10:15-10:30 10:15-10:30 10:30-10:45 10:30-10:45 10:45-11:00 10:45-11:00 11:00-11:15 11:00-11:15 11:15-11:30 11:15-11:30 11:30-11:45 11:30-11:45 11:45-12:00 11:45-12:00
18 Summary of Bicycle Volumes Institute of Transportation Engineers Trip Generation Data Form (Part 4) Average Weekday (M-F) Saturday Sunday Enter Exit Total Enter Exit Total Enter Exit Total 24-Hour Volume A.M. Peak Hour of Adjacent 1 Street Traffic (8 10) Time: 7:00 8:00 P.M. Peak Hour of Adjacent 1 Street Traffic (5 8) Time: 5:00 6:00 A.M. Peak Hour Generator 2 Time: 7:00 8:00 P.M. Peak Hour Generator 2 Time: 5:00 6:00 Peak Hour Generator 3 Time (Weekend): Highest hourly volume between 7 a.m. and 9 a.m. (4 p.m. and 6 p.m.) as defined in Trip Generation Data Form (Part 2). Please specify the peak hour. 2. Highest hourly volume during the a.m. or p.m. period. Please specify the peak hour. 3. Highest hourly volume during the entire day. Please specify the peak hour. Please attach supplemental hourly volumes. Please refer to the Trip Generation User s Guide for full definition of terms. Summary of Pedestrian Volumes Average Weekday (M-F) Saturday Sunday Enter Exit Total Enter Exit Total Enter Exit Total 24-Hour Volume A.M. Peak Hour of Adjacent 1 Street Traffic (7 10) Time: 7:00 8:00 P.M. Peak Hour of Adjacent 1 Street Traffic (5 8) Time: 6:00 7:00 A.M. Peak Hour Generator 2 Time: 7:00 8:00 P.M. Peak Hour Generator 2 Time: 6:00 7:00 Peak Hour Generator 3 Time (Weekend):
19 Institute of Transportation Engineers Trip Generation Data Form (Part 1) Land Use/Building Type: Grocery Store ITE Land Use Code: 850 Source: Source No. (ITE use only): Name of Development: Whole Foods Market Day of the Week: Thursday City: Los Angeles State/Province: CA Zip/Postal Code: Day: 27th Month: February Year: 2014 Country: USA Metropolitan Area: Los Angeles 1. For fast-food land use, please specify if hamburger- or nonhamburger-based. Location Within Area: (1) CBD (3) Suburban (Non-CBD) (5) Rural (2) Urban (Non-CBD) (4) Suburban CBD (6) Freeway Interchange Area (Rural) (7) Not Given Independent Variable: (include data for as many as possible) 2 Actual Estimated Actual Estimated (1) Employees (#) _84 (9) Parking Spaces (% occupied: ) (2) Persons (#) (10) Beds (% occupied: ) (3) Total Units (#) (indicate unit: ) (11) Seats (#) (4) Occupied Units (#) (indicate unit: ) (12) Servicing Positions/Vehicle Fueling 25,000 (5) Gross Floor Area (gross sq. ft.) Positions (% of development occupied ) (13) Shopping Center % Out-parcels/pads 12,000 (6) Net Rentable Area (sq. ft.) (14) A.M. Peak Hour Volume of Adjacent Street Traffic (7) Gross Leasable Area (sq. ft.) (15) P.M. Peak Hour Volume of Adjacent Street Traffic (% of development occupied ) (16) Other (8) Total Acres (% developed: ) (17) Other Detailed Description of Development: Gayley Ave Los Angeles, CA Definitions for several independent variables can be found in the Trip Generation, Second Edition, User s Guide Glossary. 3. Please provide all pertinent information to describe the subject project, including the presence of bicycle/pedestrian facilities. To report bicycle/pedestrian volumes, please refer to Part 4 of this data form. Other Data: Vehicle Occupancy (#): A.M. P.M. 24-hour % Percent by Transit: A.M. % P.M. % 24-hour % Percent by Carpool/Vanpool: A.M. % P.M. % 24-hour % Transportation Demand Management (TDM) Information: At the time of this study, was there a TDM program (that may have impacted the trip generation characteristics of this site) underway? No Yes (If yes, please check appropriate box/boxes, describe the nature of the TDM program(s) and provide a source for any studies that may help quantify this impact. Attach additional sheets if necessary) Employees by Shift: (1) Transit Service (5) Employer Support Measures (9) Tolls and Congestion Pricing Start End (2) Carpool Programs (6) Preferential HOV Treatments (10) Variable Work Hours/Compressed Work Weeks First Shift: Time Time Employees (#) (3) Vanpool Programs (7) Transit and Ridesharing Incentives (11) Telecommuting Start End (4) Bicycle/Pedestrian (8) Parking Supply and Pricing (12) Other Second Shift: Time Time Employees (#) Facilities and Site Management Start End Third Shift: Time Time Employees (#) Improvements Parking Cost on Site: Hourly Daily Please Complete Form on Other Side
20 Institute of Transportation Engineers Trip Generation Data Form (Part 2) Summary of Driveway Volumes (All = All Vehicles Counted, Including Trucks; Trucks = Heavy Duty Trucks and Buses) Average Weekday (M-F) Saturday Sunday Enter Exit Total Enter Exit Total Enter Exit Total All Trucks All Trucks All Trucks All Trucks All Trucks All Trucks All Trucks All Trucks All Trucks 24-Hour Volume A.M. Peak Hour of Adjacent 1 Street Traffic (7 10) Time: 8:00-9:00 P.M. Peak Hour of Adjacent 1 Street Traffic (5 8) Time: 6:30-7:30 A.M. Peak Hour Generator 2 Time: 8:00-9:00 P.M. Peak Hour Generator 2 Time: 6:30-7:30 Peak Hour Generator 3 Time (Weekend): Highest hourly volume between 7 a.m. and 9 a.m. (4 p.m. and 6 p.m.). Please specify the peak hour. 2. Highest hourly volume during the a.m. or p.m. period. Please specify the peak hour. 3. Highest hourly volume during the entire day. Please specify the peak hour. Please refer to the Trip Generation User s Guide for full definition of terms. Hourly Driveway Volumes- Average Weekday (M-F) A.M. Period Enter Exit Total Mid-Day Period Enter Exit Total P.M. Period Enter Exit Total All Trucks All Trucks All Trucks All Trucks All Trucks All Trucks All Trucks All Trucks All Trucks 7:00-8: :00-12:00 5:00-6: :15-8: :15-12:15 5:15-6: :30-8: :30-12:30 5:30-6: :45-8: :45-12:45 5:45-6: :00-9: :00-1:00 6:00-7: :15-9: :15-1:15 6:15-7: :30-9: :30-1:30 6:30-7: :45-9: :45-1:45 6:45-7: :00-10: :00-2:00 7:00-8: Check if Part 3, 4 and/or additional information is attached. Survey conducted by: Name: Organization: Address: City/State/Zip: Telephone #: Fax #: Please return to: Institute of Transportation Engineers Technical Projects Division 1627 Eye Street, NW, Suite 600 Washington, DC USA Telephone: Fax: ITE on the Web:
21 Name/Organization: UCLA ITE Telephone Number: Institute of Transportation Engineers Trip Generation Data Form (Part 3) City/State: Los Angeles / CA Detailed Driveway Volumes: Attach this sheet to Parts 1 and 2 if you are providing additional information. Day of the week: (All = All Vehicles Counted, Including Trucks; Trucks = Heavy Duty Trucks and Buses) A.M. Period Enter Exit Total P.M. Period Enter Exit Total All Trucks All Trucks All Trucks All Trucks All Trucks All Trucks 12:00-12:15 12:00-12:15 12:15-12:30 12:15-12:30 12:30-12:45 12:30-12:45 12:45-1:00 12:45-1:00 1:00-1:15 1:00-1:15 1:15-1:30 1:15-1:30 1:30-1:45 1:30-1:45 1:45-2:00 1:45-2:00 2:00-2:15 2:00-2:15 2:15-2:30 2:15-2:30 2:30-2:45 2:30-2:45 2:45-3:00 2:45-3:00 3:00-3:15 3:00-3:15 3:15-3:30 3:15-3:30 3:30-3:45 3:30-3:45 3:45-4:00 3:45-4:00 4:00-4:15 4:00-4:15 4:15-4:30 4:15-4:30 4:30-4:45 4:30-4:45 4:45-5:00 4:45-5:00 5:00-5:15 5:00-5: :15-5:30 5:15-5: :30-5:45 5:30-5: :45-6:00 5:45-6: :00-6:15 6:00-6: :15-6:30 6:15-6: :30-6:45 6:30-6: :45-7:00 6:45-7: :00-7: :00-7: :15-7: :15-7: :30-7: :30-7: :45-8: :45-8: :00-8: :00-8:15 8:15-8: :15-8:30 8:30-8: :30-8:45 8:45-9: :45-9:00 9:00-9: :00-9:15 9:15-9: :15-9:30 9:30-9: :30-9:45 9:45-10: :45-10:00 10:00-10:15 10:00-10:15 10:15-10:30 10:15-10:30 10:30-10:45 10:30-10:45 10:45-11:00 10:45-11:00 11:00-11:15 11:00-11:15 11:15-11:30 11:15-11:30 11:30-11:45 11:30-11:45 11:45-12:00 11:45-12:00
22 Summary of Bicycle Volumes Institute of Transportation Engineers Trip Generation Data Form (Part 4) Average Weekday (M-F) Saturday Sunday Enter Exit Total Enter Exit Total Enter Exit Total 24-Hour Volume A.M. Peak Hour of Adjacent 1 Street Traffic (8 10) Time: 7:00 8:00 P.M. Peak Hour of Adjacent 1 Street Traffic (5 8) Time: 5:00 6:00 A.M. Peak Hour Generator 2 Time: 7:00 8:00 P.M. Peak Hour Generator 2 Time: 5:00 6:00 Peak Hour Generator 3 Time (Weekend): Highest hourly volume between 7 a.m. and 9 a.m. (4 p.m. and 6 p.m.) as defined in Trip Generation Data Form (Part 2). Please specify the peak hour. 2. Highest hourly volume during the a.m. or p.m. period. Please specify the peak hour. 3. Highest hourly volume during the entire day. Please specify the peak hour. Please attach supplemental hourly volumes. Please refer to the Trip Generation User s Guide for full definition of terms. Summary of Pedestrian Volumes Average Weekday (M-F) Saturday Sunday Enter Exit Total Enter Exit Total Enter Exit Total 24-Hour Volume A.M. Peak Hour of Adjacent 1 Street Traffic (7 10) Time: 9:00 10:00 P.M. Peak Hour of Adjacent 1 Street Traffic (5 8) Time: 5:00 6:00 A.M. Peak Hour Generator 2 Time: 9:00 10:00 P.M. Peak Hour Generator 2 Time: 5:00 6:00 Peak Hour Generator 3 Time (Weekend):
23 Institute of Transportation Engineers Trip Generation Data Form (Part 1) Land Use/Building Type: Grocery Store ITE Land Use Code: 850 Source: Source No. (ITE use only): Name of Development: Whole Foods Day of the Week: Tuesday City: Santa Monica State/Province: CA Zip/Postal Code: Day: 25th Month: February Year: 2014 Country: USA Metropolitan Area: Los Angeles 1. For fast-food land use, please specify if hamburger- or nonhamburger-based. Location Within Area: (1) CBD (3) Suburban (Non-CBD) (5) Rural (2) Urban (Non-CBD) (4) Suburban CBD (6) Freeway Interchange Area (Rural) (7) Not Given Independent Variable: (include data for as many as possible) 2 Actual Estimated Actual Estimated (1) Employees (#) 137 (9) Parking Spaces (% occupied: ) (2) Persons (#) (10) Beds (% occupied: ) (3) Total Units (#) (indicate unit: ) (11) Seats (#) (4) Occupied Units (#) (indicate unit: ) (12) Servicing Positions/Vehicle Fueling 30,828 (5) Gross Floor Area (gross sq. ft.) Positions (% of development occupied ) (13) Shopping Center % Out-parcels/pads 13,315 (6) Net Rentable Area (sq. ft.) (14) A.M. Peak Hour Volume of Adjacent Street Traffic (7) Gross Leasable Area (sq. ft.) (15) P.M. Peak Hour Volume of Adjacent Street Traffic (% of development occupied ) (16) Other (8) Total Acres (% developed: ) (17) Other Detailed Description of Development: Wilshire Blvd Santa Monica, CA Definitions for several independent variables can be found in the Trip Generation, Second Edition, User s Guide Glossary. 3. Please provide all pertinent information to describe the subject project, including the presence of bicycle/pedestrian facilities. To report bicycle/pedestrian volumes, please refer to Part 4 of this data form. Other Data: Vehicle Occupancy (#): A.M. P.M. 24-hour % Percent by Transit: A.M. % P.M. % 24-hour % Percent by Carpool/Vanpool: A.M. % P.M. % 24-hour % Transportation Demand Management (TDM) Information: At the time of this study, was there a TDM program (that may have impacted the trip generation characteristics of this site) underway? No Yes (If yes, please check appropriate box/boxes, describe the nature of the TDM program(s) and provide a source for any studies that may help quantify this impact. Attach additional sheets if necessary) Employees by Shift: (1) Transit Service (5) Employer Support Measures (9) Tolls and Congestion Pricing Start End (2) Carpool Programs (6) Preferential HOV Treatments (10) Variable Work Hours/Compressed Work Weeks First Shift: Time Time Employees (#) (3) Vanpool Programs (7) Transit and Ridesharing Incentives (11) Telecommuting Start End (4) Bicycle/Pedestrian (8) Parking Supply and Pricing (12) Other Second Shift: Time Time Employees (#) Facilities and Site Management Start End Third Shift: Time Time Employees (#) Improvements Parking Cost on Site: Hourly Daily Please Complete Form on Other Side
24 Institute of Transportation Engineers Trip Generation Data Form (Part 2) Summary of Driveway Volumes (All = All Vehicles Counted, Including Trucks; Trucks = Heavy Duty Trucks and Buses) Average Weekday (M-F) Saturday Sunday Enter Exit Total Enter Exit Total Enter Exit Total All Trucks All Trucks All Trucks All Trucks All Trucks All Trucks All Trucks All Trucks All Trucks 24-Hour Volume A.M. Peak Hour of Adjacent 1 Street Traffic (7 10) Time: 8:15-9:15 P.M. Peak Hour of Adjacent 1 Street Traffic (5 8) Time: 6:15 7:15 A.M. Peak Hour Generator 2 Time: 9:00-10:00 P.M. Peak Hour Generator 2 Time: 6:15 7:15 Peak Hour Generator 3 Time (Weekend): Highest hourly volume between 7 a.m. and 9 a.m. (4 p.m. and 6 p.m.). Please specify the peak hour. 2. Highest hourly volume during the a.m. or p.m. period. Please specify the peak hour. 3. Highest hourly volume during the entire day. Please specify the peak hour. Please refer to the Trip Generation User s Guide for full definition of terms. Hourly Driveway Volumes- Average Weekday (M-F) A.M. Period Enter Exit Total Mid-Day Period Enter Exit Total P.M. Period Enter Exit Total All Trucks All Trucks All Trucks All Trucks All Trucks All Trucks All Trucks All Trucks All Trucks 7:00-8: :00-12:00 5:00-6: :15-8: :15-12:15 5:15-6: :30-8: :30-12:30 5:30-6: :45-8: :45-12:45 5:45-6: :00-9: :00-1:00 6:00-7: :15-9: :15-1:15 6:15-7: :30-9: :30-1:30 6:30-7: :45-9: :45-1:45 6:45-7: :00-10: :00-2:00 7:00-8: Check if Part 3, 4 and/or additional information is attached. Survey conducted by: Name: Organization: Address: City/State/Zip: Telephone #: Fax #: Please return to: Institute of Transportation Engineers Technical Projects Division 1627 Eye Street, NW, Suite 600 Washington, DC USA Telephone: Fax: ITE on the Web:
25 Name/Organization: UCLA ITE Telephone Number: Institute of Transportation Engineers Trip Generation Data Form (Part 3) City/State: Santa Monica / CA Detailed Driveway Volumes: Attach this sheet to Parts 1 and 2 if you are providing additional information. Day of the week: (All = All Vehicles Counted, Including Trucks; Trucks = Heavy Duty Trucks and Buses) A.M. Period Enter Exit Total P.M. Period Enter Exit Total All Trucks All Trucks All Trucks All Trucks All Trucks All Trucks 12:00-12:15 12:00-12:15 12:15-12:30 12:15-12:30 12:30-12:45 12:30-12:45 12:45-1:00 12:45-1:00 1:00-1:15 1:00-1:15 1:15-1:30 1:15-1:30 1:30-1:45 1:30-1:45 1:45-2:00 1:45-2:00 2:00-2:15 2:00-2:15 2:15-2:30 2:15-2:30 2:30-2:45 2:30-2:45 2:45-3:00 2:45-3:00 3:00-3:15 3:00-3:15 3:15-3:30 3:15-3:30 3:30-3:45 3:30-3:45 3:45-4:00 3:45-4:00 4:00-4:15 4:00-4:15 4:15-4:30 4:15-4:30 4:30-4:45 4:30-4:45 4:45-5:00 4:45-5:00 5:00-5:15 5:00-5: :15-5:30 5:15-5: :30-5:45 5:30-5: :45-6:00 5:45-6: :00-6:15 6:00-6: :15-6:30 6:15-6: :30-6:45 6:30-6: :45-7:00 6:45-7: :00-7: :00-7: :15-7: :15-7: :30-7: :30-7: :45-8: :45-8: :00-8: :00-8:15 8:15-8: :15-8:30 8:30-8: :30-8:45 8:45-9: :45-9:00 9:00-9: :00-9:15 9:15-9: :15-9:30 9:30-9: :30-9:45 9:45-10: :45-10:00 10:00-10:15 10:00-10:15 10:15-10:30 10:15-10:30 10:30-10:45 10:30-10:45 10:45-11:00 10:45-11:00 11:00-11:15 11:00-11:15 11:15-11:30 11:15-11:30 11:30-11:45 11:30-11:45 11:45-12:00 11:45-12:00
26 Summary of Bicycle Volumes Institute of Transportation Engineers Trip Generation Data Form (Part 4) Average Weekday (M-F) Saturday Sunday Enter Exit Total Enter Exit Total Enter Exit Total 24-Hour Volume A.M. Peak Hour of Adjacent 1 Street Traffic (8 10) Time: 9:00 10:00 P.M. Peak Hour of Adjacent 1 Street Traffic (5 8) Time: 6:00 7:00 A.M. Peak Hour Generator 2 Time: 9:00 10:00 P.M. Peak Hour Generator 2 Time: 6:00 7:00 Peak Hour Generator 3 Time (Weekend): Highest hourly volume between 7 a.m. and 9 a.m. (4 p.m. and 6 p.m.) as defined in Trip Generation Data Form (Part 2). Please specify the peak hour. 2. Highest hourly volume during the a.m. or p.m. period. Please specify the peak hour. 3. Highest hourly volume during the entire day. Please specify the peak hour. Please attach supplemental hourly volumes. Please refer to the Trip Generation User s Guide for full definition of terms. Summary of Pedestrian Volumes Average Weekday (M-F) Saturday Sunday Enter Exit Total Enter Exit Total Enter Exit Total 24-Hour Volume A.M. Peak Hour of Adjacent 1 Street Traffic (7 10) Time: 9:00 10:00 P.M. Peak Hour of Adjacent 1 Street Traffic (5 8) Time: 6:30 7:30 A.M. Peak Hour Generator 2 Time: 9:00 10:00 P.M. Peak Hour Generator 2 Time: 6:30 7:30 Peak Hour Generator 3 Time (Weekend):
27 Institute of Transportation Engineers Trip Generation Data Form (Part 1) Land Use/Building Type: Grocery Store ITE Land Use Code: 850 Source: Source No. (ITE use only): Name of Development: Whole Foods Day of the Week: Wednesday City: Santa Monica State/Province: CA Zip/Postal Code: Day: 26th Month: February Year: 2014 Country: USA Metropolitan Area: Los Angeles 1. For fast-food land use, please specify if hamburger- or nonhamburger-based. Location Within Area: (1) CBD (3) Suburban (Non-CBD) (5) Rural (2) Urban (Non-CBD) (4) Suburban CBD (6) Freeway Interchange Area (Rural) (7) Not Given Independent Variable: (include data for as many as possible) 2 Actual Estimated Actual Estimated (1) Employees (#) 137 (9) Parking Spaces (% occupied: ) (2) Persons (#) (10) Beds (% occupied: ) (3) Total Units (#) (indicate unit: ) (11) Seats (#) (4) Occupied Units (#) (indicate unit: ) (12) Servicing Positions/Vehicle Fueling 30,828 (5) Gross Floor Area (gross sq. ft.) Positions (% of development occupied ) (13) Shopping Center % Out-parcels/pads 13,315 (6) Net Rentable Area (sq. ft.) (14) A.M. Peak Hour Volume of Adjacent Street Traffic (7) Gross Leasable Area (sq. ft.) (15) P.M. Peak Hour Volume of Adjacent Street Traffic (% of development occupied ) (16) Other (8) Total Acres (% developed: ) (17) Other Detailed Description of Development: Wilshire Blvd Santa Monica, CA Definitions for several independent variables can be found in the Trip Generation, Second Edition, User s Guide Glossary. 3. Please provide all pertinent information to describe the subject project, including the presence of bicycle/pedestrian facilities. To report bicycle/pedestrian volumes, please refer to Part 4 of this data form. Other Data: Vehicle Occupancy (#): A.M. P.M. 24-hour % Percent by Transit: A.M. % P.M. % 24-hour % Percent by Carpool/Vanpool: A.M. % P.M. % 24-hour % Transportation Demand Management (TDM) Information: At the time of this study, was there a TDM program (that may have impacted the trip generation characteristics of this site) underway? No Yes (If yes, please check appropriate box/boxes, describe the nature of the TDM program(s) and provide a source for any studies that may help quantify this impact. Attach additional sheets if necessary) Employees by Shift: (1) Transit Service (5) Employer Support Measures (9) Tolls and Congestion Pricing Start End (2) Carpool Programs (6) Preferential HOV Treatments (10) Variable Work Hours/Compressed Work Weeks First Shift: Time Time Employees (#) (3) Vanpool Programs (7) Transit and Ridesharing Incentives (11) Telecommuting Start End (4) Bicycle/Pedestrian (8) Parking Supply and Pricing (12) Other Second Shift: Time Time Employees (#) Facilities and Site Management Start End Third Shift: Time Time Employees (#) Improvements Parking Cost on Site: Hourly Daily Please Complete Form on Other Side
28 Institute of Transportation Engineers Trip Generation Data Form (Part 2) Summary of Driveway Volumes (All = All Vehicles Counted, Including Trucks; Trucks = Heavy Duty Trucks and Buses) Average Weekday (M-F) Saturday Sunday Enter Exit Total Enter Exit Total Enter Exit Total All Trucks All Trucks All Trucks All Trucks All Trucks All Trucks All Trucks All Trucks All Trucks 24-Hour Volume A.M. Peak Hour of Adjacent 1 Street Traffic (7 10) Time: 9:00-10:00 P.M. Peak Hour of Adjacent 1 Street Traffic (5 8) Time: 6:30 7:30 A.M. Peak Hour Generator 2 Time: 9:00-10:00 P.M. Peak Hour Generator 2 Time: 6:30 7:30 Peak Hour Generator 3 Time (Weekend): Highest hourly volume between 7 a.m. and 9 a.m. (4 p.m. and 6 p.m.). Please specify the peak hour. 2. Highest hourly volume during the a.m. or p.m. period. Please specify the peak hour. 3. Highest hourly volume during the entire day. Please specify the peak hour. Please refer to the Trip Generation User s Guide for full definition of terms. Hourly Driveway Volumes- Average Weekday (M-F) A.M. Period Enter Exit Total Mid-Day Period Enter Exit Total P.M. Period Enter Exit Total All Trucks All Trucks All Trucks All Trucks All Trucks All Trucks All Trucks All Trucks All Trucks 7:00-8: :00-12:00 5:00-6: :15-8: :15-12:15 5:15-6: :30-8: :30-12:30 5:30-6: :45-8: :45-12:45 5:45-6: :00-9: :00-1:00 6:00-7: :15-9: :15-1:15 6:15-7: :30-9: :30-1:30 6:30-7: :45-9: :45-1:45 6:45-7: :00-10: :00-2:00 7:00-8: Check if Part 3, 4 and/or additional information is attached. Survey conducted by: Name: Organization: Address: City/State/Zip: Telephone #: Fax #: Please return to: Institute of Transportation Engineers Technical Projects Division 1627 Eye Street, NW, Suite 600 Washington, DC USA Telephone: Fax: ITE on the Web:
29 Name/Organization: UCLA ITE Telephone Number: Institute of Transportation Engineers Trip Generation Data Form (Part 3) City/State: Santa Monica / CA Detailed Driveway Volumes: Attach this sheet to Parts 1 and 2 if you are providing additional information. Day of the week: (All = All Vehicles Counted, Including Trucks; Trucks = Heavy Duty Trucks and Buses) A.M. Period Enter Exit Total P.M. Period Enter Exit Total All Trucks All Trucks All Trucks All Trucks All Trucks All Trucks 12:00-12:15 12:00-12:15 12:15-12:30 12:15-12:30 12:30-12:45 12:30-12:45 12:45-1:00 12:45-1:00 1:00-1:15 1:00-1:15 1:15-1:30 1:15-1:30 1:30-1:45 1:30-1:45 1:45-2:00 1:45-2:00 2:00-2:15 2:00-2:15 2:15-2:30 2:15-2:30 2:30-2:45 2:30-2:45 2:45-3:00 2:45-3:00 3:00-3:15 3:00-3:15 3:15-3:30 3:15-3:30 3:30-3:45 3:30-3:45 3:45-4:00 3:45-4:00 4:00-4:15 4:00-4:15 4:15-4:30 4:15-4:30 4:30-4:45 4:30-4:45 4:45-5:00 4:45-5:00 5:00-5:15 5:00-5: :15-5:30 5:15-5: :30-5:45 5:30-5: :45-6:00 5:45-6: :00-6:15 6:00-6: :15-6:30 6:15-6: :30-6:45 6:30-6: :45-7:00 6:45-7: :00-7: :00-7: :15-7: :15-7: :30-7: :30-7: :45-8: :45-8: :00-8: :00-8:15 8:15-8: :15-8:30 8:30-8: :30-8:45 8:45-9: :45-9:00 9:00-9: :00-9:15 9:15-9: :15-9:30 9:30-9: :30-9:45 9:45-10: :45-10:00 10:00-10:15 10:00-10:15 10:15-10:30 10:15-10:30 10:30-10:45 10:30-10:45 10:45-11:00 10:45-11:00 11:00-11:15 11:00-11:15 11:15-11:30 11:15-11:30 11:30-11:45 11:30-11:45 11:45-12:00 11:45-12:00
30 Summary of Bicycle Volumes Institute of Transportation Engineers Trip Generation Data Form (Part 4) Average Weekday (M-F) Saturday Sunday Enter Exit Total Enter Exit Total Enter Exit Total 24-Hour Volume A.M. Peak Hour of Adjacent 1 Street Traffic (7 9) Time: 7:45 8:45 P.M. Peak Hour of Adjacent 1 Street Traffic (5-8) Time: 5:15 6:15 A.M. Peak Hour Generator 2 Time: 7:45 8:45 P.M. Peak Hour Generator 2 Time: 5:15 6:15 Peak Hour Generator 3 Time (Weekend): Highest hourly volume between 7 a.m. and 9 a.m. (4 p.m. and 6 p.m.) as defined in Trip Generation Data Form (Part 2). Please specify the peak hour. 2. Highest hourly volume during the a.m. or p.m. period. Please specify the peak hour. 3. Highest hourly volume during the entire day. Please specify the peak hour. Please attach supplemental hourly volumes. Please refer to the Trip Generation User s Guide for full definition of terms. Summary of Pedestrian Volumes Average Weekday (M-F) Saturday Sunday Enter Exit Total Enter Exit Total Enter Exit Total 24-Hour Volume A.M. Peak Hour of Adjacent 1 Street Traffic (7 10) Time: 7:00 8:00 P.M. Peak Hour of Adjacent 1 Street Traffic (5 8) Time: 6:00 7:00 A.M. Peak Hour Generator 2 Time: 7:00 8:00 P.M. Peak Hour Generator 2 Time: 6:00 7:00 Peak Hour Generator 3 Time (Weekend):
31 Institute of Transportation Engineers Trip Generation Data Form (Part 1) Land Use/Building Type: Grocery Store ITE Land Use Code: 850 Source: Source No. (ITE use only): Name of Development: Whole Foods Day of the Week: Thursday City: Santa Monica State/Province: CA Zip/Postal Code: Day: 27th Month: February Year: 2014 Country: USA Metropolitan Area: Los Angeles 1. For fast-food land use, please specify if hamburger- or nonhamburger-based. Location Within Area: (1) CBD (3) Suburban (Non-CBD) (5) Rural (2) Urban (Non-CBD) (4) Suburban CBD (6) Freeway Interchange Area (Rural) (7) Not Given Independent Variable: (include data for as many as possible) 2 Actual Estimated Actual Estimated (1) Employees (#) 137 (9) Parking Spaces (% occupied: ) (2) Persons (#) (10) Beds (% occupied: ) (3) Total Units (#) (indicate unit: ) (11) Seats (#) (4) Occupied Units (#) (indicate unit: ) (12) Servicing Positions/Vehicle Fueling 30,828 (5) Gross Floor Area (gross sq. ft.) Positions (% of development occupied ) (13) Shopping Center % Out-parcels/pads 13,315 (6) Net Rentable Area (sq. ft.) (14) A.M. Peak Hour Volume of Adjacent Street Traffic (7) Gross Leasable Area (sq. ft.) (15) P.M. Peak Hour Volume of Adjacent Street Traffic (% of development occupied ) (16) Other (8) Total Acres (% developed: ) (17) Other Detailed Description of Development: Wilshire Blvd Santa Monica, CA Definitions for several independent variables can be found in the Trip Generation, Second Edition, User s Guide Glossary. 3. Please provide all pertinent information to describe the subject project, including the presence of bicycle/pedestrian facilities. To report bicycle/pedestrian volumes, please refer to Part 4 of this data form. Other Data: Vehicle Occupancy (#): A.M. P.M. 24-hour % Percent by Transit: A.M. % P.M. % 24-hour % Percent by Carpool/Vanpool: A.M. % P.M. % 24-hour % Transportation Demand Management (TDM) Information: At the time of this study, was there a TDM program (that may have impacted the trip generation characteristics of this site) underway? No Yes (If yes, please check appropriate box/boxes, describe the nature of the TDM program(s) and provide a source for any studies that may help quantify this impact. Attach additional sheets if necessary) Employees by Shift: (1) Transit Service (5) Employer Support Measures (9) Tolls and Congestion Pricing Start End (2) Carpool Programs (6) Preferential HOV Treatments (10) Variable Work Hours/Compressed Work Weeks First Shift: Time Time Employees (#) (3) Vanpool Programs (7) Transit and Ridesharing Incentives (11) Telecommuting Start End (4) Bicycle/Pedestrian (8) Parking Supply and Pricing (12) Other Second Shift: Time Time Employees (#) Facilities and Site Management Start End Third Shift: Time Time Employees (#) Improvements Parking Cost on Site: Hourly Daily Please Complete Form on Other Side
Trip Generation and Parking Utilization Data Collection at Mini-Mart with Gas Station
 Trip Generation and Parking Utilization Data Collection at Mini-Mart with Gas Station Final Report 2013 ITE District 6 - Data Collection Project Institute of Transportation Engineers Student Chapter at
Trip Generation and Parking Study New Californian Apartments, Berkeley
 Trip Generation and Parking Study New Californian Apartments, Berkeley Institute of Transportation Engineers University of California, Berkeley Student Chapter Spring 2012 Background The ITE Student Chapter
Trip and Parking Generation Data Collection at Grocery Store with Gas Station and Auto Repair
 Trip and Parking Generation Data Collection at Grocery Store with Gas Station and Auto Repair Final Report 2011 ITE District 6 - Data Collection Project Institute of Transportation Engineers Student Chapter
Trip Generation Study: Provo Assisted Living Facility Land Use Code: 254
 Trip Generation Study: Provo Assisted Living Facility Land Use Code: 254 Introduction The Brigham Young University Institute of Transportation Engineers (BYU ITE) student chapter completed a trip generation
Trip and Parking Generation Study of the Peaks Ice Arena
 Trip and Parking Generation Study of the Peaks Ice Arena Introduction The Brigham Young University Institute of Transportation Engineers student chapter (BYU ITE) completed a trip and parking generation
APPENDIX TR-1 PARKING AND QUEUING ASSESSMENT
 APPENDIX TR-1 PARKING AND QUEUING ASSESSMENT Overland Overland Traffic Consultants, Traffic Consultants, Inc. Inc. Overland Traffic Consultants 952 Manhattan Beach Boulevard, Suite #100 Manhattan Beach,
IV. ENVIRONMENTAL IMPACT ANALYSIS K.2. PARKING
 IV. ENVIRONMENTAL IMPACT ANALYSIS K.2. PARKING ENVIRONMENTAL SETTING The following analysis summarizes the findings and conclusions of the Traffic Analysis (Traffic Study), prepared by The Mobility Group,
Summary of Findings: Parking and Trip Generation Study For Coffee/Donut Shops with Drive-Through Window. District 5 Tennessee Section: Memphis, TN
 Summary of Findings: Parking and Trip Generation Study For Coffee/Donut Shops with Drive-Through Window District 5 Tennessee Section: Memphis, TN Submitted to: Ed Stollof, AICP Institute of Transportation
Address Land Use Approximate GSF
 M E M O R A N D U M To: Kara Brewton, From: Nelson\Nygaard Date: March 26, 2014 Subject: Brookline Place Shared Parking Analysis- Final Memo This memorandum presents a comparative analysis of expected
Site Traffic Studies:
 Site Traffic Studies: Top Pitfalls and their solutions Florida Department of Transportation Office of Intermodal Systems Development Systems Planning Office Access Management Tallahassee, Florida Opening
appendix 4: Parking Management Study, Phase II
 appendix 4: Parking Management Study, Phase II A4-1 A4-2 Eastlake Parking Management Study Final Phase 2 Report Future Parking Demand & Supply January 6, 2017 Submitted by Denver Corp Center III 7900 E.
Appendix S. Shared Parking Analysis
 Appendix S Shared Parking Analysis PARKING DEMAND ANALYSIS 2 ND + PCH PROJECT Long Beach, California April 10, 2017 April 10, 2017 Mr. Stephanie Eyestone-Jones Eyestone Environmental 6701 Center Drive
2.0 Development Driveways. Movin Out June 2017
 Movin Out June 2017 1.0 Introduction The proposed Movin Out development is a mixed use development in the northeast quadrant of the intersection of West Broadway and Fayette Avenue in the City of Madison.
Project Scoping Open House Welcome
 Scoping Meeting Project Scoping Open House Welcome Alternatives Analysis (AA) and Draft Environmental Impact Statement/Draft Environmental Impact Report (DEIS/DEIR) Project Purpose Purpose of the Project
APPENDIX C-2. Traffic Study Supplemental Analysis Memo
 APPENDIX C-2 Traffic Study Supplemental Analysis Memo The Mobility Group Transportation Strategies & Solutions Memorandum To: From: Subject: Tomas Carranza, LADOT Matthew Simons Traffic Review - Revised
Ingraham High School Parking and Traffic Analysis
 Parking and Traffic Analysis Seattle, WA Prepared for: URS Corporation 1501 4th Avenue, Suite 1400 Seattle, WA 98101-1616 Mirai Transportation Planning & Engineering 11410 NE 122nd Way, Suite 320 Kirkland,
U N I V E R S I T Y O F B R I T I S H C O L U M B I A. Fall 2008 Transportation Status Report
 U N I V E R S I T Y O F B R I T I S H C O L U M B I A Fall 2008 Transportation Status Report 6 February 2009 U N I V E R S I T Y O F B R I T I S H C O L U M B I A Fall 2008 Transportation Status Report
NEW YORK SUBURBAN RAIL SUMMARY (COMMUTER RAIL, REGIONAL RAIL)
") NEW YORK SUBURBAN RAIL SUMMARY (COMMUTER RAIL, REGIONAL RAIL) October 2003 New York: The New York commuter rail service area consists of 20.3 million people, spread over 4,700 square miles at an average
NEW YORK SUBURBAN RAIL SUMMARY (COMMUTER RAIL, REGIONAL RAIL) October 2003 New York: The New York commuter rail service area consists of 20.3 million people, spread over 4,700 square miles at an average
IRSCH REEN Hirsch/Green Transportation Consulting, Inc.
 IRSCH REEN Hirsch/Green Transportation Consulting, Inc. February 6, 2013 Mr. David Weil Director of Finance St. Matthew s Parish School 1031 Bienveneda Avenue Pacific Palisades, California 90272 RE: Trip
CITY OF LOS ANGELES INTER-DEPARTMENTAL MEMORANDUM
 CITY OF LOS ANGELES INTER-DEPARTMENTAL MEMORANDUM Date: April 11, 2018 To: The Honorable City Council c/o City Clerk, Room 395, City Hall Attention: Honorable Mike Bonin, Chair, Transportation Committee
THE CORNERSTONE APARTMENTS TRAFFIC IMPACT STUDY R&M PROJECT NO
 THE CORNERSTONE APARTMENTS SITUATED AT N/E/C OF STAUDERMAN AVENUE AND FOREST AVENUE VILLAGE OF LYNBROOK NASSAU COUNTY, NEW YORK TRAFFIC IMPACT STUDY R&M PROJECT NO. 2018-089 September 2018 50 Elm Street,
PARKING OCCUPANCY IN WINDSOR CENTER
 PARKING OCCUPANCY IN WINDSOR CENTER TOWN OF WINDSOR, CONNECTICUT REPORT JUNE 2017 CONTENTS Background... 3 Other Relevant Data... 3 Parking Survey Design... 6 Parking Supply Inventory... 6 Parking Demand
TRANSPORTATION STUDY FOR THE 8899 BEVERLY BOULEVARD PROJECT
 DRAFT TRANSPORTATION STUDY FOR THE 8899 BEVERLY BOULEVARD PROJECT WEST HOLLYWOOD, CALIFORNIA NOVEMBER 2013 PREPARED FOR BEVERLY BOULEVARD ASSOCIATION PREPARED BY DRAFT TRANSPORTATION STUDY FOR THE 8899
WESTSIDE SUBWAY EXTENSION PROJECT. Updated Off-street Parking Analysis Memorandum
 WESTSIDE SUBWAY EXTENSION PROJECT Updated Off-street Analysis Memorandum April 2011 Table of Contents 1.0 INTRODUCTION... 1 2.0 DATA SOURCE... 1 3.0 OFF-STREET LAND USE & PARKING ANALYSIS... 2 3.1 Station
TRAFFIC IMPACT ANALYSIS FOR A PROPOSED MIXED USE DEVELOPMENT
 TRAFFIC IMPACT ANALYSIS FOR A PROPOSED MIXED USE DEVELOPMENT Located at southeast corner of Winnetka Avenue and Prairie Street In the City of Los Angeles Prepared for: Sky Tech Management & Construction
2 EXISTING ROUTE STRUCTURE AND SERVICE LEVELS
 2 EXISTING ROUTE STRUCTURE AND SERVICE LEVELS In the Study Area, as in most of the Metro Transit network, there are two distinct route structures. The base service structure operates all day and the peak
Lacey Gateway Residential Phase 1
 Lacey Gateway Residential Phase Transportation Impact Study April 23, 203 Prepared for: Gateway 850 LLC 5 Lake Bellevue Drive Suite 02 Bellevue, WA 98005 Prepared by: TENW Transportation Engineering West
Transportation Demand Management Element
 Transportation Demand Management Element Over the years, our reliance on the private automobile as our primary mode of transportation has grown substantially. Our dependence on the automobile is evidenced
Performance Measure Summary - Fresno CA. Performance Measures and Definition of Terms
 Performance Measure Summary - Fresno CA There are several inventory and performance measures listed in the pages of this Urban Area Report for the years from 1982 to 2014. There is no single performance
Performance Measure Summary - Washington DC-VA-MD. Performance Measures and Definition of Terms
 Performance Measure Summary - Washington DC-VA-MD There are several inventory and performance measures listed in the pages of this Urban Area Report for the years from 1982 to 2014. There is no single
King Soopers #116 Thornton, Colorado
 Traffic Impact Study King Soopers #116 Thornton, Colorado Prepared for: Galloway & Company, Inc. T R A F F I C I M P A C T S T U D Y King Soopers #116 Thornton, Colorado Prepared for Galloway & Company
TRAFFIC PARKING ANALYSIS
 TRAFFIC PARKING ANALYSIS NAPA FLEA MARKET COUNTY OF NAPA Prepared for: Tom Harding Napa-Vallejo Flea Market 33 Kelly Road American Canyon, CA 9453 Prepared by: 166 Olympic Boulevard, Suite 21 Walnut Creek,
Transportation Land Development Environmental S e r v i c e s
 Transportation Land Development Environmental S e r v i c e s Memorandum To: Ms. Kristin E. Kassner Planning Director Town Hall Annex 25 Center Street Burlington, MA 01803 Date: September 23, 2013 Project
Draft Report: West Berkeley Bowl Project
 Draft Report: West Berkeley Bowl Project July 2004 Prepared for: The City of Berkeley 1031-1925 F EHR & PEERS TRANSPORTATION CONSULTANTS 3685 Mt. Diablo Blvd. #301 Lafayette, CA 94549 925-284-3200 Fax:
Maine Medical Center Campus-Wide Parking Study
 Overview Maine Medical Center (MMC) retained VHB to conduct a campus-wide parking study that includes an analysis of demand and supply for patient, visitor, and employee parking on MMC s Bramhall Campus.
BROWARD BOULEVARD CORRIDOR TRANSIT STUDY
 BROWARD BOULEVARD CORRIDOR TRANSIT STUDY FM # 42802411201 EXECUTIVE SUMMARY July 2012 GOBROWARD Broward Boulevard Corridor Transit Study FM # 42802411201 Executive Summary Prepared For: Ms. Khalilah Ffrench,
Performance Measure Summary - Large Area Sum. Performance Measures and Definition of Terms
 Performance Measure Summary - Large Area Sum There are several inventory and performance measures listed in the pages of this Urban Area Report for the years from 1982 to 2014. There is no single performance
Performance Measure Summary - Medium Area Sum. Performance Measures and Definition of Terms
 Performance Measure Summary - Medium Area Sum There are several inventory and performance measures listed in the pages of this Urban Area Report for the years from 1982 to 2014. There is no single performance
Mercer Island Town Center Parking Study Joint Commission Presentation March 16, 2016
 Mercer Island Town Center Parking Study Joint Commission Presentation March 16, 2016 Mercer Island Town Center Parking Study Study Area Town Center Bordered by Sunset Way, Island Crest Way, SE 32 nd Street,
This letter summarizes our observations, anticipated traffic changes, and conclusions.
 Mr. David Jorschumb Project Manager Boulder Valley School District Re: Review of proposed school access improvements at the Foothills Elementary School in Boulder Dear Mr. Jorschumb, At your request, the
Performance Measures and Definition of Terms
 Performance Measure Summary - All 471 Areas Sum There are several inventory and performance measures listed in the pages of this Urban Area Report for the years from 1982 to 2014. There is no single performance
Re: Addendum No. 4 Transportation Overview 146 Mountshannon Drive Ottawa, Ontario
 April 18 th, 2017 Mr. Kevin Yemm Vice President, Land Development Richraft Group of Companies 2280 St. Laurent Boulevard, Suite 201 Ottawa, Ontario (Tel: 613.739.7111 / e-mail: keviny@richcraft.com) Re:
Appendix SAN San Diego, California 2003 Annual Report on Freeway Mobility and Reliability
 (http://mobility.tamu.edu/mmp) Office of Operations, Federal Highway Administration Appendix SAN San Diego, California 2003 Annual Report on Freeway Mobility and Reliability This report is a supplement
Performance Measure Summary - Austin TX. Performance Measures and Definition of Terms
 Performance Measure Summary - Austin TX There are several inventory and performance measures listed in the pages of this Urban Area Report for the years from 1982 to 2014. There is no single performance
Performance Measure Summary - Pittsburgh PA. Performance Measures and Definition of Terms
 Performance Measure Summary - Pittsburgh PA There are several inventory and performance measures listed in the pages of this Urban Area Report for the years from 1982 to 2014. There is no single performance
Performance Measure Summary - New Orleans LA. Performance Measures and Definition of Terms
 Performance Measure Summary - New Orleans LA There are several inventory and performance measures listed in the pages of this Urban Area Report for the years from 1982 to 2014. There is no single performance
Performance Measure Summary - Portland OR-WA. Performance Measures and Definition of Terms
 Performance Measure Summary - Portland OR-WA There are several inventory and performance measures listed in the pages of this Urban Area Report for the years from 1982 to 2014. There is no single performance
Performance Measure Summary - Oklahoma City OK. Performance Measures and Definition of Terms
 Performance Measure Summary - Oklahoma City OK There are several inventory and performance measures listed in the pages of this Urban Area Report for the years from 1982 to 2014. There is no single performance
Performance Measure Summary - Seattle WA. Performance Measures and Definition of Terms
 Performance Measure Summary - Seattle WA There are several inventory and performance measures listed in the pages of this Urban Area Report for the years from 1982 to 2014. There is no single performance
Performance Measure Summary - Buffalo NY. Performance Measures and Definition of Terms
 Performance Measure Summary - Buffalo NY There are several inventory and performance measures listed in the pages of this Urban Area Report for the years from 1982 to 2014. There is no single performance
Performance Measure Summary - Hartford CT. Performance Measures and Definition of Terms
 Performance Measure Summary - Hartford CT There are several inventory and performance measures listed in the pages of this Urban Area Report for the years from 1982 to 2014. There is no single performance
Performance Measure Summary - Boise ID. Performance Measures and Definition of Terms
 Performance Measure Summary - Boise ID There are several inventory and performance measures listed in the pages of this Urban Area Report for the years from 1982 to 2014. There is no single performance
Performance Measure Summary - Tucson AZ. Performance Measures and Definition of Terms
 Performance Measure Summary - Tucson AZ There are several inventory and performance measures listed in the pages of this Urban Area Report for the years from 1982 to 2014. There is no single performance
Performance Measure Summary - Wichita KS. Performance Measures and Definition of Terms
 Performance Measure Summary - Wichita KS There are several inventory and performance measures listed in the pages of this Urban Area Report for the years from 1982 to 2014. There is no single performance
Performance Measure Summary - Spokane WA. Performance Measures and Definition of Terms
 Performance Measure Summary - Spokane WA There are several inventory and performance measures listed in the pages of this Urban Area Report for the years from 1982 to 2014. There is no single performance
M E M O R A N D U M INTRODUCTION. POTENTIAL TDM STRATEGIES Marketing & Management. Residents & Employees. Exhibit 6
 Exhibit 6 M E M O R A N D U M To: From: Joe Ernst and Bryan Graves Nelson\Nygaard Date: February 6, 2015 Subject: Preliminary TDM Strategies INTRODUCTION The memorandum provides an overview of potential
Draft Transportation Demand Management Program for the Oak Knoll Project
 Draft Transportation Demand Management Program for the Oak Knoll Project Prepared for: Oak Knoll Venture Acquisition City of Oakland OK14-0026 Table of Contents INTRODUCTION AND PROJECT OVERVIEW... 1 Project
Performance Measure Summary - Grand Rapids MI. Performance Measures and Definition of Terms
 Performance Measure Summary - Grand Rapids MI There are several inventory and performance measures listed in the pages of this Urban Area Report for the years from 1982 to 2014. There is no single performance
Performance Measure Summary - Charlotte NC-SC. Performance Measures and Definition of Terms
 Performance Measure Summary - Charlotte NC-SC There are several inventory and performance measures listed in the pages of this Urban Area Report for the years from 1982 to 2014. There is no single performance
Performance Measure Summary - Toledo OH-MI. Performance Measures and Definition of Terms
 Performance Measure Summary - Toledo OH-MI There are several inventory and performance measures listed in the pages of this Urban Area Report for the years from 1982 to 2014. There is no single performance
WESTSIDE SUBWAY EXTENSION. Final Smart Growth Evaluation Report
 Final Smart Growth Evaluation Report August 2010 Table of Contents Table of Contents 1.0 INTRODUCTION... 1-1 1.1 4Ds... 1-2 1.2 Direct Ridership Model (DRM)... 1-2 2.0 4DS... 2-1 2.1 Inputs... 2-1 2.2
Performance Measure Summary - Pensacola FL-AL. Performance Measures and Definition of Terms
 Performance Measure Summary - Pensacola FL-AL There are several inventory and performance measures listed in the pages of this Urban Area Report for the years from 1982 to 2014. There is no single performance
Performance Measure Summary - Omaha NE-IA. Performance Measures and Definition of Terms
 Performance Measure Summary - Omaha NE-IA There are several inventory and performance measures listed in the pages of this Urban Area Report for the years from 1982 to 2014. There is no single performance
Performance Measure Summary - Allentown PA-NJ. Performance Measures and Definition of Terms
 Performance Measure Summary - Allentown PA-NJ There are several inventory and performance measures listed in the pages of this Urban Area Report for the years from 1982 to 2014. There is no single performance
Performance Measure Summary - Nashville-Davidson TN. Performance Measures and Definition of Terms
 Performance Measure Summary - Nashville-Davidson TN There are several inventory and performance measures listed in the pages of this Urban Area Report for the years from 1982 to 2014. There is no single
Performance Measure Summary - Corpus Christi TX. Performance Measures and Definition of Terms
 Performance Measure Summary - Corpus Christi TX There are several inventory and performance measures listed in the pages of this Urban Area Report for the years from 1982 to 2014. There is no single performance
TRAFFIC SIGNAL DESIGN REPORT KING OF PRUSSIA ROAD & RAIDER ROAD RADNOR TOWNSHIP PENNSYLVANIA
 TRAFFIC SIGNAL DESIGN REPORT KING OF PRUSSIA ROAD & RAIDER ROAD RADNOR TOWNSHIP PENNSYLVANIA PREPARED FOR: UNIVERSITY OF PENNSYLVANIA HEALTH SYSTEM 34 CIVIC CENTER BOULEVARD PHILADELPHIA, PA 1987 (61)
Performance Measure Summary - Boston MA-NH-RI. Performance Measures and Definition of Terms
 Performance Measure Summary - Boston MA-NH-RI There are several inventory and performance measures listed in the pages of this Urban Area Report for the years from 1982 to 2014. There is no single performance
Performance Measure Summary - El Paso TX-NM. Performance Measures and Definition of Terms
 Performance Measure Summary - El Paso TX-NM There are several inventory and performance measures listed in the pages of this Urban Area Report for the years from 1982 to 2014. There is no single performance
Performance Measure Summary - Minneapolis-St. Paul MN-WI. Performance Measures and Definition of Terms
 Performance Measure Summary - Minneapolis-St. Paul MN-WI There are several inventory and performance measures listed in the pages of this Urban Area Report for the years from 1982 to 2014. There is no
The USDOT Congestion Pricing Program: A New Era for Congestion Management
 The USDOT Congestion Pricing Program: A New Era for Congestion Management Patrick DeCorla-Souza, AICP Federal Highway Administration Presentation at Congestion Pricing Discovery Workshop Los Angeles, CA
Performance Measure Summary - Louisville-Jefferson County KY-IN. Performance Measures and Definition of Terms
 Performance Measure Summary - Louisville-Jefferson County KY-IN There are several inventory and performance measures listed in the pages of this Urban Area Report for the years from 1982 to 2014. There
IV. ENVIRONMENTAL IMPACT ANALYSIS N. TRANSPORTATION AND TRAFFIC
 IV. ENVIRONMENTAL IMPACT ANALYSIS N. TRANSPORTATION AND TRAFFIC The following section summarizes the information provided in the traffic report entitled Traffic Impact Analysis for a Proposed Residential
Performance Measure Summary - New York-Newark NY-NJ-CT. Performance Measures and Definition of Terms
 Performance Measure Summary - New York-Newark NY-NJ-CT There are several inventory and performance measures listed in the pages of this Urban Area Report for the years from 1982 to 2014. There is no single
Pilot Project Evaluation Summary
 SFpark Pilot Project Evaluation Summary A summary of the SFMTA s evaluation of the SFpark pilot project M U N I June 2014 2 / Overview SFpark: Pilot Project Evaluation Summary / 3 Pilot Project Evaluation
Morning Parking Utilization Trends
 MEMORANDUM Date: November 6 th, 2015 Project #: 18130 To: From: Subject: Rebecca Houghtaling, Senior Planner, Oregon State University Lisa Scherf, Transportation Services Supervisor, City of Corvallis
Parking Management Element
 Parking Management Element The State Transportation Planning Rule, adopted in 1991, requires that the Metropolitan Planning Organization (MPO) area implement, through its member jurisdictions, a parking
Table Existing Traffic Conditions for Arterial Segments along Construction Access Route. Daily
 5.8 TRAFFIC, ACCESS, AND CIRCULATION This section describes existing traffic conditions in the project area; summarizes applicable regulations; and analyzes the potential traffic, access, and circulation
PHILADELPHIA SUBURBAN RAIL SUMMARY (COMMUTER RAIL, REGIONAL RAIL)
") PHILADELPHIA SUBURBAN RAIL SUMMARY (COMMUTER RAIL, REGIONAL RAIL) October 2003 The Philadelphia commuter rail service area consists of 5.1 million people, spread over 1,800 square miles at an average population
PHILADELPHIA SUBURBAN RAIL SUMMARY (COMMUTER RAIL, REGIONAL RAIL) October 2003 The Philadelphia commuter rail service area consists of 5.1 million people, spread over 1,800 square miles at an average population
Legacy Development Travel Demand Management Plan
 Travel Demand Management Plan Minneapolis, MN Prepared By: Stephen Smith Alliant Engineering, Inc. 233 Park Avenue South, Suite 300 Minneapolis, MN 55415 Prepared For: Riverdale Ventures, LLC. 3200 Main
Stadium View Trip Generation Report
 2017-2018 Institute of Transportation Engineers at Montana State University Table of Contents Table of Contents Chapter 1. Introduction... 1 1.1. Scope of Work... 1 1.2. Site Description... 2 Chapter 2.
San Rafael Civic Center Station Area Plan May 2012 DRAFT FOR PUBLIC REVIEW
 CHAPTER 4. PARKING Parking has been identified as a key concern among neighbors and employers in the area, both in terms of increased demand from potential new development and from SMART passengers that
D. PAMF Palo Alto TDM Program and Parking Policy
 D. PAMF Palo Alto TDM Program and Parking Policy 98 Palo Alto Medical Foundation Is One of the 100 Best Employers for Bay Area Commuters RIDES, a local commuter support organization, has selected PAMF
Parking Management Strategies
 Parking Management Strategies Policy Program Potential Effectiveness (percent reduction in demand) Comments Parking Pricing Unbundling and Cash-Out Options Reduced Parking Requirements Transit/TOD Supportive
4/2/18 MP NORTHPOINT MALL GENERAL GROWTH PROPERTIES
 PHOTOGRAPH OF PIONEER PLACE, PORTLAND, OREGON APPLICATION FOR MASTER PLAN AMENDMENT CITY OF ALPHARETTA, GEORGIA Photograph of Pioneer Place, Portland, Oregon, showing exterior of a leasable office use
Start Time. LOCATION: Scotts Valley Dr QC JOB #: SPECIFIC LOCATION: 0 ft from Tabor St. DIRECTION: EB/WB CITY/STATE: Scotts Valley, CA
 Tube Counts Type of report: Tube Count - Volume Data LOCATION: Scotts Valley Dr QC JOB #: 245667 SPECIFIC LOCATION: ft from Tabor St DIRECTION: EB/WB CITY/STATE: Scotts Valley, CA DATE: Mar 2 24 - Mar
Community Design Standards
 In accordance with the Zoning Ordinance Update Parking and Loading Standards Adopted December 15, 2015 PARKING AND LOADING Sections: 4.1 Purpose and Intent 4.2 Definitions 4.3 Parking Plan Required 4.4
Abrams Associates TRIP GENERATION AND PARKING ANALYSIS. City of Berkeley
 TRIP GENERATION AND PARKING ANALYSIS 2556 TELEGRAPH PROJECT City of Berkeley Prepared for: Realtex Group 505 Sansome Street, Suite 400 San Francisco, CA 94111 Prepared by: 1875 Olympic Boulevard, Suite
Welcome and Agenda. Thank you for joining us! 6:00 pm Open House. 6:30 pm Welcome & Presentation. 7:00 pm Q&A. 7:15 pm Open House Resumes
 1 Welcome and Agenda Thank you for joining us! 6:00 pm Open House 6:30 pm Welcome & Presentation 7:00 pm Q&A 7:15 pm Open House Resumes 8:00 pm Meeting Concludes 2 Purpose of this Meeting Introduce project
Community Meetings June 2018
 Community Meetings June 2018 1 Welcome and Agenda Thank you for joining us! 6:00 pm Open House 6:30 pm Welcome & Presentation 7:00 pm Q&A 7:15 pm Open House Resumes 8:00 pm Meeting Concludes 2 Purpose
CITY OF OMAHA OMAHA, NEBRASKA
 DOWNTOWN PARKING NEEDS ASSESSMENT UPDATE CITY OF OMAHA OMAHA, NEBRASKA Prepared for: City of Omaha Parking Division October 15, 2014 FINAL REPORT TABLE OF CONTENTS EXECUTIVE SUMMARY... 1 Study Purpose...
RTCSNV CRASH ANALYSIS REPORT
 2011-2015 RTCSNV CRASH ANALYSIS REPORT TABLE OF CONTENTS Summary... 3 Crash Types... 4 Time and Day of Crashes... 7 Crash Factors... 9 Fatalities... 10 Driver s Behavior... 11 Crash Locations... 15 Non-Motorized
Construction Realty Co.
 MEMORANDUM TO: FROM : Jeff Pickus Construction Realty Co. Luay R. Aboona, PE Principal 9575 West Higgins Road, Suite 400 Rosemont, Illinois 60018 p: 847-518-9990 f: 847-518-9987 DATE: May 22, 2014 SUBJECT:
US 59 (SOUTHWEST FWY) IH 610 (West Loop) to SH 288 (South Fwy)
 IH 610 (West Loop) to SH 288 (South Fwy)") Mobility Investment Priorities Project Houston US 59 US 59 (SOUTHWEST FWY) IH 610 (West Loop) to SH 288 (South Fwy) Current Conditions From IH 610 West to SH 288, US 59 operates with four or five lanes
Mobility Investment Priorities Project Houston US 59 US 59 (SOUTHWEST FWY) IH 610 (West Loop) to SH 288 (South Fwy) Current Conditions From IH 610 West to SH 288, US 59 operates with four or five lanes
Table 1: Existing Trip Generation A.M. Peak Hour P.M. Peak Hour Land Use ITE Code Intensity Daily Total In Out Total In Out
 October 24, 218 Mr. Justin D. Bridges, AIA, LEED AP Davidson A+E 431 Indian Creek Parkway Overland Park, KS 6627 RE: Dear Mr. Bridges, Trip Generation Overland Park, Kansas As requested, Priority Engineers,
IV. ENVIRONMENTAL IMPACT ANALYSIS L. TRANSPORTATION/TRAFFIC
 IV. ENVIRONMENTAL IMPACT ANALYSIS L. TRANSPORTATION/TRAFFIC INTRODUCTION The following section summarizes the information provided in the traffic report entitled Traffic Impact Analysis for a Proposed
Click to edit Master title style
 Nelson/Nygaard Consulting Associates SERVICE IMPROVEMENT STRATEGIES September 22, 2015 1 PROJECT OVERVIEW & WORK TO DATE 1. Extensive stakeholder involvement Throughout 2. System and market assessment
Key Findings and Recommendations Introduction and Overview Task 1 Existing Conditions Analysis Task 2 Parking Demand Analysis...
 Table of Contents Introduction and Overview... 1 Key Findings and Recommendations... 1 Task 1 Existing Conditions Analysis... 1 Task 2 Parking Demand Analysis... 1 Task 3 Facilities Cost Analysis... 2
IV. REVISIONS TO THE DRAFT IS/MND
 IV. REVISIONS TO THE DRAFT IS/MND 1. REVISIONS TO THE DRAFT IS/MND This section presents corrections and clarifications that have been made to the text of the Draft IS/MND. These changes include revisions
Parks and Transportation System Development Charge Methodology
 City of Sandy Parks and Transportation System Development Charge Methodology March, 2016 Background In order to implement a City Council goal the City of Sandy engaged FCS Group in January of 2015 to update