Annual General Meeting FY August 2018
|
|
|
- Kelley George
- 5 years ago
- Views:
Transcription


1 Annual General Meeting FY August
2 CONTENTS Stamford Tyres History / Milestones Core Activities Business Operations Stamford Tyres Regional Activities Financial Highlights FY2018 Group Strategy and Outlook 2
3 Stamford Tyres History / Milestones 3

4 Our Beginnings 1930 s The late Mr Wee Boon Kwee founded Stamford Motor Service a modest tyre retail and petrol kiosk business located at Stamford Road s Introduced tyre retreading in new Seah Street office. 4


5 Our Beginnings 1960 s Finance Minister Dr Goh Keng Swee officiated the new and modern Kallang Factory and office opening. 5


6 Our Beginnings 1970 s Mr Wee Kok Wah joined the business in 1970 spearheaded search for tyre agency and diversification to new tyre distribution and value added services 1975 Obtained rights to distribute FALKEN Tyres 1976 Obtained rights to distribute Continental Tyres 1976 Obtained rights to distribute TOYO Tyres 6


 commenced operations in Sept 2014")
7 Milestones 1990 s Evolved into a corporation. Listed on Second Board of SGX in Build and expanded Stamford Tyres Malaysia 1993 Established Stamford Tyres South Africa 2002 Established Stamford Tyres Indonesia Launched proprietary made-in-japan Firenza high performance tyres 2003 Stamford Tyres was upgraded to the Main Board of the Singapore Stock Exchange 2004 Stamford Sport Wheels Company Limited (SSW) commenced operations in Sept 2014 Opened the Stamford Tyres Commercial Centre in Jurong 7
8 Core Activities 8

")


9 Our Core Competency Major Brands Strong financial resources (incl. financial personnel to support a sustainable distribution model) Distribution Centres Value-added Activities 11 Countries-Over 7,000 3 rd Party Dealers 20 Stamford Retail Outlets 7 Truck Centers 6 Contract Workshops 10 Mobile Fleet Service Off-The-Road Tyre Centres Proprietary Brands 88% of revenue derived from distribution 9
10 Business Operations 10
 Retail Chain")

 services) Proprietary Brand Tyres (passenger car")
 Retread of Truck and OTR Tyres Central warehousing")
 7 Truck Centers 6 Customer Workshops 10")

11 Business Model Distribution Manufacturing Overseas Distribution Network (of Major Brands, namely Falken, Dunlop) Retail Chain Network (for passenger car tyres & wheels, car workshops) Truck Centres (which includes TTM, contract customers and mobile fleet services) Off-the-Road OTR Tyre Centers (which includes Total Tyre Management ( TTM ) services) Proprietary Brand Tyres (passenger car radial, light truck, truck bus radial) SSW Alloy Wheel (Manufacturing) Retread of Truck and OTR Tyres Central warehousing and distribution in 11 countries 20 Retail Outlets in South East Asia (mainly in Singapore) 7 Truck Centers 6 Customer Workshops 10 Mobile Fleet Service Vehicles In Timika, Balikpapan, Sulawesi and North Maluku Islands Export to over 90 countries Export to over 20 countries In Malaysia, Singapore and Indonesia 11
12 Our International Presence (1/2) Singapore Malaysia Indonesia Timika South Africa Australia Vietnam Brunei China 12
 Thailand (SSW) Thailand")
")


13 Our International Presence (2/2) Thailand (SSW) Thailand (STD) Our Joint Ventures Tyre Pacific Hong Kong (50%) Countries: HK, Macau, Cambodia, Laos Tyre Pacific Vietnam (50%) Country: Vietnam Falken Tyre India (40%) Country: India 13

14 Export International Proprietary Brand Coverage Currently, the Stamford Tyres distribution network spans more than 10 countries worldwide mainly in South East Asia, Australia, India and Africa. Its export network spans more than 90 countries including Eastern Europe, Western Europe, Africa, Latin America and the Middle East. Proprietary Brands 14
15 Stamford Tyres Regional Activities 15


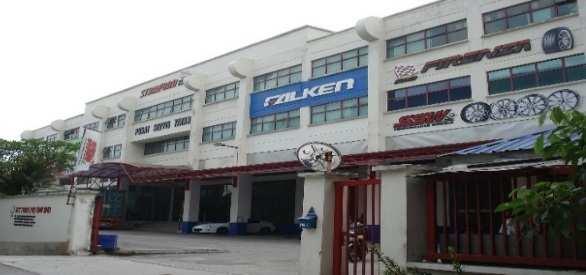
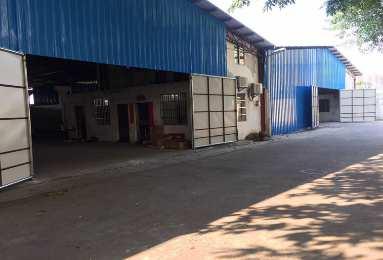
16 Stamford Tyres Regional Activities Malaysia Network: 1,000 dealers nationwide. Malaysia Warehouses: Glenmarie and centralized container warehousing in Kapar, Selangor. Value-added activities: Wholesaling and retailing of tyres and wheels, truck centres and tyre retreading. Glenmarie warehouse, 6,500sqm Tyre retreading plant, Senawang Malaysia Warehouse visit in Kapar, Selangor Truck centre, Klang 16


17 Stamford Tyres Regional Activities Thailand SSW wheels manufacturing factory, Nonthaburi Comprise of: Stamford Tires Distributors Co Ltd Stamford Sport Wheels Co Ltd ( SSW ). Network: 700 dealers nationwide. Thailand Provincial branches at Chiang Mai, Khonkaen and Hat Yai. Bangkok Motor Expo 2017 Sooksawad warehouse, 7,500sqm Truck event with Truck Bus Association
.")


18 Stamford Tyres Regional Activities Indonesia Mine site at PT Freeport, Irian Jaya Comprise of: PT Stamford Tyres Distributors PT Stamford Tyres Indonesia (Timika). Indonesia Network and distribution points: Jakarta, Surabaya, Semarang, Medan, Balikpapan, Banjarmasin, Manado and Timika. Tyre technical centres in Central Sulawesi, Morowali and Halmahera. Value-added activities: Wholesaling, retail network, OTR** sales and aftersales services, retreading and repair and light vehicle services. Tyre retreading plant, Timika **OTR = Off-the-road tyres An earthmover tyre inspection on-site in Kalimantan, Indonesia Earthmover tyre repair works at Timika, Indonesia 18


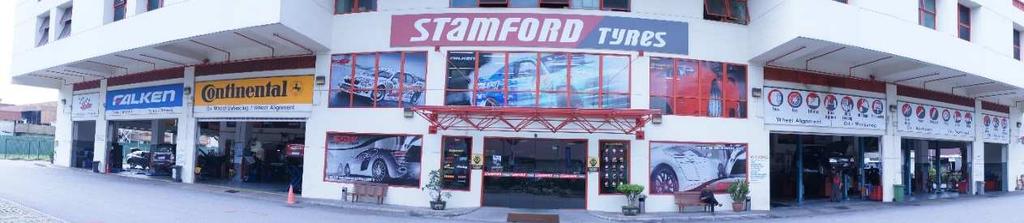
19 Stamford Tyres Regional Activities Singapore Comprises: 17 Stamford Tyres Mart retail centres and workshops 4 Stamford Tyres truck centres Singapore 10 units of 24/7 Mobile Tyre Recovery Services Value-added activities: Wholesaling, international distribution, retail of tyres, wheels and accessories, workshop services, tyre related services, commercial tyres services, retreading and 3PL services. Customers include: PSA, Go-Ahead, SMRT, Colex and Samwoh. Warehouse at 19 Lok Yang Way Car servicing at Stamford Tyres Mart retail workshop RTG Tyre inspection on site At PSA Port, Singapore Tyre retreading 19


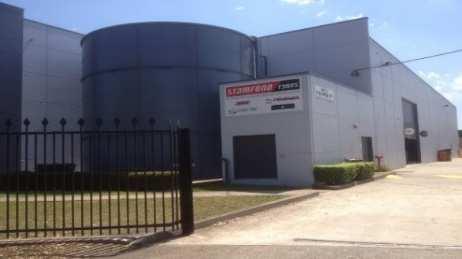
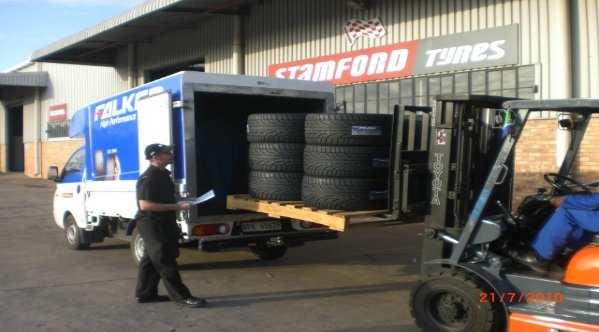
20 Stamford Tyres Regional Activities South Africa Network: 700 dealers nationwide. South Africa Warehouses: Cape Town, Durban and Johannesburg. Value-added activities: Wholesaling of passenger car tyres as well as commercial truck and earthmover tyres. Durban warehouse, 3,157 sqm New container warehouse in Johannesburg, South Africa Roadshow and brand building event Delivery vehicles 20
21 Stamford Tyres Regional Activities Guangdong Province, China Commenced operations in August Network: 200 dealers within Guangdong. Warehouse: 17,000 sqft located in Dongguan. Guangdong, China Estimated car population in Guangdong: 13 million. Value-added activities: Wholesaling of Bridgestone passenger car tyres. Dongguan warehouse, 17,000 sqft Dongguan warehouse Tyre unloading activities at Dongguan warehouse Guangdong Province, China 21


22 Stamford Tyres Regional Activities Other markets Comprise of: Vietnam Brunei Australia Hong Kong Vietnam/ Brunei/ Australia/ HK Vietnam Falken dealers trip to China Dunlop Auto Expo 2018, Vietnam Australia Blacklion dealers trip to China Dunlop Tyres 130 Years Anniversary Dinner, Hong Kong 22
23 Financial Highlights FY
24 Key Financial Indicators (Comparative) FY18 FY17 S$'000 S$'000 Revenue 242, ,803 Gross profit 60,584 61,829 GP % 25% 26% Operating costs (59,413) (56,377) Share of results of JVs 1,637 1,987 Profit before tax 8,226 10,930 Net profit after MI 5,193 8,112 EPS (cents) NAV (cents)
25 Financial Ratios No Ratio FY18 FY17 1 Inventory turnover 176 days 164 days 2 Receivables turnover 91 days 104 days 3 Payables** turnover 135 days 150 days 4 Cash conversion cycle 132 days 118 days 5 Current ratio Quick ratio Net gearing **Note : Payables consist of trade payables and trust receipts borrowings.
26 Cash Flows FY18 S$'000 FY17 S$'000 Net cashflows from operating activities [A] 16,273 25,260 Decrease /(increase) in receivables 8,803 (1,189) (Increase) / decrease in inventories (10,036) 7,151 Net cash used in investing activities [B] (4,424) (6,979) Additions of property, plant and equipment (PPE) (4,927) (7,248) Proceeds from disposal of PPE Net cashflows used in financing activities [C] (11,671) (14,404) Net (repayment of) / proceeds from trust receipts (9,629) 1,122 Repayment of long term loans (16,575) (10,780) Proceeds from long-term loans 17,560 1,058 Dividends paid to shareholders (3,534) (2,356) Net cash increase during the year [D]=[A]+[B]+[C] 178 3,877 Cash and cash equivalents at beginning of the year [E] 21,693 17,425 Effect of exchange differences [F] Cash and cash equivalents at end of the year [D]+[E]+[F] 21,877 21,693 26
27 Dividends History FY14 FY15 FY16 FY17 FY18 S$'000 S$'000 S$'000 S$'001 S$'002 Profit after tax 10,016 1,703 2,587 8,112 5,193 Dividend 3,534 2,356 2,356 3,534 2,356 Payout ratio 35% 138% 91% 44% 45% Dividend per share (cents) Dividend yield (%) 3.8% 2.5% 3.7% 4.8% 3.0% EPS (cents)
28 Group Strategy And Outlook 28
29 Group Strategy And Outlook Drive topline growth via brands and products diversification Defend GP margin above 20%. Expand our sales and retailer network for tyres and wheels. Continue to focus on value-adding segments such as miningrelated services, Stamford Tyres Mart retail chain and truck commercial centres. Continue to buy competitively. Continue to work closely with our Principals to improve communication, profitability and product mix. Contain operating costs 29


30 Thank You! From the Management Team 30
Steering ahead FY2012 Results Briefing 22 nd June 2012
 Steering ahead FY2012 Results Briefing 22 nd June 2012 AGENDA FY2012 Highlights Business Overview Financial and Operations Highlights Industry Review Outlook & Growth Strategies FY2012 HIGHLIGHTS Revenue
BlueScope Steel Limited Consolidated Financial Headlines
 BlueScope Steel Limited Consolidated Financial Headlines 2003 2004 2005 2006 2007 2008 2009 2010 2011 2012 2013 2013 2013 2014 2014 2014 2015 2015 2015 2016 2016 2016 2017 2017 2017 2018 2018 2018 Total
2011 Third Quarter Update 17 November 2011
 2011 Third Quarter Update 17 November 2011 Operations Highlights Group (In HK$ millions) 3Q11 3Q10 2011 2010 Sales 1,334 1,125 +19% 3,983 3,262 +22% Gross profit 767 638 +20% 2,348 1,875 +25% Gross margin
FISCAL YEAR ENDING MARCH 2012 FIRST HALF FINANCIAL RESULTS
 FISCAL YEAR ENDING MARCH 2012 FIRST HALF FINANCIAL RESULTS Mazda Motor Corporation November 2, 2011 New Mazda CX-5 (European specifications) 1 PRESENTATION OUTLINE Highlights Fiscal Year Ending March 2012
FISCAL YEAR MARCH 2015 FIRST HALF FINANCIAL RESULTS. New Mazda Demio
 FISCAL YEAR MARCH 2015 FIRST HALF FINANCIAL RESULTS New Mazda Demio Mazda Motor Corporation October 31, 2014 1 PRESENTATION OUTLINE Highlights Fiscal Year March 2015 First Half Results Fiscal Year March
FISCAL YEAR MARCH 2015 FIRST QUARTER FINANCIAL RESULTS. Mazda Roadster 25 th Anniversary Model
 FISCAL YEAR MARCH 2015 FIRST QUARTER FINANCIAL RESULTS Mazda Roadster 25 th Anniversary Model Mazda Motor Corporation July 31, 2014 1 PRESENTATION OUTLINE Highlights Fiscal Year March 2015 First Quarter
FISCAL YEAR MARCH 2015 THIRD QUARTER FINANCIAL RESULTS. Updated Mazda CX-5 (Japanese specification model)
") FISCAL YEAR MARCH 2015 THIRD QUARTER FINANCIAL RESULTS Updated Mazda CX-5 (Japanese specification model) Mazda Motor Corporation February 4, 2015 1 PRESENTATION OUTLINE Highlights Fiscal Year March 2015
FISCAL YEAR MARCH 2015 THIRD QUARTER FINANCIAL RESULTS Updated Mazda CX-5 (Japanese specification model) Mazda Motor Corporation February 4, 2015 1 PRESENTATION OUTLINE Highlights Fiscal Year March 2015
FISCAL YEAR MARCH 2018 FIRST HALF FINANCIAL RESULTS
 FISCAL YEAR MARCH 2018 FIRST HALF FINANCIAL RESULTS PRESENTATION OUTLINE Highlights Fiscal Year March 2018 First Half Results Fiscal Year March 2018 Full Year Forecast Progress of Key Initiatives/ Business
Agenda 股票代號 :1590. Ⅰ Group Overview. Ⅱ Product & Market. Ⅲ Competitive Advantage. Ⅳ Financial Outlook. Ⅴ Development prospects & Strategic
 1 Agenda Ⅰ Group Overview Ⅱ Product & Market Ⅲ Competitive Advantage Ⅳ Financial Outlook Ⅴ Development prospects & Strategic 2 Ⅰ Group Overview 3 Group Overview 1988 AirTAC was founded in Taiwan 1998 AirTAC
FOURTH QUARTER 2017 Martin Lundstedt, President and CEO
 FOURTH QUARTER 2017 Martin Lundstedt, President and CEO Volvo Group FOURTH QUARTER HIGHLIGHTS Net sales +11% (+16% excl. currency) Continued improved profitability for the Group - Trucks adjusted operating
Downstream & Chemicals
 Downstream & Chemicals Pierre Breber Executive Vice President 017 Chevron Corporation Downstream portfolio Fuels refining & marketing Integrated value chains Lubricants & additives Globally positioned
2003 fourth quarter and full-year results
 Dinesh Paliwal Member of Group Executive Committee, Head of Automation Technologies Division 2003 fourth quarter and full-year results Automation Technologies Copyright 2003 ABB. All rights reserved. -
FY2012 third-quarter financial results
 FY2012 third-quarter financial results Nissan Motor Co., LTD. February 8, 2013 Key performance indicators: financial results (billion yen) Net revenue 6,698.4 6,755.2 Operating profit 427.8 Net income
FISCAL YEAR MARCH 2014 FIRST HALF FINANCIAL RESULTS. New Mazda Axela (Overseas name: New Mazda3)
") FISCAL YEAR MARCH 2014 FIRST HALF FINANCIAL RESULTS New Mazda Axela (Overseas name: New Mazda3) Mazda Motor Corporation October 31, 2013 1 PRESENTATION OUTLINE Highlights Fiscal Year March 2014 First Half
FISCAL YEAR MARCH 2014 FIRST HALF FINANCIAL RESULTS New Mazda Axela (Overseas name: New Mazda3) Mazda Motor Corporation October 31, 2013 1 PRESENTATION OUTLINE Highlights Fiscal Year March 2014 First Half
PKC Group establishes Joint Venture with JAC. Matti Hyytiäinen, President & CEO
 PKC Group establishes 50-50 Joint Venture with JAC Matti Hyytiäinen, President & CEO 1 PKC Group makes a major breakthrough in China and establishes JV with JAC PKC Group has signed an agreement to establish
1 Copyright(C) 2012 Isuzu Motors Limited All rights reserved
 2012 Isuzu Motors Limited All rights reserved") FY2012 Financial Results May 10, 2012 1 Copyright(C) 2012 Isuzu Motors Limited All rights reserved Contents Ⅰ. President and Representative Director : Susumu Hosoi FY2012 Overview Ⅱ. Director Director
FY2012 Financial Results May 10, 2012 1 Copyright(C) 2012 Isuzu Motors Limited All rights reserved Contents Ⅰ. President and Representative Director : Susumu Hosoi FY2012 Overview Ⅱ. Director Director
FY17 RESULTS BUSINESS UPDATES FY18 OUTLOOK. Nissan Motor Co., Ltd. May 14 th, 2018
 Nissan Motor Co., Ltd. May 14 th, 2018 RESULTS BUSINESS UPDATES FY18 OUTLOOK www.nissan-global.com Copyright NISSAN MOTOR CO., LTD. All rights reserved. 2 GLOBAL 91.81 5.08 TIV * 1 vs. 93.52 GLOBAL +1.9%
Q3 & 9M 2018 Results Presentation. October 24 th, 2018
 Q3 & 9M 2018 Results Presentation October 24 th, 2018 Q3 & 9M HIGHLIGHTS & CATEGORY SPOTLIGHTS Gonzalve BICH 3Q and 9M 2018 Results Presentation 2 9 Months 2018 Key Messages Continued challenging trading
FISCAL YEAR END MARCH 2013 FIRST HALF FINANCIAL RESULTS. New Mazda6 (Atenza)
") FISCAL YEAR END MARCH 2013 FIRST HALF FINANCIAL RESULTS New Mazda6 (Atenza) Mazda Motor Corporation October 31, 2012 1 PRESENTATION OUTLINE Highlights Fiscal Year March 2013 First Half Results Fiscal Year
FISCAL YEAR END MARCH 2013 FIRST HALF FINANCIAL RESULTS New Mazda6 (Atenza) Mazda Motor Corporation October 31, 2012 1 PRESENTATION OUTLINE Highlights Fiscal Year March 2013 First Half Results Fiscal Year
FISCAL YEAR ENDED MARCH 2011 FINANCIAL RESULTS
 FISCAL YEAR ENDED MARCH 211 FINANCIAL RESULTS Mazda Motor Corporation April 28, 211 Mazda MINAGI 1 PRESENTATION OUTLINE Highlights Fiscal Year Ended March 211 Results In Summary Question & Answer Session
FISCAL YEAR MARCH 2018 THIRD QUARTER FINANCIAL RESULTS
 FISCAL YEAR MARCH 2018 THIRD QUARTER FINANCIAL RESULTS PRESENTATION OUTLINE Highlights Fiscal Year March 2018 Nine Month Results Fiscal Year March 2018 Full Year Forecast Progress of Key Initiatives 1
FISCAL YEAR MARCH 2018 FIRST QUARTER FINANCIAL RESULTS
 FISCAL YEAR MARCH 2018 FIRST QUARTER FINANCIAL RESULTS PRESENTATION OUTLINE Highlights Fiscal Year March 2018 First Quarter Results Fiscal Year March 2018 Full Year Forecast Structural Reform Stage 2 Progress
Volvo Group THIRD QUARTER 2015 JAN GURANDER. Volvo Group Headquarters Third quarter
 Volvo Group THIRD QUARTER 2015 JAN GURANDER 1 VOLVO GROUP Third quarter highlights NET SALES SEK bn 12 months 310 bn IMPROVED PROFITABILITY ON FLAT VOLUMES UNDERLYING OPERATING MARGIN 6.9% 67 73 OPERATING
Financial Results for First Quarter of FY2015
 Financial Results for First Quarter of FY2015 (From April 1, 2014 to June 30, 2014) July 29, 2014 Hino Motors, Ltd. 1. Sales Turnover 2/15 Global Unit Sales (Retail Sales) 3/15 Sales Sales decreased decreased
Transform & Insist Move to our future. Investor Conference
 Investor Conference Outline Company Introduction Main shareholders Company Introduction RECHI was established in Dec 19, 1989 Human Resources: 6171 members (Until Dec 31, 2017) 2017 revenue NT$ 19,827
US$82,814m. Total assets. US$3,403m. Net debt. By Sector # US$411m Property. US$157m Insurance broking & financial services.
 Jardine Matheson Group Profile 2018 Jardine Matheson Holdings Limited 2017 Financial Highlights * US$83,808m Gross revenue US$4,378m Underlying profit before tax + US$82,814m Total assets 444,000 People
EXANE BNP PARIBAS 13th European Seminar June 8, 2011
 EXANE BNP PARIBAS 13th European Seminar June 8, 2011 This presentation may contain forward-looking statements. Such forward-looking statements do not constitute forecasts regarding the Company s results
FY2017 Results. February 26, 2018
 FY2017 Results February 26, 2018 Our background & development Registered capital increased to 12 MB Started International marine transportation ( Myanmar route ) Registered capital increased to 100 MB
third QUARTER 2012 October 26, 2012
 third QUARTER 212 October 26, 212 Helena norrman Senior Vice President Communications third QUARTER 212 October 26, 212 This presentation contains forward-looking statements. Such statements are based
FISCAL YEAR END MARCH 2013 FIRST QUARTER FINANCIAL RESULTS
 FISCAL YEAR END MARCH 213 FIRST QUARTER FINANCIAL RESULTS New MAZDA CX-5 Mazda Motor Corporation July 31, 212 1 PRESENTATION OUTLINE Highlights Fiscal Year End March 213 Results Update of Structural Reform
2010 Interim Results Presentation. August 23, 2010 Hong Kong
 Sinopec Corp. 21 Interim Results Presentation August 23, 21 Hong Kong Disclaimer i This presentation and the presentation materials distributed herein include forwardlooking statements. All statements,
Corporate Presentation May 2013
 Corporate Presentation May 2013 Geely Automobile In Figures Year started: 1998 Total workforce: 18,512 (on 31/12/2012) Manufacturing facilities: Products: Distribution network: 9 car plants in China 14
Global Polybutadiene Rubber (BR) Market Study ( )
 Market Study ( )") Global Polybutadiene Rubber (BR) Market Study (2014 2025) Table of Contents 1. INTRODUCTION 1.1. Introduction to Polybutadiene Rubber Market Product Description Properties Industry Structure Value Chain
Global Polybutadiene Rubber (BR) Market Study (2014 2025) Table of Contents 1. INTRODUCTION 1.1. Introduction to Polybutadiene Rubber Market Product Description Properties Industry Structure Value Chain
FISCAL YEAR MARCH 2014 FINANCIAL RESULTS
 FISCAL YEAR MARCH 214 FINANCIAL RESULTS Mazda CX-5 Mazda Atenza Mazda Motor Corporation April 25, 214 New Mazda Axela 1 PRESENTATION OUTLINE Highlights Fiscal Year March 214 Results Fiscal Year March 215
Fiscal Year 2015 Financial Results
 Fiscal Year 2015 Financial Results Nissan Motor Co., Ltd May 12, 2016 results FY16 outlook 2 Key performance indicators: financial results (TSE report basis - China JV Equity basis) Net revenue Operating
1 st Half 2018 Results. August 1 st, 2018
 1 st Half 2018 Results August 1 st, 2018 H1 HIGHLIGHTS & CATEGORY SPOTLIGHTS Gonzalve BICH 2 First Half 2018 Key Messages Challenging market and business environment Continued investment in targeted Brand
FY17 RESULTS BUSINESS UPDATES FY18 OUTLOOK. Nissan Motor Co., Ltd. May 14 th, 2018
 Nissan Motor Co., Ltd. May 14 th, 2018 RESULTS BUSINESS UPDATES FY18 OUTLOOK www.nissan-global.com Copyright NISSAN MOTOR CO., LTD. All rights reserved. 2 GLOBAL 91.81 5.08 TIV * 1 vs. 93.52 GLOBAL +1.9%
CB Industrial Product Holding Berhad Equipping Palm Oil Industries Around The World. CBIP Financial Highlights 2Q 2012
 CB Industrial Product Holding Berhad Equipping Palm Oil Industries Around The World CBIP Financial Highlights 2Q 2012 Operational Highlights Leading engineering company specializing in construction and
CONFIDENCE DYNA-MAC HOLDINGS LTD.
 Dyna-Mac Holdings Ltd. 3Q 2018 Results 08-November-2018 Photo: SBM Offshore FORWARD WITH CONFIDENCE DYNA-MAC HOLDINGS LTD. 1 Photo: SBM Offshore Business Overview 2 About Dyna-Mac A multi-disciplinary
FISCAL YEAR MARCH 2015 FINANCIAL RESULTS. New Mazda CX-3 (Japanese specification model)
") FISCAL YEAR MARCH 2015 FINANCIAL RESULTS New Mazda CX-3 (Japanese specification model) Mazda Motor Corporation April 24, 2015 1 PRESENTATION OUTLINE Highlights Fiscal Year March 2015 Results Fiscal Year
FISCAL YEAR MARCH 2015 FINANCIAL RESULTS New Mazda CX-3 (Japanese specification model) Mazda Motor Corporation April 24, 2015 1 PRESENTATION OUTLINE Highlights Fiscal Year March 2015 Results Fiscal Year
First in Mind First in Choice. Capital Markets Day 2006 Gunnar Brock, President and CEO
 First in Mind First in Choice Capital Markets Day 26 Gunnar Brock, President and CEO 1 December 4, 26 www.atlascopco.com Atlas Copco in a Snapshot Continuing operations A world leading provider of industrial
Market Outlook for Malaysian Rubber Products in th February 2014
 Market Outlook for Malaysian Rubber Products in 2014 25 th February 2014 World Economic Scenario World Economic Outlook For 2014 World growth increase from 3% in 2013 to 3.7% in 2014 Advanced economies
fy05i06 final results ESPRIT HOLDINGS LIMITED
 fy05i06 final results HOLDINGS LIMITED Forward-looking statements This presentation and subsequent discussion may contain certain forward-looking statements with respect to the financial condition, results
BMW Group posts record earnings for 2010
 10.03.2011 BMW Group posts record earnings for 2010 Profit before tax rises to euro 4,836 million Profit before financial result climbs to euro 5,094 million Automobiles segment reports EBIT of euro 4,355
1959 March Production commences at Yulon Motor Co., Ltd. in Taiwan, the Company s first overseas KD factory.
 Corporate History 1980 July Nissan Motor Manufacturing Corporation U.S.A. is established. 1933 1940 1935 April The first car manufactured by a fully integrated assembly system rolls off the line at the
2013 Final Results. 19 March 2014
 2013 Final Results 19 March 2014 Important Notice The information contained herein is meant for presentation purposes only and may not be used and relied upon by any other party. It is not to be taken
FY16 results. Business updates. FY17 outlook. Nissan Motor Co., Ltd. May 11 th, 2017
 Nissan Motor Co., Ltd. May 11 th, 2017 results Business updates FY17 outlook www.nissan-global.com Copyright NISSAN MOTOR CO., LTD. All rights reserved. 2 (TSE REPORT BASIS CHINA JV EQUITY BASIS) NET REVENUE
3Q 2016 Analyst Presentation
 3Q 2016 Analyst Presentation November 18, 2016 This presentation includes forward-looking statements. Actual future conditions (including economic conditions, energy demand, and energy supply) could differ
Conférence d Automne - Cheuvreux. Paris, September 26 th, 2011
 Conférence d Automne - Cheuvreux Paris, September 26 th, 2011 This presentation may contain forward-looking statements. Such forward-looking statements do not constitute forecasts regarding the Company
Fact Sheet for Q April 22, 2016
 Fact Sheet for Q1 2016 April 22, 2016 Contents Daimler Group Stock Market Information 3 Earnings and Financial Situation 4-13 Information for Divisions Mercedes-Benz Cars 14-17 Daimler Trucks 18-22 Mercedes-Benz
2010 Annual Results Announcement
 2010 Annual Results Announcement March 2011 1 Disclaimer These materials have been prepared by China ZhengTong Auto Services Holdings Limited ( ZhengTong Auto or The Company, together with its subsidiaries,
DISCLAIMER. Indofood Agri Resources Ltd.
 INTEGRATED PLANTATION WITH LEADING BRANDS Company Presentation Q 2008 Results 29 April 2008 DISCLAIMER This presentation was prepared solely and exclusively for the parties presently being invited for
DEUTZ Investor Presentation August 2016
 DEUTZ Investor Presentation August 2016 Agenda DEUTZ strategy & positioning Financials Outlook 2 DEUTZ at a glance World s first engine factory founded in 1864 by N.A. Otto, the developer of the four the
SORL Auto Parts, Inc. (NASDAQ: SORL)
") SORL Auto Parts, Inc. (NASDAQ: SORL) 2014 Investment Highlights A Leading Manufacturer of Auto Brake Systemin China and the World Growth Opportunities in China and Global Auto Market Strong Relationships
SORL Auto Parts, Inc. (NASDAQ: SORL) 2014 Investment Highlights A Leading Manufacturer of Auto Brake Systemin China and the World Growth Opportunities in China and Global Auto Market Strong Relationships
FY2014 2nd Quarter Business Results. Yamaha Motor Co., Ltd. August 5, 2014
 FY 2nd Quarter Business Results Yamaha Motor Co., Ltd. August 5, Forecast Consolidated Results Agenda FY 2nd Quarter Business Results Outline: Hiroyuki Yanagi President, CEO and Representative Director
Nissan Motor Co., Ltd. February 12 th, 2019
 Nissan Motor Co., Ltd. February 12 th, 2019 NET REVENUE 2,875.5 3,045.7 OPERATING PROFIT *1 NET INCOME 301.6 FREE CASH FLOW (AUTO) NET CASH (AUTO) 1,311.4 1,334.4 US TAX REFORM 207.7 82.4 103.3 93.9 *2
Q Financial Results
 Q3 2018 Financial Results 1 Forward-looking statement The statements on the future in this presentation, including expected sales and earnings, are associated with risks and uncertainties and may be affected
On track. Investor and Analyst Presentation On the Occasion of the Release of the Preliminary Figures for 9M 2011 Hanover, 18 October 2011
 On track. Investor and Analyst Presentation On the Occasion of the Release of the Preliminary Figures for 9M 2011 Agenda Delticom at a Glance Business Model Profit & Loss Balance Sheet Outlook 2 Agenda
CB Industrial Product Holding Berhad Equipping Palm Oil Industries Around The World. CBIP Financial Highlights FY 2012
 CB Industrial Product Holding Berhad Equipping Palm Oil Industries Around The World CBIP Financial Highlights FY 2012 Operational Highlights Leading engineering company specializing in construction and
282m 75% +575m. Net sales Operating income before non-recurring items. Operating margin before non-recurring items. Net Loss.
 First-Half 2009 Financial Highlights Net sales Operating income before non-recurring items Operating margin before non-recurring items Net Loss Net debt-to-equity ratio Free cash flow** 7,134m 282m 4.0%
Thermal Coal Market Presentation to UNECE Ad Hoc Group of Experts on Coal in Sustainable Development December 7, 2004
 Thermal Coal Market Presentation to UNECE Ad Hoc Group of Experts on Coal in Sustainable Development December 7, 2004 Barlow Jonker Pty Ltd Commercial in Confidence 1 Presentation Outline 1. Barlow Jonker
Over the past financial year our businesses have continued to develop based. on the recovery experienced in 2002/03. Operating profit improved in most
 Chairman s Statement Right Victor Lo Chairman & Chief Executive Left Andrew Ng Vice Chairman INTRODUCTION Over the past financial year our businesses have continued to develop based on the recovery experienced
ANALYST BRIEFING FOR THE THIRD QUARTER ENDED NOV 2016
 ANALYST BRIEFING FOR THE THIRD QUARTER ENDED 2016 21 NOV 2016 MSM Malaysia Holdings Berhad Analyst Briefing Q3 2016 21/11/2016 1 CONTENTS 01 02 03 04 05 Group Financial Highlights Performance Review Sugar
ASEAN became Korea s second largest trading partner under FTA
 11:00 AM KST, May. 31 ASEAN became Korea s second largest trading partner under FTA The Ministry of Trade, Industry and Energy announced on May 31 that in a decade since the Korea-Association of Southeast
Volvo Group THIRD QUARTER 2016 MARTIN LUNDSTEDT PRESIDENT AND CEO. Volvo Group Headquarters Third quarter
 Volvo Group THIRD QUARTER 2016 MARTIN LUNDSTEDT PRESIDENT AND CEO 1 VOLVO GROUP Third quarter highlights NET SALES SEK bn 12 months 299 bn 73.3 68.8 ADJUSTED OPERATING MARGIN* 12 months 6.7% % 6.9% 7.0%
FY 2017 Results. Disclaimer: Jardine Cycle & Carriage accepts no liability whatsoever with respect to the use of this document or its contents.
 FY 2017 Results Disclaimer: Jardine Cycle & Carriage accepts no liability whatsoever with respect to the use of this document or its contents. FINANCIAL HIGHLIGHTS Financial Highlights Underlying earnings
INCREASING SALES FOR MINING RELATED BUSINESS
 Investor Relations of PT UNITED TRACTORS Tbk INCREASING SALES FOR MINING RELATED BUSINESS In the first half 2001, the Company managed to record increase in net revenue from IDR 2.32 trillion to IDR 3.54
MICHELIN A better way forward
 MICHELIN A better way forward Source: Annual and sustainable development report 1 KEY FIGURES Michelin sites Environmental Footprint reduced by -33 % Employees 115,000 New hires 14,036 Net sales 20.7 bn
2015 Interim Results Announcement
 China Petroleum & Chemical Corporation 2015 Interim Results Announcement August 27, 2015 Hong Kong Cautionary Statement This presentation and the presentation materials distributed herein include forward-looking
"International Location Strategies of the European commercial vehicle manufacturers"
 VDA Press Workshop, July 14, 2006 "International Location Strategies of the European commercial vehicle manufacturers" Håkan Samuelsson Chairman of the Executive Board of MAN AG 1 Agenda An Overview of
PT Astra International Tbk 2011 Full Year Financial Statements
 To: Business Editor For immediate release PT Astra International Tbk 2011 Full Year Financial Statements The following announcement was issued today by the Company s 71%-owned subsidiary, Jardine Cycle
Third quarter AB Volvo
 Third quarter 2013 Third quarter 2013 TRUCKS EUROPE Excellent reception of the new products decision to optimize manufacturing Highlights in Commercial launch of the new product ranges Strong order situation
International Flows REGIONAL TABLES. Introduction. Key Trends. Key Indicators for Asia and the Pacific 2008
 183 International Flows The People s Republic of China has the biggest share of merchandise exports in the region. The destination of exports of major exporters tends to be other Asian economies. A similar
Figure 4.1: Shares in Total World Exports, Regions of the World; and Major Exporters in the Asia and Pacific Region, 2014
 272 Key Indicators for Asia and the Pacific 2015 Globalization Snapshots The Asia and Pacific region accounted for about one-third of the world s merchandise exports in 2014, up from about one-quarter
Global Automotive Scanner Market: Trends, Opportunities and Forecasts ( )
") Global Automotive Scanner Market: Trends, Opportunities and Forecasts (2016-2021) By Market Segment (Type of Scanner) - Handheld, Professional, Wireless By Region-North America, Europe, APAC, RoW By Country-
Global Automotive Scanner Market: Trends, Opportunities and Forecasts (2016-2021) By Market Segment (Type of Scanner) - Handheld, Professional, Wireless By Region-North America, Europe, APAC, RoW By Country-
On track. Investor and Analyst Presentation On the Occasion of the Release of the Preliminary Figures for FY 2011 Hanover, 19 January 2012
 On track. Investor and Analyst Presentation On the Occasion of the Release of the Preliminary Figures for FY 2011 Agenda Delticom at a Glance Business Model Profit & Loss Balance Sheet Outlook 2 Agenda
Q RESULTS. 24 th April 2018
 Q1 2018 RESULTS 24 th April 2018 DISCLAIMER This presentation does not constitute an offer to sell, or a solicitation of an offer to buy, PEUGEOT SA ( Company ) shares. This presentation may contain forward-looking
2017 Q3 REVENUE. October 25 th, 2017
 2017 Q3 REVENUE October 25 th, 2017 DISCLAIMER This presentation does not constitute an offer to sell, or a solicitation of an offer to buy, PEUGEOT SA ( Company ) shares. This presentation may contain
Mazda Motor Corporation June 17, 2011
 FY ENDING MARCH 2012 FINANCIAL FORECAST New MAZDA Demio 13-SKYACTIV Mazda Motor Corporation June 17, 2011 1 PRESENTATION OUTLINE FY ending March 2012 Forecast Updates of Framework for Medium- and Long-term
FY 2010 first-half financial results
 FY 2010 first-half financial results November 4, 2010 Nissan Motor Co., Ltd. first-half financial results Key performance indicators: Financial results (billion yen) Net revenue Operating profit Net income
Bernstein Strategic Decisions Conference 2018
 Bernstein Strategic Decisions Conference 2018 Forward-Looking Statements Certain statements in this presentation, other than statements of historical fact, including estimates, projections, statements
Earnings conference call
 Earnings conference call Full year 2017 Åke Bengtsson, President & CEO Andreas Ekberg, Acting CFO February 14, 2018 1 Agenda Business Summary Market Update Sales Financials Way forward 2 Business Summary
Corporate Communications. Media Information 15 March 2011
 15 March 2011 BMW Group aims to further increase earnings in 2011 EBIT margin of over 8% expected in Automobiles segment Sales volume of well in excess of 1.5 million vehicles targeted Margin of 8% to
Earnings conference call Q4 & FY 2016
 Earnings conference call Q4 & FY 2016 Bo Annvik, CEO / Åke Bengtsson, CFO February 10, 2016 1 Agenda Business Highlights Market Update Sales Financials Way forward 2 Business Summary FY 2016 A year with
Disclaimer: Jardine Cycle & Carriage accepts no liability whatsoever with respect to the use of this document or its contents.
 Disclaimer: Jardine Cycle & Carriage accepts no liability whatsoever with respect to the use of this document or its contents. Highlights Underlying earnings per share 22% down Astra profit lower and contribution
Automotive Holdings Group Limited. Euroz Securities Rottnest Island Conference Bronte Howson Managing Director March 2008
 Automotive Holdings Group Limited Euroz Securities Rottnest Island Conference 008 Bronte Howson Managing Director March 008 Group Snapshot Largest Automotive Retailing & Logistics Group in Australia 0
Money and banking. Flow of funds for the third quarter
 Statistical tables Money and banking Page S South African Reserve Bank: Liabilities... 2 South African Reserve Bank: Assets... 3 Corporation for Public Deposits: Liabilities... 4 Corporation for Public
Who is Sumitomo Rubber Industries?
 EXPORT WEEK 2014 Who is Sumitomo Rubber Industries? Sumitomo Rubber Industries (SRI) is a tyre and rubber company based in Kobe, Japan 5 th largest tyre manufacturing company with 11 tyre factories globally
Agenda. 1. Company Introduction 2. Financial Highlights 3. Market Opportunity and Competitive Advantage 4. Future Prospects
 Investor Conference Agenda 1. Company Introduction 2. Financial Highlights 3. Market Opportunity and Competitive Advantage 4. Future Prospects 2 Company Introduction 3 Main shareholders SAMPO Corporation
Q Sales and Revenues. April 22, 2009
 1 Q1 2009 Sales and Revenues 1 April 22, 2009 KEY HIGHLIGHTS Q1 revenues drop 24.9% in line with markets and inventory reduction policy Substantial decrease in inventories (-21.4% vs Q1-08 ) Market share
Earnings conference call Q3 2016
 Earnings conference call Q3 2016 Bo Annvik, CEO / Åke Bengtsson, CFO October 25, 2016 1 Agenda Business Highlights Market Update Sales Financials Outlook Public offer 2 Business Highlights Q3 2016 Solid
Healthier Net Profit under Stronger IDR
 Investor Bulletin, First Half 2002 Healthier Net Profit under Stronger IDR As of June 2002, the consolidated revenue in USD increased by 32% y.o.y. Due to IDR strengthening against USD, in IDR revenue
The Group s various divisions had mixed results due to very volatile economic conditions in Asia during the second
 REVIEW OF OPERATIONS INTRODUCTION The Group s various divisions had mixed results due to very volatile economic conditions in Asia during the second half of the year. RESULTS AND DIVIDEND The Group's consolidated
1Q17 Highlights. +22%YoY. Officially Launched. PT Maxnitron. Sales Volume 821 Liters 6.1 1,436. Million Members. Stations
 1Q17 Highlights +22%YoY Sales Volume 821 Liters 6.1 Million Members Officially Launched PT Maxnitron 1,436 Stations Agenda Industry Outlook Business Performance Project Update Financial Performance Thailand
Mazda Motor Corporation FISCAL YEAR MARCH 2016 FIRST HALF FINANCIAL RESULTS (Speech Outline)
") (For your information) November 5, 2015 Mazda Motor Corporation FISCAL YEAR MARCH 2016 FIRST HALF FINANCIAL RESULTS (Speech Outline) Representative Director Executive Vice President Akira Marumoto 1. HIGHLIGHTS
(For your information) November 5, 2015 Mazda Motor Corporation FISCAL YEAR MARCH 2016 FIRST HALF FINANCIAL RESULTS (Speech Outline) Representative Director Executive Vice President Akira Marumoto 1. HIGHLIGHTS
Increase of the sales by 33% mainly due to the Safelite acquisition
 36 - Vehicle Glass Repair and Replacement Increase of the sales by 33% mainly due to the Safelite acquisition 37 Key events in Vehicle Glass Repair and Replacement January 2007 The launch in the UK of
OVERVIEW OF THE ASIAN FUEL MARKET
 OVERVIEW OF THE ASIAN FUEL MARKET THE EUROPEAN FUELS CONFERENCE 9 March 2011 Sunanda Banerjee European Fuel Oxygenates Association - www.efoa.eu Mission and Vision Working closely with fuel policymakers,
BARLOWORLD MOTOR BARLOWORLD MOTOR ANALYSTS VISIT
 BARLOWORLD MOTOR ANALYSTS VISIT 21 st SEPTEMBER 2006 32 Brands Strategy It remains.. To provide a range of motor vehicle usage solutions that address the needs of our Customers. Value Based Management
Analysis of Operating Results and Financial Status
 Analysis of Operating Results and Financial Status 1. Analysis of Operating Results of EGAT and its Subsidiaries Operating results of EGAT and its subsidiaries including associated company and jointly
SORL Auto Parts, Inc. (NASDAQ: SORL) June 2012
 June 2012") SORL Auto Parts, Inc. (NASDAQ: SORL) June 2012 Safe Harbor Statement This presentation contains "forward-looking statements" within the meaning of the safe-harbor provisions of the Private Securities Litigation
SORL Auto Parts, Inc. (NASDAQ: SORL) June 2012 Safe Harbor Statement This presentation contains "forward-looking statements" within the meaning of the safe-harbor provisions of the Private Securities Litigation