1Q17 Highlights. +22%YoY. Officially Launched. PT Maxnitron. Sales Volume 821 Liters 6.1 1,436. Million Members. Stations
|
|
|
- Martha Daniel
- 5 years ago
- Views:
Transcription

1


2 1Q17 Highlights +22%YoY Sales Volume 821 Liters 6.1 Million Members Officially Launched PT Maxnitron 1,436 Stations


3 Agenda Industry Outlook Business Performance Project Update Financial Performance


4 Thailand Consumption Unit: Million Liters 1.5% YoY 8,213 8,205 7, % QoQ 8,136 8,337 Products 1Q2017 QoQ YoY Diesel 4.8% 1.1% Benzene % -5.8% Gasohol % 8.5% Gasohol % -4.0% E20-0.5% 7.0% 1Q16 2Q16 3Q16 4Q16 1Q17 Diesel Benzene 95 Gasohol 95 Gasohol 91 E20 Source: DOEB data Industry Outlook 1

5 Thailand s Marketing Margin Unit: Baht/Liter Q17 Diesel Total 2 Source: EPPO data Industry Outlook

6 Market Share by Sales Volume Through all Channels 7.69% 1.47% 7.16% 8.76% 1.48% 6.12% 7.74% 9.82% 1.41% 4.44% 7.77% 7.85% 11.47% % 11.53% % 11.93% 1Q % 13.09% 15.20% 13.46% 13.47% 12.63% 13.56% Total consumption: 30,607 ML Total consumption: 32,362 ML Total consumption: 8,365 ML 3 Including Diesel, Benzene 91-95, Gasohol 95, Gasohol 91, and Gasohol E20 Source: Department of Energy Business and Company Data Industry Outlook


7 Growing Number of Stations A Unit: Stations B Type of Station % % 75% 69% 951 1,150 19% 1,407 1,436 15% 14% 22% 85% 86% 81% 78% Q17 COCO DODO COCO Mix 28 COCO LPG 31 DODO 207 Unit: Stations COCO Oil 1,170 PT stations continuously increased to 1,436 stations Expects to reach 1,800 stations in 2017 Business Performance 4 4

8 Petrol Sales Volume A By Channel B By Product Unit: Million Liters % % 22% YoY 686 9% 734 5% 12% QoQ 821 8% % 22% YoY % 76% 76% % 28% Unit: Million Liters 12% QoQ % 70% 72% 74% 89% 83% 91% 95% 92% 1Q16 2Q16 3Q16 4Q16 1Q17 Diesel Mogas Product QoQ YoY 5 1Q16 2Q16 3Q16 4Q16 1Q17 Retail Wholesale Total Diesel +15% +19% Mogas +5% +34% Business Performance

9 COCO Same Store Sales Continuously Increased Unit: ML/Station/Month % QoQ +6% YoY 1Q15 2Q15 3Q15 4Q15 1Q16 2Q16 3Q16 4Q16 1Q17 Business Performance 6

10 COCO SSS by Opened Year Unit: ML/Station/Month Before Q16 2Q16 3Q16 4Q16 1Q17 Business Performance

11 LPG Continuously Grows Contrasted with Nation s LPG-Auto Consumption Trend Unit: Million Liters Thailand s LPG-Auto Consumption -4% QoQ -10% YoY PTG s LPG Sales Volume +17% QoQ 8 1Q16 2Q16 3Q16 4Q16 1Q17 PTG s LPG sales volume Thailand s LPG-Auto Consumption +205% YoY Source: DOEB and Company data Business Performance


 Trucks (Unit)")
12 Logistics 17% YoY Expected transportation volume in 2017 will increase by more than 35% YoY from continuous expansion of the service stations % QoQ Q16 2Q16 3Q16 4Q16 1Q17 9 Transported Volume (ML) Trucks (Unit) Business Performance


13 PT Max Card 10 Unit: Million Members A % QoQ Q F B C Increasing sales volume from members through COCO channel Non-members 30% 1Q17 Gas, 1.64% Members 70% 1 Card for All Point-Collecting Portions Punthai, 0.09% 1Q17 Oil, 97.85% Max Mart, 0.01% Maxnitron, 0.41% Business Performance


14 Punthai Coffee Shop Unit: Locations Punthai Coffee will hit 100 shops within June Q17 11 Punthai 1Q/2017 Inside station 52 branches Outside station 8 branches Business Performance


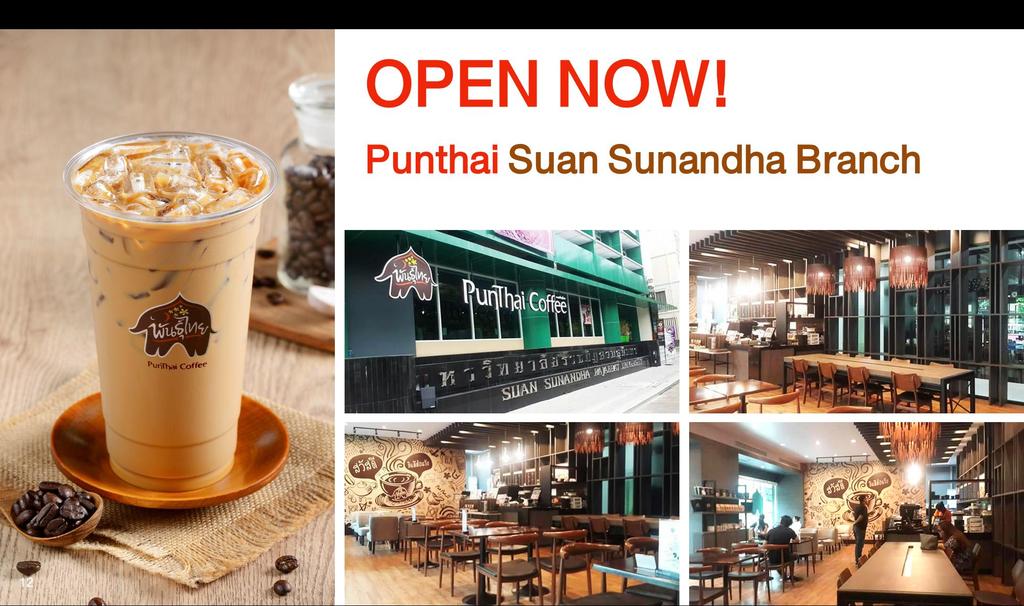
15 12 OPEN NOW! Punthai Suan Sunandha Branch


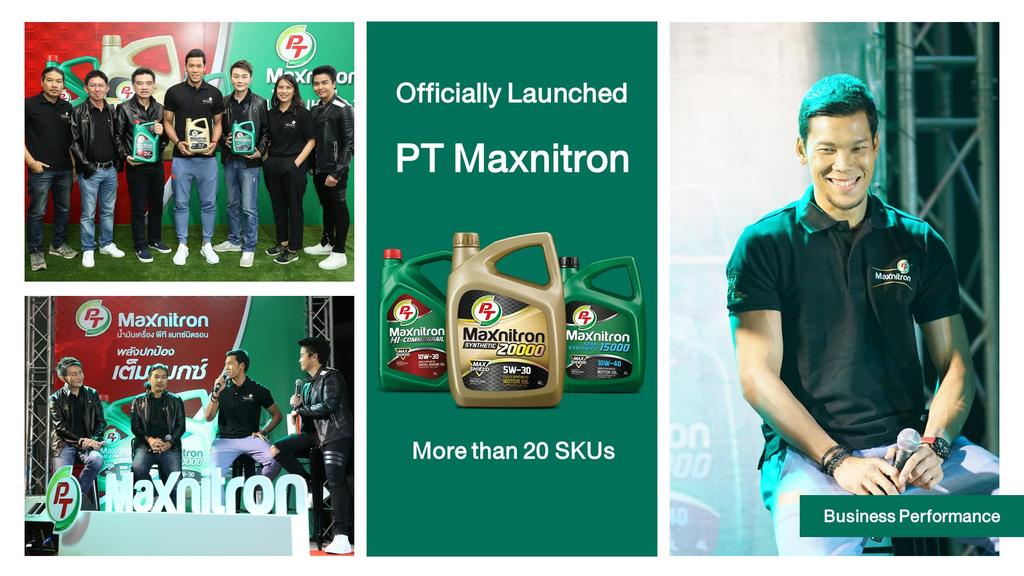
16 Officially Launched PT Maxnitron More than 20 SKUs Business Performance


17 Palm Complex (PPP) Business Type Capacity Palm Product Processing Biodiesel 450K/Day Olein 200K/Day COD 3Q/2017 Total Investment THB 4,800 Million (incl. working cap) 14 Project Update


18 Financial Performance


19 Revenue From Sales and Services Unit: Million Baht 53% YoY 17% QoQ 13,622 17,490 15,685 17,793 20, Q16 2Q16 3Q16 4Q16 1Q17 1Q17 sales and service revenue increased by 17% QoQ and 53% YoY due to the increase of sale volume, up by 12% QoQ and 22% YoY, and selling price per liter, up by 6% QoQ and 25% YoY, respectively. Financial Performance

20 Gross Profit and SG&A Unit: Million Baht 1,200 1,325 1,433 1,273 1,428 1, ,071 1,116 1,161 1,193 1Q15 2Q15 3Q15 4Q15 1Q16 2Q16 3Q16 4Q16 1Q17 Gross Profit SG&A 16 In 1Q17, SG&A increased mainly still from employee-related expenses, and rental and leasehold right expenses due to the continuous expansion of PT stations. Financial Performance

21 Gross Profit Structure 1Q16 2% 1Q17 5% 98% 95% 17 Oil Non-oil Financial Performance


22 EBITDA and Net Profit A EBITDA B Net Profit -5% YoY Unit: Million Baht -17% QoQ % YoY Unit: Million Baht -41% QoQ 181 1Q16 2Q16 3Q16 4Q16 1Q17 1Q16 2Q16 3Q16 4Q16 1Q17 The unequal adjustment between retail price and petroleum costs has a major impact on EBITDA and net profit, even though the sales volume increased. Financial Performance 18

23 Key Financial Ratio A Profitability ratios B Efficiency ratios 8.7% 7.7% 6.6% 4.3% 3.2% 3.1% 1.2% 1.7% 0.9% 17.1% 9.0% 25.0% 10.6% 16.0% 5.4% Unit: Days Q17 GPM EBITDA Margin NPM C Liquidity ratios Q17 ROA ROE D Liquidity ratios Cash Cycle Q17 Day in Inventory Avg. Collecting Period Avg. Payment Period Q17 (0.68) (3.90) Unit: Days (7.89) (9.10) Financial Performance

24 Key Financial Ratio A Leverage Ratios B Balance Sheet Q17 Unit: Million Baht 6% QoQ Cash & Cash Equivalent 12, ,204 3,654 13, ,635 4,107 Trades & Other Payables D/E Ratios Interest Bearing Debt Main liability increased from trades and other payables from higher sales volume, and longterm loans from business expansion. Expected D/E ratio is not more than 2 times 20 Current Assets Non- Current Assets 9,686 4,284 4,589 10, Q17 4,457 4,751 Liabilities Equity Financial Performance

25
PTG ENERGY PUBLIC COMPANY LIMITED. Opportunity Day. 2Q/2017 Performance Results
 PTG ENERGY PUBLIC COMPANY LIMITED Opportunity Day 2Q/2017 Performance Results PTG Businesses Retailing and Wholesaling Fuel Products Non-Fuel Products Logistics Business (Fuel logistics and Depot) Renewable
P T G E N E R G Y P C L F I S C A L Y E A R 2017 R E S U L T S O P P O R T U N I T Y D A Y - M a r 8 th, 2018
 P T G E N E R G Y P C L F I S C A L Y E A R 2017 R E S U L T S O P P O R T U N I T Y D A Y - M a r 8 th, 2018 1 A G E N D A 2 0 1 8 O U T L O O K 2 0 1 7 O V E R V I E W 2 0 1 7 F I N A N C I A L PERFORMANCE
Bangkok Expressway and Metro Public Company Limited Management Discussion and Analysis for the Quarter Ended on March 31, 2016
 Overall Operational Results In the first quarter of the year 2016, the Company had the net profit attributable to equity holders in the amount of Baht 702 Million, representing an increase from the same
Somboon Advance Technology PCL
 Somboon Advance Technology PCL Opportunity Day: 2014Q4 Mar 17, 2015 1 Company Overview Industry Overview Sale Performance Financial Highlights Q&A 2 Company Overview SAT Paid up 425 million Baht As of
3Q 2016 Analyst Presentation
 3Q 2016 Analyst Presentation November 18, 2016 This presentation includes forward-looking statements. Actual future conditions (including economic conditions, energy demand, and energy supply) could differ
Results for the Three Months ended June 30, 2018
 Reference Translation Results for the Three Months ended June 30, 2018 July 31, 2018 AUTOBACS SEVEN CO., LTD. FY March 2019 Consolidated P/L Profit Loss/Gain: Net sales and gross profit decreased, and
2015 Interim Results Announcement
 China Petroleum & Chemical Corporation 2015 Interim Results Announcement August 27, 2015 Hong Kong Cautionary Statement This presentation and the presentation materials distributed herein include forward-looking
Operations Financial Recent Update. The largest privately owned tap water producer in Thailand
 Thai Tap Water Supply Public Company Limited 1Q1010 Performance 10 May 2010 1Q10 Performance Operations Financial Recent Update 2 Sales Volume (daily average) PTW 1Q10 increase 2.9% QoQ, 5.4% YoY TTW 1Q10
Somboon Advance Technology PCL
 Somboon Advance Technology PCL Opportunity Day 2017Q2 September 12, 2017 1 Company Overview Automotive Industry Overview Tractor Industry Overview Sale Performance Financial Highlights Q&A 2 Company Overview
1. Trends in the current fiscal year and previous fiscal year 3. Business overview 2. Secular trends in first quarter financial results
 FY2/19 (March 2018~May 2018) Fact Book 1. Trends in the current fiscal year and previous fiscal year 3. Business overview (1) Performance overview P. 1 (1) No. of students at the end of month P. 6 (2)
Operating Results Q Asian Insulators Public Company Limited
 Operating Results Q2-2010 Asian Insulators Public Company Limited 254 Seri Thai Road, Kannayaow, Bangkok 10230 Thailand http://www.asianinsulators.com Tel. (66) 0-2517-1451 Fax. (66) 0-2517-1465 E-mail
ANALYST BRIEFING FOR THE FOURTH QUARTER ENDED FEBRUARY 2017
 ANALYST BRIEFING FOR THE FOURTH QUARTER ENDED 2016 22 FEBRUARY 2017 MSM Malaysia Holdings Berhad Analyst Briefing Q4 2016 22/2/2017 1 CONTENTS 01 02 03 04 05 Group Financial Highlights Performance Review
FY2/18 2Q(March 2017~August 2018)
") FY2/18 2Q(March 2017~August 2018) Fact Book 1. Trends in the current fiscal year and previous fiscal year 3. Business overview (1) Performance overview P.1 (1) No. of students at the end of month P.7 (2)
FY2/18 2Q(March 2017~August 2018) Fact Book 1. Trends in the current fiscal year and previous fiscal year 3. Business overview (1) Performance overview P.1 (1) No. of students at the end of month P.7 (2)
FY 2010 Results. Jakarta, 28 February 2011
 FY 2010 Results Jakarta, 28 February 2011 Table of Contents FY 2010 Results Do Good 2010 Company Update Executive Summary Loans grew 48% Customer Deposits grew 38%; Total Funding (incl. Bond) grew 50%
Analysis of Operating Results and Financial Status
 Analysis of Operating Results and Financial Status 1. Analysis of Operating Results of EGAT and its Subsidiaries Operating results of EGAT and its subsidiaries including associated company and jointly
TOFAŞ RESULTS WEBCAST PRESENTATION
 TOFAŞ 31.12.2017 RESULTS WEBCAST PRESENTATION 02.02.2018 AGENDA Highlights Turkish Automotive Industry Production Domestic Market Developments Tofaş Domestic Market Performance Export Markets & Tofaş Performance
Stronger Fundamental and Excellent Growth
 Investor Bulletin, First Half 2004 Stronger Fundamental and Excellent Growth For the first six months of 2004, PT United Tractors Tbk (UT/Company) recorded consolidated net revenue of IDR 4.29 trillion,
FY2017 Results. February 26, 2018
 FY2017 Results February 26, 2018 Our background & development Registered capital increased to 12 MB Started International marine transportation ( Myanmar route ) Registered capital increased to 100 MB
Financial Highlights Q1 Results of FY 2013 (Fiscal year ending March 2014) August 8, : Avex Group Holdings Inc.
 August 8, : Avex Group Holdings Inc.") Financial Highlights Q1 Results of FY 2013 (Fiscal year ending March 2014) August 8, 2013 7860: Avex Group Holdings Inc. 1 1 Consolidated Results 2 2 Q1 FY 2013 Highlights Record high as a quarterly sales.
Financial Highlights Q1 Results of FY 2013 (Fiscal year ending March 2014) August 8, 2013 7860: Avex Group Holdings Inc. 1 1 Consolidated Results 2 2 Q1 FY 2013 Highlights Record high as a quarterly sales.
3 rd Quarter 2017 Results
 Inside your life! 3 rd Quarter 2017 Results October 25, 2017 Mobile Automotive Display Semiconductor IoT LED Contents Ⅰ. Q3 2017 Earnings Summary Ⅱ. Earnings Highlight & Outlook Ⅲ. Results & Outlook by
Q Analyst Teleconference. 9 August 2018
 9 August 218 Disclaimer This presentation contains forward-looking statements that reflect the Company management s current views with respect to certain future events. Although it is believed that the
FISCAL YEAR MARCH 2015 THIRD QUARTER FINANCIAL RESULTS. Updated Mazda CX-5 (Japanese specification model)
") FISCAL YEAR MARCH 2015 THIRD QUARTER FINANCIAL RESULTS Updated Mazda CX-5 (Japanese specification model) Mazda Motor Corporation February 4, 2015 1 PRESENTATION OUTLINE Highlights Fiscal Year March 2015
FISCAL YEAR MARCH 2015 THIRD QUARTER FINANCIAL RESULTS Updated Mazda CX-5 (Japanese specification model) Mazda Motor Corporation February 4, 2015 1 PRESENTATION OUTLINE Highlights Fiscal Year March 2015
On track. Investor and Analyst Presentation On the Occasion of the Release of the Preliminary Figures for FY 2011 Hanover, 19 January 2012
 On track. Investor and Analyst Presentation On the Occasion of the Release of the Preliminary Figures for FY 2011 Agenda Delticom at a Glance Business Model Profit & Loss Balance Sheet Outlook 2 Agenda
Interim report Q3 2014
 Interim report Q3 2014 CEO Daniel Skjeldam CFO Erik Hansen 6 November 2014 Agenda Highlights and Key Figures Operational & Financial review Outlook Q&A 2 Highlights and key figures NOK 77 million pre tax
Healthier Net Profit under Stronger IDR
 Investor Bulletin, First Half 2002 Healthier Net Profit under Stronger IDR As of June 2002, the consolidated revenue in USD increased by 32% y.o.y. Due to IDR strengthening against USD, in IDR revenue
Aegean Marine Petroleum Network Inc.
 Aegean Marine Petroleum Network Inc. First Quarter 2007 Conference Call May 24, 2007 Disclosure Today s s presentation and discussion will contain forward-looking statements within the meaning of the Private
The 2 nd Quarter and 6-Month of 2014 Operating Performance Analysis of TRC Construction Public Company Limited and Its Subsidiaries
 1 The 2 nd Quarter and 6-Month of 2014 Operating Performance Analysis of TRC Construction Public Company Limited and Its Subsidiaries (Unit : Million Baht) The 1st Qtr The 2nd Qtr The 2nd Qtr (2 nd Qtr
LOCK & LOCK. 2Q 17 Earnings Release. 2 Aug 2017
 LOCK & LOCK 2Q 17 Earnings Release 2 Aug 2017 This document has been prepared by Lock & Lock, Co., Ltd. This document contains forward-looking statements, which are subject to risks, uncertainties, and
Analysis of Operating Results and Financial Status
 29 Analysis of Operating Results and Financial Status 1. Analysis of Operating Results of EGAT and Its Subsidiaries Operating results of EGAT and its subsidiaries including associated company and joint
2010 Interim Results Presentation. August 23, 2010 Hong Kong
 Sinopec Corp. 21 Interim Results Presentation August 23, 21 Hong Kong Disclaimer i This presentation and the presentation materials distributed herein include forwardlooking statements. All statements,
INCREASING SALES FOR MINING RELATED BUSINESS
 Investor Relations of PT UNITED TRACTORS Tbk INCREASING SALES FOR MINING RELATED BUSINESS In the first half 2001, the Company managed to record increase in net revenue from IDR 2.32 trillion to IDR 3.54
1H 2003 Financial Results (US GAAP)
") 1H 2003 Financial Results (US GAAP) October 2003 Crude Oil Production Growth bpd 1.52 1.50 1.48 1.46 1.44 1.42 1.40 Jan- 03 Daily crude production Feb- 03 Mar- 03 Apr- 03 May- 03 Jun- 03 Crude oil production*
1H 2003 Financial Results (US GAAP) October 2003 Crude Oil Production Growth bpd 1.52 1.50 1.48 1.46 1.44 1.42 1.40 Jan- 03 Daily crude production Feb- 03 Mar- 03 Apr- 03 May- 03 Jun- 03 Crude oil production*
Analyst Presentation 1Q 2008 Results
 Analyst Presentation 1Q 2008 Results 0 Contents Section 1: Section 2: Section 3: Section 4: Section 5: Company Overview IPO Update Operating Performance Consolidated Financial Performance Dividend Update
State Bank of India PRESS RELEASE
 State Bank of India PRESS RELEASE Q2FY18 / H1FY18 RESULTS Note: Historical Data has been arrived at by aggregating the audited numbers of the erstwhile Associate Banks, Bharatiya Mahila Bank and SBI for
FY2/18 (March 2017~February 2018)
") FY2/18 (March 2017~February 2018) Fact Book 1. Trends in the current fiscal year and previous fiscal year 3. Business overview (1) Performance overview P. 1 (1) No. of students at the end of month P. 6
FY2/18 (March 2017~February 2018) Fact Book 1. Trends in the current fiscal year and previous fiscal year 3. Business overview (1) Performance overview P. 1 (1) No. of students at the end of month P. 6
FISCAL YEAR END MARCH 2013 FIRST HALF FINANCIAL RESULTS. New Mazda6 (Atenza)
") FISCAL YEAR END MARCH 2013 FIRST HALF FINANCIAL RESULTS New Mazda6 (Atenza) Mazda Motor Corporation October 31, 2012 1 PRESENTATION OUTLINE Highlights Fiscal Year March 2013 First Half Results Fiscal Year
FISCAL YEAR END MARCH 2013 FIRST HALF FINANCIAL RESULTS New Mazda6 (Atenza) Mazda Motor Corporation October 31, 2012 1 PRESENTATION OUTLINE Highlights Fiscal Year March 2013 First Half Results Fiscal Year
Q3 Results November 16, 2006 Analyst Presentation
 Q3 Results 2006 November 16, 2006 Analyst Presentation Group Sales (in million Euro) Total Sales 2,395 +3.3% (+2.4%)* 2,474 Split per Business Group (YTD) Specialty Products 7% Q3 797 +1.0% (+2.5%)* 805
CONSOLIDATED FINANCIAL RESULTS OF THE UNIMOT GROUP 3Q 2017
 CONSOLIDATED FINANCIAL RESULTS OF THE UNIMOT GROUP 3Q 2017 1 PRESENTATION AGENDA Key 3Q 2017 events Financial results of the UNIMOT Group Market overview Business segments New projects Financial indicators
FY2/16(March 2015~February 2016)
") FY2/16(March 2015~February 2016) 1. Trends in the current fiscal year and the previous fiscal year 3. Business overview (1) Peformance overview P.1 (1) No. of students at the end of month P.7 (2) Cost
FY2/16(March 2015~February 2016) 1. Trends in the current fiscal year and the previous fiscal year 3. Business overview (1) Peformance overview P.1 (1) No. of students at the end of month P.7 (2) Cost
On track. Investor and Analyst Presentation On the Occasion of the Release of the Preliminary Figures for 9M 2011 Hanover, 18 October 2011
 On track. Investor and Analyst Presentation On the Occasion of the Release of the Preliminary Figures for 9M 2011 Agenda Delticom at a Glance Business Model Profit & Loss Balance Sheet Outlook 2 Agenda
Earnings conference call Q4 & FY 2016
 Earnings conference call Q4 & FY 2016 Bo Annvik, CEO / Åke Bengtsson, CFO February 10, 2016 1 Agenda Business Highlights Market Update Sales Financials Way forward 2 Business Summary FY 2016 A year with
FISCAL YEAR MARCH 2015 FIRST QUARTER FINANCIAL RESULTS. Mazda Roadster 25 th Anniversary Model
 FISCAL YEAR MARCH 2015 FIRST QUARTER FINANCIAL RESULTS Mazda Roadster 25 th Anniversary Model Mazda Motor Corporation July 31, 2014 1 PRESENTATION OUTLINE Highlights Fiscal Year March 2015 First Quarter
Operating Results of Q Asian Insulators Public Company Limited
 Operating Results of Q2-2012 Asian Insulators Public Company Limited 254 Seri Thai Road, Kannayaow, Bangkok 10230 Thailand http://www.asianinsulators.com Tel. (66) 0-2517-1451 Fax. (66) 0-2517-1465 E-mail
TOFAŞ Q ANALYST PRESENTATION
 TOFAŞ Q1 2016 ANALYST PRESENTATION 03.05.2016 1 2016 Q1 AGENDA Highlights Turkish Automotive Industry Production & Capacity Utilization Domestic Market Developments Tofaş Domestic Market Performance Export
FISCAL YEAR MARCH 2018 FIRST QUARTER FINANCIAL RESULTS
 FISCAL YEAR MARCH 2018 FIRST QUARTER FINANCIAL RESULTS PRESENTATION OUTLINE Highlights Fiscal Year March 2018 First Quarter Results Fiscal Year March 2018 Full Year Forecast Structural Reform Stage 2 Progress
Analyst Meeting. 2Q08 Performance. Tuesday 19 August 2008
 Analyst Meeting 2Q08 Performance Tuesday 19 August 2008 Agenda 2Q08 Management Highlights Sales Report GRM & Plant Utilization CAPEX Industry Outlooks Financial Performance Appendix 2 1H08 Highlight Overview
2013 Final Results. 19 March 2014
 2013 Final Results 19 March 2014 Important Notice The information contained herein is meant for presentation purposes only and may not be used and relied upon by any other party. It is not to be taken
Q Financial Results
 Q3 2018 Financial Results 1 Forward-looking statement The statements on the future in this presentation, including expected sales and earnings, are associated with risks and uncertainties and may be affected
Earnings conference call. Q4 and Full year 2015
 Earnings conference call Q4 and Full year 2015 Bo Annvik, CEO / Åke Bengtsson, CFO 11 February 2016 1 Agenda Business Highlights Market Update Sales Financials Outlook 2 2015 in numbers Operating margin
FISCAL YEAR MARCH 2018 FIRST HALF FINANCIAL RESULTS
 FISCAL YEAR MARCH 2018 FIRST HALF FINANCIAL RESULTS PRESENTATION OUTLINE Highlights Fiscal Year March 2018 First Half Results Fiscal Year March 2018 Full Year Forecast Progress of Key Initiatives/ Business
Analyst Meeting. 1Q08 Performance. Friday 16 May 2008
 Analyst Meeting 1Q08 Performance Friday 16 May 2008 Agenda 1Q08 Management Highlights Sales Report GRM & Plant Utilization CAPEX Financial Performance Industry Outlooks Conclusion 2 1Q08 Highlight Overview
Strong performance by the Bolloré Group s operating activities in 2018 Mr Cyrille Bolloré unanimously appointed Chairman and Chief Executive Officer
 PRESS RELEASE 2018 results (1) March 14, 2019 Strong performance by the Bolloré Group s operating activities in 2018 Mr Cyrille Bolloré unanimously appointed Chairman and Chief Executive Officer Revenue:
FY2/17 3Q(March 2016~November2016)
") FY2/17 (March 2016~November2016) Fact Book 1. Trends in the current fiscal year and previous fiscal year 3. Business overview (1) Performance overview P. 1 (1) No. of students at the end of month P. 7
FY2/17 (March 2016~November2016) Fact Book 1. Trends in the current fiscal year and previous fiscal year 3. Business overview (1) Performance overview P. 1 (1) No. of students at the end of month P. 7
Date/Time : 10/08/ :58. PTT : Management's discussion and Analysis Q2/07. PTT Public Co., Ltd.
 Date/Time : 10/08/2007 20:58 PTT : Management's discussion and Analysis Q2/07 PTT Public Co., Ltd. Management's Discussion and Analysis (MD&A) and operating results for the three- month and six-month period
1Q 2015 Business Result. May 2015
 1Q 2015 Business Result May 2015 Disclaimer The financial information in this document are consolidated earnings results based on K-IFRS. The previous earnings results have also been stated in compliance
FISCAL YEAR MARCH 2018 THIRD QUARTER FINANCIAL RESULTS
 FISCAL YEAR MARCH 2018 THIRD QUARTER FINANCIAL RESULTS PRESENTATION OUTLINE Highlights Fiscal Year March 2018 Nine Month Results Fiscal Year March 2018 Full Year Forecast Progress of Key Initiatives 1
FISCAL YEAR END MARCH 2013 FIRST QUARTER FINANCIAL RESULTS
 FISCAL YEAR END MARCH 213 FIRST QUARTER FINANCIAL RESULTS New MAZDA CX-5 Mazda Motor Corporation July 31, 212 1 PRESENTATION OUTLINE Highlights Fiscal Year End March 213 Results Update of Structural Reform
PRO-FORMA FIGURES OF THE A2A GROUP
 PRO-FORMA FIGURES OF THE A2A GROUP restated at December 31, 2007 published on March 25, 2009 Contents 3 0.1 Summary of pro-forma figures restated at December 31, 2007 7 0.2 Presentation of the pro-forma
Research Coverage Report by Shared Research Inc.
 esearch eport by Shared esearch Inc. https://sharedresearch.jp This PDF document is an updated note on the company. A comprehensive version of the report on the company, including this latest update, is
Financial Statements Matti Lievonen, President & CEO 7 February 2017
 Financial Statements 2016 Matti Lievonen, President & CEO Agenda 1 2 3 4 Year 2016 Financials 2016 Segment reviews Current topics 5 Appendix 2 Disclaimer The following information contains, or may be deemed
RESULTS FOR Q ANALYST TELECONFERENCE
 RESULTS FOR Q4 216 ANALYST TELECONFERENCE Market 1 2 Operation Financials 3 Market 1 216 Fourth Quarter Market Conditions Product Market Crude Oil Postponed Maintenances Started to take place High Agricultural
First Resources Limited First Quarter 2017 Results Presentation 11 May 2017
 First Resources Limited First Quarter 2017 Results Presentation 11 May 2017 Delivering Growth and Returns Table of Contents Executive Summary 3 Financial Performance 4 Operational Performance 9 Growth
2017 Rp bn. Net revenue 150, , Net income* 14,184 11, Net earnings per share As at 30th September 2017 Rp bn
 31st October 2017 PT ASTRA INTERNATIONAL TBK 2017 THIRD QUARTER FINANCIAL STATEMENTS PRESS RELEASE Highlights Net earnings per share up 26 at 350 Increased market share for both cars and motorcycles Positive
Subject: Report on the operating results of Country Group Development PCL for the period ended September 30, 2018
 CGD61/0054 Date: November 13, 2018 Subject: Report on the operating results of Country Group Development PCL for the period ended September 30, 2018 To: The President The Stock Exchange of Thailand Country
Earnings conference call Q3 2016
 Earnings conference call Q3 2016 Bo Annvik, CEO / Åke Bengtsson, CFO October 25, 2016 1 Agenda Business Highlights Market Update Sales Financials Outlook Public offer 2 Business Highlights Q3 2016 Solid
VGI Global Media Plc. 2015/16 Earnings Presentation 16 May 2016
 VGI Global Media Plc 2015/16 Earnings Presentation 16 May 2016 Disclaimer Investment involves risk. Prospective should understand the characteristics of Securities and study information about VGI Global
Disclaimer: Jardine Cycle & Carriage accepts no liability whatsoever with respect to the use of this document or its contents.
 Disclaimer: Jardine Cycle & Carriage accepts no liability whatsoever with respect to the use of this document or its contents. Highlights Underlying earnings per share 22% down Astra profit lower and contribution
Automotive Holdings Group Limited. Euroz Securities Rottnest Island Conference Bronte Howson Managing Director March 2008
 Automotive Holdings Group Limited Euroz Securities Rottnest Island Conference 008 Bronte Howson Managing Director March 008 Group Snapshot Largest Automotive Retailing & Logistics Group in Australia 0
Agenda 股票代號 :1590. Ⅰ Group Overview. Ⅱ Product & Market. Ⅲ Competitive Advantage. Ⅳ Financial Outlook. Ⅴ Development prospects & Strategic
 1 Agenda Ⅰ Group Overview Ⅱ Product & Market Ⅲ Competitive Advantage Ⅳ Financial Outlook Ⅴ Development prospects & Strategic 2 Ⅰ Group Overview 3 Group Overview 1988 AirTAC was founded in Taiwan 1998 AirTAC
FISCAL YEAR MARCH 2014 FINANCIAL RESULTS
 FISCAL YEAR MARCH 214 FINANCIAL RESULTS Mazda CX-5 Mazda Atenza Mazda Motor Corporation April 25, 214 New Mazda Axela 1 PRESENTATION OUTLINE Highlights Fiscal Year March 214 Results Fiscal Year March 215
DEUTZ Investor Presentation August 2016
 DEUTZ Investor Presentation August 2016 Agenda DEUTZ strategy & positioning Financials Outlook 2 DEUTZ at a glance World s first engine factory founded in 1864 by N.A. Otto, the developer of the four the
INTEGRATED PLANTATION WITH LEADING BRANDS. Company Presentation - Q Results
 INTEGRATED PLANTATION WITH LEADING BRANDS Company Presentation - Q1 2007 Results April 2007 DISCLAIMER This presentation was prepared solely and exclusively for the parties presently being invited for
INVESTOR CALL 26 th April, Mahindra Towers
 INVESTOR CALL 26 th April, 2012 Mahindra Towers The opportunity Indian Hotel Industry Rs. 191 Bn Leisure usage Rs. 101 Bn Source : IBEF - India Brand Equity Foundation Business Model Revenue recognition
TOFAŞ RESULTS WEBCAST PRESENTATION
 TOFAŞ 31.12.2016 RESULTS WEBCAST PRESENTATION 02.02.2017 1 WEBCAST AGENDA Highlights Turkish Automotive Industry Production Domestic Market Developments Tofaş Domestic Market Performance Export Markets
ANALYST BRIEFING FOR THE THIRD QUARTER ENDED NOV 2016
 ANALYST BRIEFING FOR THE THIRD QUARTER ENDED 2016 21 NOV 2016 MSM Malaysia Holdings Berhad Analyst Briefing Q3 2016 21/11/2016 1 CONTENTS 01 02 03 04 05 Group Financial Highlights Performance Review Sugar
PETROBRAS ARGENTINA S.A.
 PETROBRAS ARGENTINA S.A. Second Quarter 2015 Results Buenos Aires, July 30, 2015 Petrobras Argentina S.A. (Buenos Aires: PESA NYSE: PZE) announces the results for the second quarter ended June 30, 2015.
FISCAL YEAR MARCH 2014 FIRST HALF FINANCIAL RESULTS. New Mazda Axela (Overseas name: New Mazda3)
") FISCAL YEAR MARCH 2014 FIRST HALF FINANCIAL RESULTS New Mazda Axela (Overseas name: New Mazda3) Mazda Motor Corporation October 31, 2013 1 PRESENTATION OUTLINE Highlights Fiscal Year March 2014 First Half
FISCAL YEAR MARCH 2014 FIRST HALF FINANCIAL RESULTS New Mazda Axela (Overseas name: New Mazda3) Mazda Motor Corporation October 31, 2013 1 PRESENTATION OUTLINE Highlights Fiscal Year March 2014 First Half
FY2/15(March 2014~February 2015)
") FY2/15(March 2014~February 2015) 1. Trends in the current fiscal year and the previous fiscal year 3. Business overview (1) Peformance overview P.1 (1) No. of students at the end of month P.7 (2) Cost
FY2/15(March 2014~February 2015) 1. Trends in the current fiscal year and the previous fiscal year 3. Business overview (1) Peformance overview P.1 (1) No. of students at the end of month P.7 (2) Cost
Fact Sheet for Q April 22, 2016
 Fact Sheet for Q1 2016 April 22, 2016 Contents Daimler Group Stock Market Information 3 Earnings and Financial Situation 4-13 Information for Divisions Mercedes-Benz Cars 14-17 Daimler Trucks 18-22 Mercedes-Benz
Q3 & 9M 2018 Results Presentation. October 24 th, 2018
 Q3 & 9M 2018 Results Presentation October 24 th, 2018 Q3 & 9M HIGHLIGHTS & CATEGORY SPOTLIGHTS Gonzalve BICH 3Q and 9M 2018 Results Presentation 2 9 Months 2018 Key Messages Continued challenging trading
1 st Half 2018 Results. August 1 st, 2018
 1 st Half 2018 Results August 1 st, 2018 H1 HIGHLIGHTS & CATEGORY SPOTLIGHTS Gonzalve BICH 2 First Half 2018 Key Messages Challenging market and business environment Continued investment in targeted Brand
MODEC, Inc Financial Results Analysts Presentation. February 9, 2017
 MODEC, Inc. 216 Financial Results Analysts Presentation February 9, 217 MODEC, Inc. 216 Financial Results Highlights Market Review & Outlook Financial Results 2 FY216 : Delivered Units FPSO Prof. John
KCB GROUP PLC INVESTOR PRESENTATION. Q FINANCIAL RESULTS
 KCB GROUP PLC INVESTOR PRESENTATION. Q3 2018 FINANCIAL RESULTS MACRO-ECONOMIC HIGHLIGHTS Macro-Economic Highlights: Kenya KENYA 4.9% 5.3% GDP Growth Rate (%) 5.6% 5.8% 4.9% 6.3% 6.2% KENYA 2013 2014 2015
Lazydays Holdings, Inc. Reports Second Quarter 2018 Financial Results
 News Contact: +1 (813) 204-4099 investors@lazydays.com Lazydays Holdings, Inc. Reports Second Quarter 2018 Financial Results Tampa, FL (August 9, 2018) Lazydays Holdings, Inc. ( Lazydays )(NasdaqCM: LAZY)
FY2/17 (March 2016~February 2017)
") FY2/17 (March 2016~February 2017) Fact Book 1. Trends in the current fiscal year and previous fiscal year 3. Business overview (1) Performance overview P. 1 (1) No. of students at the end of month P. 7
FY2/17 (March 2016~February 2017) Fact Book 1. Trends in the current fiscal year and previous fiscal year 3. Business overview (1) Performance overview P. 1 (1) No. of students at the end of month P. 7
February Annual Results February 13, 2008
 February 2008 1 Annual Results February 13, 2008 AGENDA AGENDA 2007 Highlights 2007 Financial Results x Competitiveness Sales and products dynamic International 2008 Outlook February 2008 2 2007: performance
Jaguar Land Rover Results For the quarter ended 30 June August 2015
 Jaguar Land Rover Results For the quarter ended 30 June 2015 7 August 2015 1 Disclaimer Statements in this presentation describing the objectives, projections, estimates and expectations of Jaguar Land
AUTUMN CONFERENCE CHEUVREUX Paris. Cheuvreux Conference - Paris
 AUTUMN CONFERENCE CHEUVREUX Paris September 25 juillet 20 th, 2012 1 This presentation does not constitute an offer to sell, or a solicitation of an offer to buy, PEUGEOT SA ( Company ) shares. This presentation
282m 75% +575m. Net sales Operating income before non-recurring items. Operating margin before non-recurring items. Net Loss.
 First-Half 2009 Financial Highlights Net sales Operating income before non-recurring items Operating margin before non-recurring items Net Loss Net debt-to-equity ratio Free cash flow** 7,134m 282m 4.0%
Lazydays Holdings, Inc. Reports Third Quarter 2018 Financial Results
 News Contact: +1 (813) 204-4099 investors@lazydays.com Lazydays Holdings, Inc. Reports Third Quarter 2018 Financial Results Tampa, FL (November 8, 2018) Lazydays Holdings, Inc. ( Lazydays ) (NasdaqCM:
Management Discussion and Analysis
 Management Discussion and Analysis For the Annual Operating Results Ended December 31, 2009 Note: This Management Discussion and Analysis (MD&A) was made to disclose information and the vision of the management
INVESTOR PRESENTATION 2016
 INVESTOR PRESENTATION 2016 WHY BRISA IS A GREAT COMPANY TO INVEST 1. Fast growing market: o Increasing capacity and new investments of automotive manufacturers o Continued growth potential in the domestic
Driving Value in an Inflated Market. June 24, 2015
 Driving Value in an Inflated Market June 24, 2015 Group 1 Automotive Ticker: GPI Stock Price: $82.53 * Group 1 owns and operates auto dealerships Third largest dealership group in the U.S. retailing 275,000
Third quarter results Matti Lievonen, President & CEO 26 October 2017
 Third quarter results 2017 Matti Lievonen, President & CEO 26 October 2017 Agenda 1. Q3/17 Group financials 2. January-September 2017 review 3. Q3/17 Segment reviews 4. Current topics 5. Appendix 2 Disclaimer
July Q 2015 Results Update
 July 2015 2Q 2015 Results Update Steady Loans Growth and Strong Liquidity Loans Growth in line with Industry: Loans growth: 11.4% (YoY); 7.1% (YTD) vs Industry: 10.4% (May 15 YoY) Deposits growth: 8.4%
MONRO MUFFLER BRAKE, INC. PROVIDES FOURTH QUARTER AND FISCAL 2017 FINANCIAL RESULTS
 CONTACT: John Van Heel Chief Executive Officer (585) 647-6400 Robert Gross Executive Chairman (585) 647-6400 FOR IMMEDIATE RELEASE Brian D Ambrosia Senior Vice President Finance Chief Financial Officer
 General Announcement::Astra's 2017 3rd Quarter Financial Statements http://infopub.sgx.com/apps?a=cow_corpannouncement_content&b=announce... Page 1 of 1 31/10/2017 General Announcement::Astra's 2017 3rd
2016 Annual Results Presentation. March 15, 2017
 2016 Annual Results Presentation March 15, 2017 Frank Chan 2 2016 Full Year Results (US$ m) 2015 2016 Change Local Curr Sales $5,038 $5,480 +8.8% +9.8% Gross Profit $1,798 $1,985 +10.4% Gross Margin %
Welcome Welcome... 1
 Welcome Welcome... 1 Presentation Structure Our presentation is split into three sections going through the market, operations and financials 2 3 As it has been indicated previously, it is now much clear
BlueScope Steel Limited Consolidated Financial Headlines
 BlueScope Steel Limited Consolidated Financial Headlines 2003 2004 2005 2006 2007 2008 2009 2010 2011 2012 2013 2013 2013 2014 2014 2014 2015 2015 2015 2016 2016 2016 2017 2017 2017 2018 2018 2018 Total