Contents of Paper. 06-Jan-17 SIGNIFICANCE OF COMMODITIES SECTOR TO MALAYSIAN ECONOMY, WITH EMPHASIS ON OIL PALM
|
|
|
- Brenda Nash
- 5 years ago
- Views:
Transcription


1 SIGNIFICANCE OF COMMODITIES SECTOR TO MALAYSIAN ECONOMY, WITH EMPHASIS ON OIL PALM Ahmad Fauzi, Puasa Deputy Director Malaysian Institute of Economic Research (MIER) 17 January 2017 Contents of Paper World and Regional Economic Outlook Global Commodity Market Outlook World Palm Oil Production World Trade of Palm Oil Malaysia s Palm Oil Industry Economic Impact on the Malaysian Economy: Change in Oil and Fats Export & Exchange Rate Conclusion 1


2 Global Economic Developments: Uneven Growth Global growth in 2016 is projected to grow slower at 3.1 percent before recovering to 3.4 percent in Subdued outlook for advanced and emerging economies due to geopolitical risks and rise of protectionism. Persistent of low commodity prices cause readjustment and realignment of world economies to the new norm. 2
3 World Economic Outlook Projections (% y-o-y) Year Projections Difference from April 2014 WEO Projections World Advanced Economies US Euro Area Japan Developing Asia China India ASEAN World Trade Volume SOURCE: IMF Year Projections Difference from July 2016 WEO Update World Advanced Economies United States Euro Area Japan Emerging and Developing Asia China India ASEAN World Trade Volume (goods and services) SOURCE: IMF World Economic Outlook Projections (% y-o-y)


4 Global Activity The strengthening in activity was mirrored in global trade and industrial production. SOURCE: IMF International Reserves The distribution of risks to global growth is more balanced than that presented in the October 2014 WEO but is still tilted to the downside. A greater boost to demand from lower oil prices is an important upside risk. And downside risks have moderated given a lower baseline path for growth in emerging market economies. SOURCE: IMF 4
5 Commodity Prices SOURCE: IMF Declines in the prices of commodities, especially fuels and food, have been a common force behind recent decreases in headline inflation across the globe. Commodity prices in U.S. dollar terms are projected to ease a bit further in , partly reflecting the path implied by commodity futures prices. 5
6 Since the October 2013 WEO, energy prices have been fairly flat overall, with falling prices for crude oil offset by rising prices for natural gas and coal. Metal prices have remained broadly flat at about 30 percent below the highs of early 2011, with most markets in surplus (large and rising stocks and steady gains in production) In food markets, the production outlook is favorable for most major crops. Annual Food Production and Consumption (Billion tons) Global output for major grains and oilseeds is projected to surpass demand growth SOURCE: IMF 6

7 Global Food SOURCE: IMF Stocks continue to gradually recover, especially stocks of corn. In early 2014, concerns about the effects of adverse weather on South American harvests have exerted some upward price pressure. 7
8 Some Vital Statistics of the Major Economies , 2015 (Average) Country GDP YoY % 2013/ / 2014 Inflation Rate % 2015 Jobless Rate % 2013/ Government Budget % 2013/ Debt to GDP % 2013/ USA Euro zone China Japan S. Korea Malaysia SOURCE: TRADING ECONOMICS GLOBAL COMMODITY MARKET OUTLOOK 8

9 Efficient and Highly Productive Oil palm is the most efficient oilseed crop in the world. One hectare of oil palm plantation is able to produce up to ten times more oil than other leading oilseed crops. The most efficient producers may achieve yields as high as eight tonnes of oil per hectare. Indonesia and Malaysia produce about 85.3% of the world s palm oil. Other producer countries include Thailand, Columbia, Nigeria, Ecuador and Papua New Guinea. Source: Ahmad Fauzi (2016) 9


10 Economic Zone Source: Ahmad Fauzi (2016) Source: Oil World (2016) 10


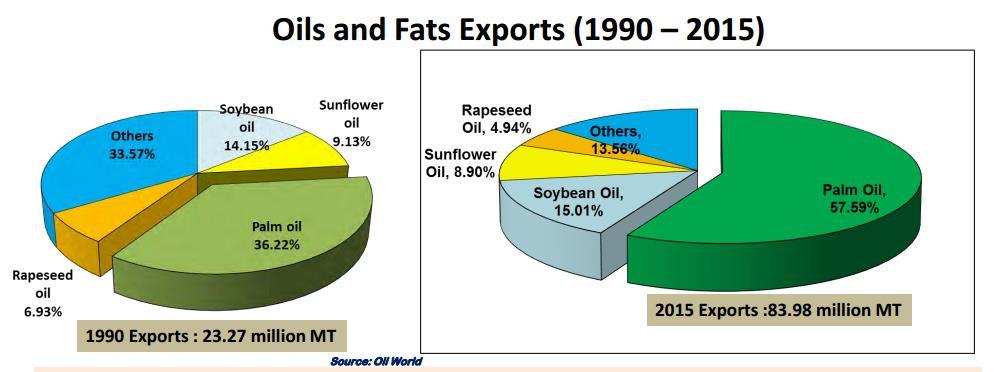
11 Global Production But oil palm produced 32.0% of global oils and fats output in
12 12


13 Palm oil is one of the 17 major oils and fats produced globally. EU is the largest consumer of oils and fats, followed by USA, Indonesia, China and India. 13
14 14
15 Global consumption for palm oil was 52.1 million tonnes in Trends in the Global Consumption of Palm Oil Approximately 80% of global palm oil production is used for food purposes. In addition, palm oil is used as an ingredient in non edible products including in the production of bio-fuel, soaps, detergents and surfactants, cosmetics, pharmaceuticals and a wide variety of other household and industrial products. Palm oil and palm kernel oil uses, in both food and non-food products, have been growing significantly. By 2020, global consumption of palm oil is expected to grow almost 60 million tonnes. 15

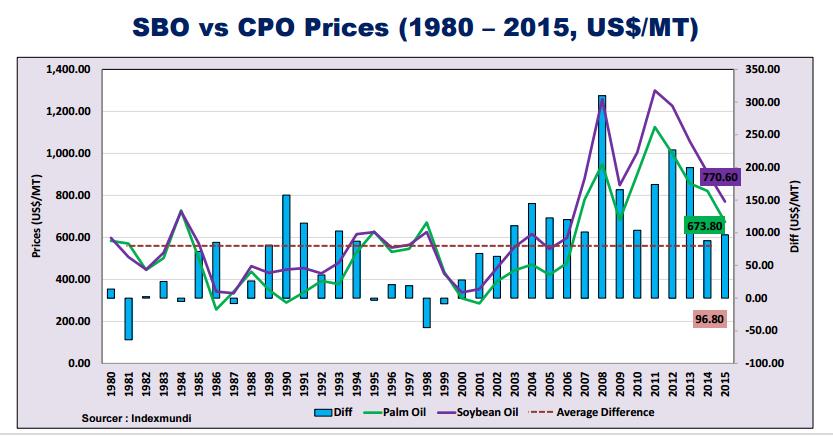
16 Comparison of Prices of Major Vegetable Oil Price of palm oil is more competitive than prices of soybean, rapeseed and sunflower oil in the world market for oils and fats. Global Commodity Market Outlook The oil palm industry is one of the important sources of food for human consumption obviously it is in line with an increase of world population. In , the commodity prices moving upward were due to strong economic growth, re-stocking in China, and a number of supply constraints. However in early 2011, several disruptions, including drought and heavy rains that affected most agriculture markets as well as coal and mineral output in various locales, weakening trend in overseas markets also put pressure on the prices pushed prices downward. 16
17 PRICE USD PRICE USD Historical Palm Oil Price (Nominal USD) YEAR SOURCE: WORLD BANK Palm Oil Price Forecast (Nominal USD) YEAR SOURCE: WORLD BANK 17
18 WORLD PALM OIL PRODUCTION 18

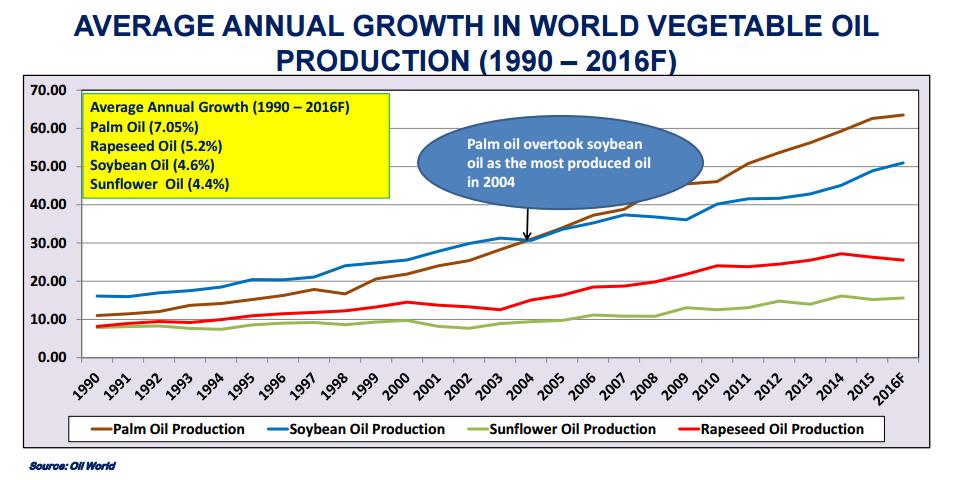
19 Trend in Global Palm Oil Production World Palm Oil Production World Indonesia Malaysia Total world production of palm oil has increased more than threefold over the past 3 decades to Percentage Share of Palm Oil Production In 2015, total palm oil production was estimated at million tonnes, with Malaysia and Indonesia accounting for more than 85.3 percent of the world total. Percentage Share of Palm oil Production, 2015 Others 15% Indonesia and Malaysia each produced about million tonnes and million tonnes respectively. Malaysia 32% Indonesia 53% 19
20 World Palm Oil Production ('000 Tonnes) Country Difference Tonnes % Tonnes % Tonnes % Change Indonesia 31, , , Malaysia 19, , Thailand 1, , (20) (1.07) Colombia 1, , Nigeria Ecuador Papua New Guinea Honduras Guatemala Côte D'ivoire Brazil Costa Rica Venezuela Others 1, , TOTAL 59, , , SOURCE: MPOB WORLD TRADE OF PALM OIL 20

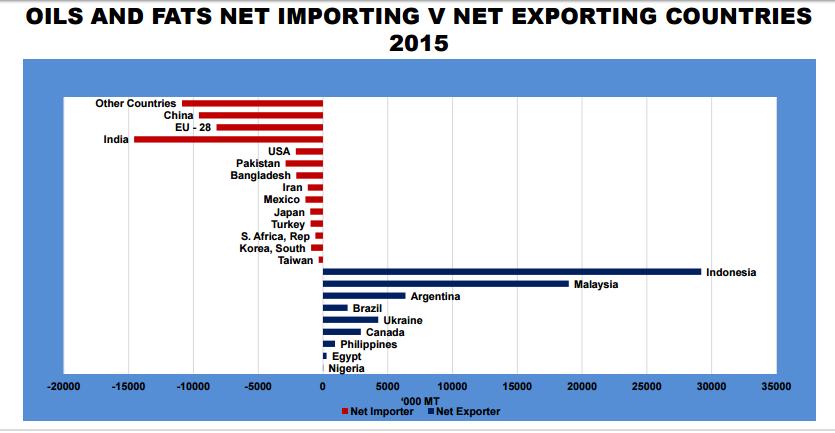
21 M t World Exports trend of Palm Oil 47.8 World Indonesia Malaysia Total trade in palm oil and palm kernel oil is over 47 million tonnes, imported and exported. ( 000 t) 30,000 25,000 20,000 15,000 10,000 25,900 Top Exports - Palm Oil ,454 5,000 0 Indonesia Malaysia Papua New Guinea Guatemala Honduras Colombia Côte D'ivoire Thailand SOURCE: MPOB Major exporters of palm oil include Indonesia and Malaysia, who exported 25.9 and 17.5 million tonnes in 2015, respectively. 21

22 ( 000 t) 10,000 9,530 9,000 8,000 7,000 6,000 5,000 4,000 3,000 2,000 1, ,330 Top Imports - Palm Oil ,930 2,730 1,450 1,440 1,140 1, SOURCE: MPOB Key importing economies include India, EU, and China, who imported 9.5 million, 7.3 million and 5.9 million tonnes respectively. Percentage Share of Palm Oil Exports In 2015, total exports of palm oil was estimated at million tonnes, with Malaysia and Indonesia accounting for more than 90.1 percent of the world total. Others 50% Percentage Share of Palm oil Exports, 2015 India 20% EU 15% Indonesia and Malaysia each exported about 25.9 million tonnes and 17.5 million tonnes respectively. SOURCE: MPOB Malaysia 2% China, P.R 13% 22
23 MALAYSIA S PALM OIL INDUSTRY Exports of Palm Oil, ,500 43,000 42,500 42,000 41,500 41,000 40,500 40,000 39,500 39,000 38, Volume ('000 tonnes) Value (RM million) 17,000 16,900 16,800 16,700 16,600 16,500 16,400 16,300 23


24 Exports of Crude and Processed Palm Oil, ,000,000 12,000,000 10,000,000 8,000,000 6,000,000 4,000,000 2,000,000 0 Crude Oil Palm Processed Oil Palm Crude Palm Kernel Oil Processed Palm Kernel Oil Palm Kernel Cake Imports of Crude and Processed Palm Oil, , , , , , , , , , , ,000 Crude Oil Palm Processed Oil Palm 24
25 Malaysia s Palm Oil Industry Looking from the world s total oilseed area of 233 million, Malaysian oil palm accounted for the least. Yet, Malaysia was able to supply 10 per cent of the global vegetable oil and 26 per cent of the export trade in oil and fats. In fact Malaysian palm oil production is only the second largest production in the world. ECONOMIC IMPACT ON THE MALAYSIAN ECONOMY: CHANGE IN OIL & FATS EXPORT AND EXCHANGE RATE 25
26 1. CHANGE IN PALM OIL EXPORT Change in Malaysia Total Oil and Fats Export (RM 000) On 2010, Malaysia total export for Oil and Fats are 51,716,691, if : 1% = 517,166 5% = 2,585,834 10% = 5,171,669 26
27 Commodity Commodity ABSORPTION MATRIX OF DOMESTIC PRODUCTION AT BASIC PRICES, COMMODITY x 124 COMMODITY (RM'000) Top 25 Sectors for 1% ( Rank by Output) Total Output Economic Impact (RM) Total Gross Value Added Economic Impact (RM) Total Income Economic Impact (RM) Total Employment Economic Impact (RM) Commodity Oils and Fats ,690 45,756 16, Oil Palm 6 319, ,378 43,135 1,844 Wholesale & Retail Trade and Motor Vehicle 93 95,113 53,131 14, Financial Institution ,273 12,350 4, Petroleum Refinery 44 13,677 3, Crude Oil and Natural Gas 13 12,403 10, Basic Chemicals 45 12,076 3, Other Financial Institution ,067 5,154 2, Land Transport 96 11,654 4,170 1, Professional 115 9,839 6,167 2, Banks 107 8,904 5,387 2, Electricity and Gas 86 8,072 3, Fertilizers 46 7,887 1, Real Estate 111 6,797 3, Telecommunications 104 6,677 2, Other Transport Services 99 4,863 1, Special Trade Works 92 3,778 1, Business Services 116 3,765 1, Other Chemicals Product 50 3, Highway, Bridge and Tunnel Operation Services 101 2,855 2, Motor Vehicles 80 2, Restaurants 95 2,643 1, Plastics Products 55 2, Other Manufacturing 84 2,341 1, Paper and Paper Products and Furniture 41 2, Others 30,889 10,960 3, ,375, ,306 96,108 4,109 ABSORPTION MATRIX OF DOMESTIC PRODUCTION AT BASIC PRICES, COMMODITY x 124 COMMODITY (RM'000) Top 25 Sectors for 5% ( Rank by Output) Total Output Economic Impact (RM) Total Gross Value Added Economic Impact (RM) Total Income Economic Impact (RM) Total Employment Economic Impact (RM) Commodity Oils and Fats 21 3,748, ,783 80,830 3,455 Oil Palm 6 1,598,149 1,196, ,676 9,220 Wholesale & Retail Trade and Motor Vehicle , ,653 71,763 3,068 Financial Institution ,365 61,750 22, Petroleum Refinery 44 68,385 15,001 1, Crude Oil and Natural Gas 13 62,017 52,049 2, Basic Chemicals 45 60,378 15,484 2, Other Financial Institution ,335 25,772 11, Land Transport 96 58,272 20,852 5, Professional ,194 30,837 11, Banks ,522 26,935 10, Electricity and Gas 86 40,360 17,120 1, Fertilizers 46 39,433 8,580 2, Real Estate ,987 16,552 4, Telecommunications ,384 10,888 1, Other Transport Services 99 24,315 5,495 2, Special Trade Works 92 18,889 5,140 3, Business Services ,826 8,178 2, Other Chemicals Product 50 15,842 2, Highway, Bridge and Tunnel Operation Services ,276 10,609 2, Motor Vehicles 80 13,360 1, Restaurants 95 13,216 5,312 2, Plastics Products 55 12,363 1,984 1, Other Manufacturing 84 11,704 5,261 1, Paper and Paper Products and Furniture 41 11,661 2, Others 154,447 54,799 15, ,877,702 2,096, ,542 20,543 27
28 Top 25 Sectors for 10% ( Rank by Output) ABSORPTION MATRIX OF DOMESTIC PRODUCTION AT BASIC PRICES, COMMODITY x 124 COMMODITY (RM'000) Total Output Commodity Economic Impact (RM) Total Gross Value Added Economic Impact (RM) Total Income Economic Impact (RM) Total Employment Economic Impact (RM) Commodity Oils and Fats 21 7,496, , ,661 6,911 Oil Palm 6 3,196,298 2,393, ,352 18,440 Wholesale & Retail Trade and Motor Vehicle , , ,527 6,136 Financial Institution , ,500 45,165 1,931 Petroleum Refinery ,770 30,001 3, Crude Oil and Natural Gas , ,099 5, Basic Chemicals ,755 30,968 5, Other Financial Institution ,671 51,545 22, Land Transport ,545 41,704 11, Professional ,387 61,673 23,602 1,009 Banks ,045 53,870 21, Electricity and Gas 86 80,719 34,241 2, Fertilizers 46 78,866 17,159 4, Real Estate ,974 33,104 8, Telecommunications ,769 21,776 3, Other Transport Services 99 48,631 10,991 4, Special Trade Works 92 37,779 10,280 7, Business Services ,653 16,356 4, Other Chemicals Product 50 31,683 4, Highway, Bridge and Tunnel Operation Services ,551 21,219 4, Motor Vehicles 80 26,719 3, Restaurants 95 26,432 10,624 4, Plastics Products 55 24,726 3,967 2, Other Manufacturing 84 23,407 10,522 3, Paper and Paper Products and Furniture 41 23,323 5,813 1, Others 308, ,597 31,003 1,325 13,755,407 4,193, ,085 41,086 Economic Impact due to Change in Malaysian Oil and Fats Export by 1%, 5% & 10% TOTAL ECONOMIC Impact Total Output (RM 000) 1% 5% 10% 1,375, ,877, ,755, Income (RM 000) 96, , , Employment (Person) Gross Value Added (RM 000) 4,109 20,543 41, , ,096, ,193,

29 Impact of Oil and Fats Export by 1%, 5% & 10% (RM 000) 14,000, ,000, ,000, ,000, ,000, ,000, ,000, Total Output Income Employment Gross Value Added 1% 1,375, , , , % 6,877, , , ,096, % 13,755, , , ,193, Note; Employment in person 1% 5% 10% 2. CHANGE OF EXCHANGE RATE (US/RM) AND PALM OIL EXPORT Net Total Export 26.49% = RM13,699,

30 Malaysia Exports of Palm Oil (million tonnes) Total exports of palm oil and palm kernel oil is over 25 million tonnes in
31 Commodity Percentage Change Rate (US/RM) (Base year 1990) Year \ Items Change in Exchange Rate (US/RM) % Change in palm oil export(%) Net (%) (40.51) (4.36) 2005 (40.03) (19.11) (44.41) ABSORPTION MATRIX OF DOMESTIC PRODUCTION AT BASIC PRICES, COMMODITY x 124 COMMODITY (RM'000) Top 25 Sectors ( Rank by Output) Total Output Economic Impact (RM) Total Gross Value Added Economic Impact (RM) Total Income Economic Impact (RM) Total Employment Economic Impact (RM) Commodity Oils and Fats 21 19,859,317 1,212, ,239 18,307 1 Oil Palm 6 8,466,994 6,341,134 1,142,650 48,848 2 Wholesale & Retail Trade and Motor Vehicle 93 2,519,554 1,407, ,203 16,254 3 Financial Institution 108 1,040, , ,643 5,115 4 Petroleum Refinery ,305 79,474 9, Crude Oil and Natural Gas , ,758 14, Basic Chemicals ,881 82,035 14, Other Financial Institution , ,542 59,988 2,564 8 Land Transport , ,475 30,864 1,319 9 Professional , ,372 62,522 2, Banks , ,703 55,762 2, Electricity and Gas ,825 90,704 6, Fertilizers ,917 45,455 11, Real Estate ,063 87,692 23, Telecommunications ,870 57,684 10, Other Transport Services ,823 29,115 11, Special Trade Works ,076 27,233 19, Business Services ,742 43,326 13, Other Chemicals Product 50 83,929 11,283 1, Highway, Bridge and Tunnel Operation Services ,632 56,209 12, Motor Vehicles 80 70,780 8,319 2, Restaurants 95 70,018 28,143 11, Plastics Products 55 65,499 10,509 7, Other Manufacturing 84 62,006 27,872 10, Paper and Paper Products and Furniture 41 61,781 15,399 4, Others 818, ,324 82,127 3, ,438,072 11,107,432 2,545, ,838 Rank 31

32 Total Economic Impact due to Change in Palm Oil Net Export (26.49%) (RM 000) TOTAL ECONOMIC IMPACT Total Output (RM'000) 36,438, Income 2,545, Employment 108,838 Gross Value Added 11,107, ,000,000 35,000,000 30,000,000 25,000,000 20,000,000 15,000,000 10,000,000 5,000, ,438, ,545, , ,107, Total Output Income Employment Gross Value Added 1% Conclusion Currently The World Economic Outlook for the global economy is gradually improved a little bit after a major setback during 2011 for temporary measure in the euro area financial policy and with improved economic activity in the United States. However, recent improvements are very fragile. Policymakers must calibrate policies to support growth in the near term and must implement fundamental changes to achieve healthy growth in the medium term. Based on the Global Commodity Market Outlook the Agriculture Sector prices are expected to slow down for about 19%. Using this Global Commodity Market Outlook, the Malaysian palm oil export values is not being exempted. The net percentage change for the exchange rate (US\RM) and the total export is estimated net gain by 26.49%. On that note, the total economic impact is expected to increased Total Output by RM36.4 billion, Household Income by RM2.5 billion, Gross Value Added by RM11.1 billion and created 108,838 employment. 32

33 Dr Ahmad Fauzi Puasa Deputy MIER Thank You 33
Dr Ahmad Fauzi Puasa Deputy Director, Malaysia Institute Economic Research Kuala Lumpur Maritime Park & Spa Resort, Krabi, Thailand 29 August, 2013
 ASIA PALM OIL CONFERENCE (APOC) 2013: INNOVATING THAILAND S PALM OIL INDUSTRY World Economic Uncertainty Affect the World Palm Oil Industry Dr Ahmad Fauzi Puasa Deputy Director, Malaysia Institute Economic
Oilseeds and Products
 Oilseeds and Products Oilseeds compete with major grains for area. As a result, weather impacts soybeans, rapeseed, and sunflowerseed similarly to grain and other crops grown in the same regions. The same
Soybean Trade Growth: A Story of Brazil, the United States, and China
 United States Department of Agriculture Foreign Agricultural Service October 2017 Soybean Trade Growth: A Story of Brazil, the United States, and China 12-Month Soybean Export Growth Year Ending September
316 / World Biofuels: FAPRI 2009 Agricultural Outlook. World Ethanol
 WORLD BIOFUELS 316 / World Biofuels: FAPRI 2009 Agricultural Outlook World The world ethanol price increased 13.7% in 2008, to $1.76 per gallon. It is projected to decrease by almost 16%, to $1.48 per
MONTHLY REPORTS PALM OIL JUNE - JULY 2016
 MONTHLY REPORTS PALM OIL Monthly Prices Movement Palm Oil prices traded mixed with both negative and positive sentiments throughout the month amid volatility in Indian Rupee, Ringgit, weak exports and
Oilseeds and Products
 Oilseeds and Products Oilseeds compete with major grains for area. As a result, weather impacts soybeans, rapeseed, and sunflowerseed similarly to the grain and other crops grown in the same regions. The
Weak Real to Boost Brazil s Soybean Exports in 2016
 United States Department of Agriculture Foreign Agricultural Service October 2015 Weak Real to Boost Brazil s Soybean Exports in 2016 Brazil s exchange rate is having a significant impact on domestic and
FAPRI Food and Agricultural Policy Research Institute
 26 WORLD OUTLOOK Presentation Food and Agricultural Policy Research Institute Global Macroeconomic Overview Sustained and widespread real economic growth for the decade averaging 3.1%. Industrialized countries
Indian Soybean Meal Exports Unlikely to Recover in 2015/16
 United States Department of Agriculture Foreign Agricultural Service November 2015 Indian Soybean Meal Exports Unlikely to Recover in Though once a significant regional exporter of soybean meal, India
Share of Brazil s Soybean Exports to China Spikes in August
 United States Department of Agriculture Foreign Agricultural Service September 2018 Share of Brazil s Soybean Exports to China Spikes in August Monthly Share of Brazil's Soybean Exports to China 85% 75%
China Soybean Imports Stagnant Despite Record Consumption as Production Rebounds
 United States Department of Agriculture Foreign Agricultural Service Circular Series FOP 9-08 tember 2008 China Soybean Stagnant Despite Record Consumption as Rebounds Million Tons 60 50 40 30 20 10 0
THIS REPORT CONTAINS ASSESSMENTS OF COMMODITY AND TRADE ISSUES MADE BY USDA STAFF AND NOT NECESSARILY STATEMENTS OF OFFICIAL U.S.
 THIS REPORT CONTAINS ASSESSMENTS OF COMMODITY AND TRADE ISSUES MADE BY USDA STAFF AND NOT NECESSARILY STATEMENTS OF OFFICIAL U.S. GOVERNMENT POLICY Required Report - public distribution Date: GAIN Report
Drought in South America to Limit Soybean Exports
 United States Department of Agriculture Foreign Agricultural Service Circular Series FOP 2-09 ruary 2009 Drought in South America to Limit Soybean Exports Million Tons 16 14 12 10 8 6 4 2 Annual Change
Coconut Oil Prices Spike
 United States Department of Agriculture Foreign Agricultural Service Coconut Oil Prices Spike Coconut oil prices have surged over the past year in contrast to the general downward trend in other vegetable
Soybean Oil Prices Diverge on Different Supply Situations
 United States Department of Agriculture Foreign Agricultural Service Circular Series FOP 10-09 October 2009 Soybean Oil Prices Diverge on Different Supply Situations Soybean Oil Price ($/ton) $900 $850
Sharp Decline in Vegetable Oil Stocks Leads to Steeply Higher Prices
 United States Department of Agriculture Foreign Agricultural Service Circular Series FOP 1-11 Sharp Decline in Vegetable Oil Leads to Steeply Higher Prices Commodity prices have been on an upward trend
Argentine Exporters Switch to Soybean Oil as Biodiesel Exports Fall
 United States Department of Agriculture Foreign Agricultural Service Circular Series FOP 08-13 Argentine Exporters Switch to Soybean Oil as Biodiesel Exports Fall Argentina s soybean oil exports have surged
Growing Soybean Oil Price Raises Oil s Contribution to Total Soybean Value
 United States Department of Agriculture Foreign Agricultural Service Circular Series FOP 10-07 October 2007 Growing Soybean Oil Price Raises Oil s Contribution to Total Soybean Value Relative Share Value:
USDA Projections of Bioenergy-Related Corn and Soyoil Use for
 USDA Projections of Bioenergy-Related Corn and Soyoil Use for 2010-2019 Daniel M. O Brien, Extension Agricultural Economist K-State Research and Extension The United States Department of Agriculture released
As China s Soybean Oil Imports Fall, Production Expands
 United States Department of Agriculture Foreign Agricultural Service Circular Series FOP 10-10 October 2010 As China s Soybean Oil Fall, Expands 12 10 Million Metric Tons 8 6 4 2 0 2006/07 2007/08 China
Mid-term Outlook for World Agricultural Markets
 Mid-term Outlook for World Agricultural Markets Jacinto Fabiosa Co-Director, (515) 294-6183 jfabiosa@iastate.edu Food and Agricultural Policy Research Institute The Question of Interest? In 27 we asked,
Devaluation Energizes Argentine Soybean Crush
 United States Department of Agriculture Foreign Agricultural Service March 2016 Devaluation Energizes Argentine Soybean Crush Argentina Quarterly Soybean Crush Volume Exchange Rate* and Constant Dollar
Pakistan Oilseed Processors Seize Opportunity to Crush Soybeans
 United States Department of Agriculture Foreign Agricultural Service December 2015 Pakistan Oilseed Processors Seize Opportunity to Crush Soybeans Pakistan, long an importer of soybean meal, is transitioning
Eastern Europe: The Untapped and Potential Growth Markets for Malaysian Palm Oil
 Palm Oil Economic Review and Outlook Seminar 2017 Pullman Kuala Lumpur City Centre, Kuala Lumpur 17 January 2017 Eastern Europe: The Untapped and Potential Growth Markets for Malaysian Palm Oil Puah Chiew
China s Global Peanut Export Share Declines
 United States Department of Agriculture Foreign Agricultural Service Circular Series FOP 07-13 China s Global Peanut Export Share Declines U.S. 10% Others 19% Argentina 17% U.S. 11% Others 16% Argentina
Early-Season U.S. Soybean Meal Sales Surge
 United States Department of Agriculture Foreign Agricultural Service November 2014 Early-Season U.S. Soybean Meal Sales Surge U.S. soybean meal export commitments (accumulated exports plus outstanding
World Geographic Shares
 World Geographic Shares North America South America Europe Africa Asia Australia/ Oceania 18% 13% 7% 22% 33% 6% World Population Shares North America South America Europe Africa Asia Australia/ Oceania
ECONOMIC SURVEY STATISTICAL APPENDIX
 ECONOMIC SURVEY 2017-18 STATISTICAL APPENDIX STATISTICAL APPENDIX : ECONOMIC SURVEY 2017-18 PAGE 1 National Income and Production 1.1 Gross National Income and Net National Income... A1-A2 1.2 Annual
Soybean and Oilseed Meal Import Prospects Higher as Severe Weather Damages EU Crops
 Million Tons Million Tons Million Tons United States Department of Agriculture Foreign Agricultural Service August 2018 Soybean and Oilseed Meal Import Prospects Higher as Severe Weather Damages EU Crops
Role of Oil Palm in Poverty Alleviation
 Role of Oil Palm in Poverty Alleviation Zulkifli Alamsyah Agribusiness Department Faculty of Agriculture University of Jambi - Indonesia zalamsyah@unja,ac,id Presented in the Twentyfirst Session of the
U.S. Soybean Exports Forecast to Reach Record
 United States Department of Agriculture Foreign Agricultural Service July 2017 U.S. Soybean Exports Forecast to Reach Record 60 Accumulated Exports by Week Total Commitments of Soybeans as of End of June
Lingering Effects of Truckers Strike Impact Planting Plans
 THIS REPORT CONTAINS ASSESSMENTS OF COMMODITY AND TRADE ISSUES MADE BY USDA STAFF AND NOT NECESSARILY STATEMENTS OF OFFICIAL U.S. GOVERNMENT POLICY Required Report - public distribution Brazil Post: Brasilia
CHARTS AND PRICE PROJECTIONS
 CHARTS AND PRICE PROJECTIONS 18 / Charts and Price Projections: FAPRI 28 Agricultural Outlook Average Annual GDP Growth, 27-217 Percent Change 1 8 8.4 7.92 6 4 4.44 3.67 4.6 4.34 2 2.37 2.17 1.38 2.44
China s Rapeseed Meal Imports Rise as Seed Imports Decline
 United States Department of Agriculture Foreign Agricultural Service February 2017 China s Rapeseed Meal Rise as Seed Decline Trend in China Rapeseed 12-Month Moving Totals Trend In China Rapeseed Meal
Indonesia Palm Oil Industry: Current Status and Outlook 2018
 Indonesia Palm Oil Industry: Current Status and Outlook 2018 M. Fadhil Hasan Director of Corporate Affairs Asian Agri Group Board Member of Indonesian Palm Oil Association (IPOA) Outline World palm oil
CHARTS AND PRICE PROJECTIONS
 CHARTS AND PRICE PROJECTIONS 18 / Charts and Price Projections: FAPRI 27 Agricultural Outlook Average Annual GDP Growth Percent Change 9 8 7 6 4 3 2 1 26-216 Canada China EU NMS EU- India Japan Latin America
Sunflower Oil Imports Increase for Ration Card Program
 THIS REPORT CONTAINS ASSESSMENTS OF COMMODITY AND TRADE ISSUES MADE BY USDA STAFF AND NOT NECESSARILY STATEMENTS OF OFFICIAL U.S. GOVERNMENT POLICY Required Report - public distribution Date: GAIN Report
U.S. Soybeans Facing Stiff Competition from Brazil. Brazil Soybean Export Price (Dollars and Reals) and Exchange Rate
 and Exchange Rate") United States Department of Agriculture Foreign Agricultural Service June, 2018 U.S. Soybeans Facing Stiff Competition from Brazil Brazil Soybean Export Price (Dollars and Reals) and Exchange Rate FOB
United States Department of Agriculture Foreign Agricultural Service June, 2018 U.S. Soybeans Facing Stiff Competition from Brazil Brazil Soybean Export Price (Dollars and Reals) and Exchange Rate FOB
FAPRI 2006 Preliminary Baseline December 15-16, 2005
 FAPRI 26 Preliminary Baseline December 15-16, 25 INTERNATIONAL OILSEEDS Tun-Hsiang (Edward) Yu 515-294-815 edyucard@iastate.edu FAPRI Food and Agricultural Policy Research Institute Center for Agricultural
India. Oilseeds and Products Update. February 2012
 THIS REPORT CONTAINS ASSESSMENTS OF COMMODITY AND TRADE ISSUES MADE BY STAFF AND NOT NECESSARILY STATEMENTS OF OFFICIAL U.S. GOVERNMENT POLICY Required Report - public distribution India Oilseeds and Products
2016/17 Global Olive Oil Production Down But Prices Stabilize
 United States Department of Agriculture Foreign Agricultural Service November 2016 Global Olive Oil Down But Prices Stabilize Global Olive Oil and Stocks 4000 3500 5000 Extra Virgin Olive Oil Prices Stabilizing
THIS REPORT CONTAINS ASSESSMENTS OF COMMODITY AND TRADE ISSUES MADE BY USDA STAFF AND NOT NECESSARILY STATEMENTS OF OFFICIAL U.S.
 THIS REPORT CONTAINS ASSESSMENTS OF COMMODITY AND TRADE ISSUES MADE BY USDA STAFF AND NOT NECESSARILY STATEMENTS OF OFFICIAL U.S. GOVERNMENT POLICY Required Report - public distribution Oilseeds and Products
China Tariffs Driving U.S. Soybean Exports To the European Union to a 30-Year High
 United States Department of Agriculture Foreign Agricultural Service March 2019 China Tariffs Driving U.S. Soybean Exports To the European Union to a 30-Year High 12-MONTH MOVING TOTAL U.S. SOYBEAN EXPORTS
India Soybean Meal Exports: Revised and Rebounding
 United States Department of Agriculture Foreign Agricultural Service January 2017 India Soybean Meal Exports: Revised and Rebounding India Soybean Meal Exports Forecast to Rise in 8.0 Data Series Comparison
Macroeconomic Assumptions
 Macroeconomic Assumptions A major factor affecting the global economy this year continues to be weakness in Chinese financial markets and the resulting fallout affecting trading partners dependent on the
Brazil s Soybean Oil Exports Squeezed by Rising Biodiesel Demand
 United States Department of Agriculture Foreign Agricultural Service Circular Series FOP 6-09 e 2009 Brazil s Soybean Oil Exports Squeezed by Rising Biodiesel Demand Soybean Oil Exports and Industrial
Growing Fuel Use Limits Exports of Soybean Oil by South America
 United States Department of Agriculture Foreign Agricultural Service Circular Series FOP 11-09 ember 2009 Growing Fuel Use Limits of Soybean Oil by South America 2006/07 Soybean Oil Distribution Soybean
Monthly Economic Letter
 Monthly Economic Letter Cotton Market Fundamentals & Price Outlook RECENT PRICE MOVEMENT Benchmark prices were flat or slightly higher over the past month. Prices for the May NY futures contract increased
U.S. Soybean Prices Fall as Buyers Focus Turns to South America
 United States Department of Agriculture Foreign Agricultural Service Circular Series FOP 2-10 ruary 2010 U.S. Soybean Prices Fall as Buyers Focus Turns to South America $11.00 Daily U.S. Soybean Cash Price
Palm and Soy Oil Use Expands at Expense of Other Oils
 United States Department of Agriculture Foreign Agricultural Service September 2015 Revised on September 15, 2015 Palm and Soy Oil Use Expands at Expense of Other Oils As global demand for vegetable oil
Corn Outlook. David Miller Director of Research & Commodity Services Iowa Farm Bureau Federation December 2013
 Corn Outlook David Miller Director of Research & Commodity Services Iowa Farm Bureau Federation December 2013 Source: USDA-WAOB U.S. Corn Supply & Usage U.S. Corn Supply & Usage Comments With the largest
2017/18 Olive Oil Export Forecast Rises with Slight Growth in Production
 United States Department of Agriculture Foreign Agricultural Service November 2017 Olive Oil Export Forecast Rises with Slight Growth in Production Million Metric Tons 3.4 3.2 3.0 2.8 2.6 Olive Oil Prices
Oil palm and the world market for oil crops
 Oil palm and the world market for oil crops Presentation by Dr. James Fry, Chairman, LMC International, Oxford, UK Outline of my presentation today I start by reminding you how oil palm enabled the world
THIS REPORT CONTAINS ASSESSMENTS OF COMMODITY AND TRADE ISSUES MADE BY USDA STAFF AND NOT NECESSARILY STATEMENTS OF OFFICIAL U.S.
 THIS REPORT CONTAINS ASSESSMENTS OF COMMODITY AND TRADE ISSUES MADE BY STAFF AND NOT NECESSARILY STATEMENTS OF OFFICIAL U.S. GOVERNMENT POLICY Required Report - public distribution Indonesia Oilseeds and
Corn & Bean Producers-1
 Largest Corn Producing Countries - 2016 est. Largest Corn Importing Countries - 2016 est. (Marketing year - thousands of hectares, tons per hectare, and thousands of metric tons) (Marketing year - thousands
Drought Forecast to Reduce Australian Rapeseed Exports in 2007
 United States Department of Agriculture Foreign Agricultural Service Circular Series FOP 11-06 November 2006 Drought Forecast to Reduce Australian Rapeseed Exports in 2007 1800 1600 1400 1200 1000 800
Baseline Update for International Livestock Markets
 Baseline Update for International Livestock Markets September 2018 FAPRI-MU Report #04-18 www.fapri.missouri.edu Published by the Food and Agricultural Policy Research Institute (FAPRI) at the University
Regional Vegetable Oil Situation: Cut in Sun Oil Production, Imports Leaves North Africa & the Middle East Looking for Soy & Palm Oil to Fill Demand
 United States Department of Agriculture Foreign Agricultural Service Circular Series FOP 09-07 tember 2007 Regional Vegetable Oil Situation: Cut in Sun Oil, Leaves North Africa & the Middle East Looking
Highlight. 27 May Rubber prices keep falling. Shall we switch to oil palm?
 Rubber prices keep falling. Shall we switch to oil palm? 27 May 215 Highlight Recent news of farmers switching crops from rubber to palm trees leads to questions about whether Thai palm oil products are
CPO Supporting Fund and Its Impact On Indonesian Palm Oil Market. Fadhil Hasan Indonesian Palm Oil Association
 CPO Supporting Fund and Its Impact On Indonesian Palm Oil ket Fadhil Hasan Indonesian Palm Oil Association Background There are several reasons the government imposes the new levy imposed on CPO and its
Explosive Growth in Vegetable Oil Demand Exacerbates Chinese Supply Deficit, Reliance on Imports. Imports
 United States Department of Agriculture Foreign Agricultural Service Circular Series FOP 12-07 ember 2007 Million tons 35 Explosive Growth in Vegetable Oil Demand Exacerbates Chinese Supply Deficit, Reliance
Monthly Economic Letter
 Monthly Economic Letter Cotton Market Fundamentals & Price Outlook RECENT PRICE MOVEMENT Global cotton prices were mostly stable over the past month, with NY futures, the A Index, and the CC Index virtually
Bangladesh: A Growing Market for U.S. Soybeans
 United States Department of Agriculture Foreign Agricultural Service December 2017 Bangladesh: A Growing Market for U.S. Soybeans 100% 310 3 Meal Equivalent Share 90% 80% 70% 60% 50% 40% 30% 20% 10% Animal
Monthly Economic Letter
 Monthly Economic Letter Cotton Market Fundamentals & Price Outlook RECENT PRICE MOVEMENT NY futures experienced volatility in early April. Current values for all benchmark prices are flat to lower relative
EL NINO AND PALM OIL PRODUCTION supply shock in the making?
 EL NINO AND PALM OIL PRODUCTION supply shock in the making? BY A.H.LING GANLING SDN BHD EL NINO 2014 - EFFECTS AND IMPLICATION, JUNE 1 TODAY S TALK 1. Palm oil supply dynamics and future growth trend 2.
Record U.S. Peanut Exports on Strong Shipments to China and Vietnam
 United States Department of Agriculture Foreign Agricultural Service September 2016 Record U.S. Peanut Exports on Strong Shipments to China and Vietnam Thousand Metric Tons 800 700 600 500 400 300 200
China is Key to Slow Pace of U.S. Soybean Exports
 United States Department of Agriculture Foreign Agricultural Service January 2018 China is Key to Slow Pace of U.S. Soybean Exports U.S. and Brazil Soybean Exports by Destination (Accumulated Exports:
DEMAND SCENARIOS Palm Oil Consumption Growth Major Consuming Countries Iran s Consumption Trend
 1 By: Msuhaili MPOC DEMAND SCENARIOS Palm Oil Consumption Growth Major Consuming Countries Iran s Consumption Trend MARKET TRENDS AND DRIVERS Palm oil price discount advantage High Productivity: A Favourable
Rising Coconut Oil Prices Foreshadow Tight Supplies in 2007
 United States Department of Agriculture Foreign Agricultural Service Circular Series FOP 2-07 ruary 2007 Rising Coconut Oil Prices Foreshadow Tight Supplies in 2007 800 Coconut Oil Price: CIF Rotterdam
Palm Oil the Leader in Global Oils & Fats Supply
 Palm Oil the Leader in Global Oils & Fats Supply Presentation at the Malaysia / Myanmar Palm Oil Trade Fair & Seminar in Yangon on June, 13 there somebody to pick me up tomorrow at the airport Thomas Mielke,
Manitoba Economic Highlights
 Economic Overview Real Gross Domestic Product The Manitoba Bureau of Statistics estimates that Manitoba s real GDP grew 1.9% in 2016, above the national average of 1.4%. Manitoba s real GDP is expected
Monthly Economic Letter
 Monthly Economic Letter Cotton Market Fundamentals & Price Outlook RECENT PRICE MOVEMENT Most cotton prices were stable over the past month. Chinese prices moved slightly higher. Indian prices moved slightly
Cambodia. East Asia: Testing Times Ahead
 Key Indicators Cambodia 68 East Asia: Testing Times Ahead 2002 2003 2004 2005 2006 2007 /e 2008 /p 2009 /p Year Year Year Year Year Year Year Year Real GDP (% change, previous year) 6.5 8.5 10.0 13.5 10.8
Citrus: World Markets and Trade
 United States Department of Agriculture Foreign Agricultural Service y 2018 Citrus: World Markets and Trade Oranges Global orange production for is forecast to tumble 6.0 million metric tons (tons) from
Motion Control Market Update
 Motion Control Market Update Alex Shikany MCA Director of Market Analysis February 20-22, 2013 Orlando World Marriott Center Orlando, Florida USA Table of Contents I. World Economic Drivers II. Global
QUARTERLY REVIEW OF BUSINESS CONDITIONS: MOTOR VEHICLE MANUFACTURING INDUSTRY / AUTOMOTIVE SECTOR: 4 TH QUARTER 2016
 NATIONAL ASSOCIATION OF AUTOMOBILE MANUFACTURERS OF SOUTH AFRICA GROUND FLOOR, BUILDING F ALENTI OFFICE PARK 457 WITHERITE ROAD, THE WILLOWS, X82 PRETORIA PO BOX 40611, ARCADIA 0007 TELEPHONE: (012) 807-0152
Strong Brazilian Soybean Sales Expected to Slow Rebound in Argentine Exports
 United States Department of Agriculture Foreign Agricultural Service December 2018 Strong Brazilian Soybean Sales Expected to Slow Rebound in Argentine Exports Oct. 1 - Nov. 30 Brazil Soybean Exports (Million
Soybean Prices Fall on Rising South American Production
 United States Department of Agriculture Foreign Agricultural Service April 2017 Soybean Prices Fall on Rising South American Production Million Tons Change in South America Soybean Production Forecast
RSPO. PALMEX THAILAND. 8-9 September 2011 Sustainable Palm oil and the Environment
 www.rspo.org PALMEX THAILAND 8-9 September 2011 Sustainable Palm oil and the Environment By: Salahudin Yaacob, Technical Director on behalf of Darrel Webber, Secretary General of RSPO CONTENT Palm oil
FAPRI 2006 Preliminary Baseline December 15-16, 2005
 FAPRI 26 Preliminary Baseline December 15-16, 25 INTERNATIONAL DAIRY FAPRI Food and Agricultural Policy Research Institute Fengxia Dong (515) 294-47 fdong@iastate.edu Center for Agricultural and Rural
STATISTICAL ANNEX NOTE ON QUARTERLY PROJECTIONS
 OECD Economic Outlook, Volume 2017 Issue 1 OECD 2017 This annex contains data on key economic series which provide a background to the recent economic developments in the OECD area described in the main
China 2017/18 Soybean Imports Soar on Appetite for Pork, Aquaculture, and Dairy
 United States Department of Agriculture Foreign Agricultural Service June 2017 China Soybean Soar on Appetite for Pork, Aquaculture, and Dairy China: Booming Farmed Aquaculture Production China: Record
Citrus: World Markets and Trade
 United States Department of Agriculture Foreign Agricultural Service July 2015 Citrus: World Markets and Trade Oranges Global orange production for is estimated to decline 7 percent from the previous year
AOF Forum Oilseeds Outlook October, 2006
 AOF Forum Oilseeds Outlook October, 2006 Josh Roberts Senior Trading Manager Grain Pool Pty Ltd 30 Delhi Street West Perth Tel: +61 8 9237 9859 josh.roberts@grainpool.com.au Oilseeds trends versus other
2018 Outlook for Grains and Oilseeds
 2018 Outlook for Grains and Oilseeds Present to the American Fats and Oils Associa;on October 2017 AdvancedEconomicSolu0ons US$ Declines from Peak - Now at lowest point since October 2015 Currently in
World Wheat Supply and Demand Situation October 2018
 World Wheat Supply and Demand Situation October 218 Major data source: USDA World Agricultural Supply and Demand Estimates released October 12, 218. Projections will change over the course of the year
Annual Report on National Accounts for 2015 (Benchmark Year Revision of 2011) Summary (Flow Accounts)
 Summary (Flow Accounts)") Annual Report on National Accounts for 2015 (Benchmark Year Revision of 2011) Summary (Flow Accounts) I. Overview of Benchmark Year Revision of 2011 P 2 II. Expenditure Series P 3 III. Income Series P
Annual Report on National Accounts for 2015 (Benchmark Year Revision of 2011) Summary (Flow Accounts) I. Overview of Benchmark Year Revision of 2011 P 2 II. Expenditure Series P 3 III. Income Series P
CONTRIBUTION OF THE BIODIESEL INDUSTRY TO THE ECONOMY OF THE UNITED STATES
 CONTRIBUTION OF THE BIODIESEL INDUSTRY TO THE ECONOMY OF THE UNITED STATES Prepared for the National Biodiesel Board With Funding Support from the United Soybean Board 1 John M. Urbanchuk Director LECG,
World Wheat Supply and Demand Situation August 2018
 World Wheat Supply and Demand Situation August 218 Major data source: USDA World Agricultural Supply and Demand Estimates released August 1, 218. Projections will change over the course of the year depending
Indian engineering TRANSFORMING TRANSMISSION
 Indian engineering TRANSFORMING TRANSMISSION A 2016 NASA photo of India s electrification. India to become the world s first country to use LEDs for all its lighting needs by 2019 (photograph courtesy
Citrus: World Markets and Trade
 United States Department of Agriculture Foreign Agricultural Service uary 2015 Citrus: World Markets and Trade Oranges Global orange production for is forecast to decline 4 percent from the previous year
OECD FAO Agricultural Outlook
 OECD FAO Agricultural Outlook 2018 2027 ca 4. OILSEEDS AND OILSEED PRODUCTS Chapter 4. Oilseeds and oilseed products This chapter describes the market situation and highlights the latest set of quantitative
Monthly Economic Letter
 Monthly Economic Letter Cotton Market Fundamentals & Price Outlook RECENT PRICE MOVEMENT The global cotton market was volatile over the past month, with values for most benchmark prices moving strongly
Economic and Commodity Market Outlook
 Economic and Commodity Market Outlook August 12, 2016 By Robert Coats, Ph.D. Professor Economics Department of Agricultural Economics and Agribusiness Division of Agriculture University of Arkansas System
Item
 Key Indicators for Asia and the Pacific 2009 POPULATION Total population a thousand; as of 1 July 295 305 316 328 340 353 366 380 394 409 420 432 444 457 470 483 496 510 524 Population density persons
Developments for Palm Oil in Global Market
 Developments for Palm Oil in Global Market American Palm Oil Council American Palm Oil Council US Regional Office for Malaysian Palm Oil Council (MPOC) Presentation Outline Global Oils & Fats Scenario
Citrus: World Markets and Trade
 United States Department of Agriculture Foreign Agricultural Service January 2017 Citrus: World Markets and Trade Oranges Global orange production for 2016/17 is forecast up 2.4 million metric tons from
VFB happening 24 maart The Connection to the world of Sustainable Tropical Agriculture
 VFB happening 24 maart 2018 The Connection to the world of Sustainable Tropical Agriculture Summary SIPEF group Company profile SIPEF group Palm oil in the world SIPEF group Expansion SIPEF group Financial
2017/18 Cotton Outlook
 217/1 Cotton Outlook 217 Ag Econ In service Training Dr. S. Aaron Smith, Assistant Professor, Department of Agricultural and Resource Economics, University of Tennessee https://ag.tennessee.edu/arec/pages/cropeconomics.aspx
Global Monthly February 2018
 Global Monthly February 18 3 1-year Treasury yields 1-year breakeven inflation rate 1 1 15 16 17 18 February 18 5 3 Global GDP growth Composite PMI (RHS) Index 56 5 5 1 5 1 13 1 15 16 17 18 3..5. 1.5 1.