Building a Database for Estimation of an Advanced Activity-Based Travel Model from the NHTS
|
|
|
- Alexia Knight
- 5 years ago
- Views:
Transcription


, Vladimir Livshits")
, Phoenix, AZ")

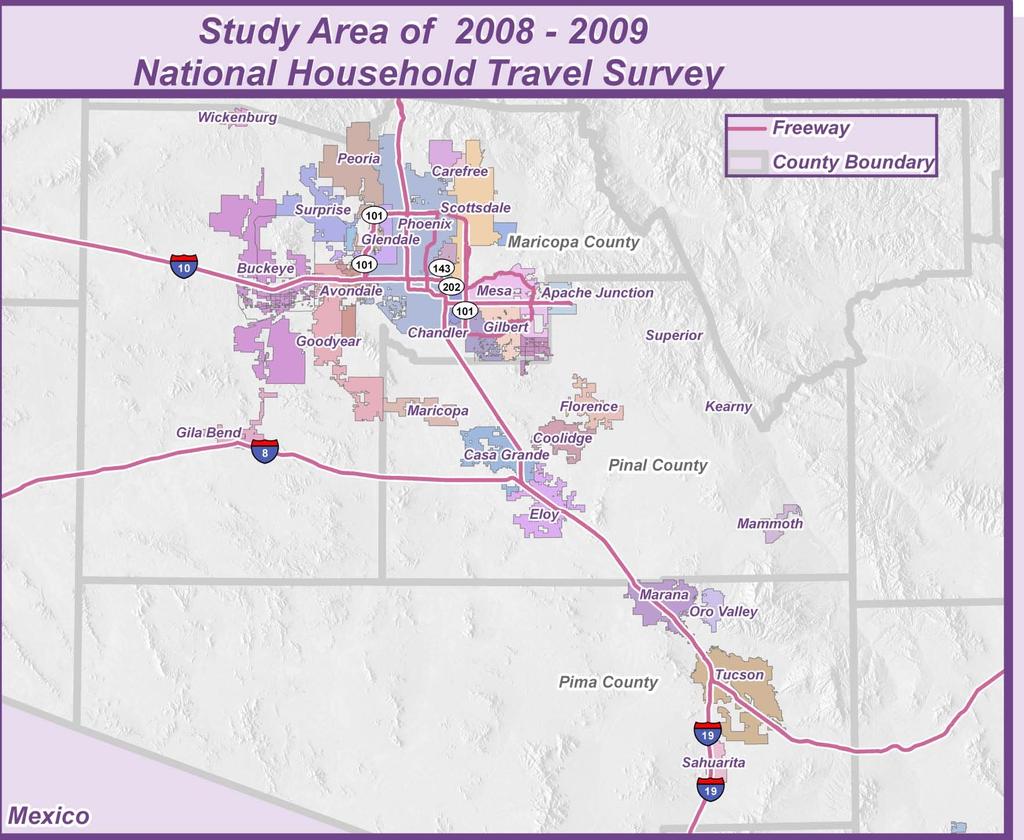
1 TRANSPORTATION PROGRAMS Building a Database for Estimation of an Advanced Activity-Based Travel Model from the NHTS Petya Maneva (Presenter), Vladimir Livshits Maricopa Association of Governments (MAG), Phoenix, AZ Aichong Sun (PAG), Tuscon, AZ Peter Vovsha, Surabhi Gupta Parsons Brinckerhoff, New York, NY
2 Page 2


3 Survey Time Line 7,068 HH, Single day Weekday Travel 5,067 HH (615 incomplete) 10,956 Persons 41,444 Trips Nov Sept. Mar-08 May-08 Jul-08 Sep-08 Nov-08 Apr-08 Jun-08 Aug-08 Oct-08 Dec-08 Oct. Jan-09 Mar-09 Feb-09 Page 3
 All Trips on")
4 Quality Checks: Half-Tour and Tour Mode Mode Which Trips? Half- Tour Mode Tour Mode Unknown Some Trips on Half-Tour Can Identify Can Identify All Trips on Half-Tour Can not identify From other half-tour (Symmetry) All Trips on Tour Can not identify Can not identify Known, Not Available Some or All Trips Not Available Not Available Page 4

5 Quality Check: Start/End at Home Completeness of tours in terms of starting and ending at home; the following cases are distinguished: Start/End Example Validity Remark Start not from Home End not at Home Trip from Airport/Outside of Region Missing previous Trip Trip to Airport/ Outside of Region Missing last trip Valid reason Invalid reason Valid reason Invalid reason Frequent Case Frequent Case Page 5
6 Quality Checks Consistency of time-related tour attributes Missing Departure / Arrival Trip Time Conflicting trip/activity time chain Arrival time before departure time Moving backward in daily schedule Unrealistic reported trip duration vs. modespecific skims from model Fullness of trip destination coding Missing/unknown destination zones Destination outside the modeled region (intercity trips) Page 6

7 Imputing Trips for Household Members under 5 Identify HH members age less than 5 Extract joint trips of other HH members with kids under 5 reported Is trip part of fully and partially joint tours? Fully Joint Tour same trip information Partially Joint Tour - identify drop off or pick up? Drop-off set destination purpose to school* Pick-up set origin purpose to school* Imputed Trips = 1,961, Tours = 828 Page 7
8 Joint Activities Consistency of reported joint activities Resolving data conflicts and creating a consistent entirehousehold pattern was developed and applied. Impute Trips for Adults Only for Fully Joint Tours No conflict of schedule with other reported trips 292 trips, 127 Tours imputed Page 8

9 Daily Tour Rate by Person Type AFTER SYNTHESIZING TRIPS Page 9
10 Logical checks Reconcile Trip Records with Land Use at Destination Jobs (for worker occupation) available in Work location TAZ? Workers are classified by 5 occupation categories Sales, marketing Clerical, administrative, retail, Production, construction, farming, transport Professional, managerial, technical Personal care or services Jobs in each TAZ are classified by 2-digit NAICS codes (26 categories) correspond to 5 occupation categories Students student type (k-8, high school, college) vs. enrollment Page 10
11 What Can Be Improved Sampling: Conduct interviews by cell phone and Internet Better represent respondents by age Better represent Hispanics Household Ethnicity 2008 NHTS Weighted 2008 ACS Hispanic 10.50% 30.87% White 77.50% 58.63% Black/African American 4.60% 4.10% American Indian 2.90% 1.86% Asian/Pacific Islander 1.10% 2.86% Other, Refused, etc. 3.40% 1.68% Page 11

12 Tours by Purpose & Aggregate Mode (MAG/PAG NHTS) Page 12

13 Completeness of Trip Records Page 13
14 Completeness of Tour Records 100% 95% 90% 85% 80% 75% MAG/PAG CMAP MTC ARC SANDAG 70% Valid Mode Closed Tour Valid Time Valid Primary Destination All Valid Symmetric Mode Page 14


15 Conclusions - MAG/PAG NHTS Survey Good quality overall: Reasonable trip & tour rates per person & HH comparable to other regions Validity and completeness of trip records at the level of other surveys or better Can be used for development of advanced ABM but requires processing & imputations Page 15
16 Thank you! Questions? Page 16
17 Good quality overall: Reasonable trip & tour rates per person & HH comparable to other regions Validity and completeness of trip records at the level of other surveys or better Can be used for development of advanced ABM but requires processing & imputations Lessons learned: Conclusions - MAG/PAG NHTS Survey Incomplete HHs with missing persons valid survey criteria Very small sample of transit users Children under 5 are not included Inconsistencies between joint travel records (GPS, automatic logic checks) Many problems can be fixed by subsequent manual quality control, analysis, complementary data collection and imputation Page 17
18 Reconcile Trip Records with Land Use at Destination Logical checks: Non-Mandatory trips by purpose Employment or Other Land Use Shopping Maintenance Eating Out Visiting Discretionary Retail Information Real Estate, Renting, Leasing Health Care, Social Assistance Arts, Entertainment Accommodation, Food Services Public Admin # Households Page 18
19 Daily Tour Rate by Person Type No Travel Reported for Children under 5 Page 19
20 Cross-Region Comparison SAN DIE GO (SANDAG) ATLANTA (ARC) BAY AREA (MTC) CHICAGO (CMAP) PHOENIX TUCSON (MAG/PAG) NHTS Survey Year #HHs 3,651 8,069 15,064 14,315 7,068 #Days Page 20
21 Reconcile Trip Records with Land Use at Destination Analysis of discrepancies & fixes (manual): Geocoding errors Problem with Land Use data Survey coding errors Worker job type Student type definition Page 21
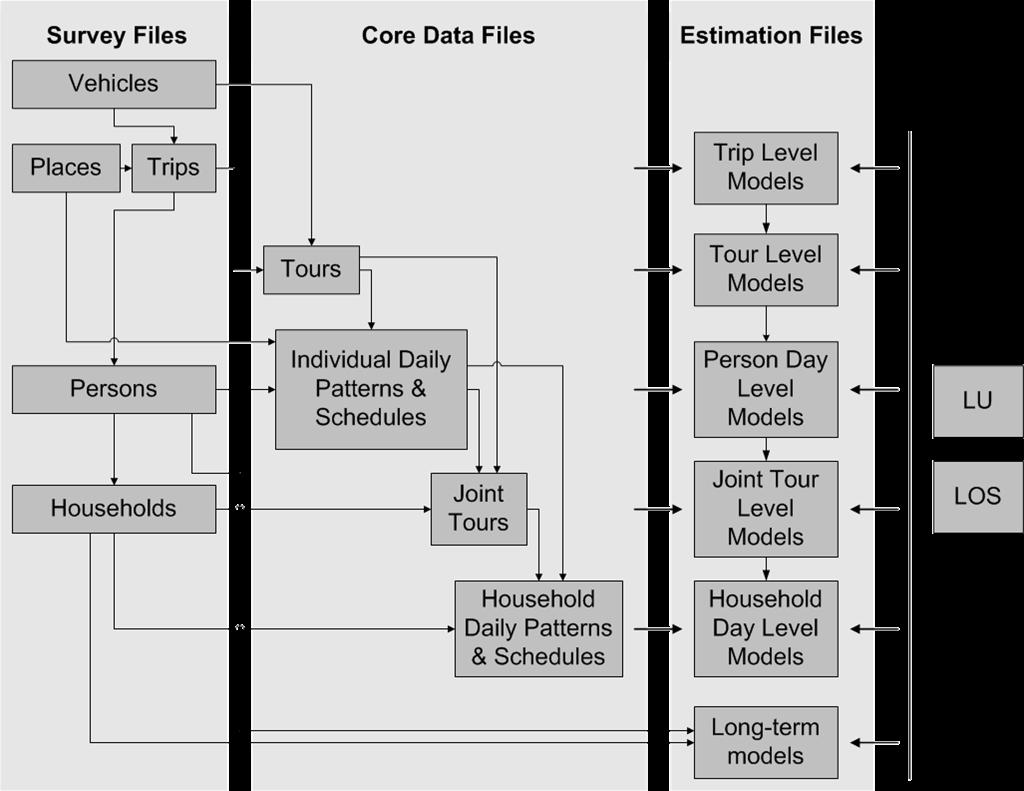

22 Data Processing Page 22


23 Tours by Purpose & Person Type (MAG/PAG NHTS) Person Type Work School University Others Full-time worker 2, ,176 Part-time worker ,048 University student Non-worker ,636 Retiree ,046 Driving school child Pre-driving school child 3 1, Pre-school child Page 23
24 Reconcile Trip Records with Level-of-Service (LOS) Skims Analysis of discrepancies and fixes (manual): Survey mode coding errors Compare reported trip duration to skims Trip Duration = β*skim Trip Mode β (MAG) β (PAG) Highway Transit (Bus) PAG skims are a bit too fast; Revision is underway Geocoding fixes for availability of Express/Rapid Bus Page 24

25 Reconcile Trip Records with Level-of-Service (LOS) Skims Logical checks: Availability of reported mode Transit IVT = 0 (by mode) Drive option for person under 16 yrs Unrealistic reported trip duration vs. mode-specific skims from model Number of records by modes No valid observations for Commuter Rail & Urban Rail Very few cases for Express/Rapid bus Page 25
")
26 Tours by Purpose & Mode (MAG/PAG NHTS) Page 26
27 0.1 Variation in Respondent Age Distribution 2008 ACS 2008 NHTS Percentage Under 5 to to to and to to to to to to to to and to and to to to to and over Page 27
Commercial-in-Confidence Ashton Old Baths Financial Model - Detailed Cashflow
 Year 0 1 2 3 4 5 6 7 8 9 10 11 12 13 Oct-16 Nov-16 Dec-16 Jan-17 Feb-17 Mar-17 Apr-17 May-17 Jun-17 Jul-17 Aug-17 Sep-17 Oct-17 2,038 2,922 4,089 4,349 6,256 7,124 8,885 8,885 8,885 8,885 8,885 8,885 9,107
COMPARISON OF FIXED & VARIABLE RATES (25 YEARS) CHARTERED BANK ADMINISTERED INTEREST RATES - PRIME BUSINESS*
 CHARTERED BANK ADMINISTERED INTEREST RATES - PRIME BUSINESS*") COMPARISON OF FIXED & VARIABLE RATES (25 YEARS) 2 Fixed Rates Variable Rates For Internal Use Only. FIXED RATES OF THE PAST 25 YEARS AVERAGE RESIDENTIAL MORTGAGE LENDING RATE - 5 YEAR* (Per cent) Year
COMPARISON OF FIXED & VARIABLE RATES (25 YEARS) 2 Fixed Rates Variable Rates For Internal Use Only. FIXED RATES OF THE PAST 25 YEARS AVERAGE RESIDENTIAL MORTGAGE LENDING RATE - 5 YEAR* (Per cent) Year
COMPARISON OF FIXED & VARIABLE RATES (25 YEARS) CHARTERED BANK ADMINISTERED INTEREST RATES - PRIME BUSINESS*
 CHARTERED BANK ADMINISTERED INTEREST RATES - PRIME BUSINESS*") COMPARISON OF FIXED & VARIABLE RATES (25 YEARS) 2 Fixed Rates Variable Rates FIXED RATES OF THE PAST 25 YEARS AVERAGE RESIDENTIAL MORTGAGE LENDING RATE - 5 YEAR* (Per cent) Year Jan Feb Mar Apr May Jun
COMPARISON OF FIXED & VARIABLE RATES (25 YEARS) 2 Fixed Rates Variable Rates FIXED RATES OF THE PAST 25 YEARS AVERAGE RESIDENTIAL MORTGAGE LENDING RATE - 5 YEAR* (Per cent) Year Jan Feb Mar Apr May Jun
Development of a Tour-Based Truck Travel Demand Model
 Development of a Tour-Based Truck Travel Demand Model presented to 2014 Innovations in Travel Modeling presented by Cambridge Systematics, Inc. Arun Kuppam coauthored by Jason Lemp, CS Dan Beagan, CS Vladimir
Who has trouble reporting prior day events?
 Vol. 10, Issue 1, 2017 Who has trouble reporting prior day events? Tim Triplett 1, Rob Santos 2, Brian Tefft 3 Survey Practice 10.29115/SP-2017-0003 Jan 01, 2017 Tags: missing data, recall data, measurement
RIDERSHIP TRENDS. July 2018
 RIDERSHIP TRENDS July Prepared by the Division of Strategic Capital Planning September Table of Contents Executive Summary...1 Ridership...3 Estimated Passenger Trips by Line...3 Estimated Passenger Trips
RIDERSHIP TRENDS. March 2017
 RIDERSHIP TRENDS March 2017 Prepared by the Division of Strategic Capital Planning May 2017 Table of Contents Executive Summary...1 Ridership...3 Estimated Passenger Trips by Line...3 Estimated Passenger
FOR IMMEDIATE RELEASE
 Article No. 7353 Available on www.roymorgan.com Roy Morgan Unemployment Profile Wednesday, 11 October 2017 2.498 million Australians (18.9%) now unemployed or under-employed In September 1.202 million
FOR IMMEDIATE RELEASE
 Article No. 6928 Available on www.roymorgan.com Roy Morgan Unemployment Profile Wednesday, 17 August 2016 Australian real unemployment jumps to 10.5% (up 0.9%) in July during post-election uncertainty
FOR IMMEDIATE RELEASE
 Article No. 7845 Available on www.roymorgan.com Roy Morgan Unemployment Profile Friday, 18 January 2019 Unemployment in December is 9.7% and under-employment is 8.8% FOR IMMEDIATE RELEASE Australian unemployment
FOR IMMEDIATE RELEASE
 Article No. 7761 Available on www.roymorgan.com Roy Morgan Unemployment Profile Monday, 8 October 2018 Unemployment down to 9.4% in September off two-year high Australian employment has grown solidly over
FOR IMMEDIATE RELEASE
 Article No. 7433 Available on www.roymorgan.com Roy Morgan Unemployment Profile Friday, 12 January 2018 2.6m Australians unemployed or under-employed in December The latest data for the Roy Morgan employment
FOR IMMEDIATE RELEASE
 Article No. 5842 Available on www.roymorgan.com Roy Morgan Unemployment Profile Thursday, 2 October 2014 Unemployment climbs to 9.9% in September as full-time work lowest since October 2011; 2.2 million
RIDERSHIP TRENDS. April 2018
 RIDERSHIP TRENDS April Prepared by the Division of Strategic Capital Planning June Table of Contents Executive Summary...1 Ridership...3 Estimated Passenger Trips by Line...3 Estimated Passenger Trips
APPLICATION OF A PARCEL-BASED SUSTAINABILITY TOOL TO ANALYZE GHG EMISSIONS
 APPLICATION OF A PARCEL-BASED SUSTAINABILITY TOOL TO ANALYZE GHG EMISSIONS Jung Seo, Hsi-Hwa Hu, Frank Wen, Simon Choi, Cheol-Ho Lee Research & Analysis Southern California Association of Governments 2012
ScoreCard November 2013 [Oct 13 Data] Ridership
![ScoreCard November 2013 [Oct 13 Data] Ridership](/thumbs/95/126521028.jpg "ScoreCard November 2013 [Oct 13 Data] Ridership") ScoreCard November 213 [Oct 13 Data] Ridership Average Weekday Ridership Sep 213: 1.37M Down.2 % from Sep 212 System Maintenance A key measure of system maintenance is the travel time impact of slowdowns
ScoreCard November 213 [Oct 13 Data] Ridership Average Weekday Ridership Sep 213: 1.37M Down.2 % from Sep 212 System Maintenance A key measure of system maintenance is the travel time impact of slowdowns
ScoreCard Jun 2014 [May 14 Data] Ridership
![ScoreCard Jun 2014 [May 14 Data] Ridership](/thumbs/93/113666940.jpg "ScoreCard Jun 2014 [May 14 Data] Ridership") + ScoreCard Jun 214 [May 14 Data] Ridership Average Weekday Ridership May 14: 1.36M Up 2.% from May 213 Year-to-Year Change: May 13 to Present -.6% -1.% -2.3% -1.7%.4% 4.9% -.2% -.3% -3.8%.8%.7% 3.1% 2.%
+ ScoreCard Jun 214 [May 14 Data] Ridership Average Weekday Ridership May 14: 1.36M Up 2.% from May 213 Year-to-Year Change: May 13 to Present -.6% -1.% -2.3% -1.7%.4% 4.9% -.2% -.3% -3.8%.8%.7% 3.1% 2.%
Climatography of the United States No
 Climate Division: CA 5 NWS Call Sign: Month (1) Min (2) Month(1) Extremes Lowest (2) Temperature ( F) Lowest Month(1) Degree s (1) Base Temp 65 Heating Cooling 100 Number of s (3) Jan 45.9 26.0 36.0 67
ScoreCard February 2014 [Jan 14 Data] Ridership
![ScoreCard February 2014 [Jan 14 Data] Ridership](/thumbs/93/113666999.jpg "ScoreCard February 2014 [Jan 14 Data] Ridership") + ScoreCard February 214 [Jan 14 Data] Ridership Average Weekday Ridership Jan 214: 1.22M Down 3.8% from Jan 213 System Maintenance A key measure of system maintenance is the travel time impact of slowdowns
+ ScoreCard February 214 [Jan 14 Data] Ridership Average Weekday Ridership Jan 214: 1.22M Down 3.8% from Jan 213 System Maintenance A key measure of system maintenance is the travel time impact of slowdowns
Development of the Idaho Statewide Travel Demand Model Trip Matrices Using Cell Phone OD Data and Origin Destination Matrix Estimation
 Portland State University PDXScholar TREC Friday Seminar Series Transportation Research and Education Center (TREC) 10-24-2016 Development of the Idaho Statewide Travel Demand Model Trip Matrices Using
Motorcyclist Deaths Jan Jul. 2018
 Motorcyclist Deaths Jan. 2008 Jul. 2018 This report summarizes all accidental deaths of motorcyclists in traffic-related motor vehicle incidents (MVIs) between January 1, 2008 and July 30, 2018. Inclusion
Climatography of the United States No
 Climate Division: WY 9 NWS Call Sign: LND Temperature ( F) Month (1) Min (2) Month(1) Extremes Lowest (2) Lowest Month(1) Degree s (1) Base Temp 65 Heating Cooling 100 Number of s (3) Jan 31.9 8.7 20.3
Draft Results and Recommendations
 Waco Rapid Transit Corridor (RTC) Feasibility Study Draft Results and Recommendations Chris Evilia, Director of Waco Metropolitan Planning Organization Allen Hunter, General Manager Waco Transit System
August ATR Monthly Report
 August ATR Monthly Report Minnesota Department of Transportation Office of Transportation Data and Analysis August 2011 Introduction The purpose of this report is to examine monthly traffic trends on
FOR IMMEDIATE RELEASE
 Article No. 7137 Available on www.roymorgan.com Roy Morgan Unemployment Profile Wednesday, 8 February 2017 Over 12 million Australians have jobs for the first time including over 8 million full-time jobs,
Draft Results and Open House
 Waco Rapid Transit Corridor (RTC) Feasibility Study Draft Results and Open House Chris Evilia, Director of Waco Metropolitan Planning Organization Allen Hunter, General Manager Waco Transit System Jimi
Private industries. Construction Total
 005 TABLE B. Gross domestic product (GDP) by industry, value added, in current dollars as a percentage of GDP, 987 003 Gross domestic product private Agriculture, forestry, fishing, hunting Mining Construction
TRAFFIC VOLUME TRENDS July 2002
 TRAFFIC VOLUME TRENDS July 2002 Travel on all roads and streets changed by +2.3 percent for July 2002 as compared to July 2001. Estimated Vehicle-Miles of Travel by Region - July 2002 - (in Billions) West
Table 1. INCIDENCE RATES 1 BY INDUSTRY AND CASE TYPES
 from work, job transfer, ALL INDUSTRIES, INCLUDING STATE AND LOCAL GOVERNMENT 6 1,598.2 5.5 3.1 1.9 1.1 2.5 PRIVATE INDUSTRY 6 Goods Producing 6 1,382.6 5.1 2.9 1.7 1.2 2.2 267.4 6.5 3.7 2.1 1.6 2.8 Natural
Energy Transformation In the Transport Sector. FRANCIS ROMANO Knights Energy
 Energy Transformation In the Transport Sector FRANCIS ROMANO Knights Energy Drive Electric Study: 2 year study of e-mobility YEAR 1 Test a Used EV Energy Economy: EV vs ICE Capex Vs Opex study YEAR 2 Test
1999 in Review. Benchmark Revision. Employment Scene. Department of Labor and Workforce Development Tony Knowles, Governor of Alaska
 1999 in Review 8 Benchmark Revision Employment Scene Department of Labor and Workforce Development Tony Knowles, Governor of Alaska April 2000 Volume 20 Number 4 ISSN 0160-3345 Alaska Economic Trends is
American Driving Survey,
 RESEARCH BRIEF American Driving Survey, 2015 2016 This Research Brief provides highlights from the AAA Foundation for Traffic Safety s 2016 American Driving Survey, which quantifies the daily driving patterns
Passenger seat belt use in Durham Region
 Facts on Passenger seat belt use in Durham Region June 2017 Highlights In 2013/2014, 85 per cent of Durham Region residents 12 and older always wore their seat belt when riding as a passenger in a car,
Climatography of the United States No
 Climate Division: MA 3 NWS Call Sign: BOS Month (1) Min (2) Month(1) Extremes Lowest (2) Temperature ( F) Lowest Month(1) Degree s (1) Base Temp 65 Heating Cooling 100 Number of s (3) 36.5 22.1 29.3 72
Sound Transit Operations July 2016 Service Performance Report. Ridership
 Ridership Total Boardings by Mode Mode Jul-15 Jul-16 % YTD-15 YTD-16 % ST Express 1,618,779 1,545,852-4.5% 10,803,486 10,774,063-0.3% Sounder 333,000 323,233-2.9% 2,176,914 2,423,058 11.3% Tacoma Link
TRAFFIC VOLUME TRENDS
 Page 1 U. S. Department Transportation Federal Highway Administration Office Highway Policy Information TRAFFIC VOLUME TRENDS September Travel on all roads and streets changed by +2.5 (5.8 billion vehicle
May ATR Monthly Report
 May ATR Monthly Report Minnesota Department of Transportation Office of Transportation Data and Analysis May 2011 Introduction The purpose of this report is to examine monthly traffic trends on Minnesota
Needs and Community Characteristics
 Needs and Community Characteristics Anticipate Population and Job Growth in the City Strongest density of population and jobs in Ann Arbor are within the Study Area Population expected to grow 8.4% by
Commonwealth of the Northern Mariana Islands
 Commonwealth of the Northern Mariana Islands ~ FISCAL YEAR ~ 2017 2018 % change ~ CALENDAR YEAR ~ 2017 2018 % change YTD OCT NOV DEC JAN FEB MAR APR MAY JUN JUL AUG SEP TOTAL 481,793 41,910 47,261 58,558
Industry Overview. Powersports Market Update
 2017 Q1 Industry Overview Powersports Market Update Sport side-by-sides continue to lead led the powersports industry, with that segment s pricing once again averaging higher than any of the previous three
Greater Cleveland Regional Transit Authority. Joe Calabrese - General Manager
 Greater Cleveland Regional Transit Authority Joe Calabrese - General Manager RTA Ridership by Mode! 500 Buses - 75 %! 60 Heavy Rail Vehicles - 10%! 24 RTV s (BRT) - 8%! 48 Light Rail Vehicles - 6%! Paratransit
2017 Adjusted Count Report February 12, 2018
 A statewide multi-use trail user study and volunteer data collection program 2017 Adjusted Count Report February 12, 2018 The following report includes the final adjusted infrared (IR) counter data at
Up and Down Months of the Stock Market
 Up and Down Months of the Stock Market 1926-2017 Positive years (66) in the stock market were not good all year long and losing years (24) were not losers throughout the year. Winning years produce losing
Growth cycles in Industrial production (IIP) (percentage deviation from trend*, seasonally adjusted) Jan-00 Aug-06 Sep-94. Dec-01.
 (percentage deviation from trend*, seasonally adjusted) Jan-00 Aug-06 Sep-94. Dec-01.") Chile The reference series The reference series used for constructing OECD Composite ing Indicator (CLI) for Chile is the index of production in total manufacturing, which is a proxy for the monthly index
Chile The reference series The reference series used for constructing OECD Composite ing Indicator (CLI) for Chile is the index of production in total manufacturing, which is a proxy for the monthly index
The Value of Travel-Time: Estimates of the Hourly Value of Time for Vehicles in Oregon 2007
 The Value of Travel-Time: Estimates of the Hourly Value of Time for Vehicles in Oregon 2007 Oregon Department of Transportation Long Range Planning Unit June 2008 For questions contact: Denise Whitney
GoToBermuda.com. Q3 Arrivals and Statistics at September 30 th 2015
 Q3 Arrivals and Statistics at September 30 th 2015 1 Q3 Total Vacation Visitor Arrivals Q3 Arrivals 2014 2015 YTD 2014 YTD 2015 Air - Vacation 54,305 54,473 0.31% 168 117,639 116,700-0.80% (939) Cruise
TRANSIT DEMAND IN RURAL DOUGLAS COUNTY: PRELIMINARY BACKGROUND DATA
 TRANSIT DEMAND IN RURAL DOUGLAS COUNTY: PRELIMINARY BACKGROUND DATA Lawrence-Douglas County MPO Regional Transit Advisory Committee Lawrence, Kans. Tuesday October 31, 2017 Chris Zeilinger Assistant Director
Central London Congestion Charging Scheme. 17 March 2005 Impacts - 9 th Annual Conference. Michele Dix Director Congestion Charging Division
 Central London Congestion Charging Scheme 17 March 2005 Impacts - 9 th Annual Conference Michele Dix Director Congestion Charging Division Contents 1. The Scheme 2. Impacts 3. Next Steps The Scheme Where
JOB OPENINGS AND LABOR TURNOVER DECEMBER 2017
 For release 10:00 a.m. (EST) Tuesday, February 6, 2018 Technical information: (202) 691-5870 JoltsInfo@bls.gov www.bls.gov/jlt Media contact: (202) 691-5902 PressOffice@bls.gov USDL-18-0204 JOB OPENINGS
201 SOUTH MARY STREET Sunnyvale, CA
 201 SOUTH MARY STREET Sunnyvale, CA RETAIL SPACE FOR SUBLEASE AVAILABLE Rear Entranceway SIZE: 1,991 square feet Property Highlights POSSESSION: Immediate ASKING RENT: $2.75 per Sq. Ft. per Month NNN COMMENTS:
Safety Communications Campaign
 Washington Metropolitan Area Transit Authority Safety Communications Campaign June 2012 Safety Communications Strategy Target: Five percent injury reduction Focus on basics most injuries are slips, trips,
UTA Transportation Equity Study and Staff Analysis. Board Workshop January 6, 2018
 UTA Transportation Equity Study and Staff Analysis Board Workshop January 6, 2018 1 Executive Summary UTA ranks DART 6 th out of top 20 Transit Agencies in the country for ridership. UTA Study confirms
The Central London Congestion Charge
 The Central London Congestion Charge Mike Keegan, Transport Planning & Policy Transport for London The charge for having a vehicle* in the zone is 8 per day, weekdays, 7a.m. to 6.30 p.m. * Some vehicles
DRAFT. Total Month Average Point (MAP) A Massage 4/30/2014 8/1/2015 A CENTER E
 A Massage 4/30/2014 8/1/2015 A CENTER E") Total Month Average Point (MAP) A Massage 4/30/2014 8/1/2015 A CENTER E 2.25 2.00 2.00 2.25 2.00 2.00 1.00 2.25 2.00 2.25 2.00 A Massage 10/31/2017 9/1/2015 B MEZZANINE 2.25 2.00 2.00 2.25 2.25 2.25 2.25
Total Month Average Point (MAP) A Massage 4/30/2014 8/1/2015 A CENTER E 2.25 2.00 2.00 2.25 2.00 2.00 1.00 2.25 2.00 2.25 2.00 A Massage 10/31/2017 9/1/2015 B MEZZANINE 2.25 2.00 2.00 2.25 2.25 2.25 2.25
EXPERIENCE IN A COMPANY-WIDE LONG DISTANCE CARPOOL PROGRAM IN SOUTH KOREA
 EXPERIENCE IN A COMPANY-WIDE LONG DISTANCE CARPOOL PROGRAM IN SOUTH KOREA JB s Social Club Presented at TRB 94th Annual Meeting on Jan 12, 2015 Louis Berger Kyeongsu Kim Land & Housing Institute (LHI)
Model Development & Applications at the Atlanta Regional Commission for Transportation Planning
 Model Development & Applications at the Atlanta Regional Commission for Transportation Planning Guy Rousseau, Atlanta Regional Commission FDOT District 4 Southeast Florida FSUTMS Users Group Meeting Friday
1. Trends in the current fiscal year and previous fiscal year 3. Business overview 2. Secular trends in first quarter financial results
 FY2/19 (March 2018~May 2018) Fact Book 1. Trends in the current fiscal year and previous fiscal year 3. Business overview (1) Performance overview P. 1 (1) No. of students at the end of month P. 6 (2)
Bus Congestion on the West Side of Manhattan. 6/6/14 Manha*an Community Baord 4 1
 Bus Congestion on the West Side of Manhattan 6/6/14 Manha*an Community Baord 4 1 Hudson Yards Economic Impact ~120,000 direct jobs (and potential for another 120K of indirect jobs) ~$60B of tax revenue
Monthly Statistics April 2011
 For Immediate Release: May 11, 211 CONTACT: Greg Hollman MLS President (52) 577-7433 Wes Wiggins Vice President, MLS (52) 382-8792 Philip Tedesco, RCE, CAE CEO, TAR & MLS (52) 327-4218 Tucson Association
JOB OPENINGS AND LABOR TURNOVER APRIL 2016
 For release 10:00 a.m. (EDT) Wednesday, June 8, Technical information: (202) 691-5870 JoltsInfo@bls.gov www.bls.gov/jlt Media contact: (202) 691-5902 PressOffice@bls.gov USDL-16-1149 JOB OPENINGS AND LABOR
Paratransit Overview O & O Presentation January 11, 2018
 Paratransit Overview O & O Presentation January 11, 2018 Our vision is to be a valued regional partner that drives prosperity and makes life better for our community. Our mission is to connect Hampton
ENERGY SLIDESHOW. Federal Reserve Bank of Dallas
 ENERGY SLIDESHOW Updated: March 13, 2018 ENERGY PRICES www.dallasfed.org/research/energy Brent & WTI & Crude Brent Oil Crude Oil Dollars per barrel 140 Brent (Mar 9 = $65.12) WTI (Mar 9 = $61.65) 120 100
Appendix F Model Development Report
 Appendix F Model Development Report This page intentionally left blank. Westside Mobility Plan Model Development Report December 2015 WESTSIDE MOBILITY PLAN MODEL DEVELOPMENT REPORT December 2015 Originally
Electricity Industry Code Minimum Service Standards & Guaranteed Service Levels Quarterly Report July September 2008
 Electricity Industry Code Minimum Service Standards & Guaranteed Service Levels Quarterly Report July September 2008 2 Table of Contents Administrative Data...3 Network Performance...3 Reliability Measures
Monthly Statistics November 2011
 For Immediate Release: December 9, 211 CONTACT: Greg Hollman MLS President (52) 577-7433 Tucson Association of REALTORS Multiple Listing Service Monthly Statistics November 211 Below are some highlights
ENERGY SLIDESHOW. Federal Reserve Bank of Dallas
 ENERGY SLIDESHOW Updated: January 16, 2019 ENERGY PRICES www.dallasfed.org/research/energy Brent & WTI & Crude Brent Oil Crude Oil Dollars per barrel 140 120 100 Brent (Jan 11 = $58.64) WTI (Jan 11 = $50.78)
Performance Measures 4 th Quarter/Year End 2010
 Performance Measures 4 th Quarter/Year End 2010 Earn & Retain Community Trust 6 Performance Measures: Ridership Cost Effectiveness (Cost per Passenger) Cost Efficiency (Cost per Revenue Hour) Service Effectiveness
Preston s Edmond Market Report
 Preston s Edmond arket Report April 2 Prepared By Brian Preston RE/AX Associates obile: 45-826-5725 Office: 45-359-87 bpreston88@sbcglobal.net www.edmond4sale.com Realtor of the Year 1995 & 22 Lifetime
GDP. Total Domestic demand External balance 1)
") 3.1 GDP and expenditure components (quarterly data seasonally adjusted; annual data unadjusted) GDP Total Domestic demand External balance 1) Total Private Government Gross fixed capital formation Changes
3.1 GDP and expenditure components (quarterly data seasonally adjusted; annual data unadjusted) GDP Total Domestic demand External balance 1) Total Private Government Gross fixed capital formation Changes
Smart community clustering for sharing local green energy. Yoshiki Yamagata, Hajime Seya and Sho Kuroda
 2014 International Conference and Utility Exhibition on "Green Energy for Sustainable Development" Smart community clustering for sharing local green energy Yoshiki Yamagata, Hajime Seya and Sho Kuroda
AAMVA. Reducing Suspended Drivers. June 2, 2015 Presenter: Julie Knittle WA Department of Licensing
 AAMVA Reducing Suspended Drivers June 2, 2015 Presenter: Julie Knittle WA Department of Licensing Overview Suspending driving privileges used for decades to address poor driving behavior Impact on reducing
INTECH AUGUST QHSE PERFORMANCE
 INTECH QHSE PERFORMANCE - MONTHLY QHSE PERFORMANCE Goal Zero Days ( worked days without Lost Time Injury (LTI)) 751 This Month Minor Accidents or Incidents 01 This Month Major Accidents or Incidents 00
Mining and quarrying 13,503 19,062 26,170 35,190 38,511 53,515 74,386 85,792 99, ,422
 Table A1.1: Gross Domestic Product (GDP), at Factor Cost by kind of Economic Activity at Current Prices,Tanzania Mainland, 1992-2001 Millions of TZS Activity 1992 1993 1994 1995 1996 1997 1998 1999 2000
Table AC5. Average Consumption for Air-Conditioning by Equipment Type, 2005 kwh per Household
 Table AC5. Average Consumption for by Type, 2005 Total Using Type of Total... 111.1 91.4 2822 3475 1259 Census Region and Division Northeast... 20.6 16.3 1332 2077 914 New England... 5.5 3.7 740 1480 556
Consumer Price Index. November Consumer Price Index (CPI) November Contact Statistician: Phaladi Labobedi
 November Contact Statistician: Phaladi Labobedi") Consumer Price Index (CPI) November Consumer Price Index November Contact Statistician: Phaladi Labobedi Email: +267 3671300 November CPI 1 Published by STATISTICS BOTSWANA Private Bag 0024, Gaborone Tel:
Consumer Price Index (CPI) November Consumer Price Index November Contact Statistician: Phaladi Labobedi Email: +267 3671300 November CPI 1 Published by STATISTICS BOTSWANA Private Bag 0024, Gaborone Tel:
Automotive Repair Technician
 Automotive Repair Technician Inland Empire/Desert Region (Riverside-San Bernardino-Ontario Metropolitan Statistical Area) Summary Employment for the automotive repair occupational group is expected to
Zero Emission Bus Deployment Best Practices and Lessons Learned from Around the World
 Zero Emission Bus Deployment Best Practices and Lessons Learned from Around the World Steve Clermont, Director, Senior Project Manager Lauren Justice, Project Manager October 10, 2017 About CTE Mission:
OLYMPIC GATEWAY PLAZA
 OLYMPIC GATEWAY PLAZA ABERDEEN, WA MICHAEL S SUBLEASE AVAILABLE IMMEDIATELY Property Highlights Located in the Olympic Gateway Plaza Great Visibility to State Hwy 12 13,258 sf Available (103 front x 129
Yale University Race/Ethnicity and International Student Enrollment by School to Race/Ethnicity Unknown.
 Hispanic of Any Race Black or African Alaskan Native Asian Islander White Two or More Races Race/Ethnicity Unknown Total U.S. & Resident Alien Students Non-Resident Yale College 2005-06 179 204 193 239
Kauai Resident Travel Survey: Summary of Results
 Kauai Resident Travel Survey: Summary of Results Kauai Multimodal Land Transportation Plan Charlier Associates, Inc. November 23, 2011 1 Table of Contents Executive Summary... 2 Survey Goals and Methodology...
FY2/18 2Q(March 2017~August 2018)
") FY2/18 2Q(March 2017~August 2018) Fact Book 1. Trends in the current fiscal year and previous fiscal year 3. Business overview (1) Performance overview P.1 (1) No. of students at the end of month P.7 (2)
FY2/18 2Q(March 2017~August 2018) Fact Book 1. Trends in the current fiscal year and previous fiscal year 3. Business overview (1) Performance overview P.1 (1) No. of students at the end of month P.7 (2)
ANCR CRU Statistics February 2007 to December 2007
 ANCR CRU Statistics February 2007 to December 2007 o Jan/07 Feb/07* Mar/07 Apr/07 May/07 Jun/07 Jul/07 Aug/07 Sep/07 Oct/07 Nov/07 Dec/07 Total notes data from Perimeter phone system unavailable prior
Motorcoach Census 2011
 Motorcoach Census 2011 A Benchmarking Study of the Size and Activity of the Motorcoach Industry in the United States and Canada in 2010 Prepared for the American Bus Association Foundation by John Dunham
Research and Statistics Department FOR RELEASE 8:50 A.M. Thursday, July 26, All items
 Bank of Japan Research and Statistics Department FOR RELEASE 8:50 A.M. Thursday, July 26, 2018 Report on the Services Producer Price ( Preliminary Figures for 2018 ) The Services Producer Price (All items)
FALL 2007 MBA EXIT SURVEY (Sample size of 29: 15 responses from the San Marcos location and 14 responses from the RRHEC location)
") FALL 2007 MBA EXIT SURVEY (Sample size of 29: 15 responses from the San Marcos location and 14 responses from the RRHEC location) EVALUATION OF MBA CURRICULUM Scale items: 1 = Very Satisfied 6 = Very Dissatisfied
FALL 2007 MBA EXIT SURVEY (Sample size of 29: 15 responses from the San Marcos location and 14 responses from the RRHEC location) EVALUATION OF MBA CURRICULUM Scale items: 1 = Very Satisfied 6 = Very Dissatisfied
High Quality Service through Continuous Improvement st Quarter Performance Report
 High Quality Service through Continuous Improvement 6 st Quarter Performance Report TriMet Board Meeting May 5, 6 Quality is a never ending quest and continuous improvement is a never ending way to discover
JBS Energy, Inc. 311 D Street West Sacramento California, USA tel Prepared by William B. Marcus Greg Ruszovan
 Know Your Customers : A Review of Load Research Data and Economic, Demographic, and Appliance Saturation Characteristics of California Utility Residential Customers Prepared by William B. Marcus Greg Ruszovan
Onboard Survey FINAL REPORT
 2014-2015 Valley Metro Onboard Survey FINAL REPORT Prepared for: Maricopa Association of Governments (MAG) and Valley Metro Transit System Developed by: ETC Institute TABLE OF CONTENTS Chapter 1 Survey
Produced by the BPDA Research Division:
 March 2018 Produced by the BPDA Research Division: Alvaro Lima Director Jonathan Lee Deputy Director Christina Kim Research Manager Phillip Granberry Senior Researcher/Demographer Matthew Resseger Senior
TECHNICAL COORDINATING COMMITTEE (TCC) UPDATE PRESENTATION APRIL 26, 2017
 UPDATE PRESENTATION APRIL 26, 2017") TECHNICAL COORDINATING COMMITTEE (TCC) UPDATE PRESENTATION APRIL 26, 2017 THE TRANSIT DEVELOPMENT PLAN (TDP) WILL IDENTIFY: TRANSIT NEEDS AND DESIRES OF THE COMMUNITY COMMUNITY AND AGENCY STAKEHOLDER S
TECHNICAL COORDINATING COMMITTEE (TCC) UPDATE PRESENTATION APRIL 26, 2017 THE TRANSIT DEVELOPMENT PLAN (TDP) WILL IDENTIFY: TRANSIT NEEDS AND DESIRES OF THE COMMUNITY COMMUNITY AND AGENCY STAKEHOLDER S
8. TRIP DISTRIBUTION. 8.1 Trip Distribution by Trip Purpose. Figures 8.1 show desire lines by trip purpose. < To Work >
 8. TRIP DISTRIBUTION 8.1 Trip Distribution by Trip Purpose Figures 8.1 show desire lines by trip purpose. < To Work > Quezon (II) and Makati form large centers for to Work trips. Manila also attracts a
PREFACE. ... John Steytler STATISTICIAN - GENERAL NAMIBIA CONSUMER PRICE INDEX BULLETIN NOVEMBER
 PREFACE The Namibia Consumer Price Index (CPI) includes all Namibian private households living in urban and rural areas and is compiled by comparing the prices of the goods and services with the prices
Northeast Corridor Alternatives Analysis. Public Involvement Round 2 Input on Alternatives for Further Study
 Northeast Corridor Alternatives Analysis Public Involvement Round 2 Input on Alternatives for Further Study Feb. 7-9, 2012 Agenda Review project background Progress summary Recommended alternatives for
Performance Measures Second Quarter 2012
 Performance Measures Second Quarter 2012 2Q2011 Earn & Retain Community Trust 6 Performance Measures: Ridership Cost Effectiveness (Cost per Passenger) Cost Efficiency (Cost per Revenue Hour) Service Effectiveness
University of Michigan Eco-Driving Index (EDI) Latest data: October 2017
 Latest data: October 2017") University of Michigan Eco-Driving Index () http://www.ecodrivingindex.org Latest data: October 2017 Developed and issued monthly by Michael Sivak and Brandon Schoettle Sustainable Worldwide Transportation
University of Michigan Eco-Driving Index () http://www.ecodrivingindex.org Latest data: October 2017 Developed and issued monthly by Michael Sivak and Brandon Schoettle Sustainable Worldwide Transportation
Smart Green Transportation of LG CNS. Seoul Case
 Smart Green Transportation of LG CNS Seoul Case about Seoul Seoul Was about Seoul about Seoul - 1/22 Economic Growth of Korea Item 1970 2004 Differences Population 5,433,198 10,297,004 2 times Vehicles
Travel Demand Modeling at NCTCOG
 Travel Demand Modeling at NCTCOG Arash Mirzaei North Central Texas Council Of Governments for Southern Methodist University The ASCE Student Chapter October 24, 2005 Contents NCTCOG DFW Regional Model
Multiple Listing Service of Southern Arizona Statistics 2017 YEAR END REVIEW
 For Immediate Release: February 23, 2018 CONTACT: Judith Grammond MLSSAZ President (520) 7211478 Sean Murphy Executive Vice President (520) 3828792 Randy Rogers CEO, MLSSAZ (520) 3274218 Multiple Listing
INFORMATION & ENROLLMENT
 INFORMATION & ENROLLMENT 2018 2018 Our successful Vanair Sales University continues to graduate professionals with the most outstanding selling skills and product education available anywhere. Vanair Sales
CHART BOOK ON WAGES, OPERATING COSTS, AND COST OF LIVING
 CHART BOOK ON WAGES, OPERATING COSTS, AND COST OF LIVING FOR TAXICAB DRIVERS IN NEW YORK CITY Prepared for the Taxi Workers Alliance by the Brennan Center for Justice at NYU School of Law Current and Proposed