MODUL PELATIHAN SEM ANANDA SABIL HUSSEIN, PHD
|
|
|
- Erica Atkinson
- 5 years ago
- Views:
Transcription
1 MODUL PELATIHAN SEM ANANDA SABIL HUSSEIN, PHD PUSAT KAJIAN DAN PENGABDIAN MASYARAKAT JURUSAN MANAJEMEN UNIVERSITAS BRAWIJAYA 2018
2 1) 2) ANALISA JALUR 1) LMK = 27,209 3,599IPK + 1,749 x 10-7 US + 0,019JR 1,516LT + 1,074LB + e P 1 = -0,508; P 2 = 0,034; P 3 = 0,027; P 4 = -0,830; P 5 = 0,358 E 1 = 1 0,932 = 0,068 Model Summary Model R R Square Adjusted R Square Std. Error of the Estimate 1,966 a,932,923,624 a. Predictors: (Constant), IPK, Jarak Rumah, Uang Saku, Lama Belajar, Lama Tidur ANOVA a
3 Model Sum of Squares df Mean Square F Sig. 1 Regression 182, ,549 93,913,000 b Residual 13,232 34,389 Total 195, a. Dependent Variable: Lama Mencari Kerja b. Predictors: (Constant), IPK, Jarak Rumah, Uang Saku, Lama Belajar, Lama Tidur Coefficients a Unstandardized Coefficients Standardized Coefficients Model B Std. Error Beta t Sig. 1 (Constant) 27,209 2,217 12,271,000 Uang Saku 1,749E-7,000,034,635,530 Jarak Rumah,019,036,027,541,592 Lama Tidur -1,516,316 -,830-4,806,000 Lama Belajar 1,074,484,358 2,217,033 IPK -3,599,878 -,508-4,101,000 a. Dependent Variable: Lama Mencari Kerja 2) IPK = 2, ,315 x 10-8 US 0,010JR + 0,142LT + 0,142LB +e P 6 = 0,128; P 7 = -0,102: P 8 = 0,550; P 9 = 0,334 E 2 = 1 0,871 = 0,129 Model Summary Model R R Square Adjusted R Square Std. Error of the Estimate 1,933 a,871,856,12015 a. Predictors: (Constant), Lama Belajar, Jarak Rumah, Uang Saku, Lama Tidur ANOVA a Model Sum of Squares df Mean Square F Sig. 1 Regression 3,404 4,851 58,950,000 b Residual,505 35,014 Total 3, a. Dependent Variable: IPK
4 b. Predictors: (Constant), Lama Belajar, Jarak Rumah, Uang Saku, Lama Tidur Coefficients a Unstandardized Coefficients Standardized Coefficients Model B Std. Error Beta t Sig. 1 (Constant) 2,128,230 9,250,000 Uang Saku 9,315E-8,000,128 1,839,074 Jarak Rumah -,010,007 -,102-1,550,130 Lama Tidur,142,056,550 2,543,016 Lama Belajar,142,090,334 1,571,125 a. Dependent Variable: IPK US P 6 P 2 JR P 3 P 7 IPK P 1 LMK LT P 8 P 4 LB P 9 P 5 e2 e 1
5 SEM Regression Weights: (Group number 1 - Default model) Estimate S.E. C.R. P Label IPK <--- UangSaku,000,000 1,941,052 par_1 IPK <--- JarakRumah -,010,006-1,637,102 par_2 IPK <--- LamaTidur,142,053 2,685,007 par_3 IPK <--- LamaBelajar,142,085 1,658,097 par_4 LamaMencariKerja <--- UangSaku,000,000,680,496 par_11 LamaMencariKerja <--- JarakRumah,019,033,579,563 par_12 LamaMencariKerja <--- LamaTidur -1,516,295-5,147 *** par_13 LamaMencariKerja <--- LamaBelajar 1,074,452 2,375,018 par_14 LamaMencariKerja <--- IPK -3,599,819-4,392 *** par_15 Standardized Regression Weights: (Group number 1 - Default model) Estimate IPK <--- UangSaku,128 IPK <--- JarakRumah -,102 IPK <--- LamaTidur,550 IPK <--- LamaBelajar,334 LamaMencariKerja <--- UangSaku,034

6 Estimate LamaMencariKerja <--- JarakRumah,027 LamaMencariKerja <--- LamaTidur -,830 LamaMencariKerja <--- LamaBelajar,358 LamaMencariKerja <--- IPK -,508 CONFIRMATORY FACTOR ANALYSIS Observed Variable Laten Variable Korelasi Variable Assesment Normality Assessment of normality (Group number 1)
7 Variable min max skew c.r. kurtosis c.r. Z6 2,000 5,000 -,240-1,386 -,927-2,675 Z5 2,000 5,000 -,350-2,023-1,110-3,203 Z1 2,000 5,000-1,090-6,294 1,173 3,386 Z2 2,000 5,000 -,132 -,764 -,490-1,415 Z3 2,000 5,000 -,013 -,073 -,955-2,757 Z4 2,000 5,000 -,068 -,395 -,811-2,341 Y11 3,000 5,000 -,384-2,218-1,068-3,082 Y12 2,000 5,000 -,876-5,058 1,769 5,108 Y13 2,000 5,000 -,251-1,446 -,454-1,310 Y14 3,000 5,000 -,235-1,355 -,662-1,911 X31 2,000 5,000 -,771-4,452,296,854 X32 2,000 5,000 -,744-4,295 -,170 -,491 X33 2,000 5,000 -,674-3,890 -,163 -,472 X34 2,000 5,000-1,051-6,067,809 2,335 X35 2,000 5,000-1,289-7,441 1,001 2,890 X36 2,000 5,000-1,019-5,884,785 2,267 X37 2,000 5,000 -,883-5,097,429 1,237 X11 2,000 5,000-1,441-8,322 2,541 7,334 X12 3,000 5,000,004,020 -,206 -,595 X13 3,000 5,000 -,323-1,865 -,661-1,909 X14 3,000 5,000 -,257-1,485 -,695-2,006 X15 3,000 5,000,022,127 -,387-1,119 X16 3,000 5,000 -,222-1,280 -,608-1,755 X17 3,000 5,000 -,078 -,448 -,369-1,065 Multivariate 64,071 12,824 Outlier detection Observations farthest from the centroid (Mahalanobis distance) (Group number 1) Observation number Mahalanobis d-squared p1 p ,979,000, ,905,000, ,027,000, ,087,000, ,996,000, ,031,001, ,083,006, ,931,006, ,355,007, ,120,007, ,184,009, ,882,010, ,761,011,000
8 Observation number Mahalanobis d-squared p1 p ,690,014, ,760,029, ,068,034, ,886,045, ,546,049, ,129,053, ,101,054, ,974,055, ,917,056, ,660,059, ,536,076, ,086,083, ,567,093, ,700,111, ,676,111, ,658,112, ,602,113, ,457,116, ,391,118, ,366,118, ,123,124, ,911,129, ,858,131, ,840,131, ,815,132, ,317,145, ,766,161, ,549,167, ,506,169, ,908,188, ,686,195, ,558,200, ,334,208, ,076,217, ,914,223, ,796,228, ,748,230, ,478,240, ,392,244, ,198,252, ,035,259, ,032,259, ,979,261, ,951,262,254
9 Observation number Mahalanobis d-squared p1 p ,304,290, ,098,300, ,890,310, ,730,317, ,656,321, ,624,322, ,516,328, ,501,328, ,468,330, ,453,331, ,381,334, ,361,335, ,303,338, ,177,344, ,039,351, ,036,351, ,909,358, ,873,360, ,589,374, ,589,374, ,583,375, ,440,382, ,388,385, ,304,389, ,204,395, ,086,401, ,086,401, ,970,407, ,850,414, ,733,420, ,557,430, ,397,439, ,243,448, ,198,450, ,898,467, ,785,474, ,610,484, ,388,497, ,170,510, ,082,515, ,077,515, ,835,530, ,651,540,888
10 Model Fit Summary CMIN Model NPAR CMIN DF P CMIN/DF Default model , ,000 2,643 Saturated model 300,000 0 Independence model , ,000 10,322 RMR, GFI Model RMR GFI AGFI PGFI Default model,029,802,759,658 Saturated model,000 1,000 Independence model,176,265,201,244 Baseline Comparisons Model NFI RFI IFI TLI Delta1 rho1 Delta2 rho2 CFI Default model,772,744,845,824,843 Saturated model 1,000 1,000 1,000 Independence model,000,000,000,000,000 Parsimony-Adjusted Measures Model PRATIO PNFI PCFI Default model,891,688,751 Saturated model,000,000,000 Independence model 1,000,000,000 NCP Model NCP LO 90 HI 90 Default model 404, , ,667 Saturated model,000,000,000 Independence model 2572, , ,755 FMIN Model FMIN F0 LO 90 HI 90 Default model 3,268 2,031 1,671 2,430 Saturated model,000,000,000,000 Independence model 14,315 12,928 12,086 13,808 RMSEA
11 Model RMSEA LO 90 HI 90 PCLOSE Default model,091,082,099,000 Independence model,216,209,224,000 AIC Model AIC BCC BIC CAIC Default model 758, , , ,369 Saturated model 600, , , ,495 Independence model 2896, , , ,894 ECVI Model ECVI LO 90 HI 90 MECVI Default model 3,810 3,450 4,209 3,888 Saturated model 3,015 3,015 3,015 3,448 Independence model 14,556 13,714 15,436 14,591 HOELTER Model HOELTER HOELTER Default model Independence model MODIFIKASI MODEL Excluding : Z4, Z6, Y14, X31 Covary: e4 dan e7, e9 dan e11,
12
13 Model Fit Summary CMIN Model NPAR CMIN DF P CMIN/DF Default model , ,000 1,740 Saturated model 210,000 0 Independence model , ,000 10,329 RMR, GFI Model RMR GFI AGFI PGFI Default model,024,881,845,679 Saturated model,000 1,000 Independence model,165,319,247,288 Baseline Comparisons Model NFI RFI IFI TLI Delta1 rho1 Delta2 rho2 CFI Default model,856,832,933,921,932 Saturated model 1,000 1,000 1,000 Independence model,000,000,000,000,000 Parsimony-Adjusted Measures Model PRATIO PNFI PCFI Default model,853,730,795 Saturated model,000,000,000 Independence model 1,000,000,000 NCP Model NCP LO 90 HI 90 Default model 119,853 77, ,453 Saturated model,000,000,000 Independence model 1772, , ,463 FMIN Model FMIN F0 LO 90 HI 90 Default model 1,416,602,388,857 Saturated model,000,000,000,000 Independence model 9,862 8,907 8,211 9,641 RMSEA Model RMSEA LO 90 HI 90 PCLOSE
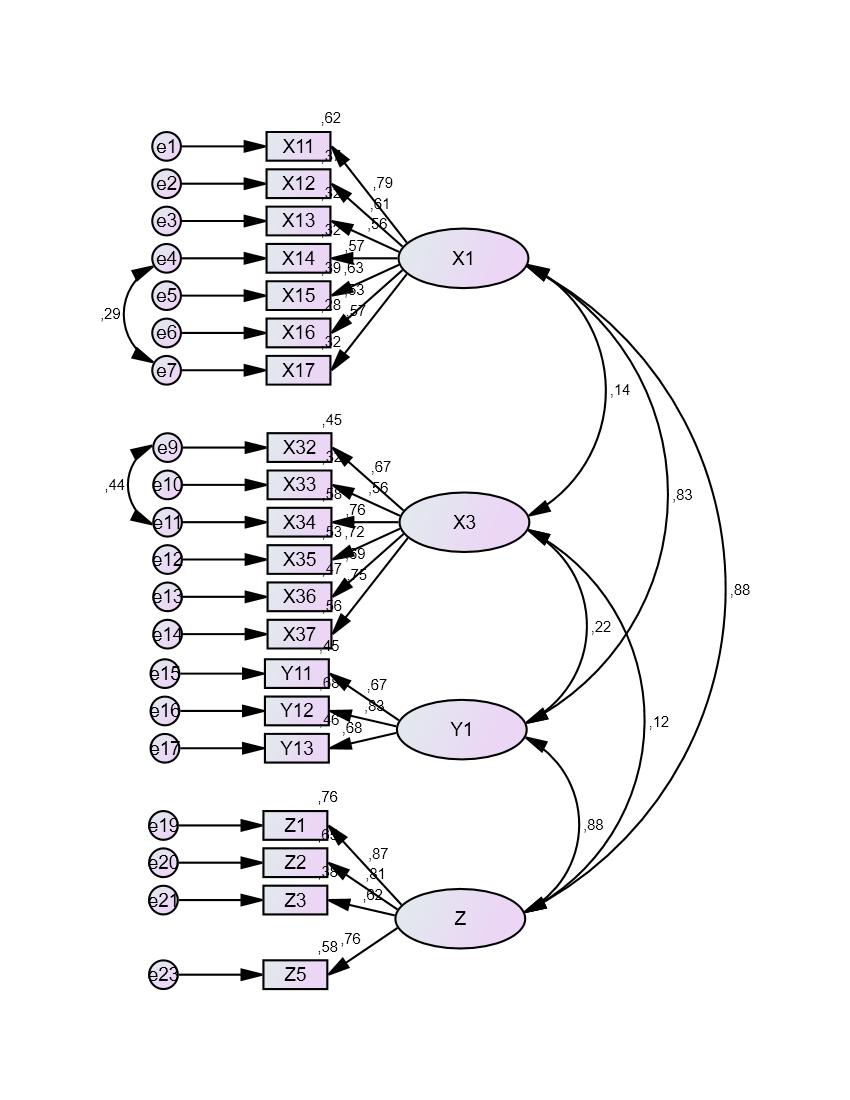
14 Model RMSEA LO 90 HI 90 PCLOSE Default model,061,049,073,066 Independence model,217,208,225,000 AIC Model AIC BCC BIC CAIC Default model 377, , , ,172 Saturated model 420, , , ,647 Independence model 2002, , , ,515 ECVI Model ECVI LO 90 HI 90 MECVI Default model 1,899 1,684 2,153 1,956 Saturated model 2,111 2,111 2,111 2,360 Independence model 10,063 9,367 10,796 10,087 HOELTER Model HOELTER HOELTER Default model Independence model KONVERGEN VALIDITY : Factor Loadings Standardized Regression Weights: (Group number 1 - Default model) Estimate X17 <--- X1,568 X16 <--- X1,532 X15 <--- X1,628 X14 <--- X1,568 X13 <--- X1,561 X12 <--- X1,609 X11 <--- X1,788 X37 <--- X3,748 X36 <--- X3,687 X35 <--- X3,725 X34 <--- X3,759 X33 <--- X3,563 X32 <--- X3,668 Y13 <--- Y1,679 Y12 <--- Y1,827 Y11 <--- Y1,671
15 Estimate Z3 <--- Z,616 Z2 <--- Z,807 Z1 <--- Z,872 Z5 <--- Z,761 Standardized Regression Weights: (Group number 1 - Default model) Estimate X15 <--- X1,614 X12 <--- X1,604 X11 <--- X1,806
16 Estimate X37 <--- X3,745 X36 <--- X3,665 X35 <--- X3,746 X34 <--- X3,766 X32 <--- X3,663 Y13 <--- Y1,673 Y12 <--- Y1,834 Y11 <--- Y1,669 Z3 <--- Z,617 Z2 <--- Z,802 Z1 <--- Z,877 Z5 <--- Z,757 KONVERGEN VALIDITY : Average Variance Extracted Estimate X15 <--- X1 0,614 X12 <--- X1 0,604 X11 <--- X1 0,806 X37 <--- X3 0,745 X36 <--- X3 0,665 X35 <--- X3 0,746 X34 <--- X3 0,766 X32 <--- X3 0,663 Y13 <--- Y1 0,673 Y12 <--- Y1 0,834 Y11 <--- Y1 0,669 Z3 <--- Z 0,617 Z2 <--- Z 0,802 Z1 <--- Z 0,877 Z5 <--- Z 0,757 AVE 0,463 0,516 0,532 0,591
17 DISKRIMINAN VALIDITY Correlations: (Group number 1 - Default model) Estimate X1 <--> X3,113 X1 <--> Y1,812 X1 <--> Z,876 X3 <--> Y1,208 X3 <--> Z,123 Y1 <--> Z,880 e11 <--> e9,441 RELIABILITY Variabel CR X1 0,718 X3 0,841 Y1 0,771 Z 0,850 Goodness of Fit Model Model Fit Summary CMIN Model NPAR CMIN DF P CMIN/DF Default model ,640 83,000 1,682 Saturated model 120,000 0 Independence model , ,000 14,193 RMR, GFI Model RMR GFI AGFI PGFI Default model,021,918,881,635 Saturated model,000 1,000 Independence model,187,351,258,307 Baseline Comparisons
18 Model NFI RFI IFI TLI Delta1 rho1 Delta2 rho2 CFI Default model,906,881,960,948,959 Saturated model 1,000 1,000 1,000 Independence model,000,000,000,000,000 Parsimony-Adjusted Measures Model PRATIO PNFI PCFI Default model,790,716,758 Saturated model,000,000,000 Independence model 1,000,000,000 NCP Model NCP LO 90 HI 90 Default model 56,640 27,929 93,235 Saturated model,000,000,000 Independence model 1385, , ,781 FMIN Model FMIN F0 LO 90 HI 90 Default model,702,285,140,469 Saturated model,000,000,000,000 Independence model 7,489 6,961 6,353 7,607 RMSEA Model RMSEA LO 90 HI 90 PCLOSE Default model,059,041,075,195 Independence model,257,246,269,000 AIC Model AIC BCC BIC CAIC Default model 213, , , ,678 Saturated model 240, , , ,798 Independence model 1520, , , ,771 ECVI Model ECVI LO 90 HI 90 MECVI Default model 1,074,929 1,257 1,106 Saturated model 1,206 1,206 1,206 1,311 Independence model 7,640 7,031 8,285 7,653
19 HOELTER Model HOELTER HOELTER Default model Independence model STRUKTURAL MODEL Model Fit Summary CMIN Model NPAR CMIN DF P CMIN/DF Default model ,640 83,000 1,682 Saturated model 120,000 0 Independence model , ,000 14,193
20 RMR, GFI Model RMR GFI AGFI PGFI Default model,021,918,881,635 Saturated model,000 1,000 Independence model,187,351,258,307 Baseline Comparisons Model NFI RFI IFI TLI Delta1 rho1 Delta2 rho2 CFI Default model,906,881,960,948,959 Saturated model 1,000 1,000 1,000 Independence model,000,000,000,000,000 Parsimony-Adjusted Measures Model PRATIO PNFI PCFI Default model,790,716,758 Saturated model,000,000,000 Independence model 1,000,000,000 NCP Model NCP LO 90 HI 90 Default model 56,640 27,929 93,235 Saturated model,000,000,000 Independence model 1385, , ,781 FMIN Model FMIN F0 LO 90 HI 90 Default model,702,285,140,469 Saturated model,000,000,000,000 Independence model 7,489 6,961 6,353 7,607 RMSEA Model RMSEA LO 90 HI 90 PCLOSE Default model,059,041,075,195 Independence model,257,246,269,000 AIC Model AIC BCC BIC CAIC Default model 213, , , ,678 Saturated model 240, , , ,798
21 Model AIC BCC BIC CAIC Independence model 1520, , , ,771 ECVI Model ECVI LO 90 HI 90 MECVI Default model 1,074,929 1,257 1,106 Saturated model 1,206 1,206 1,206 1,311 Independence model 7,640 7,031 8,285 7,653 HOELTER Model HOELTER HOELTER Default model Independence model Regression Weights: (Group number 1 - Default model) Estimate S.E. C.R. P Label Y1 <--- X1 1,175,182 6,464 *** par_11 Y1 <--- X3,124,076 1,641,101 par_12 Z <--- Y1,703,195 3,604 *** par_13 Z <--- X1,952,294 3,232,001 par_14 Z <--- X3 -,053,079 -,670,503 par_15 X15 <--- X1 1,000 X12 <--- X1 1,005,143 7,015 *** par_1 X11 <--- X1 1,736,211 8,226 *** par_2 X35 <--- X3 1,000 X34 <--- X3 1,120,119 9,376 *** par_3 X32 <--- X3,942,118 7,968 *** par_4 X36 <--- X3 1,033,124 8,327 *** par_5 X37 <--- X3 1,108,116 9,518 *** par_6 Y13 <--- Y1 1,000 Y12 <--- Y1 1,137,117 9,697 *** par_7 Y11 <--- Y1,719,088 8,187 *** par_8 Z1 <--- Z 1,000 Z2 <--- Z,897,064 13,944 *** par_9 Z3 <--- Z,695,074 9,453 *** par_10 Z5 <--- Z 1,164,094 12,423 *** par_16
22
LAMPIRAN UJI VALIDITAS
 LAMPIRAN UJI VALIDITAS 1 e1 e2,00 Q1,04 Q2,01 -,04 e3 Q3,00 -,21 -,09 e4 Q4,49 -,01 e5 Q5,70,50,71 e6 Q6,47,69,74 e7 Q7,54,41,08 e8 Q8,17 e9 Q9,01 e10 Q10 Kompetensi Guru Chi-Square = 78,430 Probabilitas
. Enter. Model Summary b. Std. Error. of the. Estimate. Change. a. Predictors: (Constant), Emphaty, reliability, Assurance, responsive, Tangible
, Emphaty, reliability, Assurance, responsive, Tangible") LAMPIRAN Variables Entered/Removed b Variables Model Variables Entered Removed Method 1 Emphaty, reliability, Assurance, responsive, Tangible a. Enter a. All requested variables entered. b. Dependent Variable:
LAMPIRAN Variables Entered/Removed b Variables Model Variables Entered Removed Method 1 Emphaty, reliability, Assurance, responsive, Tangible a. Enter a. All requested variables entered. b. Dependent Variable:
UJI VALIDITAS DAN RELIABILIAS VARIABEL KOMPENSASI
 1 UJI VALIDITAS DAN RELIABILIAS VARIABEL KOMPENSASI Case Processing Summary N % 20 100.0 Cases Excluded a 0.0 Total 20 100.0 a. Listwise deletion based on all variables in the procedure. Reliability Statistics
TRY OUT 25 Responden Variabel Kepuasan / x1
 1 TRY OUT 25 Responden Variabel Kepuasan / x1 Case Processing Summary N % 25 100.0 Cases Excluded a 0.0 Total 25 100.0 a. Listwise deletion based on all variables in the procedure. Reliability Statistics
Lampiran IV. Hasil Output SPSS Versi 16.0 untuk Analisis Deskriptif
 182 Lampiran IV. Hasil Output SPSS Versi 16.0 untuk Analisis Deskriptif Frequencies Statistics Kinerja Guru Sikap Guru Thdp Kepsek Motivasi Kerja Guru Kompetensi Pedagogik Guru N Valid 64 64 64 64 Missing
TRY OUT 30 Responden Variabel Kompetensi/ x1
 1 TRY OUT 30 Responden Variabel Kompetensi/ x1 Case Processing Summary N % 30 100.0 Cases Excluded a 0.0 Total 30 100.0 a. Listwise deletion based on all variables in the procedure. Reliability Statistics
HASIL OUTPUT SPSS. Reliability Scale: ALL VARIABLES
 139 HASIL OUTPUT SPSS Reliability Scale: ALL VARIABLES Case Processing Summary N % 100 100.0 Cases Excluded a 0.0 Total 100 100.0 a. Listwise deletion based on all variables in the procedure. Reliability
LAMPIRAN I FORMULIR SURVEI
 LAMPIRAN I FORMULIR SURVEI 56 Universitas Kristen Maranatha L.1.1 FORMULIR SURVEI KEBISINGAN LALULINTAS Lokasi : Cuaca : Hari/Tanggal : Surveyor : Periode / menit 5 10 15 20 25 30 35 40 45 50 55 60 65
Lampiran 1. Data Perusahaan
 Lampiran. Data Perusahaan NO PERUSH MV EARN DIV CFO LB.USAHA TOT.ASS ACAP 3 9 8 5 369 9678 376 ADES 75-35 - 6 3559-5977 7358 3 AQUA 5 368 65 335 797 678 53597 BATA 88 5 9 863 958 93 5 BKSL 5.3 -. 9-9 5
SEM over time. Changes in Structure, changes in Means
 SEM over time Changes in Structure, changes in Means Measuring at two time points Is the structure the same Do the means change (is there growth) Create the data x.model
Getting Started with Correlated Component Regression (CCR) in XLSTAT-CCR
 in XLSTAT-CCR") Tutorial 1 Getting Started with Correlated Component Regression (CCR) in XLSTAT-CCR Dataset for running Correlated Component Regression This tutorial 1 is based on data provided by Michel Tenenhaus and
Tutorial 1 Getting Started with Correlated Component Regression (CCR) in XLSTAT-CCR Dataset for running Correlated Component Regression This tutorial 1 is based on data provided by Michel Tenenhaus and
DATA SAMPEL TAHUN 2006
 DATA SAMPEL TAHUN 2006 No Nama Emiten CGPI Kode Saham Harga Saham EPS PER Laba Bersih 1 Bank Niaga 89.27 BNGA 920 54 17.02 647,732 2 Bank Mandiri 83.66 BMRI 2,900 118 24.65 2,422,472 3 Astra International
Universitas Sumatera Utara
 LAMPIRAN I LAMPRIAN PDRB Harga Berlaku NO KAB/KOTA 2005 2006 2007 2008 2009 2010 1 Asahan 15527794210 6429147880 8174125380 9505603030 10435935630 11931676610 2 Dairi 2303591460 2552751860 2860204810 3116742540
LAMPIRAN 1. Lampiran Nama dan Kondisi Perusahaan Textile No Kode Nama Perusahaan Hasil z-score FD Non-FD
 87 LAMPIRAN 1. Lampiran Nama dan Kondisi Perusahaan Textile 2010-2014 No Kode Nama Perusahaan Hasil z-score FD Non-FD 1 ADMG PT Polychem Indonesia Tbk 1,39 1 2 ARGO PT Argo Pantes Tbk 0,93 1 3 CTNX PT
Daftar Nama Perusaahan. yang ada di Industri Consumer Goods periode
 99 Lampiran 1 Daftar Nama Perusaahan yang ada di Industri Consumer Goods periode 2013-2016 KODE AISA ALTO CEKA CLEO DLTA ICBP INDF HOKI MLBI MYOR PSDN ROTI SKBM SKLT STTP ULTJ GGRM HMSP RMBA WIIM CINT
Lampiran i Jadwal Penelitian
 Lampiran i Jadwal Penelitian Tahap penelitian Juni Juli Agust Sept Oktb Pengajuan Judul Penyetujuan proposal Penyelesain proposal Bimbingan skripisi 81 Lampiran i (lanjutan) Daftar Sampel Perusahaan Manufaktur
DATA PENELITIAN 1. CAR CAR (%)
") DATA PENELITIAN. CAR No. Tahun Nama Bank CAR (%) Arta Niaga Kencana 2,8 2 Artha Graha 0,58 3 Asiatic -9,9 4 Danpac 25,74 5 Global International 42, 6 Harmoni 7,47 7 IFI 22,62 8 Bukopin 20,37 9 International
DATA PENELITIAN. CAR No. Tahun Nama Bank CAR (%) Arta Niaga Kencana 2,8 2 Artha Graha 0,58 3 Asiatic -9,9 4 Danpac 25,74 5 Global International 42, 6 Harmoni 7,47 7 IFI 22,62 8 Bukopin 20,37 9 International
Daftar Sampel Perusahaan
 Lampiran i Daftar Sampel Perusahaan NAMA PERUSAHAAN PT. Bank Bukopin Tbk PT. Bank Bumi Arta Tbk PT. Bank Central Asia Tbk PT. Bank CIMB Niaga Tbk PT. Bank Danamon Indonesia Tbk PT. Bank Ekonomi Raharja
Rata-Rata Nilai Debt to Equity Ratio (DER) Perusahaan Otomotif yang 0, ,97 0, ,44 1,9 1,6 1,4 1,7 1,65
 Perusahaan Otomotif yang 0, ,97 0, ,44 1,9 1,6 1,4 1,7 1,65") Lampiran I Rata-Rata Nilai Debt to Equity Ratio (DER) Perusahaan Otomotif yang Terdaftar di Bursa Efek Indonesia Periode 2010-2013 DER No Kode Nama perusahaan 2010 2011 2012 2013 Rata-rata 1. ASII PT Astra
Lampiran I Rata-Rata Nilai Debt to Equity Ratio (DER) Perusahaan Otomotif yang Terdaftar di Bursa Efek Indonesia Periode 2010-2013 DER No Kode Nama perusahaan 2010 2011 2012 2013 Rata-rata 1. ASII PT Astra
CHAPTER V CONCLUSION, SUGGESTION AND LIMITATION. 1. Independent commissioner boards proportion does not negatively affect
 CHAPTER V CONCLUSION, SUGGESTION AND LIMITATION 5.. Conclusion Based on data analysis that has been done, researcher may draw following conclusions:. Independent commissioner boards proportion does not
LAMPIRAN I Data Perusahaan Sampel kode DPS EPS Ekuitas akpi ,97 51,04 40,
 LAMPIRAN I Data Perusahaan Sampel kode DPS EPS Ekuitas 2013 2014 2015 2013 2014 2015 2013 2014 2015 akpi 34 8 9 50,97 51,04 40,67 1.029.336.000.000 1.035.846.000.000 1.107.566.000.000 asii 216 216 177
Team project 2017 Dony Pratidana S. Hum Bima Agus Setyawan S. IIP
 Hak cipta dan penggunaan kembali: Lisensi ini mengizinkan setiap orang untuk menggubah, memperbaiki, dan membuat ciptaan turunan bukan untuk kepentingan komersial, selama anda mencantumkan nama penulis
Perusahaan Consumer Goods yang Terdaftar di BEI ( ) Nama Perusahaan Perusahaan 1
 Nama Perusahaan Perusahaan 1") LAMPIRAN 1 Perusahaan Consumer Goods yang Terdaftar di BEI (2010-2012) No. Sub Sektor Kode Nama Perusahaan Perusahaan 1 ADES Akasha Wira Internasional Tbk 2 AISA Tiga Pilar Sejahtera Food Tbk 3 ALTO Tri
LAMPIRAN 1 Perusahaan Consumer Goods yang Terdaftar di BEI (2010-2012) No. Sub Sektor Kode Nama Perusahaan Perusahaan 1 ADES Akasha Wira Internasional Tbk 2 AISA Tiga Pilar Sejahtera Food Tbk 3 ALTO Tri
: ( .
 2 27 ( ) 2 3 4 2 ( ) 59 Y n n U i ( ) & smith H 98 Draper N Curran PJ,bauer DJ & Willoughby Kam,Cindy &Robert 23 MT24 Jaccard,J & Rebert T23 Franzese 23 Aiken LS & West SG 99 " Multiple Regression Testing
a. Uji kenormalan data model sebaran suhu pada band 7 citra tahun 2001 b. Uji kenormalan data model sebaran suhu pada band 4 citra tahun 2006
 Dependent Variable: Suhu Regression Standardized Residual of Plot P-P Normal Dependent Variable: Suhu Regression Standardized Residual of Plot P-P Normal Lampiran 1. Hasil Uji Normalitas a. Uji kenormalan
LAMPIRAN DAFTAR SAMPEL PENELITIAN. Kriteria No. Nama Perusahaan. Sampel Emiten
 LAMPIRAN DAFTAR SAMPEL PENELITIAN Kode Kriteria No. Nama Perusahaan Sampel Emiten 1 2 3 1. AGRO PT. Bank Agroniaga, Tbk 1 2. BABP PT. Bank ICB Bumiputera Indonesia, Tbk X - 3. BBCA PT. Bank Central Asia,
Stat 301 Lecture 30. Model Selection. Explanatory Variables. A Good Model. Response: Highway MPG Explanatory: 13 explanatory variables
 Model Selection Response: Highway MPG Explanatory: 13 explanatory variables Indicator variables for types of car Sports Car, SUV, Wagon, Minivan 1 Explanatory Variables Engine size (liters) Cylinders (number)
Regression Models Course Project, 2016
 Regression Models Course Project, 2016 Venkat Batchu July 13, 2016 Executive Summary In this report, mtcars data set is explored/analyzed for relationship between outcome variable mpg (miles for gallon)
Lampiran 1. Daftar Sampel Perusahaan
 Lampiran 1. Daftar Sampel Perusahaan NO. KODE NAMA PERUSAHAAN 1 ARNA Arwana Citramulia Tbk. 2 ASII Astra Internastional Tbk. 3 AUTO Astra otoparts Tbk. 4 BTON Betonjaya Manunggal Tbk 5 DVLA Darya-Varia
LAMPIRAN A. Tabulasi Data Perusahaan Sample
 LAMPIRAN A Tabulasi Data Perusahaan Sample Current Ratio (%) NO Kode Emiten Nama Perusahaan ASII Astra International Tbk. 2 AUTO Astra Otoparts Tbk. 3 BATA Sepatu Bata Tbk. 4 BRAM Indo Kordsa Tbk 5 BRNA
Daftar Sampel Perusahaan Pertambangan. 4 BORN Borneo Lumbung Energy & Metal, Tbk
 Lampiran i Daftar Sampel Perusahaan Daftar Sampel Perusahaan Pertambangan No Kode Sampel 1 ADRO Adaro Energy, Tbk 2 ANTM Aneka Tambang (Persero), Tbk 3 ATPK ATPK Resources, Tbk 4 BORN Borneo Lumbung Energy
The influence of age and gender of student motorcycle riders on traffic violations and accidents using a structural equation model
 The influence of age and gender of student motorcycle riders on traffic violations and accidents using a structural equation model I Wayan Suteja 1,*, Mifta Holman 1, D.M. Priyantha Wedagama 2, and P.
LAMPIRAN. Lampiran 1 Data Sampel Penelitian
 LAMPIRAN Lampiran Data Sampel Penelitian Variabel Karakteristik Auditor pada Perusahaan Sampel Ukuran KAP No Kode 2 2 22 23 (Aryanto, Amir AGRO Jusuf, Mawar & Saptoto) 2 BABP 3 BACA 4 BAEK 5 BBCA 6 BBKP
Industry Classification/Stock Name
 Lampiran 1 : Data Perusahaan Sampel Industry Classification/Stock Name 1. AGRICULTURE Plantation 1 AALI Astra Argo Lestari Tbk (S) 2 LSIP PP London Sumatera Tbk (S) 3 SGRO Sampoerna Agro Tbk (S) 4 SMAR
Index 793. identification problems, 431 Image, 205, 206 Impact, 422, 424
 Index ACSI Model, 279, 284, 291, 296 AIC, 200 Algorithm, 56, 62 AMAC, 490 AMOS, 172, 188, 191, 415, 422 ANOVA, 370, 574 asymptotic distribution-free estimation, 634 asymptotic efficiency, 31 asymptotic
Stat 401 B Lecture 31
 Model Selection Response: Highway MPG Explanatory: 13 explanatory variables Indicator variables for types of car Sports Car, SUV, Wagon, Minivan 1 Explanatory Variables Engine size (liters) Cylinders (number)
LAMPIRAN 1 : DAFTAR PERUSAHAAN SAMPEL PERIODE
 69 LAMPIRAN 1 : DAFTAR PERUSAHAAN SAMPEL PERIODE 2008-2010 No Kode Nama Perusahaan 1 AISA PT Tiga Pilar Sejahtera Food Tbk 2 ARNA PT Arwana Citramulia Tbk 3 ASII PT Astra International Tbk 4 AUTO PT Astra
Author s Accepted Manuscript
 Author s Accepted Manuscript Dataset on statistical analysis of Jet A-1 fuel laboratory properties for on-spec into-plane operations Aderibigbe Israel Adekitan, Tobi Shomefun, Temitope M. John, Bukola
Data Nama Perusahaan Perbankan Yang Terdaftar Di BEI.
 LAMPIRAN Lampiran 1 Data Nama Perusahaan Perbankan Yang Terdaftar Di BEI. No Kode Perusahaan Nama Perusahaan 1 AGRO Bank Rakyat Indonesia Agroniaga Tbk 2 BMRI Bank Mandiri (Persero) Tbk 3 BMAS PT Bank
Bayes Factors. Structural Equation Models (SEMs): Schwarz BIC and Other Approximations
: Schwarz BIC and Other Approximations") Bayes Factors in Structural Equation Models (SEMs): Schwarz BIC and Other Approximations Kenneth A. Bollen University of North Carolina, Chapel Hill Surajit Ray SAMSI and University of North Carolina,
Bayes Factors in Structural Equation Models (SEMs): Schwarz BIC and Other Approximations Kenneth A. Bollen University of North Carolina, Chapel Hill Surajit Ray SAMSI and University of North Carolina,
Lampiran 1. Penjualan PT Honda Mandiri Bogor
 LAMPIRAN 64 Lampiran 1. Penjualan PT Honda Mandiri Bogor 29-211 PENJUALAN 29 TYPE JAN FEB MAR APR MEI JUNI JULI AGT SEP OKT NOV DES TOTA JAZZ 16 14 22 15 23 19 13 28 15 28 3 25 248 FREED 23 25 14 4 13
LAMPIRAN. Lampiran 1. Data deviden untuk menghitung economic performance tahun
 LAMPIRAN Lampiran 1. Data deviden untuk menghitung economic performance tahun 2011-2013 No Kode 2011 2012 2013 Div Div Div 1 SMCB 23 32 48 2 UNVR 250 300 300 3 AMFG 80 80 80 4 INTP 263 293 450 5 ICBP 116
From Developing Credit Risk Models Using SAS Enterprise Miner and SAS/STAT. Full book available for purchase here.
 From Developing Credit Risk Models Using SAS Enterprise Miner and SAS/STAT. Full book available for purchase here. About this Book... ix About the Author... xiii Acknowledgments...xv Chapter 1 Introduction...
Level of service model for exclusive motorcycle lane
 387 Level of service model for exclusive motorcycle lane Seyed Farzin Faezi, Hussain Hamid, Sulistyo Arintono and Seyed Rasoul Davoodi Dept. of Civil Engineering, University Putra Malaysia, 43400, UPM
5. CONSTRUCTION OF THE WEIGHT-FOR-LENGTH AND WEIGHT-FOR- HEIGHT STANDARDS
 5. CONSTRUCTION OF THE WEIGHT-FOR-LENGTH AND WEIGHT-FOR- HEIGHT STANDARDS 5.1 Indicator-specific methodology The construction of the weight-for-length (45 to 110 cm) and weight-for-height (65 to 120 cm)
Review of Upstate Load Forecast Uncertainty Model
 Review of Upstate Load Forecast Uncertainty Model Arthur Maniaci Supervisor, Load Forecasting & Energy Efficiency New York Independent System Operator Load Forecasting Task Force June 17, 2011 Draft for
Structural Equation Modeling On the Calculation of Motorcycle Ownership Index Using Amos Software
 IOSR Journal of Business and Management (IOSR-JBM) e-issn: 2278-487X, p-issn: 2319-7668. Volume 20, Issue 4. Ver. IV (April. 2018), PP 35-43 www.iosrjournals.org Structural Equation Modeling On the Calculation
THERMOELECTRIC SAMPLE CONDITIONER SYSTEM (TESC)
") THERMOELECTRIC SAMPLE CONDITIONER SYSTEM (TESC) FULLY AUTOMATED ASTM D2983 CONDITIONING AND TESTING ON THE CANNON TESC SYSTEM WHITE PAPER A critical performance parameter for transmission, gear, and hydraulic
THERMOELECTRIC SAMPLE CONDITIONER SYSTEM (TESC) FULLY AUTOMATED ASTM D2983 CONDITIONING AND TESTING ON THE CANNON TESC SYSTEM WHITE PAPER A critical performance parameter for transmission, gear, and hydraulic
Preface... xi. A Word to the Practitioner... xi The Organization of the Book... xi Required Software... xii Accessing the Supplementary Content...
 Contents Preface... xi A Word to the Practitioner... xi The Organization of the Book... xi Required Software... xii Accessing the Supplementary Content... xii Chapter 1 Introducing Partial Least Squares...
Performance of the Mean- and Variance-Adjusted ML χ 2 Test Statistic with and without Satterthwaite df Correction
 FORDHAM UNIVERSITY THE JESUIT UNIVERSITY OF NEW YORK Performance of the Mean- and Variance-Adjusted ML χ 2 Test Statistic with and without Satterthwaite df Correction Jonathan M. Lehrfeld Heining Cham
Stat 301 Lecture 26. Model Selection. Indicator Variables. Explanatory Variables
 Model Selection Response: Highway MPG Explanatory: 13 explanatory variables Indicator variables for types of car Sports Car, SUV, Wagon, Minivan There is an indicator for Pickup but there are no pickups
PDF hosted at the Radboud Repository of the Radboud University Nijmegen
 PDF hosted at the Radboud Repository of the Radboud University Nijmegen The following full text is a publisher's version. For additional information about this publication click this link. http://hdl.handle.net/2066/112075
tool<-read.csv(file="d:/chilo/regression 7/tool.csv", header=t) tool
 tool") Regression nalysis lab 7 1 Indicator variables 1.1 Import data tool
Regression nalysis lab 7 1 Indicator variables 1.1 Import data tool
Lampiran 1 DAFTAR PERUSAHAAN MANUFAKTUR YANG TERDAFTAR DI BURSA EFEK INDONESIA TAHUN (Menyajikan Laporan Keuangan Secara Berturut-turut)
") Lampiran 1 DAFTAR PERUSAHAAN MANUFAKTUR YANG TERDAFTAR DI BURSA EFEK INDONESIA TAHUN 2014-2016 (Menyajikan Laporan Keuangan Secara Berturut-turut) NO KODE NAMA PERUSAHAAN 1 ALKA PT ALASKA INDONESIA TBK
Lampiran 1 DAFTAR PERUSAHAAN MANUFAKTUR YANG TERDAFTAR DI BURSA EFEK INDONESIA TAHUN 2014-2016 (Menyajikan Laporan Keuangan Secara Berturut-turut) NO KODE NAMA PERUSAHAAN 1 ALKA PT ALASKA INDONESIA TBK
Daftar Perusahaan Real Estate dan Property
 Lampiran 1 Daftar Perusahaan Real Estate dan Property Kriteria No Kode Nama Perusahaan 1 2 3 Sampel 1 APLN Agung Podomoro Land Tbk 2 ASRI Alam Sutera Realty Tbk 1 3 ELTY Bakrieland Development Tbk 4 BAPA
Modeling Ignition Delay in a Diesel Engine
 Modeling Ignition Delay in a Diesel Engine Ivonna D. Ploma Introduction The object of this analysis is to develop a model for the ignition delay in a diesel engine as a function of four experimental variables:
Antonio Olmos Priyalatha Govindasamy Research Methods & Statistics University of Denver
 Antonio Olmos Priyalatha Govindasamy Research Methods & Statistics University of Denver American Evaluation Association Conference, Chicago, Ill, November 2015 AEA 2015, Chicago Ill 1 Paper overview Propensity
APPENDIX A. A.1 Sample of Indian MFIs
 APPENDIX A A.1 Sample of Indian MFIs S.N. Sample of Indian MFIs Inception Legal Form 1 SEWA 1974 BANK 2 CRESA 1980 NGO 3 SKDRDP 1982 NGO 4 GRAMA VIDYALAY 1983 NGO 5 JANODAYA 1987 NGO 6 RASS 1989 NGO 7
R-Sq criterion Data : Surgical room data Chap 9
 Chap 9 - For controlled experiments model reduction is not very important. P 347 - For exploratory observational studies, model reduction is important. Criteria for model selection p353 R-Sq criterion
Lecture 2. Review of Linear Regression I Statistics Statistical Methods II. Presented January 9, 2018
 Review of Linear Regression I Statistics 211 - Statistical Methods II Presented January 9, 2018 Estimation of The OLS under normality the OLS Dan Gillen Department of Statistics University of California,
Robust alternatives to best linear unbiased prediction of complex traits
 Robust alternatives to best linear unbiased prediction of complex traits WHY BEST LINEAR UNBIASED PREDICTION EASY TO EXPLAIN FLEXIBLE AMENDABLE WELL UNDERSTOOD FEASIBLE UNPRETENTIOUS NORMALITY IS IMPLICIT
Lampiran 1. Uji Validitas dan Reliability Variabel Kualitas Pelayanan
 Lampira 1. Uji itas da Reliability Variabel Kualitas Pelayaa 1 Frequecy Percet Percet Percet Kurag setuju 14 14.1 14.1 14.1 Ragu-ragu 57 57.6 57.6 71.7 Setuju 24 24.2 24.2 96.0 Sagat Setuju 4 4.0 4.0 100.0
Drilling Example: Diagnostic Plots
 Math 3080 1. Treibergs Drilling Example: Diagnostic Plots Name: Example March 1, 2014 This data is taken from Penner & Watts, Mining Information, American Statistician 1991, as quoted by Levine, Ramsey
AIC Laboratory R. Leaf November 28, 2016
 AIC Laboratory R. Leaf November 28, 2016 In this lab we will evaluate the role of AIC to help us understand how this index can assist in model selection and model averaging. We will use the mtcars data
WLTP. Proposal for a downscaling procedure for the extra high speed phases of the WLTC for low powered vehicles within a vehicle class
 WLTP Proposal for a downscaling procedure for the extra high speed phases of the WLTC for low powered vehicles within a vehicle class Technical justification Heinz Steven 06.04.2013 1 Introduction The
Cluster Analysis. Presented by: Lauren Franklin and Maria Bakarman COM 631. April 2017
 1 Cluster Analysis Presented by: Lauren Franklin and Maria Bakarman COM 631 April 2017 2 I. Model Data Set: Film and TV Usage National Survey 2015 (Jeffres & Neuendorf) Internal/clustering variables (4
fruitfly fecundity example summary Tuesday, July 17, :13:19 PM 1
 fruitfly fecundity example summary Tuesday, July 17, 2018 02:13:19 PM 1 The UNIVARIATE Procedure Variable: fecund line = NS Basic Statistical Measures Location Variability Mean 33.37200 Std Deviation 8.94201
EMPIRICAL ANALYSIS ON ROAD TRAFFIC CRASHES IN ANAMBRA STATE, NIGERIA: ACCIDENT PREDICTION MODELING USING REGRESSION APPROACH
 EMPIRICAL ANALYSIS ON ROAD TRAFFIC CRASHES IN ANAMBRA STATE, NIGERIA: ACCIDENT PREDICTION MODELING USING REGRESSION APPROACH Obubu M a*, Konwe C.S b, Nwabenu D.C c, Omokri Peter A d, Chijioke M e a Department
LAMPIRAN 1. Tabel 1. Data Indeks Harga Saham PT. ANTAM, tbk Periode 20 Januari Februari 2012
 LAMPIRAN 1 Tabel 1. Data Indeks Harga Saham PT. ANTAM, tbk Periode 20 Januari 2011 29 Februari 2012 No Tanggal Indeks Harga Saham No Tanggal Indeks Harga Saham 1 20-Jan-011 2.35 138 05-Agst-011 1.95 2
Basic SAS and R for HLM
 Basic SAS and R for HLM Edps/Psych/Soc 589 Carolyn J. Anderson Department of Educational Psychology c Board of Trustees, University of Illinois Spring 2019 Overview The following will be demonstrated in
MOTORCYCLE ACCIDENT MODEL ON THE ROAD SECTION OF HIGHLANDS REGION BY USING GENELARIZED LINEAR MODEL
 International Journal of Civil Engineering and Technology (IJCIET) Volume 8, Issue 10, October 2017, pp. 1249-1258 1248, Article ID: IJCIET_08_10_127 Available online at http://http://www.iaeme.com/ijciet/issues.asp?jtype=ijciet&vtype=8&itype=10
Stat 401 B Lecture 27
 Model Selection Response: Highway MPG Explanatory: 13 explanatory variables Indicator variables for types of car Sports Car, SUV, Wagon, Minivan There is an indicator for Pickup but there are no pickups
The PRINCOMP Procedure
 Grizzly Bear Project - Coastal Sites - invci 15:14 Friday, June 11, 2010 1 Food production variables The PRINCOMP Procedure Observations 16 Variables 4 Simple Statistics PRECIP ndvi aet temp Mean 260.8102476
Motor Trend Yvette Winton September 1, 2016
 Motor Trend Yvette Winton September 1, 2016 Executive Summary Objective In this analysis, the relationship between a set of variables and miles per gallon (MPG) (outcome) is explored from a data set of
Confirmatory factor analysis of the Behaviour of Young Novice Drivers Scale (BYNDS)
") Confirmatory factor analysis of the Behaviour of Young Novice Drivers Scale (BYNDS) Author Scott-Parker, B., Watson, B., King, M., Hyde, M. Published 2012 Journal Title Accident Analysis & Prevention DOI
Confirmatory factor analysis of the Behaviour of Young Novice Drivers Scale (BYNDS) Author Scott-Parker, B., Watson, B., King, M., Hyde, M. Published 2012 Journal Title Accident Analysis & Prevention DOI
Design and Calibration of the Jaguar XK Adaptive Cruise Control System. Tim Jagger MathWorks International Automotive Conference 2006
 Design and Calibration of the Jaguar XK Adaptive Cruise Control System Tim Jagger MathWorks International Automotive Conference 26 JAGUAR XK Page 3 ADAPTIVE CRUISE CONTROL(ACC) MODEL BASED CALIBRATION
The Session.. Rosaria Silipo Phil Winters KNIME KNIME.com AG. All Right Reserved.
 The Session.. Rosaria Silipo Phil Winters KNIME 2016 KNIME.com AG. All Right Reserved. Past KNIME Summits: Merging Techniques, Data and MUSIC! 2016 KNIME.com AG. All Rights Reserved. 2 Analytics, Machine
EXST7034 Multiple Regression Geaghan Chapter 11 Bootstrapping (Toluca example) Page 1
 Page 1") Chapter 11 Bootstrapping (Toluca example) Page 1 Toluca Company Example (Problem from Neter, Kutner, Nachtsheim & Wasserman 1996,1.21) A particular part needed for refigeration equipment replacement parts
Chapter 11 Bootstrapping (Toluca example) Page 1 Toluca Company Example (Problem from Neter, Kutner, Nachtsheim & Wasserman 1996,1.21) A particular part needed for refigeration equipment replacement parts
Reliability and Validity of Seat Interface Pressure to Quantify Seating Comfort in Motorcycles
 Reliability and Validity of Seat Interface Pressure to Quantify Seating Comfort in Motorcycles Sai Praveen Velagapudi a,b, Ray G. G b a Research & Development, TVS Motor Company, INDIA; b Industrial Design
Lampiran 1. Tabel Sampel Penelitian
 Lampiran 1 Tabel Sampel Penelitian No Kode Emiten Nama Perusahaan Tanggal IPO 1 APLN Agung Podomoro Land Tbk 11 Nov 2010 2 ASRI Alam Sutera Reality Tbk 18 Dec 2007 3 BAPA Bekasi Asri Pemula Tbk 14 Jan
Improvement Curves: Beyond The Basics
 Improvement Curves: Beyond The Basics March 27, 2017 Kurt Brunner Kurt.r.brunner@leidos.com 310.524.3151 Agenda Presented at the ICEAA Southern California Chapter Workshop March 27, 2017 Do They Even Exist?
Appendices for: Statistical Power in Analyzing Interaction Effects: Questioning the Advantage of PLS with Product Indicators
 Appendices for: Statistical Power in Analyzing Interaction Effects: Questioning the Advantage of PLS with Product Indicators Dale Goodhue Terry College of Business MIS Department University of Georgia
Accelerating the Development of Expandable Liner Hanger Systems using Abaqus
 Accelerating the Development of Expandable Liner Hanger Systems using Abaqus Ganesh Nanaware, Tony Foster, Leo Gomez Baker Hughes Incorporated Abstract: Developing an expandable liner hanger system for
Appendix B STATISTICAL TABLES OVERVIEW
 Appendix B STATISTICAL TABLES OVERVIEW Table B.1: Proportions of the Area Under the Normal Curve Table B.2: 1200 Two-Digit Random Numbers Table B.3: Critical Values for Student s t-test Table B.4: Power
sweetgum1.r: AIC(m1.t5,m2.t5,m3.t5,m4.t5,m5.t5,m6.t5,m7.t5) summary(m3.t5)
 summary(m3.t5)") sweetgum1.r: swtgum
sweetgum1.r: swtgum
female male help("predict") yhat age
 yhat age") 30 40 50 60 70 female male 1.0 help("predict") 0.5 yhat 0.0 0.5 1.0 30 40 50 60 70 age 30 40 50 60 70 1.5 1.0 female male help("predict") 0.5 yhat 0.0 0.5 1.0 1.5 30 40 50 60 70 age 2 Wald Statistics Response:
30 40 50 60 70 female male 1.0 help("predict") 0.5 yhat 0.0 0.5 1.0 30 40 50 60 70 age 30 40 50 60 70 1.5 1.0 female male help("predict") 0.5 yhat 0.0 0.5 1.0 1.5 30 40 50 60 70 age 2 Wald Statistics Response:
Development of Traffic Accident Prediction Models to Improve Traffic Safety and to Reduce Traffic Accident Severity and Rate in Jordan
 Development of Traffic Accident Prediction Models to Improve Traffic Safety and to Reduce Traffic Accident Severity and Rate in Jordan Mohammad Abojaradeh*, Ph.D., P.E. Faculty of Engineering, Department
Professor Dr. Gholamreza Nakhaeizadeh. Professor Dr. Gholamreza Nakhaeizadeh
 Statistic Methods in in Data Mining Business Understanding Data Understanding Data Preparation Deployment Modelling Evaluation Data Mining Process (Part 2) 2) Professor Dr. Gholamreza Nakhaeizadeh Professor
FINANCIAL PERFORMANCE OF TWO WHEELER INDUSTRY IN INDIA
 I J A B E R, Vol. 14, No. 6, (2016): 3607-3621 FINANCIAL PERFORMANCE OF TWO WHEELER INDUSTRY IN INDIA A. Aparna * Abstract: Over the past many years, two wheelers have been garnering an important space
Lampiran 1 Tabel 3.1 Sampel No. Kode Nama Perusahaan Sumber : didownload tanggal 13 November 2016 (data diolah)
") 72 Lampiran 1 Tabel 3.1 Sampel No. Kode Nama Perusahaan 1 ALKA PT. Alakasa Industrindo Tbk 2 BIMA PT. Primarindo Asia Infrastructure Tbk 3 BRNA PT. Berlina Tbk 4 ETWA PT. Eterindo Wahanatama Tbk 5 FASW
72 Lampiran 1 Tabel 3.1 Sampel No. Kode Nama Perusahaan 1 ALKA PT. Alakasa Industrindo Tbk 2 BIMA PT. Primarindo Asia Infrastructure Tbk 3 BRNA PT. Berlina Tbk 4 ETWA PT. Eterindo Wahanatama Tbk 5 FASW
delivery<-read.csv(file="d:/chilo/regression 4/delivery.csv", header=t) delivery
 delivery") Regression Analysis lab 4 1 Model Adequacy Checking 1.1 Import data delivery
Regression Analysis lab 4 1 Model Adequacy Checking 1.1 Import data delivery
Motor Trend MPG Analysis
 Motor Trend MPG Analysis SJ May 15, 2016 Executive Summary For this project, we were asked to look at a data set of a collection of cars in the automobile industry. We are going to explore the relationship
Component Mass Study Statistical Benchmarking
 Component Mass Study Statistical Benchmarking Benoit Singher, A2Mac1 Automotive Benchmarking Russ Balzer, WorldAutoSteel Donald Malen, University of Michigan GDIS217 Statistical mass benchmarking Programs
DEFECT DISTRIBUTION IN WELDS OF INCOLOY 908
 PSFC/RR-10-8 DEFECT DISTRIBUTION IN WELDS OF INCOLOY 908 Jun Feng August 10, 2010 Plasma Science and Fusion Center Massachusetts Institute of Technology Cambridge, MA 02139, USA This work was supported
DOT HS Summary of Statistical Findings November Statistical Methodology to Make Early Estimates of Motor Vehicle Traffic Fatalities
 TRAFFIC SAFETY FACTS Research Note DOT HS 811 123 Summary of Statistical Findings November 2010 Statistical Methodology to Make Early Estimates of Motor Vehicle Traffic Fatalities Highlights Beginning
SAN PEDRO BAY PORTS YARD TRACTOR LOAD FACTOR STUDY Addendum
 SAN PEDRO BAY PORTS YARD TRACTOR LOAD FACTOR STUDY Addendum December 2008 Prepared by: Starcrest Consulting Group, LLC P.O. Box 434 Poulsbo, WA 98370 TABLE OF CONTENTS 1.0 EXECUTIVE SUMMARY...2 1.1 Background...2
Oil Palm Ripeness Detector (OPRID) and Non-Destructive Thermal Method of Palm Oil Quality Estimation
 and Non-Destructive Thermal Method of Palm Oil Quality Estimation") Oil Palm Ripeness Detector (OPRID) and Non-Destructive Thermal Method of Palm Oil Quality Estimation Abdul Rashid Mohamed Shariff, Shahrzad Zolfagharnassab, Alhadi Aiad H. Ben Dayaf, Goh Jia Quan, Adel
Oil Palm Ripeness Detector (OPRID) and Non-Destructive Thermal Method of Palm Oil Quality Estimation Abdul Rashid Mohamed Shariff, Shahrzad Zolfagharnassab, Alhadi Aiad H. Ben Dayaf, Goh Jia Quan, Adel
COMPARING THE PREDICTIVE ABILITY OF PLS AND COVARIANCE MODELS
 COMPARING THE PREDICTIVE ABILITY OF PLS AND COVARIANCE MODELS Completed Research Paper Joerg Evermann Memorial University of Newfoundland St. John's, Canada jevermann@mun.ca Mary Tate Victoria University
Technical Papers supporting SAP 2009
 Technical Papers supporting SAP 29 A meta-analysis of boiler test efficiencies to compare independent and manufacturers results Reference no. STP9/B5 Date last amended 25 March 29 Date originated 6 October
The Degrees of Freedom of Partial Least Squares Regression
 The Degrees of Freedom of Partial Least Squares Regression Dr. Nicole Krämer TU München 5th ESSEC-SUPELEC Research Workshop May 20, 2011 My talk is about...... the statistical analysis of Partial Least