Cluster Analysis. Presented by: Lauren Franklin and Maria Bakarman COM 631. April 2017
|
|
|
- Dorcas Booth
- 5 years ago
- Views:
Transcription
1 1 Cluster Analysis Presented by: Lauren Franklin and Maria Bakarman COM 631 April 2017
2 2 I. Model Data Set: Film and TV Usage National Survey 2015 (Jeffres & Neuendorf) Internal/clustering variables (4 scales from 25 items total): Tech Savvy A 6-item additive scale (alpha =.770) consisting of: Q28A- I often watch videos on my cellphone Q28B-I often search for videos on YouTube to watch Q28C- I often share videos via Facebook Q28D- I often share videos on Instagram Q28E I like to watch TV shows on laptop/ tablets/ phone Q28F- I like to make short videos that I can share with others (All measured on a 7 point response scale, where 1-Not at all like and 7-Very much like) Traditionalist A 4-item additive scale (alpha =.612) consisting of: Q29B- I am more traditionalist preferring to read physical copies Q29C- I like the variety of entertainment available today but sometimes I feel it is too much Q29D I think that the new technologies have begun to dominate our lives Q29G I still rather talk to people over the phone than text (All measured on a 7 point Likert like response scale, where 1-completely disagree and 7-completely agree.) Leisure Tech Savvy A 6-item additive scale (alpha =.525) consisting of: Q3G- watch a film not at a theater Q3H- surf the internet for pleasure not work Q3I- go to see live musical concert/ events Q3J- go on Facebook Q3K- play video games in some device Q3O- text family and friends rather than calling them on phones (All measured on an 8 point response scale, where 1-Never and 8-Several times each day) Leisure Traditionalist A 8-item additive scale (alpha =.695) consisting of: Q3B- listen to the radio Q3C- read a magazine Q3D- read a book Q3E- read a newspaper Q3F- go out to see a film in a theater Q3L- go to see live musical concert/events Q3A- watch television Q3M- go to see live plays perform in the theater
3 3 (All measured on an 8 point response scale, where 1-Never and 8-Several times each day) External Variables/Profiling Variables: Income: 1= or less 2= to = to = to = to = to = to = to = to =10-150,001 or more G1: Male = 0, Female = 1 Q18d: how often watch sci-fi genre Q18dd: how often watch superhero Q18q: how often watch chick flicks Q18g: how often watch film noir Q18b: how often watch western (All measured on an 6 point Likert like response scale, where 1-never 6-All the time)


4 4 II. Running SPSS 1- Analyze - Classify - Hierarchical Cluster. 2- Select your Internal Variables for analysis. The four scales: Techsavvy, Traditionalists. Leisure Techsavvy, and Leisure Traditionalists
.")
5 5 3- Click Statistics Box 4- Make sure that the Agglomeration Schedule box is checked. 5- Then, under Cluster Membership, check the circle Range of Solutions. 6- Indicate your chosen minimum number of and the maximum number of. (e.g., 3 to 6, or 4 to 7). 7- Then click Continue. 8- Click Plots Box

6 9- Note that you must select either the Dendrogram box or something under Icicle. We ran Icicle, All Clusters. 10- Then click Continue. 11- Click Method Box. 12- From Cluster Method drop down arrow Select Ward s Method. 6


7 13- Under Measure, select Interval circle. 7
 into Minimum number of box and type your chosen maximum (e.g., 7) into Maximum number of box. 18- Then click Continue.")
8 8 14- From drop down arrow select Squared Euclidean Distance. 15- Then click Continue. 16- Click Box. 17- Under Save Cluster Membership select the circle Range of Solutions. Type your chosen minimum (e.g., 4) into Minimum number of box and type your chosen maximum (e.g., 7) into Maximum number of box. 18- Then click Continue. 19- Click OK Box (or Paste to save syntax and then run). Note: This point marks the end of the actual Cluster procedure in SPSS. The Hierarchical Cluster Analysis procedure has produced an Agglomerative Schedule and a Cluster Membership Table in SPSS output. This procedure has also created and saved at the end of the dataset new nominal variables. In our specific example, a 4-cluster variable, a 5-cluster variable, a 6-cluster variable, and a 7-cluster variable have all been produced and added to the end of the data set. ****************************************************************************


9 9 Next: Further Frequencies and ANOVA analysis procedures will help decide which cluster solution to ultimately select. Now we examine the cluster groupings. 1- Analyze Descriptive Statistics Frequencies 2- Select the cluster variables. These are the newly created variables that will be at bottom of SPSS list. Ward Method [Clus7_1] (Note we changed name in label to Ward Method 7 Cluster so easier to identify distinctions in SPSS output charts) Ward Method [Clus6_1] (Note we changed name in label to Ward Method 6 Cluster so
![10 easier to identify distinctions in SPSS output charts) Ward Method [Clus5_1] (Note we changed name in label to Ward Method 5 Cluster so easier to identify distinctions in SPSS output charts) Ward](/docs-images/87/95680355/images/10-0.jpg "Method [Clus4_1] (Note we changed name in label to Ward Method 4 Cluster so easier to identify distinctions in SPSS output charts). 3- Click OK Box.")
10 10 easier to identify distinctions in SPSS output charts) Ward Method [Clus5_1] (Note we changed name in label to Ward Method 5 Cluster so easier to identify distinctions in SPSS output charts) Ward Method [Clus4_1] (Note we changed name in label to Ward Method 4 Cluster so easier to identify distinctions in SPSS output charts). 3- Click OK Box. Next: Run Means (with ANOVA tests) to compare means among the. Analyze Compare Means Means
 and enter into the Dependent")

11 11 4- Select the four scales (Internal Variables) and enter into the Dependent List. 5- Select the 7 total External Variables and enter into the Dependent List.

12 12 NOTE: Actions that follow are based on the decision to use only the 4-cluster solution for further analyses. 6- Select Ward Method 4 Cluster and enter into Independent List. NOTE: You could run all the cluster-created variables, by also including Ward Method 5, Ward Method 6 and Ward Method 7 in the Independent List to see ANOVA means comparison based upon various cluster solutions.


13 13 7- Click Options Box. 8- Click Anova table and eta to make sure you get an F-test comparing the means.
14 14 III. SPSS Output COMPUTE LesiureTechSavvyRev=63 - LesiureTechsavvy. EXECUTE. COMPUTE LesiureTradtionalistRev=72 - LesiureTradtionalist. EXECUTE. CLUSTER LesiureTradtionalistRev LesiureTechSavvyRev Technologysavvy Tradtionalist /METHOD WARD /MEASURE=SEUCLID /PRINT SCHEDULE CLUSTER(4,7) /PLOT VICICLE /SAVE CLUSTER(4,7). Cluster: Case Processing Summary a,b Cases Valid Missing Total N Percent N Percent N Percent a. Squared Euclidean Distance used b. Ward Linkage Ward Linkage Stage Agglomeration Schedule Cluster Combined Coefficient Stage Cluster First Appears Cluster 1 Cluster 2 s Cluster 1 Cluster 2 Next Stage
15
16
17
18
19
20
21
22
23 23 Cluster membership Case 7 Clusters Cluster Membership 6 Clusters 5 Clusters 4 Clusters
24
25
26
27
28
29
30
31
32 32 FREQUENCIES VARIABLES=CLU7_1 CLU6_1 CLU5_1 CLU4_1 /STATISTICS=STDDEV VARIANCE MEAN MEDIAN MODE SKEWNESS SESKEW KU RTOSIS SEKURT /ORDER=ANALYSIS. Frequencies Ward Method 7 Clusters Statistics Ward Method 6 Clusters Ward Method 5 Ward Method 4 N Valid Missing Mean Median Mode Std. Deviation Variance Skewness Std. Error of Skewness Kurtosis Std. Error of Kurtosis
33 33 Ward Method 7 Clusters Frequenc y Percent Valid Percent Cumulative Percent Valid Total Missin Syste g m Total Frequency Table: Ward Method 6 Clusters Frequenc y Percent Valid Percent Cumulative Percent Valid Total Missin Syste g m Total
34 34 Ward Method 5 Frequenc y Percent Valid Percent Cumulative Percent Valid Total Missin Syste g m Total Ward Method 4 Frequenc y Percent Valid Percent Cumulative Percent Valid Total Missin Syste g m Total
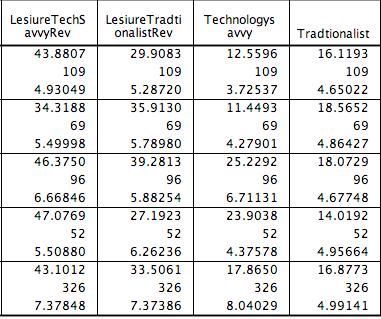
35 35 MEANS TABLES=LesiureTechSavvyRev LesiureTradtionalistRev Technologysavvy Tradtionalist BY CLU7_1 CLU6_1 CLU5_1 CLU4_1 /CELLS=MEAN COUNT STDDEV /STATISTICS ANOVA. LesiureTechSa vvyrev * Ward Method 7 Clusters LesiureTradtion alistrev * Ward Method 7 Clusters Technologysav vy * Ward Method 7 Clusters Tradtionalist * Ward Method 7 Clusters LesiureTechSa vvyrev * Ward Method 6 Clusters LesiureTradtion alistrev * Ward Method 6 Clusters Technologysav vy * Ward Method 6 Clusters Tradtionalist * Ward Method 6 Clusters Case Processing Summary Cases Included Excluded Total N Percent N Percent N Percent
36 36 LesiureTechSa vvyrev * Ward Method 5 LesiureTradtion alistrev * Ward Method 5 Technologysav vy * Ward Method 5 Tradtionalist * Ward Method 5 LesiureTechSa vvyrev * Ward Method 4 LesiureTradtion alistrev * Ward Method 4 Technologysav vy * Ward Method 4 Tradtionalist * Ward Method 4
37 37 LesiureTechSavvyRev LesiureTradtionalistRev Technologys avvy Tradtionalist * Ward Method 4 Ward Method 4 LesiureTech SavvyRev Report LesiureTradt ionalistrev Technologys avvy Tradtionalis t 1 Mean N Std. Deviation Mean N Std. Deviation Mean N Std. Deviation Mean N Std. Deviation Total Mean N Std. Deviation
38 38 Anova Table LesiureTechSavvyRev * Ward Method 4 LesiureTradtionalistRev * Ward Method 4 Technologysavvy * Ward Method 4 Tradtionalist * Ward Method 4 Sum of Squares df Mean Square F Sig. Between Groups (Combined) Within Groups Total Between Groups (Combined) Within Groups Total Between Groups (Combined) Within Groups Total Between Groups (Combined) Within Groups Total Measures of Association LesiureTechSa vvyrev * Ward Method 4 LesiureTradtion alistrev * Ward Method 4 Eta Eta Squared
39 39 Technologysav vy * Ward Method 4 Tradtionalist * Ward Method MEANS TABLES=Income Age Q18g Genderdummy LesiureTechSavvyRev LesiureTradtionali strev Technologysavvy Tradtionalist Q18d Q18dd Q18b Q18q BY CLU4_1 /CELLS=MEAN COUNT STDDEV /STATISTICS ANOVA. Income * Ward Method 4 Age * Ward Method 4 Q18g. How often Film noir films * Ward Method 4 Genderdummy * Ward Method 4 LesiureTechSa vvyrev * Ward Method 4 LesiureTradtion alistrev * Ward Method 4 Case Processing Summary Cases Included Excluded Total N Percent N Percent N Percent % % % % % % % % %
40 40 Technologysav vy * Ward Method 4 Tradtionalist * Ward Method 4 Q18d. How often Science fiction * Ward Method 4 Q18dd. How often Super Hero films * Ward Method 4 Q18b. How often Westerns * Ward Method 4 Q18q. How often Chick flicks * Ward Method 4
41 41
42 42
43 Income * Ward Method 4 Age * Ward Method 4 Q18g. How often Film noir films * Ward Method 4 Genderdummy * Ward Method 4 LesiureTechSavvy Rev * Ward Method 4 LesiureTradtionali strev * Ward Method 4 Technologysavvy * Ward Method 4 Tradtionalist * Ward Method 4 Q18d. How often Science fiction * Ward Method Q18dd. How often Super Hero films * Ward Method 4 Q18b. How often Westerns * Ward Method 4 Q18q. How often Chick flicks * Ward Method 4 ANOVA Table 43 Sum of Squares df Mean Square F Sig. Between Groups (Combined) Within Groups Total Between Groups (Combined) Within Groups Total Between Groups (Combined) Within Groups Total Between Groups (Combined) Within Groups Total Between Groups (Combined) Within Groups Total Between Groups (Combined) Within Groups Total Between Groups (Combined) Within Groups Total Between Groups (Combined) Within Groups Total Between Groups (Combined) Within Groups Total Between Groups (Combined) Within Groups Total Between Groups (Combined) Within Groups Total Between Groups (Combined) Within Groups Total
44 44 Measures of Association Income * Ward Method 4 Age * Ward Method 4 Q18g. How often Film noir films * Ward Method 4 Genderdummy * Ward Method 4 LesiureTechSa vvyrev * Ward Method 4 LesiureTradtion alistrev * Ward Method 4 Technologysav vy * Ward Method 4 Tradtionalist * Ward Method 4 Eta Eta Squared
45 45 Q18d. How often Science fiction * Ward Method 4 Q18dd. How often Super Hero films * Ward Method 4 Q18b. How often Westerns * Ward Method 4 Q18q. How often Chick flicks * Ward Method
46 46 IV. Tabling Table 1. Cluster Profiling Cluster name (Cluster 4) 1: Average 2: Traditionalist 3: Yea- Sayers 4: Tech Savvy Total Variables 1 (109) 2 (69) 3 (96) 4 (52) Internal variables Tech Savvy <.001 Traditionalist <.001 Leisure Tech Savvy <.001 Leisure Traditionalist < External Variables Q34: What is your annual income? Q30: Male=0, Female=1 Q3e1: Age <.001 Q18b: How often western Q18d: How often sci-fi Q18dd: How often superhero Q18g: How often film noir Q18q: How often chick flicks < F Sig. Note. Post hoc tests were not run, so differences in means across the four should be interpreted with caution.
47 47 V. Write-up The Film and TV Usage National Survey 2015 (Jeffres & Neuendorf) was chosen for cluster analysis. Four internal or independent variables were made into additive scales. Scale one, named Tech savvy, includes six items all measured on a 7 point response scale where 1-Not at all like and 7-Very much like: I often watch videos on my cellphone (Q28a), I often search videos on YouTube to watch (Q28b), I often share videos via Facebook (28c), I often share videos on Instagram (Q28d), I like to watch TV shows on a laptop/tablet/phone when I m stuck somewhere (Q28e), and I like to make short videos that I can share with others (29f) (alpha=.770). Scale two, named Traditionalist, includes four items all measured on a 7 point Likert response scale where 1-completely disagree and 7-completely agree: I m more a traditionalist, preferring to read physical copies of books (Q29b), I like the variety of entertainment available today, but sometimes feel it s too much (Q29c), I think that the new technology have begun to dominate our lives (Q29d), and I would still rather talk to people over the phone than text (Q29g) (alpha=.612). Scale three, named Tech Savvy Leisure, includes six items all measured on an 8 point response scale where 1=never and 8=several times a day: Watch film not at a theater (Q3g), Surf the internet for pleasure, not work (Q3h), Check my (Q3i), Go on Facebook (Q3j), Play video games on some device (Q3k), and Text family and friends rather than call them (Q3o) (alpha=.525). Scale four, named Traditionalist Leisure, includes eight items measured on an 8 point response scale where 1=never and 8=several times each day: Listen to the radio (Q3b), read a magazine (Q3c), read a book (Q3d), read a newspaper (Q3e), go out to see a film in a theater (Q3f), go to see live musical concert/ events (Q3L), watch television (Q3a), go to see a live play preformed in a theater (Q3m) (alpha=.695).
48 48 The eight external or profiling variables include: Income, age, gender (femaleness), how often film noir (Q18g), how often sci-fi (Q18d), how often superhero (Q18dd), how often western (Q18b), and how often chick flicks (Q18a) (the Q18 items are all measured on a 6 point response scale, where 1-never [watch] and 6-[watch] all the time). A hierarchical agglomerative cluster analysis was performed to discover the natural grouping of the participants. A four cluster solution was chosen using Ward s Method (with squared Euclidian distances). The choice of four was supported by examination of changes in the agglomeration coefficients from the agglomeration table. Dendrogram and icicle plots were run to give a visual representation of the data. MEANS with ANOVA analyses were conducted (a) to examine the cluster sizes to make sure all had a reasonable n, and (b) to examine the differences among the four with regard to all four internal variables. As expected, all internal/clustering variables were significantly different among the four. The four have been named: Average, Traditional, Yeasayers, and Tech Savvy (See Table 1). To further profile the four, a complementary set of ANOVA analyses was conducted to test the significance of the differences among the four against the eight demographic/external variables. All four of the internal variables showed highly significant differences across the four (p<.001). Of the external variables, all showed significant differences (p<.05) across the four, but gender (femaleness) and sci-fi were not significant. Cluster 1 (n=109) is labeled Average because this group appeared to be average for each variable. Cluster 2 (n=69) is labeled Traditional because of the high means for the traditional leisure and traditional media scales. This cluster also tends to be rich, older, and likes film noir. Cluster 3 (n=96) is labeled yea-sayers because of the high means for all variables.
49 49 This group tends to report liking everything, but not the western genre. Cluster 4 (n=52) is labeled Tech Savvy because of the high means for technology use and technology leisure scales. This group also tends to be the youngest, lowest income, and does not like film noir or sci-fi genres.
Lampiran IV. Hasil Output SPSS Versi 16.0 untuk Analisis Deskriptif
 182 Lampiran IV. Hasil Output SPSS Versi 16.0 untuk Analisis Deskriptif Frequencies Statistics Kinerja Guru Sikap Guru Thdp Kepsek Motivasi Kerja Guru Kompetensi Pedagogik Guru N Valid 64 64 64 64 Missing
2016 Car Tech Impact Study. January 2016
 2016 Car Tech Impact Study January 2016 Objectives & Methodology Objectives Identify vehicle technologies that are currently being used and that are must haves for future vehicle purchases Determine how
HASIL OUTPUT SPSS. Reliability Scale: ALL VARIABLES
 139 HASIL OUTPUT SPSS Reliability Scale: ALL VARIABLES Case Processing Summary N % 100 100.0 Cases Excluded a 0.0 Total 100 100.0 a. Listwise deletion based on all variables in the procedure. Reliability
Passenger seat belt use in Durham Region
 Facts on Passenger seat belt use in Durham Region June 2017 Highlights In 2013/2014, 85 per cent of Durham Region residents 12 and older always wore their seat belt when riding as a passenger in a car,
Senior Statewide Survey Results Wave 2
 Texas Higher Education Opportunity Project Principal Investigator: Marta Tienda, Princeton University Co-Investigator: Teresa Sullivan, University of Texas at Austin Senior Statewide Survey Results Wave
TRY OUT 30 Responden Variabel Kompetensi/ x1
 1 TRY OUT 30 Responden Variabel Kompetensi/ x1 Case Processing Summary N % 30 100.0 Cases Excluded a 0.0 Total 30 100.0 a. Listwise deletion based on all variables in the procedure. Reliability Statistics
TRY OUT 25 Responden Variabel Kepuasan / x1
 1 TRY OUT 25 Responden Variabel Kepuasan / x1 Case Processing Summary N % 25 100.0 Cases Excluded a 0.0 Total 25 100.0 a. Listwise deletion based on all variables in the procedure. Reliability Statistics
Student questionnaire codebook
 COUNTRY Country three-digit code (A3) 2-4 SCHOOLID School ID (unique) (A5) 5-9 STIDSTD Student ID (A5) 10-14 SUBNATIO Subnational entities (A2) 16-17 ST01Q01 Birth Day - Q1 Day (A2) 19-20 9 9 ST01Q02 Birth
Who has trouble reporting prior day events?
 Vol. 10, Issue 1, 2017 Who has trouble reporting prior day events? Tim Triplett 1, Rob Santos 2, Brian Tefft 3 Survey Practice 10.29115/SP-2017-0003 Jan 01, 2017 Tags: missing data, recall data, measurement
LISTEN A MINUTE.com. Driving. One minute a day is all you need to improve your listening skills.
 LISTEN A MINUTE.com Driving http://www.listenaminute.com/d/driving.html One minute a day is all you need to improve your listening skills. Focus on new words, grammar and pronunciation in this short text.
. Enter. Model Summary b. Std. Error. of the. Estimate. Change. a. Predictors: (Constant), Emphaty, reliability, Assurance, responsive, Tangible
, Emphaty, reliability, Assurance, responsive, Tangible") LAMPIRAN Variables Entered/Removed b Variables Model Variables Entered Removed Method 1 Emphaty, reliability, Assurance, responsive, Tangible a. Enter a. All requested variables entered. b. Dependent Variable:
LAMPIRAN Variables Entered/Removed b Variables Model Variables Entered Removed Method 1 Emphaty, reliability, Assurance, responsive, Tangible a. Enter a. All requested variables entered. b. Dependent Variable:
Puerto Rico: Impact of the Car Seat Campaign
 Puerto Rico: Impact of the Car Seat Campaign Final Report Submitted to: Traffic Safety Commission of Puerto Rico February 9, 2018 Puerto Rico: Impact of the Car Seat Campaign TABLE OF CONTENT INTRODUCTION...
Results from the North American E-bike Owner Survey
 Results from the North American E-bike Owner Survey TRB Emerging Vehicles for Low Speed Transportation Subcommittee January 2018 John MacArthur Research Associate Portland State University UNITED STATES
Driver perceptions of the benefits of reducing their driving speed on safety, emissions, and stress and road rage
 Driver perceptions of the benefits of reducing their driving speed on safety, emissions, and stress and road rage Dr A. Debnath, Prof N. Haworth, Prof A. Raktonirainy, A. Graves, Dr I. Jeffreys Australasian
The purpose of this experiment was to determine if current speed limit postings are
 Memorandum To: Jen Keidel From: Christina Ochs (Seat 28) Date: 1/19/12 Re: Spot Speed Memo 1. Introduction The purpose of this experiment was to determine if current speed limit postings are satisfactory
Database of LBACs... separate excel-file
 1 When Luxury Meets Art : Appendices List of appendices I. Data bases Appendix n 3: Database of LBACs... separate excel-file II. Sample demographics Appendix n 4: Comparison between the luxury brands with/without
Canadian College Student Survey, Canadian Millennium Scholarship Foundation. Frequencies
 Canadian College Student Survey, 2004 Canadian Millennium Scholarship Foundation Frequencies reg Region 1 BC & Territories 2912 31.0 31.0 31.0 2 Western Canada 2362 25.1 25.1 56.1 3 Ontario 1793 19.1 19.1
Barrie D. Fitzgerald Senior Research Analyst, Valdosta State University Sarah E. Hough Research Analyst, Valdosta State University Tiffany S.
 You re Hired Now What? Barrie D. Fitzgerald Senior Research Analyst, Valdosta State University Sarah E. Hough Research Analyst, Valdosta State University Tiffany S. Soma Research Analyst, Valdosta State
Intercity Travel in Northeastern Rural Regions of the U.S.
 TRC Report #15-007 Page i A Report from the University of Vermont Transportation Research Center Intercity Travel in Northeastern Rural Regions of the U.S. TRC Report 15-007 Neely, Lee, Sentoff TRC Report
MOTORISTS' PREFERENCES FOR DIFFERENT LEVELS OF VEHICLE AUTOMATION
 UMTRI-2015-22 JULY 2015 MOTORISTS' PREFERENCES FOR DIFFERENT LEVELS OF VEHICLE AUTOMATION BRANDON SCHOETTLE MICHAEL SIVAK MOTORISTS' PREFERENCES FOR DIFFERENT LEVELS OF VEHICLE AUTOMATION Brandon Schoettle
UJI VALIDITAS DAN RELIABILIAS VARIABEL KOMPENSASI
 1 UJI VALIDITAS DAN RELIABILIAS VARIABEL KOMPENSASI Case Processing Summary N % 20 100.0 Cases Excluded a 0.0 Total 20 100.0 a. Listwise deletion based on all variables in the procedure. Reliability Statistics
MOTORISTS' PREFERENCES FOR DIFFERENT LEVELS OF VEHICLE AUTOMATION: 2016
 SWT-2016-8 MAY 2016 MOTORISTS' PREFERENCES FOR DIFFERENT LEVELS OF VEHICLE AUTOMATION: 2016 BRANDON SCHOETTLE MICHAEL SIVAK SUSTAINABLE WORLDWIDE TRANSPORTATION MOTORISTS' PREFERENCES FOR DIFFERENT LEVELS
The Session.. Rosaria Silipo Phil Winters KNIME KNIME.com AG. All Right Reserved.
 The Session.. Rosaria Silipo Phil Winters KNIME 2016 KNIME.com AG. All Right Reserved. Past KNIME Summits: Merging Techniques, Data and MUSIC! 2016 KNIME.com AG. All Rights Reserved. 2 Analytics, Machine
INTERNET ACCESS GOALS AND PLANS
 i. Which do you consider to be your primary college* 2-year college Other 4-year Valley West Total 484 518 122 154 169 94 398 415 405 31 118 2,908 16.6 17.8 4.2 5.3 5.8 3.2 13.7 14.3 13.9 1.1 4.1 100.0
Descriptive Statistics
 Chapter 2 Descriptive Statistics 2-1 Overview 2-2 Summarizing Data 2-3 Pictures of Data 2-4 Measures of Central Tendency 2-5 Measures of Variation 2-6 Measures of Position 2-7 Exploratory Data Analysis
UNDERSTANDING THE CUSTOMER
 Certified Pre-Owned UNDERSTANDING THE CUSTOMER November 2013 About the CPO Study PURPOSE: To trend shopper familiarity, opinion, and consideration of CPO vehicles. METHODOLOGY: A quantitative online survey
BBC NEWSROUND SATs SURVEY
 BBC NEWSROUND SATs SURVEY METHODOLOGY NOTE ComRes interviewed 750 English children aged 10-11 between the 18 th and 26 th April 2016. Data were weighted by age, gender and region to be representative of
USC Aiken 2004 Freshman Orientation Survey Results Selected questions have been made parallel to those on the CIRP Freshman Survey
 Note: In 2004, USC Aiken administered a custom survey at Freshman Orientation. Many questions are parallel to questions asked on the CIRP Freshman Survey. It is important to note that issues such as question
TRINITY COLLEGE DUBLIN THE UNIVERSITY OF DUBLIN. Faculty of Engineering, Mathematics and Science. School of Computer Science and Statistics
 ST7003-1 TRINITY COLLEGE DUBLIN THE UNIVERSITY OF DUBLIN Faculty of Engineering, Mathematics and Science School of Computer Science and Statistics Postgraduate Certificate in Statistics Hilary Term 2015
The Effective IVIS Menu and Control Type of an Instrumental Gauge Cluster and Steering Wheel Remote Control with a Menu Traversal
 The Effective IVIS Menu and Control Type of an Instrumental Gauge Cluster and Steering Wheel Remote Control with a Menu Traversal Seong M. Kim 1, Jaekyu Park 2, Jaeho Choe 3, and Eui S. Jung 2 1 Graduated
Missouri Seat Belt Usage Survey for 2017
 Missouri Seat Belt Usage Survey for 2017 Conducted for the Highway Safety & Traffic Division of the Missouri Department of Transportation by The Missouri Safety Center University of Central Missouri Final
Lampiran 1. Data Perusahaan
 Lampiran. Data Perusahaan NO PERUSH MV EARN DIV CFO LB.USAHA TOT.ASS ACAP 3 9 8 5 369 9678 376 ADES 75-35 - 6 3559-5977 7358 3 AQUA 5 368 65 335 797 678 53597 BATA 88 5 9 863 958 93 5 BKSL 5.3 -. 9-9 5
MIT ICAT M I T I n t e r n a t i o n a l C e n t e r f o r A i r T r a n s p o r t a t i o n
 M I T I n t e r n a t i o n a l C e n t e r f o r A i r T r a n s p o r t a t i o n Standard Flow Abstractions as Mechanisms for Reducing ATC Complexity Jonathan Histon May 11, 2004 Introduction Research
Consumer Attitude Survey
 Consumer Attitude Survey Spring 2018 Consumer Attitude Survey Spring 2018 2 Consumer Attitude Survey Spring 2018 Contents Introduction.. 4 Regional breakdown...... 5 Consumer views General perceptions..
Seat Belt Survey. Q1. When travelling in a car, do you wear your seat belt all of the time, most of the time, some of the time, or never?
 N F O C F g r o u p Seat Belt Survey Q1. When travelling in a car, do you wear your seat belt all of the time, most of the time, some of the time, or never? The majority of Canadians (85%) wear their seat
IMPACT OF GASOLINE PRICES ON LAS VEGAS VISITATION FROM SOUTHERN CALIFORNIA AND LAS VEGAS LOCALS
 Monday, June 30, 2008 IMPACT OF GASOLINE PRICES ON LAS VEGAS VISITATION FROM SOUTHERN CALIFORNIA AND LAS VEGAS LOCALS Executive Summary There is a direct correlation between rising gas prices and reduced
AIR ATOMISER NOZZLES. Vapro Series. VP Body 24. VPX/VPL Body
 AIR ATOMISER NOZZLES For applications where very fine droplets and low flow rates are required, the air atomiser range from Lurmark, including the VAPRO jet and ULTRA nozzles are the ideal choice. Air
Denver Car Share Program 2017 Program Summary
 Denver Car Share Program 2017 Program Summary Prepared for: Prepared by: Project Manager: Malinda Reese, PE Apex Design Reference No. P170271, Task Order #3 January 2018 Table of Contents 1. Introduction...
We trust that these data are helpful to you. If you have any questions, feel free to contact Dr. Joe Ludlum at or
 September 21, 216 Dear Colleague: The Office of Assessment has processed the 2-216 Course/Instructor Opinion Survey (CIOS) results for the Institute. For 69 academic terms (39 quarters and 3 semesters
WHITE PAPER. Preventing Collisions and Reducing Fleet Costs While Using the Zendrive Dashboard
 WHITE PAPER Preventing Collisions and Reducing Fleet Costs While Using the Zendrive Dashboard August 2017 Introduction The term accident, even in a collision sense, often has the connotation of being an
THE AUTO INDUSTRY TODAY & TOMORROW
 INTELLIGENCE BRIEFING THE AUTO INDUSTRY TODAY & OVERVIEW About Morning Consult What consumers THINK Collecting over 3 million market research interviews What consumers SAY Evaluating over 100 million social
LISTEN A MINUTE.com. Speed. Focus on new words, grammar and pronunciation in this short text.
 LISTEN A MINUTE.com Speed http://www.listenaminute.com/s/speed.html One minute a day is all you need to improve your listening skills. Focus on new words, grammar and pronunciation in this short text.
2008 Dealer Walk-In Traffic Study Results
 Objectives Northwood University and AutoTrader.com Present: 2008 Dealer Walk-In Traffic Study Results January 25, 2009 1 Chip Perry President and CEO, AutoTrader.com 2 State of the Industry - Current Observations
Porsche unveils 4-door sports car
 www.breaking News English.com Ready-to-use ESL / EFL Lessons Porsche unveils 4-door sports car URL: http://www.breakingnewsenglish.com/0507/050728-porsche-e.html Today s contents The Article 2 Warm-ups
Survey of users of wheelchair seat elevators
 Survey of users of wheelchair seat elevators The Rehabilitation Engineering and Applied Research Center in collaboration with Quantum Rehab surveyed wheelchair users whose powered wheelchairs are equipped
Stat 301 Lecture 30. Model Selection. Explanatory Variables. A Good Model. Response: Highway MPG Explanatory: 13 explanatory variables
 Model Selection Response: Highway MPG Explanatory: 13 explanatory variables Indicator variables for types of car Sports Car, SUV, Wagon, Minivan 1 Explanatory Variables Engine size (liters) Cylinders (number)
Busy Ant Maths and the Scottish Curriculum for Excellence Foundation Level - Primary 1
 Busy Ant Maths and the Scottish Curriculum for Excellence Foundation Level - Primary 1 Number, money and measure Estimation and rounding Number and number processes Fractions, decimal fractions and percentages
Institutional Research and Planning 440 Day Hall Ithaca, New York PULSE Survey
 Institutional Research and Planning 440 Day Hall Ithaca, New York 14853 2009 PULSE Survey The Cornell PULSE (Perceptions of Undergraduate Life and Student Experiences) Survey asks currently enrolled undergraduate
RAB / GfK MRI AUTO PROFILE: TOYOTA CARS. A B C D E F G H I J Own/Lease Toyota Avalon. Own/Lease Toyota Camry
 A B C D E F G H I J U.S. Adults 8+ Matrix Prius Yaris Avalon Camry Corolla Any 3 4 5 6 7 8 9 0 3 4 5 6 7 8 9 0 3 4 5 6 7 8 9 30 3 3 33 34 35 36 37 38 39 40 4 4 43 44 45 46 47 48 49 50 5 5 53 54 55 56 U.S.
How to enable Munich s Freedom (from private cars)? Impacts of the first Mobility Station on urban mobility
? Impacts of the first Mobility Station on urban mobility") How to enable Munich s Freedom (from private cars)? Impacts of the first Mobility Station on urban mobility Montserrat Miramontes 1 Hema Sharanya Rayaprolu 1 Maximilian Pfertner 1 Martin Schreiner 2 Gebhard
How to enable Munich s Freedom (from private cars)? Impacts of the first Mobility Station on urban mobility Montserrat Miramontes 1 Hema Sharanya Rayaprolu 1 Maximilian Pfertner 1 Martin Schreiner 2 Gebhard
Investigating the Concordance Relationship Between the HSA Cut Scores and the PARCC Cut Scores Using the 2016 PARCC Test Data
 Investigating the Concordance Relationship Between the HSA Cut Scores and the PARCC Cut Scores Using the 2016 PARCC Test Data A Research Report Submitted to the Maryland State Department of Education (MSDE)
Statistics and Quantitative Analysis U4320. Segment 8 Prof. Sharyn O Halloran
 Statistics and Quantitative Analysis U4320 Segment 8 Prof. Sharyn O Halloran I. Introduction A. Overview 1. Ways to describe, summarize and display data. 2.Summary statements: Mean Standard deviation Variance
Guatemalan cholesterol example summary
 Guatemalan cholesterol example summary Wednesday, July 11, 2018 02:04:06 PM 1 The UNIVARIATE Procedure Variable: level = rural Basic Statistical Measures Location Variability Mean 157.0204 Std Deviation
National Household Travel Survey Add-On Use in the Des Moines, Iowa, Metropolitan Area
 National Household Travel Survey Add-On Use in the Des Moines, Iowa, Metropolitan Area Presentation to the Transportation Research Board s National Household Travel Survey Conference: Data for Understanding
Fourth Grade. Multiplication Review. Slide 1 / 146 Slide 2 / 146. Slide 3 / 146. Slide 4 / 146. Slide 5 / 146. Slide 6 / 146
 Slide 1 / 146 Slide 2 / 146 Fourth Grade Multiplication and Division Relationship 2015-11-23 www.njctl.org Multiplication Review Slide 3 / 146 Table of Contents Properties of Multiplication Factors Prime
Orientation and Conferencing Plan Stage 1
 Orientation and Conferencing Plan Stage 1 Orientation Ensure that you have read about using the plan in the Program Guide. Book summary Read the following summary to the student. Everyone plays with the
Table 3.1 New Freshmen SAT Scores By Campus: Fall Table 3.2 UVI New Freshmen SAT Scores By Gender: Fall 1999
 Table 3.1 New Freshmen SAT Scores By Campus: Fall 1999 UVI (All) Score Range Count Percent Count Percent Count Percent Verbal 200-299 36 12 18 10 18 14 300-399 108 35 56 31 52 41-499 111 36 68 38 43 34
fruitfly fecundity example summary Tuesday, July 17, :13:19 PM 1
 fruitfly fecundity example summary Tuesday, July 17, 2018 02:13:19 PM 1 The UNIVARIATE Procedure Variable: fecund line = NS Basic Statistical Measures Location Variability Mean 33.37200 Std Deviation 8.94201
5. CONSTRUCTION OF THE WEIGHT-FOR-LENGTH AND WEIGHT-FOR- HEIGHT STANDARDS
 5. CONSTRUCTION OF THE WEIGHT-FOR-LENGTH AND WEIGHT-FOR- HEIGHT STANDARDS 5.1 Indicator-specific methodology The construction of the weight-for-length (45 to 110 cm) and weight-for-height (65 to 120 cm)
Fourth Grade. Slide 1 / 146. Slide 2 / 146. Slide 3 / 146. Multiplication and Division Relationship. Table of Contents. Multiplication Review
 Slide 1 / 146 Slide 2 / 146 Fourth Grade Multiplication and Division Relationship 2015-11-23 www.njctl.org Table of Contents Slide 3 / 146 Click on a topic to go to that section. Multiplication Review
ASPHALT ROUND 1 PROFICIENCY TESTING PROGRAM. April 2009 REPORT NO. 605 ACKNOWLEDGEMENTS
 ASPHALT ROUND 1 PROFICIENCY TESTING PROGRAM April 2009 REPORT NO. 605 ACKNOWLEDGEMENTS PTA wishes to acknowledge gratefully the technical assistance provided for this program by Mr Hugo Van Loon at The
Final v1 Prepared for: Energex, Ergon Energy and Powerlink. Date: 11 th February 2016.
 1 Final v1 Prepared for: Energex, Ergon Energy and Powerlink. Date: 11 th February 2016. Executive Summary 3 Findings 6 Topic 1: Appliance Penetration & Usage 7 Topic 2: Air Conditioners 19 Topic 3: Solar
PSAT / NMSQT SUMMARY REPORT COLLEGE-BOUND HIGH SCHOOL JUNIORS NEW JERSEY
 PSAT / NMSQT SUMMARY REPORT 2003-2004 COLLEGE-BOUND HIGH SCHOOL JUNIORS Copyright 2004 by College Entrance Examination Board. All rights reserved. Student Search Service, College Board, and the acorn logo
2015 AER Survey of Albertans and Stakeholders. Executive Summary
 2015 AER Survey of Albertans and Stakeholders Executive Summary 2015 AER Survey of Albertans: Executive Summary July 2015 Published by Alberta Energy Regulator Suite 1000, 250 5 Street SW Calgary, Alberta
PSAT / NMSQT SUMMARY REPORT COLLEGE-BOUND HIGH SCHOOL SOPHOMORES MISSISSIPPI
 PSAT / NMSQT SUMMARY REPORT 2003-2004 COLLEGE-BOUND HIGH SCHOOL SOPHOMORES Copyright 2004 by College Entrance Examination Board. All rights reserved. Student Search Service, College Board, and the acorn
PSAT / NMSQT SUMMARY REPORT COLLEGE-BOUND HIGH SCHOOL SOPHOMORES NEVADA
 PSAT / NMSQT SUMMARY REPORT 2003-2004 COLLEGE-BOUND HIGH SCHOOL SOPHOMORES Copyright 2004 by College Entrance Examination Board. All rights reserved. Student Search Service, College Board, and the acorn
PSAT / NMSQT SUMMARY REPORT COLLEGE-BOUND HIGH SCHOOL SOPHOMORES MONTANA
 PSAT / NMSQT SUMMARY REPORT 2003-2004 COLLEGE-BOUND HIGH SCHOOL SOPHOMORES Copyright 2004 by College Entrance Examination Board. All rights reserved. Student Search Service, College Board, and the acorn
BMW. Satellite Radio. The Ultimate Driving Machine
 A sound approach to inspired driving. BMW SiriusXM Satellite Radio The Ultimate Driving Machine SIRIUSXM Satellite Radio: The ultimate in entertainment. Now all SiriusXM equipped BMW s come with a 1-year
RECYCLING STUDY PUBLIC PARTICIPATION REPORT
 Water and Waste Department RECYCLING STUDY PUBLIC PARTICIPATION REPORT January 2010 For more information on this, please contact: Tiffany Skomro Public Consultation & Research Officer 112 1199 Pacific
Analyzing Uber s Ride-sharing Economy
 Analyzing Uber s Ride-sharing Economy Farshad Kooti USC / Facebook Nemanja Djuric Yahoo Research Mihajlo Grbovic Yahoo Research Vladan Radosavljevic Yahoo Research Luca Maria Aiello Bell Labs Kristina
Nebraska Teen Driving Experiences Survey Four-Year Trend Report
 Nebraska Teen Driving Experiences Survey Four-Year Trend Report 2014-2015, 2015-2016, and 2017-2018 School Years April 2018 Division of Public Health Injury Prevention Program Table of Contents Executive
1 Background and definitions
 EUROPEAN COMMISSION DG Employment, Social Affairs and Inclusion Europe 2020: Employment Policies European Employment Strategy Youth neither in employment nor education and training (NEET) Presentation
Wyoming Drivers Survey, 2014
 Wyoming Drivers Survey, 2014 WYSAC Technical Report No. SRC-1408 September, 2014 Wyoming Survey & Analysis Center (307) 766-2189 wysac@uwyo.edu http://wysac.uwyo.edu WYSAC, University of Wyoming Wyoming
Sidney Sizes his Solar Power System
 Sidney Sizes his Solar Power System Sidney wants to size his van s solar power system. He s got a few things he d like to power in his van, and those items are where the design will begin. Step 1: Sidney
Investigation of Relationship between Fuel Economy and Owner Satisfaction
 Investigation of Relationship between Fuel Economy and Owner Satisfaction June 2016 Malcolm Hazel, Consultant Michael S. Saccucci, Keith Newsom-Stewart, Martin Romm, Consumer Reports Introduction This
New Jersey s Clean Energy Program
 New Jersey s Clean Energy Program Energy Efficiency Program Survey February 13, 2015 1 2014 Energy Efficiency Program Survey Background Honeywell conducted a study of consumer awareness and opinions concerning
Five Popular Car Options That Barely Get Used By Owners
 Five Popular Car Options That Barely Get Used By Owners In one of our recent Top 5 pieces, we looked at our favorite car options that people rarely have on their cars. In this Top 5, we wanted to take
SEGMENT 2 DRIVER EDUCATION Risk Awareness
 Fact Sheet 1 Why Should Young Drivers Be Concerned? Risk is the chance of death, injury, damage, or loss. Approximately 1 out of 11 (9%) of 16-year-old drivers will have a serious crash before his/her
Comparing Percentages of Iditarod Finishers
 Comparing Percentages of Iditarod Finishers Developed by: Brian Hickox, 2019 Iditarod Teacher on the Trail Discipline / Subject: Math Topic: Analyze and Solve Percent Problems Grade Level: 6, 7, 8 Resources
DATA SAMPEL TAHUN 2006
 DATA SAMPEL TAHUN 2006 No Nama Emiten CGPI Kode Saham Harga Saham EPS PER Laba Bersih 1 Bank Niaga 89.27 BNGA 920 54 17.02 647,732 2 Bank Mandiri 83.66 BMRI 2,900 118 24.65 2,422,472 3 Astra International
The 1997 U.S. Residential Energy Consumption Survey s Editing Experience Using BLAISE III
 The 997 U.S. Residential Energy Consumption Survey s Editing Experience Using BLAISE III Joelle Davis and Nancy L. Leach, Energy Information Administration (USA) Introduction In 997, the Residential Energy
EV Owner Demographics & Diffusion Survey
 EV Owner Demographics & Diffusion Survey Sources of Information 1) Which of the following statements best describes your interest in acquiring a PEV when you started your search for a new vehicle? ( )
Certificate in a vocational program
 N 3,328 5,148 2,928 3,219 3,546 2,004 3,730 3,982 2,327 30,212 GOALS AND PLANS 2. What is your educational goal at this college? High school diploma or GED 1.9 1.3 2.2 1.4 2.2 2.2 1.9 2.0 1.7 1.8 Certificate
Wyoming Drivers Survey, 2016
 October 4, 2016 Wyoming Drivers Survey, 2016 WYSAC Technical Report No. SRC-1607 Brian Harnisch, M.B.A., Senior Research Scientist With assistance of Bistra Anatchkova, Ph.D., Survey Research Manager Wyoming
2019 CAR BUYER JOURNEY APRIL 2019
 2019 CAR BUYER JOURNEY APRIL 2019 CAR BUYER JOURNEY RESEARCH BACKGROUND Cox Automotive has been researching the car buying journey for nearly 10 years to monitor key changes in consumer buying behaviors.
HOW REAL PEOPLE VIEW THE FUTURE OF MOBILITY
 HOW REAL PEOPLE VIEW THE FUTURE OF MOBILITY OVERVIEW 1 2 3 Key Points Methodology: Adults overwhelmingly regard January the automotive 20 21, 2018. The industry as innovative, dynamic and changing for
2009/10 NWT Aurora Visitor Survey Report. Industry, Tourism and Investment Government of the Northwest Territories
 2009/10 NWT Aurora Visitor Survey Report Industry, Tourism and Investment Government of the Northwest Territories INTRODUCTION... 3 SURVEY METHODOLOGY... 4 EXECUTIVE SUMMARY... 5 VISITOR PROFILE... 7 AGE...
Sales Information Mercedes-Benz ACTROS
 Sales Information Mercedes-Benz ACTROS www.jost-world.com JOST fifth wheel couplings: Greater safety and convenience JOST innovations save time and help prevent accidents. The sensor-equipped fifth wheel
Getting Started with Correlated Component Regression (CCR) in XLSTAT-CCR
 in XLSTAT-CCR") Tutorial 1 Getting Started with Correlated Component Regression (CCR) in XLSTAT-CCR Dataset for running Correlated Component Regression This tutorial 1 is based on data provided by Michel Tenenhaus and
Tutorial 1 Getting Started with Correlated Component Regression (CCR) in XLSTAT-CCR Dataset for running Correlated Component Regression This tutorial 1 is based on data provided by Michel Tenenhaus and
Comparison of 2013 VMT Fatality Rates in the States and in High-Income Countries
 Comparison of 2013 VMT Fatality Rates in the States and in High-Income Countries Transportation Research Board 96th Annual Meeting Session 536 Analysis of International Road Safety Data January 10, 2017
Global Automotive Consumer Study 2017
 Global Automotive Consumer Study 2017 Deloitte, September 2017 Preface Deloitte s Global Automotive Consumer Study 2017 is based on a survey of 22,078 respondents in 17 countries. The presentation focuses
U.S. Census Bureau News Joint Release U.S. Department of Housing and Urban Development
 Raemeka Mayo or Stephen Cooper Economic Indicators Division (01) 76-5160 FOR IMMEDIATE RELEASE TUESDAY, MARCH 17, 015 AT 8:0 A.M. EDT NEW RESIDENTIAL CONSTRUCTION IN FEBRUARY 015 The U.S. Census Bureau
Representativeness Analysis: Participants vs. Non-Participants
 Representativeness Analysis: Participants vs. Non-Participants 1 All significance tests are two-sample t-tests unless otherwise noted. *p
News English.com Ready-to-use ESL / EFL Lessons
 www.breaking News English.com Ready-to-use ESL / EFL Lessons 1,000 IDEAS & ACTIVITIES FOR LANGUAGE TEACHERS The Breaking News English.com Resource Book http://www.breakingnewsenglish.com/book.html Japanese
All-new 2018 Jeep Wrangler Offers a host of Advanced Technology Features, Including Fourth Generation 8.4-inch Display with Uconnect System
 All-new 2018 Jeep Wrangler TECHNOLOGY All-new 2018 Jeep Wrangler Offers a host of Advanced Technology Features, Including Fourth Generation 8.4-inch Display with Uconnect System New fourth-generation Uconnect
Understanding Traffic Data: How To Avoid Making the Wrong Turn
 Traffic Records Forum 2011 Understanding Traffic Data: How To Avoid Making the Wrong Turn Presenter: Marc Starnes (202) 366-2186 marc.starnes@dot.gov August 3rd, 2011 1 Summary of Topics Police Crash Reports
Material World How Does the USA Compare?
 Material World How Does the USA Compare? Center for Energy and Environmental Education, University of Northern Iowa WR teacher training 24-25/Website/Lessons/Material World How Does the USA Compare? Written
Mathematics 43601H. Cumulative Frequency. In the style of General Certificate of Secondary Education Higher Tier. Past Paper Questions by Topic TOTAL
 Centre Number Surname Candidate Number For Examiner s Use Other Names Candidate Signature Examiner s Initials In the style of General Certificate of Secondary Education Higher Tier Pages 2 3 4 5 Mark Mathematics
RAB / GfK MRI FORMAT PROFILE: URBAN OLDIES. A B C D E F G H U.S. Women 18+ Adults Listen to Urban Oldies Format (Total Week Cume)
") Adults - U.S. Men Men - Women - 3 4 5 6 7 8 9 0 3 4 5 6 7 8 9 0 3 4 5 6 7 8 9 30 3 3 33 34 35 36 37 38 39 40 4 4 43 44 45 46 47 48 49 50 5 5 53 54 55 56 Male Female Age 8-4 Age 5-34 Age 35-44 Age 45-54
Adults - U.S. Men Men - Women - 3 4 5 6 7 8 9 0 3 4 5 6 7 8 9 0 3 4 5 6 7 8 9 30 3 3 33 34 35 36 37 38 39 40 4 4 43 44 45 46 47 48 49 50 5 5 53 54 55 56 Male Female Age 8-4 Age 5-34 Age 35-44 Age 45-54
Group 3 Final Project Paper
 Group 3 Final Project Paper In our final project for ISDS 4180, we were asked to analyze and interpret crash data from the Louisiana Highway Safety Research Group with one basic question in mind: which