Q Results November 2 nd, 2017
|
|
|
- Irma Terry
- 5 years ago
- Views:
Transcription


1 Q Results November 2 nd,
2 SAFE HARBOUR STATEMENT This document, and in particular the section entitled 2017 Outlook, contains forward-looking statements. These statements may include terms such as may, will, expect, could, should, intend, estimate, anticipate, believe, remain, on track, successful, grow, design, target, objective, goal, forecast, projection, outlook, prospects, plan, or similar terms. Forward-looking statements are not guarantees of future performance. Rather, they are based on the Group s current expectations and projections about future events and, by their nature, are subject to inherent risks and uncertainties. They relate to events and depend on circumstances that may or may not occur or exist in the future and, as such, undue reliance should not be placed on them. Actual results may differ materially from those expressed in such statements as a result of a variety of factors, including: the Group s ability to preserve and enhance the value of the Ferrari brand; the success of Ferrari s Formula 1 racing team and the expenses the Group incurs for Formula 1 activities; the Group s ability to keep up with advances in high performance car technology and to make appealing designs for its new models; the challenges and costs of integrating hybrid technology more broadly into Group s car portfolio over time; the Group s ability to preserve its relationship with the automobile collector and enthusiast community; the Group s low volume strategy; the ability of Maserati, the Group s engine customer, to sell its planned volume of cars; changes in client preferences and automotive trends; changes in the general economic environment and changes in demand for luxury goods, including high performance luxury cars, which is highly volatile; the impact of increasingly stringent fuel economy, emission and safety standards, including the cost of compliance, and any required changes to its products; the Group s ability to successfully carry out its growth strategy and, particularly, the Group s ability to grow its presence in emerging market countries; the Group s ability to service and refinance its debt; competition in the luxury performance automobile industry; reliance upon a number of key members of executive management, employees and the ability of its current management team to operate and manage effectively; the performance of the Group s dealer network on which the Group depend for sales and services; increases in costs, disruptions of supply or shortages of components and raw materials; disruptions at the Group s manufacturing facilities in Maranello and Modena; the Group s ability to provide or arrange for adequate access to financing for its dealers and clients, and associated risks; the performance of the Group s licensees for Ferrari-branded products; the Group s ability to protect its intellectual property rights and to avoid infringing on the intellectual property rights of others; product recalls, liability claims and product warranties; continued compliance with customs regulations of various jurisdictions; labor relations and collective bargaining agreements; exchange rate fluctuations, interest rate changes, credit risk and other market risks; changes in tax, tariff or fiscal policies and regulatory, political and labor conditions in the jurisdictions in which the Group operates; ability to ensure that its employees, agents and representatives comply with applicable law and regulations; the adequacy of its insurance coverage to protect the Group against potential losses; potential conflicts of interest due to director and officer overlaps with the Group s largest shareholders; ability to maintain the functional and efficient operation of its information technology systems and other factors discussed elsewhere in this document. Any forward-looking statements contained in this document speak only as of the date of this document and the Company does not undertake any obligation to update or revise publicly forward-looking statements. Further information concerning the Group and its businesses, including factors that could materially affect the Company s financial results, is included in the Company s reports and filings with the U.S. Securities and Exchange Commission, the AFM and CONSOB. 22
 to 202 million (+17%) Ferrari Portofino presented in September, already with a robust waiting list Strong success of Ferrari s client relations activities 2017 Outlook revised upward ON")
3 A RECORD THIRD QUARTER Solid revenues of 836 million (+7%) driving adj. EBIT (1) to 202 million (+17%) Ferrari Portofino presented in September, already with a robust waiting list Strong success of Ferrari s client relations activities 2017 Outlook revised upward ON THE WAY TO 1 BILLION EURO ADJ. EBITDA Note:(1) Reconciliations to non-gaap financial measures are provided in the appendix 3
4 Q HIGHLIGHTS Shipments (units) Q3 '17 Q3 '16 2,046 1,978 Net revenues ( M) Q3 ' % +6.7% Q3 ' Total shipments up 68 units mainly driven by 27% increase in V12 models. Few units decrease of V8 mostly due to the California T phase-out: The GTC4Lusso and the 488 families The California T and the F12berlinetta continue to perform strongly phasing-out, as well as F12tdf finishing its LaFerrari Aperta fully contributing limited series run The 812 Superfast just arrived in EMEA Deliveries of the Ferrari Portofino will commence in 2018 Net revenues up 6.7% (9.3% at constant currencies, mainly due to USD weakening vs. Euro) Cars and spare parts leading the way with volume, mix and pricing Partially offset by Engines due to the termination of the rental agreement with a Formula 1 racing team and slightly lower sales to Maserati due to a different production schedule as well as the deconsolidation of the European Financial Services business (November 2016) Adjusted EBITDA (1) ( M and margin %) Q3 '17 Q3 ' % % Adjusted EBIT (1) ( M and margin %) Q3 ' % +13.2% +17.3% Q3 ' % Adjusted EBITDA (1) grew by 13.2%, primarily driven by higher volumes, mix thanks to LaFerrari Aperta and pricing. Partially offset by higher R&D expenses for innovation, components and hybrid technology. Adjusted EBIT (1) margin increased by 220 bps driven by strong adjusted EBITDA (1) Industrial free cash flow (1) ( M) Q3 '17 Q3 ' Industrial free cash flow (1) driven by strong adjusted EBITDA (1), partially offset by net change in working capital, capex and lack of contribution from advances of LaFerrari Aperta. Second 2017 tax advance payment will impact next quarter. Net industrial debt (1) ( M) Sept. 30, 2017 Dec. 31, 2016 (653) (485) -17.4% -25.7% Net industrial debt (1) reduced to 485 million thanks to positive industrial free cash flow (1) generation Note: (1) Reconciliations to non-gaap financial measures are provided in the appendix. Q Results Certain totals in the tables included in this document may not add due to rounding. November 2 nd,
5 Q SHIPMENTS BY REGION (2) Americas (36% vs. 35% PY) China, Hong Kong and Taiwan, on a combined basis (7% vs. 9% PY) Rest of APAC (13% vs. 12% PY) EMEA (44% vs. 44% PY) Americas +5.0% USA increased by 1% with a strong performance of the 488 family, the GTC4Lusso and the limited edition LaFerrari Aperta. Partially offset by California T and the F12berlinetta phasing-out. The F12tdf is finishing its limited series run. The GTC4Lusso T and the 812 Superfast yet to arrive on the market EMEA: +5.1% UK up almost 3% thanks to the 488 and the GTC4Lusso families while the 812 Superfast is yet to arrive on the market. The California T and the F12berlinetta phasing-out, while the F12tdf is finishing its limited series run. Double-digit growth in Italy (+24%) and France (+23%) thanks to the 488 and the GTC4Lusso families as well as the 812 Superfast just arrived on the market. Germany flat due to the California T and the F12berlinetta phasing-out. Other European countries up double-digit, while Middle East recorded a decrease due to reallocation triggered by tough market conditions China, Hong Kong and Taiwan, on a combined basis: -15.6% China mid single-digit growth supported by the GTC4Lusso family. 812 Superfast is yet to arrive on the market. Hong Kong slowdown as the new dealership became fully operational in Q Taiwan few units decrease due to the California T and the F12berlinetta phasing-out Rest of APAC: +7.1% Japan shipments up 16% thanks to V8 models, the GTC4Lusso and LaFerrari Aperta. Partially offset by the F12berlinetta phasing-out and the F12tdf finishing its limited series run. Australia substantially in line with prior year Other APAC shipments in line with prior year SOLID PERFORMANCE OF THE 488 AND THE GTC4LUSSO FAMILIES AS WELL AS LAFERRARI APERTA. 812 SUPERFAST JUST ARRIVED IN EMEA Q Results Note: (2) Refer to notes to the presentation in the Appendix November 2 nd,
 537 605 (3) (4) Q3 2016 Cars and spare parts Engines Sponsorship, commercial and brand(5) (6) Other Q3 2017 Cars and spare parts Engines Sponsorship, commercial and brand Other Cars and spare")

6 NET REVENUES BRIDGE Q ( M) % -9.8% -1.3% -18.8% 68 (9) (1) (5) %, + 53 million (+9.3% at constant currencies, mainly due to USD weakening vs. Euro) (3) (4) Q Cars and spare parts Engines Sponsorship, commercial and brand(5) (6) Other Q Cars and spare parts Engines Sponsorship, commercial and brand Other Cars and spare parts: higher volumes and positive mix led by the 488 and the GTC4Lusso families, as well as LaFerrari Aperta along with a greater contribution from personalization programs and pricing increases. Partially offset by the non-registered racing car FXX K completing its limited series run in Engines: slight decrease due to the termination of the rental agreement with a Formula 1 racing team and slightly lower sales to Maserati due to a different production schedule Sponsorship, commercial and brand: almost in line with prior year mostly due to lower 2016 championship ranking compared to Partially offset by higher sponsorship revenues and brand related revenues. Other: decrease mostly due to the deconsolidation of the European Financial Services business since November 2016 Q Results Note: Refer to notes to the presentation in the Appendix November 2 nd,
7 ( M) 172 ADJ. EBIT BRIDGE Q (1) (8) (2) (21) Margin 22.0% Margin 22.7% (7) Margin 22.6% (7) Margin 24.2% Adj. EBIT Q FX hedges Q Adj. EBIT Q w/o FX hedges Adj. EBITDA Vol. Mix Ind. Costs / R&D SG&A FX Other Adj. EBIT Q w/o FX hedges Adj. EBITDA FX hedges Q Adj. EBIT Q Top high end Adj. EBITDA w/o FX hedges (7) w/o FX hedges (7) Adj. EBITDA EBITDA Margin (8) 30.0% 30.5% 30.4% 31.8% 33% - 37% Volume increase of approx. 55 cars (excluding LaFerrari Aperta) thanks to the GTC4Lusso and the 488 families, together with positive contribution from personalization. Partially offset by the California T and the F12berlinetta phasing-out. Positive mix impacted by LaFerrari Aperta as well as pricing increases. This was partially offset by the non-registered racing car FXX K that completed its limited series run in Industrial costs / R&D increased mainly due to higher R&D expenses to support product range and components innovation for hybrid technology. Partially offset by lower spending in F1 activities. SG&A slightly higher than prior year, impacted by costs related to the 70 th anniversary and the approved Long-Term Incentive plan. Partially offset by the deconsolidation of the European Financial Services business since November FX, excluding hedges, negatively impacted mostly due to USD, JPY and GBP depreciation Other in line with previous year due to positive contribution from supporting activities, offset by lower 2016 championship ranking compared to 2015, the termination of the rental agreement with a Formula 1 racing team and the deconsolidation of the European Financial Services business since November 2016 luxury peers (8) Note: (1) Reconciliations to non-gaap financial measures are provided in the appendix Q Results (7) Margins without FX hedges have been calculated excluding FX hedges impact from net revenues, adjusted EBIT and adjusted EBITDA (8) Ferrari s elaboration on FY 2016 publicly available data on a panel of high end luxury peers November 2 nd,
8 NET INDUSTRIAL DEBT BRIDGE (1) JUN 30, 2017 SEPT 30, 2017 ( M) Industrial FCF 147m 266 (627) 9 (34) (1) (93) (1) (4) (485) June 30, 2017 Net Industrial Debt EBITDA Net working capital Tax paid Capex Other Cash distribution and dividends paid FX and other September 30, 2017 Net Industrial Debt Net change in working capital: decreases in trade payables and inventory due to seasonality in conjunction with the scheduled summer shutdown Tax paid: second 2017 tax advance payment will impact Q Other: positively impacted by accruals and reserves related to deferred compensations as well as provisions, partially offset by lack of contribution from advances of LaFerrari Aperta Q Results Note: (1) Reconciliations to non-gaap financial measures are provided in the appendix November 2 nd,


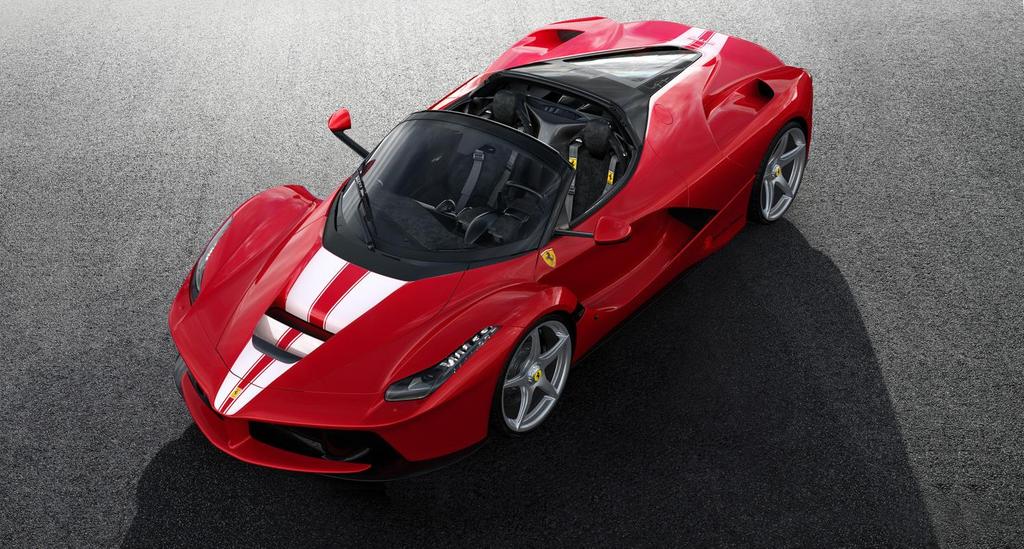
9 A GT that represents a unique combination of sportiness, elegance and on board comfort The renowned Ferrari V8 turbo, part of the engine family that was nominated International Engine of the Year in both 2016 and 2017, now punches out 40 cv more than the California T s power unit Capable of unleashing a massive 600 cv, the Ferrari Portofino is the most powerful convertible to combine the advantages of a retractable hard top, a roomy boot and generous cockpit space plus two rear seats suitable for short trips. 99


10 Q CLIENT RELATIONS ACTIVITIES WORLD TOUR China, August 12 th 17 th USA, August 18 th 20 th Italy, September 2 nd 3 rd Italy, September 8 th 10 th Maranello Weekend September 8 th 10 th RM Auction Concours d Elegance Celebration of 70 th anniversary at home Portofino World Premiere September 7 th - 8 th Frankfurt Motorshow September 12 th - 24 th Florence, Italy September 25 th 30 th 10

")


 ASIA")


11 Q ATTIVITA SPORTIVE GT COMPETIZIONI GT FIA WEC 1 st - 6 Hours of Circuit of the Americas (GTE-Pro) IMSA 2017 Team, Drivers and Manufacturer Champions (GTD) FERRARI CHALLENGE Average entries per round EUROPE 41 (round 5) NORTH AMERICA 45 (round 6) ASIA PACIFIC 29 (round 6) XX PROGRAMS / F1 CLIENTI Average entries per round XX: 23 F1: 8 CONTINUOUSLY ENGAGING WITH OUR CUSTOMERS 11


12 Q OTHER ACTIVITIES Licensing Launch of Bianchi for Scuderia Ferrari project with SF01 world premiere at Eurobike show New license agreement with Cybex for Scuderia Ferrari infant car seats and a collection of strollers Retail At the end of September 2017, managing 18 directly operated stores and 29 franchised locations (including 7 Ferrari Store Junior). New Store at Scalo Milano opened in September 2017 Museums More than 432,000 visitors since the beginning of the year between Maranello and Modena, up 11% vs. prior year 12
13 2017 OUTLOOK REVISED UPWARD Revised Outlook Previous Outlook 2017 Drivers Shipments ~ 8,400 (9) Same Strong contribution from range models (including special liveries) and LaFerrari Aperta Net Revenues ~ 3.4 billion > 3.3 billion Top line growth driven by Cars and spare parts as well as Engines, partially offset by different F1 ranking and deconsolidation of the European Financial Services business Adj. EBITDA (1) ~ 1 billion > 950 million Positive contribution from both Volume and Mix, partially offset by R&D and SG&A (F1, new stores and 70 th anniversary) Net Industrial Debt (1) < 500 million (10) ~ 500 million (10) Strong adj. EBITDA, partially offset by capex to support continuous product range renewal and R&D for hybridization, taxes, lack of advances on limited edition supercars and cash distributions to holders of common shares Note: (1) Reconciliations to non-gaap financial measures are provided in the appendix (9) Including supercars (10) Including a cash distribution to the holders of common shares and excluding potential share repurchases 13

14 Q&A 14
15 Appendix
16 NOTES TO THE PRESENTATION 1. Reconciliations to non-gaap financial measures are provided in the appendix 2. Shipments geographical breakdown EMEA includes: Italy, UK, Germany, Switzerland, France, Middle East (includes the United Arab Emirates, Saudi Arabia, Bahrain, Lebanon, Qatar, Oman and Kuwait) and Rest of EMEA (includes Africa and the other European markets not separately identified); Americas includes: United States of America, Canada, Mexico, the Caribbean and Central and South America; China, Hong Kong and Taiwan includes, on a combined basis: China, Hong Kong and Taiwan; Rest of APAC includes: Japan, Australia, Singapore, Indonesia and South Korea 3. Includes the net revenues generated from shipments of our cars, including any personalization revenue generated on these cars and sales of spare parts 4. Includes the net revenues generated from the sale of engines to Maserati for use in their cars, and the revenues generated from the rental of engines to other Formula 1 racing teams 5. Includes the net revenues earned by our Formula 1 racing team through sponsorship agreements and our share of the Formula 1 World Championship commercial revenues and net revenues generated through the Ferrari brand, including merchandising, licensing and royalty income 6. Primarily includes interest income generated by our financial services activities and net revenues from the management of the Mugello racetrack 7. Margins without FX hedges have been calculated excluding FX hedges impact from net revenues, adjusted EBIT and adjusted EBITDA 8. Ferrari s elaboration on FY 2016 publicly available data on a panel of high end luxury peers 9. Including supercars 10.Including a cash distribution to the holders of common shares and excluding potential share repurchases 16
17 V12 V8 STRONG TRACK-RECORD IN NEW MODELS INTRODUCTION Product Line-Up (at least a new model launched every year) F430 F430 Spider F430 Scuderia California Scuderia Spider 16M 458 Italia 458 Spider California Speciale California T Portofino 458 Speciale A 488 GTB 488 Spider GTC4Lusso T 612 Scaglietti Superamerica 599 GTB Fiorano 599 GTO SA APERTA FF F12berlinetta F12tdf GTC4Lusso 812 Superfast Supercars LaFerrari LaFerrari Aperta Special series and one-offs not included 17
18 LIMITED SERIES In and out from our portfolio F12tdf LaFerrari LaFerrari Aperta FXX K (11) F60 America (11) J50 (11) Q Results Note: (11) Models not included in the total shipments figure provided November 2 nd,
19 GROUP SHIPMENTS (2) 1, % 2, , , % 6, ,078 8,014 1, ,687 ~8,400 ~1,150 ~650 ~2, ,762 2,938 3,610 ~3,800 Q Q M M 2017 FY 2016 FY 2017E EMEA Americas China, Hong Kong and Taiwan, on a combined basis Rest of APAC Note: (2) Refer to notes to the presentation in the Appendix Graphs not to scale. Shipments including supercars LaFerrari and LaFerrari Aperta 19
20 KEY PERFORMANCE METRICS Q3 '17 Q3 '16 M, unless otherwise stated 9M '17 9M '16 2,046 1,978 Worldwide shipments (units) 6,381 6, Net revenues 2,577 2, EBITDA (1) Adjustments Adjusted EBITDA (1) Amortization and depreciation EBIT Adjusted EBIT (1) Net financial expenses Profit before taxes Income tax expense % 29.8% Effective tax rate 28.0% 30.4% Net profit Adjusted net profit (1) Basic and diluted EPS ( ) Adjusted EPS (1) ( ) Note: (1) Reconciliations to non-gaap financial measures are provided in the appendix. Certain totals in the tables included in this document may not add due to rounding. 20
21 DEBT AND LIQUIDITY POSITION Cash Maturities Gross Debt Maturity Profile ( M) Term Loan Bond US Securitizations Other Financial Liabilities Net Cash/Net Industrial Debt ( M) Cash and Marketable Securities ( M) Sep. 30 Jun. 30 Mar. 31 Adj. ( M) FY 2016 FY 2015 (12) FY 2015 Euro US Dollar Chinese Yuan Japanese Yen Other Currencies Total ( equivalent) Net Industrial Debt ( M) At Sep. 30 At Jun. 30 At Mar. 31 At Dec. 31 ( M) Gross Debt (1,798) (1,755) (1,870) (1,848) (2,260) Cash & Cash Equivalents Deposits in FCA Cash Management Pools (Net Debt)/Net Cash (1,179) (1,332) (1,301) (1,390) (1,938) Funded Self-Liquidating Financial ,141 Receivables Portfolio (Net Industrial Debt)/Net Industrial Cash (485) (627) (578) (653) (797) Undrawn Committed Credit Lines (1,179) September 30, 2017 Net Debt 694 o/w 79% securitized (13) Funded Self-liquidating Financial Receivables Portfolio (485) September 30, 2017 Net Industrial Debt Total Available Liquidity 1, , Note: (12) After settlement of deposits on FCA Group cash management pools and financial liabilities with FCA Q Results (13) Portion of the Self-liquidating Financial Receivables Portfolio funded through securitizations Certain totals in the tables included in this document may not add due to rounding. November 2 nd,
22 NON-GAAP FINANCIAL MEASURES Non-GAAP financial measures Operations are monitored through the use of various Non-GAAP financial measures that may not be comparable to other similarly titled measures of other companies Accordingly, investors and analysts should exercise appropriate caution in comparing these supplemental financial measures to similarly titled financial measures reported by other companies We believe that these supplemental financial measures provide comparable measures of our financial performance which then facilitate management s ability to identify operational trends, as well as make decisions regarding future spending, resource allocations and other operational decisions EBITDA is defined as net profit before income tax expense, net financial expenses and depreciation and amortization. Adjusted EBITDA is defined as EBITDA as adjusted for income and costs, which are significant in nature, but expected to occur infrequently. Adjusted Earnings Before Interest and Taxes ( Adjusted EBIT ) represents EBIT as adjusted for income and costs, which are significant in nature, but expected to occur infrequently Adjusted net profit represents net profit as adjusted for income and costs, which are significant in nature, but expected to occur infrequently Adjusted earnings per share represents earnings per share as adjusted for income and costs, which are significant in nature, but expected to occur infrequently Net Industrial Debt defined as Net Debt excluding the funded portion of the selfliquidating financial receivables portfolio, is the primary measure to analyze our financial leverage and capital structure, and is one of the key indicators used to measure our financial position Free Cash Flow and Free Cash Flow from Industrial Activities are two of management s primary key performance indicators to measure the Group s performance. Free Cash flow is defined as net cash generated from operations less cash flows used in investing activities. Free Cash Flow from Industrial Activities is defined as Free Cash Flow adjusted for the change in the self-liquidating financial receivables portfolio. 22
23 RECONCILIATION OF NON-GAAP MEASURES: ADJUSTED EBIT Q3 '17 Q3 '16 M 9M '17 9M ' EBIT Charges for Takata airbag inflator recalls Adjusted EBIT
24 RECONCILIATION OF NON-GAAP MEASURES: EBITDA Q3 '17 Q3 '16 M 9M '17 9M ' Net profit Income tax expenses Net financial expenses Amortization and depreciation EBITDA
25 RECONCILIATION OF NON-GAAP MEASURES: ADJUSTED EBITDA Q3 '17 Q3 '16 M 9M '17 9M ' EBITDA Charges for Takata airbag inflator recalls Adjusted EBITDA
26 RECONCILIATION OF NON-GAAP MEASURES: ADJUSTED NET PROFIT Q3 '17 Q3 '16 M 9M '17 9M ' Net profit Charges for Takata airbag inflator recalls (net of tax effect) Adjusted net profit
27 BASIC AND DILUTED EPS Q3 '17 Q3 '16 M (unless otherwise stated) 9M '17 9M ' , ,923 Net profit attributable to owners of the Company Weighted average number of common shares (thousand) , , Basic EPS ( ) , ,923 Weighted average number of common shares for diluted earnings per common share (thousand) 189, , Diluted EPS ( )
28 RECONCILIATION OF NON-GAAP MEASURES: ADJUSTED EPS Q3 '17 Q3 '16 per common share 9M '17 9M ' EPS Charges for Takata airbag inflator recalls (net of tax effect) Adjusted EPS
29 RECONCILIATION OF NON-GAAP MEASURES: FREE CASH FLOW AND FREE CASH FLOW FROM INDUSTRIAL ACTIVITIES Q3 '17 Q3 '16 M 9M '17 9M ' Cash flow from operating activities (93) (75) Cash flows used in investing activities (14) (247) (232) Free Cash Flow Change in the self-liquidating financial receivables portfolio Free Cash Flow from Industrial Activities Note: (14) Cash flow used in investing activities for the nine months ended September 30, 2017 excludes proceeds from exercising the Delta Topco option of Euro 8 million 29
30 RECONCILIATION OF NON-GAAP MEASURES: NET INDUSTRIAL DEBT M September 30, 2017 June 30, 2017 March 31, 2017 December 31, 2016 Net Industrial Debt (485) (627) (578) (653) Funded portion of the self-liquidating financial receivables portfolio Net Debt (1,179) (1,332) (1,301) (1,390) Cash and cash equivalents Gross Debt (1,798) (1,755) (1,870) (1,848) 30
Q Financial Results
 A RECORD THIRD QUARTER ON THE WAY TO 1 BILLION EURO ADJ. EBITDA Total shipments of 2,046 units, up 68 units (+3.4%) Net revenues grew to Euro 836 million, up 6.7% (+9.3% at constant currencies) Adjusted
Q Results May 4 th, 2017
 Q1 2017 Results May 4 th, 2017 SAFE HARBOUR STATEMENT This document, and in particular the section entitled 2017 Outlook, contains forward-looking statements. These statements may include terms such as
Q Financial Results
 A RECORD THIRD QUARTER Total shipments reached 1,978 units, up 29 units (+1.5% 1.5%) Net revenues grew 8.3% (+7.9 ( 7.9% at constant currencies) to Euro 783 million Adjusted EBITDA of Euro 234 million,
FY 2016 Financial Results
 2016: A YEAR OF RECORDS ON THE WAY TO ITS 70 TH ANNIVERSARY IN 2017 Total shipments reached 8,014 units, up 350 units (+4.6%) Net revenues grew 8.8% (+9.4 ( 9.4% at constant currencies) to Euro 3,105 million
Q Financial Results
 Strongest ever Q1, on the way to another record year Total shipments reached 1,882 units, up 15% Net revenues grew 8.8% (+8.4% at constant currencies) to Euro 675 million EBIT of Euro 121 million, 250bps
SAFE HARBOUR STATEMENT
 SAFE HARBOUR STATEMENT This document, and in particular the section entitled Financial targets, contains forward-looking statements. These statements may include terms such as may, will, expect, could,
SAFE HARBOUR STATEMENT
 SAFE HARBOUR STATEMENT This document, and in particular the section entitled Financial targets, contains forward-looking statements. These statements may include terms such as may, will, expect, could,
Valvoline Fourth-Quarter Fiscal 2016 Earnings Conference Call. November 9, 2016
 Valvoline Fourth-Quarter Fiscal 2016 Earnings Conference Call November 9, 2016 Forward-Looking Statements This presentation contains forward-looking statements within the meaning of Section 27A of the
FISCAL YEAR MARCH 2015 FIRST QUARTER FINANCIAL RESULTS. Mazda Roadster 25 th Anniversary Model
 FISCAL YEAR MARCH 2015 FIRST QUARTER FINANCIAL RESULTS Mazda Roadster 25 th Anniversary Model Mazda Motor Corporation July 31, 2014 1 PRESENTATION OUTLINE Highlights Fiscal Year March 2015 First Quarter
FISCAL YEAR MARCH 2014 FINANCIAL RESULTS
 FISCAL YEAR MARCH 214 FINANCIAL RESULTS Mazda CX-5 Mazda Atenza Mazda Motor Corporation April 25, 214 New Mazda Axela 1 PRESENTATION OUTLINE Highlights Fiscal Year March 214 Results Fiscal Year March 215
FISCAL YEAR MARCH 2014 FIRST HALF FINANCIAL RESULTS. New Mazda Axela (Overseas name: New Mazda3)
") FISCAL YEAR MARCH 2014 FIRST HALF FINANCIAL RESULTS New Mazda Axela (Overseas name: New Mazda3) Mazda Motor Corporation October 31, 2013 1 PRESENTATION OUTLINE Highlights Fiscal Year March 2014 First Half
FISCAL YEAR MARCH 2014 FIRST HALF FINANCIAL RESULTS New Mazda Axela (Overseas name: New Mazda3) Mazda Motor Corporation October 31, 2013 1 PRESENTATION OUTLINE Highlights Fiscal Year March 2014 First Half
FISCAL YEAR MARCH 2015 THIRD QUARTER FINANCIAL RESULTS. Updated Mazda CX-5 (Japanese specification model)
") FISCAL YEAR MARCH 2015 THIRD QUARTER FINANCIAL RESULTS Updated Mazda CX-5 (Japanese specification model) Mazda Motor Corporation February 4, 2015 1 PRESENTATION OUTLINE Highlights Fiscal Year March 2015
FISCAL YEAR MARCH 2015 THIRD QUARTER FINANCIAL RESULTS Updated Mazda CX-5 (Japanese specification model) Mazda Motor Corporation February 4, 2015 1 PRESENTATION OUTLINE Highlights Fiscal Year March 2015
FISCAL YEAR MARCH 2018 FIRST HALF FINANCIAL RESULTS
 FISCAL YEAR MARCH 2018 FIRST HALF FINANCIAL RESULTS PRESENTATION OUTLINE Highlights Fiscal Year March 2018 First Half Results Fiscal Year March 2018 Full Year Forecast Progress of Key Initiatives/ Business
I remind you that our presentation is available on our website. We can start from the first 2 slides that show Piaggio Group First
 CONFERENCE CALL 2009 1 st HALF RESULTS Good afternoon and welcome to everybody. I remind you that our presentation is available on our website. We can start from the first 2 slides that show Piaggio Group
FISCAL YEAR MARCH 2018 THIRD QUARTER FINANCIAL RESULTS
 FISCAL YEAR MARCH 2018 THIRD QUARTER FINANCIAL RESULTS PRESENTATION OUTLINE Highlights Fiscal Year March 2018 Nine Month Results Fiscal Year March 2018 Full Year Forecast Progress of Key Initiatives 1
FISCAL YEAR MARCH 2018 FIRST QUARTER FINANCIAL RESULTS
 FISCAL YEAR MARCH 2018 FIRST QUARTER FINANCIAL RESULTS PRESENTATION OUTLINE Highlights Fiscal Year March 2018 First Quarter Results Fiscal Year March 2018 Full Year Forecast Structural Reform Stage 2 Progress
Record CY 2016 EPS-diluted-adjusted of $6.12, an increase of $1.10 Y-O-Y. Q EPS-diluted-adjusted of $1.28, a decrease of $0.11 Y-O-Y.
 1 2 3 Q4 2016 global deliveries up 0.1 million units year-over-year (Y-O-Y), a 3.3% increase. Volume gains primarily in North America and China, offset by reductions in International Operations (excluding
FISCAL YEAR MARCH 2015 FIRST HALF FINANCIAL RESULTS. New Mazda Demio
 FISCAL YEAR MARCH 2015 FIRST HALF FINANCIAL RESULTS New Mazda Demio Mazda Motor Corporation October 31, 2014 1 PRESENTATION OUTLINE Highlights Fiscal Year March 2015 First Half Results Fiscal Year March
Conférence d Automne - Cheuvreux. Paris, September 26 th, 2011
 Conférence d Automne - Cheuvreux Paris, September 26 th, 2011 This presentation may contain forward-looking statements. Such forward-looking statements do not constitute forecasts regarding the Company
Bernstein Strategic Decisions Conference 2018
 Bernstein Strategic Decisions Conference 2018 Forward-Looking Statements Certain statements in this presentation, other than statements of historical fact, including estimates, projections, statements
FISCAL YEAR ENDING MARCH 2012 FIRST HALF FINANCIAL RESULTS
 FISCAL YEAR ENDING MARCH 2012 FIRST HALF FINANCIAL RESULTS Mazda Motor Corporation November 2, 2011 New Mazda CX-5 (European specifications) 1 PRESENTATION OUTLINE Highlights Fiscal Year Ending March 2012
FISCAL YEAR END MARCH 2013 FIRST HALF FINANCIAL RESULTS. New Mazda6 (Atenza)
") FISCAL YEAR END MARCH 2013 FIRST HALF FINANCIAL RESULTS New Mazda6 (Atenza) Mazda Motor Corporation October 31, 2012 1 PRESENTATION OUTLINE Highlights Fiscal Year March 2013 First Half Results Fiscal Year
FISCAL YEAR END MARCH 2013 FIRST HALF FINANCIAL RESULTS New Mazda6 (Atenza) Mazda Motor Corporation October 31, 2012 1 PRESENTATION OUTLINE Highlights Fiscal Year March 2013 First Half Results Fiscal Year
FISCAL YEAR ENDED MARCH 2011 FINANCIAL RESULTS
 FISCAL YEAR ENDED MARCH 211 FINANCIAL RESULTS Mazda Motor Corporation April 28, 211 Mazda MINAGI 1 PRESENTATION OUTLINE Highlights Fiscal Year Ended March 211 Results In Summary Question & Answer Session
Lazydays Holdings, Inc. Reports Second Quarter 2018 Financial Results
 News Contact: +1 (813) 204-4099 investors@lazydays.com Lazydays Holdings, Inc. Reports Second Quarter 2018 Financial Results Tampa, FL (August 9, 2018) Lazydays Holdings, Inc. ( Lazydays )(NasdaqCM: LAZY)
FISCAL YEAR END MARCH 2013 FIRST QUARTER FINANCIAL RESULTS
 FISCAL YEAR END MARCH 213 FIRST QUARTER FINANCIAL RESULTS New MAZDA CX-5 Mazda Motor Corporation July 31, 212 1 PRESENTATION OUTLINE Highlights Fiscal Year End March 213 Results Update of Structural Reform
Presentation to Investors Q results ROYAL DSM HEALTH NUTRITION MATERIALS
 Presentation to Investors Q3 2016 results ROYAL DSM HEALTH NUTRITION MATERIALS Safe harbor statement This presentation may contain forward-looking statements with respect to DSM s future (financial) performance
Nissan Motor Co., Ltd. February 12 th, 2019
 Nissan Motor Co., Ltd. February 12 th, 2019 NET REVENUE 2,875.5 3,045.7 OPERATING PROFIT *1 NET INCOME 301.6 FREE CASH FLOW (AUTO) NET CASH (AUTO) 1,311.4 1,334.4 US TAX REFORM 207.7 82.4 103.3 93.9 *2
Lazydays Holdings, Inc. Reports Third Quarter 2018 Financial Results
 News Contact: +1 (813) 204-4099 investors@lazydays.com Lazydays Holdings, Inc. Reports Third Quarter 2018 Financial Results Tampa, FL (November 8, 2018) Lazydays Holdings, Inc. ( Lazydays ) (NasdaqCM:
MONRO MUFFLER BRAKE, INC. PROVIDES FOURTH QUARTER AND FISCAL 2017 FINANCIAL RESULTS
 CONTACT: John Van Heel Chief Executive Officer (585) 647-6400 Robert Gross Executive Chairman (585) 647-6400 FOR IMMEDIATE RELEASE Brian D Ambrosia Senior Vice President Finance Chief Financial Officer
TOFAŞ Q ANALYST PRESENTATION
 TOFAŞ Q1 2016 ANALYST PRESENTATION 03.05.2016 1 2016 Q1 AGENDA Highlights Turkish Automotive Industry Production & Capacity Utilization Domestic Market Developments Tofaş Domestic Market Performance Export
Q SALES Strong organic growth, confirmed momentum. October 12, 2017
 Q3 2017 SALES Strong organic growth, confirmed momentum October 12, 2017 Q3 2017 Sales Key facts Sales Since January 1, 2017, Faurecia reports on value-added sales, which are total sales less monolith
FY17 RESULTS BUSINESS UPDATES FY18 OUTLOOK. Nissan Motor Co., Ltd. May 14 th, 2018
 Nissan Motor Co., Ltd. May 14 th, 2018 RESULTS BUSINESS UPDATES FY18 OUTLOOK www.nissan-global.com Copyright NISSAN MOTOR CO., LTD. All rights reserved. 2 GLOBAL 91.81 5.08 TIV * 1 vs. 93.52 GLOBAL +1.9%
Harley-Davidson, Inc Second Quarter Update July 21, 2015
 2015 Harley-Davidson Sportster Forty-Eight - Customized Harley-Davidson, Inc. 2015 Second Quarter Update July 21, 2015 Harley-Davidson, Inc. 2015 Second Quarter Update This presentation supports the quarterly
Third Quarter 2018 Performance and Business Update. October 24, 2018
 Third Quarter 2018 Performance and Business Update October 24, 2018 1 Important Notice Please read this management presentation together with the Company s press release issued earlier today announcing
Q Financial Results
 Q3 2018 Financial Results 1 Forward-looking statement The statements on the future in this presentation, including expected sales and earnings, are associated with risks and uncertainties and may be affected
Third Quarter 2017 Performance and Business Update. October 26, 2017
 Third Quarter 2017 Performance and Business Update October 26, 2017 1 Important Notice Please read this management presentation together with the Company s press release issued earlier today announcing
Kongsberg Automotive ASA. Fourth quarter February 28, 2019
 Kongsberg Automotive ASA Fourth quarter - February 28, 2019 Highlights Q4 Sales Revenues grew by 21 (7.3%) YoY to 288 including negative FX effects of 1. We booked new business with 77 in expected annual
Q3 & 9M 2018 Results Presentation. October 24 th, 2018
 Q3 & 9M 2018 Results Presentation October 24 th, 2018 Q3 & 9M HIGHLIGHTS & CATEGORY SPOTLIGHTS Gonzalve BICH 3Q and 9M 2018 Results Presentation 2 9 Months 2018 Key Messages Continued challenging trading
1 st Half 2018 Results. August 1 st, 2018
 1 st Half 2018 Results August 1 st, 2018 H1 HIGHLIGHTS & CATEGORY SPOTLIGHTS Gonzalve BICH 2 First Half 2018 Key Messages Challenging market and business environment Continued investment in targeted Brand
Q Analyst Teleconference. 9 August 2018
 9 August 218 Disclaimer This presentation contains forward-looking statements that reflect the Company management s current views with respect to certain future events. Although it is believed that the
Q2 and Half-Year 2017 Results. July 26, Q2 and Half-Year 2017 Results / July 26, 2017 /
 Q2 and Half-Year 2017 Results July 26, 2017 Q2 and Half-Year 2017 Results / July 26, 2017 / Contents Results for Q2 2017 Outlook for 2017 Development at the divisions Q2 and Half-Year 2017 Results / July
Strong performance by the Bolloré Group s operating activities in 2018 Mr Cyrille Bolloré unanimously appointed Chairman and Chief Executive Officer
 PRESS RELEASE 2018 results (1) March 14, 2019 Strong performance by the Bolloré Group s operating activities in 2018 Mr Cyrille Bolloré unanimously appointed Chairman and Chief Executive Officer Revenue:
Harley-Davidson, Inc Third Quarter Update October 20, 2015
 2016 Harley-Davidson Softail Fat Boy S Harley-Davidson, Inc. 2015 Third Quarter Update October 20, 2015 Harley-Davidson, Inc. 2015 Third Quarter Update This presentation supports the quarterly conference
FY16 results. Business updates. FY17 outlook. Nissan Motor Co., Ltd. May 11 th, 2017
 Nissan Motor Co., Ltd. May 11 th, 2017 results Business updates FY17 outlook www.nissan-global.com Copyright NISSAN MOTOR CO., LTD. All rights reserved. 2 (TSE REPORT BASIS CHINA JV EQUITY BASIS) NET REVENUE
JAGUAR LAND ROVER RESULTS FOR THE THREE MONTHS ENDED 31 DECEMBER th FEBRUARY 2017
 JAGUAR LAND ROVER RESULTS FOR THE THREE MONTHS ENDED 31 DECEMBER 2016 14 th FEBRUARY 2017 DISCLAIMER Statements in this presentation describing the objectives, projections, estimates and expectations of
Mon. 4/19 AM Harley-Davidson, Inc Fourth Quarter Update
 Mon. 4/19 AM Harley-Davidson, Inc. 2013 Fourth Quarter Update January 30, 2014 2013 Fourth Quarter Update These slides are intended to support the material discussed in the corresponding conference call.
Third Quarter Results (ended December 31, 2014)
") Fiscal Year 214 (ending March 31, 215) Third Quarter Results (ended December 31, 214) Brother Industries, Ltd. February 4, 215 Information on this report, other than historical facts, refers to future
Fiscal Year 214 (ending March 31, 215) Third Quarter Results (ended December 31, 214) Brother Industries, Ltd. February 4, 215 Information on this report, other than historical facts, refers to future
Fact Sheet for Q April 22, 2016
 Fact Sheet for Q1 2016 April 22, 2016 Contents Daimler Group Stock Market Information 3 Earnings and Financial Situation 4-13 Information for Divisions Mercedes-Benz Cars 14-17 Daimler Trucks 18-22 Mercedes-Benz
Jaguar Land Rover Results For the quarter ended 30 June August 2015
 Jaguar Land Rover Results For the quarter ended 30 June 2015 7 August 2015 1 Disclaimer Statements in this presentation describing the objectives, projections, estimates and expectations of Jaguar Land
Roadshow Presentation
 Roadshow Presentation June 2, Wilfried Trepels, CFO 1 SAF-HOLLAND - Components Fifth Wheels Kingpins Suspensions Landing Gear Axle Systems 2 SAF-HOLLAND - Business Units Trailer Systems Powered Vehicle
Mazda Motor Corporation FISCAL YEAR MARCH 2016 FIRST HALF FINANCIAL RESULTS (Speech Outline)
") (For your information) November 5, 2015 Mazda Motor Corporation FISCAL YEAR MARCH 2016 FIRST HALF FINANCIAL RESULTS (Speech Outline) Representative Director Executive Vice President Akira Marumoto 1. HIGHLIGHTS
(For your information) November 5, 2015 Mazda Motor Corporation FISCAL YEAR MARCH 2016 FIRST HALF FINANCIAL RESULTS (Speech Outline) Representative Director Executive Vice President Akira Marumoto 1. HIGHLIGHTS
Q SALES Strong outperformance in all regions. April 20, 2018
 Q1 2018 SALES Strong outperformance in all regions April 20, 2018 Q1 2018 Sales - Key Facts Impact from IFRS15 implementation In 2017, Faurecia had already partly anticipated IFRS15 through the presentation
Respect for customers, partners and staff. Service: another name for the respect that a company owes its customers, partners and staff.
 Respect for customers, partners and staff Service: another name for the respect that a company owes its customers, partners and staff. Vehicle glass KEY FIGURES (in EUR million) 2004 2003 % change Total
282m 75% +575m. Net sales Operating income before non-recurring items. Operating margin before non-recurring items. Net Loss.
 First-Half 2009 Financial Highlights Net sales Operating income before non-recurring items Operating margin before non-recurring items Net Loss Net debt-to-equity ratio Free cash flow** 7,134m 282m 4.0%
Third Quarter Results (ended December 31, 2013)
") Fiscal Year 213 (ending March 31, 214) Third Quarter Results (ended December 31, 213) Brother Industries, Ltd. February 4, 214 Information on this report, other than historical facts, refers to future
Fiscal Year 213 (ending March 31, 214) Third Quarter Results (ended December 31, 213) Brother Industries, Ltd. February 4, 214 Information on this report, other than historical facts, refers to future
American Railcar Industries, Inc.
 American Railcar Industries, Inc. Exhibit 99.2 Q3 2017 Supplemental Information Investor Contact: 636.940.6000 Website: americanrailcar.com Forward Looking Disclaimer Safe Harbor Statement This presentation
Mazda Motor Corporation June 17, 2011
 FY ENDING MARCH 2012 FINANCIAL FORECAST New MAZDA Demio 13-SKYACTIV Mazda Motor Corporation June 17, 2011 1 PRESENTATION OUTLINE FY ending March 2012 Forecast Updates of Framework for Medium- and Long-term
Fiscal Year 2012: Year of record operational performance
 Ranshofen, March 1, 2013 Fiscal Year 2012: Year of record operational performance Year of record operational performance: - 327,800 tons of external shipments - 266,900 tons of scrap charged in Ranshofen
This presentation may contain statements that are forward looking. These statements are based on current expectations and assumptions that are
 This presentation may contain statements that are forward looking. These statements are based on current expectations and assumptions that are subject to risks and uncertainties, which may cause actual
EXANE BNP PARIBAS 13th European Seminar June 8, 2011
 EXANE BNP PARIBAS 13th European Seminar June 8, 2011 This presentation may contain forward-looking statements. Such forward-looking statements do not constitute forecasts regarding the Company s results
PRESS RELEASE PIAGGIO GROUP: FIRST NINE MONTHS Consolidated net sales million ( 1,112.3 mln in first nine months 2012)
") PRESS RELEASE PIAGGIO GROUP: FIRST NINE MONTHS 2013 Consolidated net sales 955.0 million ( 1,112.3 mln in first nine months 2012) Ebitda 133.7 million ( 156.0 mln in first nine months 2012) Ebitda margin
PRESS RELEASE PIAGGIO GROUP: FIRST NINE MONTHS 2013 Consolidated net sales 955.0 million ( 1,112.3 mln in first nine months 2012) Ebitda 133.7 million ( 156.0 mln in first nine months 2012) Ebitda margin
BMW GROUP QUARTERLY REPORT. TO 30 SEPTEMBER 2014
 . BMW GROUP QUARTERLY REPORT. TO 30 SEPTEMBER 2014 THE BMW GROUP IS WELL ON TRACK AND PERFORMS IN LINE WITH THE GUIDANCE. The BMW Group is well on track to reach its targets for 2014. Full year guidance
On track. Investor and Analyst Presentation On the Occasion of the Release of the Preliminary Figures for FY 2011 Hanover, 19 January 2012
 On track. Investor and Analyst Presentation On the Occasion of the Release of the Preliminary Figures for FY 2011 Agenda Delticom at a Glance Business Model Profit & Loss Balance Sheet Outlook 2 Agenda
ABB delivers strong order growth and cash in Q2
 ABB delivers strong order growth and cash in Orders up 13% 1 ; book-to-bill ratio of 1.04x 2 Group operational EBITDA 3 impacted by loss in Power Systems (PS) Decisive step change actions implemented in
ZF posts record sales in 2017; announces increased research and development activities
 Page 1/5, March 22, 2018 ZF posts record sales in 2017; announces increased research and development activities ZF chief executive officer announces further expansion of research and development activities
Interim results June 30, 2003
 1 Interim results June 30, 2003 2 In units W orldwide sales at June 30 (cars and light commercial vehicles) > Worldwide sales at June 30, 2003: 1,689,200 cars and light commercial vehicles, versus 1,656,900
On track. Investor and Analyst Presentation On the Occasion of the Release of the Preliminary Figures for 9M 2011 Hanover, 18 October 2011
 On track. Investor and Analyst Presentation On the Occasion of the Release of the Preliminary Figures for 9M 2011 Agenda Delticom at a Glance Business Model Profit & Loss Balance Sheet Outlook 2 Agenda
2017 Q3 results. Millicom International Cellular S.A. Mauricio Ramos, CEO Tim Pennington, CFO October 25, 2017
 2017 Q3 results Millicom International Cellular S.A. Mauricio Ramos, CEO Tim Pennington, CFO October 25, 2017 Disclaimer This presentation may contain certain forward-looking statements with respect to
Q3 Results November 16, 2006 Analyst Presentation
 Q3 Results 2006 November 16, 2006 Analyst Presentation Group Sales (in million Euro) Total Sales 2,395 +3.3% (+2.4%)* 2,474 Split per Business Group (YTD) Specialty Products 7% Q3 797 +1.0% (+2.5%)* 805
FY 2010 first-half financial results
 FY 2010 first-half financial results November 4, 2010 Nissan Motor Co., Ltd. first-half financial results Key performance indicators: Financial results (billion yen) Net revenue Operating profit Net income
BMW Group posts record earnings for 2010
 10.03.2011 BMW Group posts record earnings for 2010 Profit before tax rises to euro 4,836 million Profit before financial result climbs to euro 5,094 million Automobiles segment reports EBIT of euro 4,355
This presentation may contain statements that are forward looking. These statements are based on current expectations and assumptions that are
 This presentation may contain statements that are forward looking. These statements are based on current expectations and assumptions that are subject to risks and uncertainties, which may cause actual
FY2012 third-quarter financial results
 FY2012 third-quarter financial results Nissan Motor Co., LTD. February 8, 2013 Key performance indicators: financial results (billion yen) Net revenue 6,698.4 6,755.2 Operating profit 427.8 Net income
Third quarter results Matti Lievonen, President & CEO 26 October 2017
 Third quarter results 2017 Matti Lievonen, President & CEO 26 October 2017 Agenda 1. Q3/17 Group financials 2. January-September 2017 review 3. Q3/17 Segment reviews 4. Current topics 5. Appendix 2 Disclaimer
Monro, Inc. Second Quarter Fiscal 2019 Earnings Call. October 25, 2018
 Monro, Inc. Second Quarter Fiscal 2019 Earnings Call October 25, 2018 Safe Harbor Statement and Non-GAAP Measures Certain statements in this presentation, other than statements of historical fact, including
TOFAŞ RESULTS WEBCAST PRESENTATION
 TOFAŞ 31.12.2016 RESULTS WEBCAST PRESENTATION 02.02.2017 1 WEBCAST AGENDA Highlights Turkish Automotive Industry Production Domestic Market Developments Tofaş Domestic Market Performance Export Markets
RENAULT GROUP SOCIETE GENERALE CONFERENCE
 RENAULT GROUP SOCIETE GENERALE CONFERENCE DOMINIQUE THORMANN, EVP, CFO & RCI Banque CEO NOVEMBER 30th, 2011 DISCLAIMER Information contained within this document may contain forward looking statements.
FY2015 Third Quarter Financial Results
 FY2015 Third Quarter Financial Results Mitsubishi Motors Corporation February 3, 2016 FY2015 Third Quarter Financial Results All-new Pajero Sport 1 FY2015 1-3Q Results Summary (vs. FY2014 1-3Q) Increase
Harley-Davidson Announces 3rd Quarter Results, Unveils Long-Term Business Strategy
 Harley-Davidson Announces 3rd Quarter Results, Unveils Long-Term Business Strategy Retail Harley-Davidson Motorcycle Sales Decline Moderates from 2nd Quarter Operating Loss at Finance Unit Impacts Profit
FISCAL YEAR MARCH 2015 FINANCIAL RESULTS. New Mazda CX-3 (Japanese specification model)
") FISCAL YEAR MARCH 2015 FINANCIAL RESULTS New Mazda CX-3 (Japanese specification model) Mazda Motor Corporation April 24, 2015 1 PRESENTATION OUTLINE Highlights Fiscal Year March 2015 Results Fiscal Year
FISCAL YEAR MARCH 2015 FINANCIAL RESULTS New Mazda CX-3 (Japanese specification model) Mazda Motor Corporation April 24, 2015 1 PRESENTATION OUTLINE Highlights Fiscal Year March 2015 Results Fiscal Year
Q3 and January-September 2014 Results
 Q3 and January-September 2014 Results Bodo Uebber Member of the Board of Management Finance & Controlling and Daimler Financial Services October 23, 2014 1 2 Contents Results for Q3 2014 Outlook for 2014
Establishment of Joint Venture with PSA for EV Traction Motor Business
 NIDEC CORPORATION Establishment of Joint Venture with PSA for EV Traction Motor Business Nidec Corporation December 4 th, 2017 Note Regarding Forward-looking Statements These presentation materials and
Q2 and Half-Year 2013 Results
 Q2 and Half-Year 2013 Results July 24, 2013 Contents Results for Q2 2013 Outlook for 2013 Information on the Divisions 2 Results Q2 2013 Highlights of Q2 2013 Group unit sales 605,800 (+6%) Record unit
DEUTZ Investor Presentation August 2016
 DEUTZ Investor Presentation August 2016 Agenda DEUTZ strategy & positioning Financials Outlook 2 DEUTZ at a glance World s first engine factory founded in 1864 by N.A. Otto, the developer of the four the
Months Investor Presentation
 2018 9 Months Investor Presentation 25.10.2018 Disclaimer Ereğli Demir Çelik Fabrikaları T.A.Ş. (Erdemir) may, when necessary, make written or verbal announcements about forward-looking information, expectations,
Earnings conference call. Q4 and Full year 2015
 Earnings conference call Q4 and Full year 2015 Bo Annvik, CEO / Åke Bengtsson, CFO 11 February 2016 1 Agenda Business Highlights Market Update Sales Financials Outlook 2 2015 in numbers Operating margin
Financial Statements Matti Lievonen, President & CEO 7 February 2017
 Financial Statements 2016 Matti Lievonen, President & CEO Agenda 1 2 3 4 Year 2016 Financials 2016 Segment reviews Current topics 5 Appendix 2 Disclaimer The following information contains, or may be deemed
2011 Third Quarter Update 17 November 2011
 2011 Third Quarter Update 17 November 2011 Operations Highlights Group (In HK$ millions) 3Q11 3Q10 2011 2010 Sales 1,334 1,125 +19% 3,983 3,262 +22% Gross profit 767 638 +20% 2,348 1,875 +25% Gross margin
2010 Interim Results Presentation. August 23, 2010 Hong Kong
 Sinopec Corp. 21 Interim Results Presentation August 23, 21 Hong Kong Disclaimer i This presentation and the presentation materials distributed herein include forwardlooking statements. All statements,
This presentation may contain statements that are forward looking. These statements are based on current expectations and assumptions that are
 This presentation may contain statements that are forward looking. These statements are based on current expectations and assumptions that are subject to risks and uncertainties, which may cause actual
Q Matti Lievonen President and CEO
 Q1 2018 Matti Lievonen President and CEO CONTENTS 1. Q1 2018 review 2. Group financials 3. Segment reviews 4. Current topics 5. Appendix 2 Disclaimer The following information contains, or may be deemed
2017 Q3 REVENUE. October 25 th, 2017
 2017 Q3 REVENUE October 25 th, 2017 DISCLAIMER This presentation does not constitute an offer to sell, or a solicitation of an offer to buy, PEUGEOT SA ( Company ) shares. This presentation may contain
Volvo Group THIRD QUARTER 2015 JAN GURANDER. Volvo Group Headquarters Third quarter
 Volvo Group THIRD QUARTER 2015 JAN GURANDER 1 VOLVO GROUP Third quarter highlights NET SALES SEK bn 12 months 310 bn IMPROVED PROFITABILITY ON FLAT VOLUMES UNDERLYING OPERATING MARGIN 6.9% 67 73 OPERATING
rd Quarter Results. October 29, 2014
 2014 3 rd Quarter Results October 29, 2014 Safe Harbor Statement This document, and in particular the section entitled 2014 Outlook, contains forward-looking statements. These statements may include terms
Paris Tuesday, April 1, Europcar Groupe 2007 Annual Results
 Paris Tuesday, April 1, 2008 Europcar Groupe 2007 Annual Results Speakers Salvatore Catania Chief Executive Officer, Europcar Groupe Charles Desmartis Chief Financial Officer, Europcar Groupe 1 Europcar
Q Results. Bodo Uebber. Member of the Board of Management Finance & Controlling and Daimler Financial Services
 Q1 2014 Results Bodo Uebber Member of the Board of Management Finance & Controlling and Daimler Financial Services April 30, 2014 1 Contents Results for Q1 2014 Outlook for 2014 Information on the Divisions
Kongsberg Automotive ASA. Third quarter November 7, 2018
 Kongsberg Automotive ASA Third quarter - November 7, Q3 Highlights Continued improvements in turbulent times Revenues increased YoY by MEUR 18.3 (~8%) to MEUR 259 including negative FX effects of MEUR
Harley-Davidson, Inc Fourth Quarter Update January 28, 2016
 2016 Harley-Davidson Low Rider S Harley-Davidson, Inc. 2015 Fourth Quarter Update January 28, 2016 Harley-Davidson, Inc. 2015 Fourth Quarter Update This presentation supports the quarterly conference call
Interim statement as of 30 September 2017 Conference call
 Interim statement as of 30 September 2017 Conference call Dr. Volker Hues Member of the Board of Management, Finance Hamburg, 7 November 2017 Jungheinrich highlights Q1 Q3 2017 Forecast for the whole of
Full-year Report 2009
 Full-year Report 2009 Joakim Olsson CEO and President February 12, 2009 Innovative Vehicle Technology 2010-02-12 Summary 2009 Sales of SEK 5,622m (8,403) Adjusted for currency effects sales decreased by