Level 2 Alternatives Screening Report
|
|
|
- Vernon Fields
- 5 years ago
- Views:
Transcription


1 FEDERAL WAY TRANSIT EXTENSION Level 2 Alternatives Screening Report CENTRAL PUGET SOUND REGIONAL TRANSIT AUTHORITY
2
3 Table of Contents 1.0 Executive Summary 1.1 Purpose of This Report Purpose and Need of the FWTE Project Summary of Level 1 Evaluation Definition of Level 2 Alternatives Evaluation Criteria Level 2 Findings and Conclusions Alignment Alternatives Station Location Evaluation Conclusions and Next Steps Introduction 2.1 Relationship of the Study to Project Development Purpose and Need of the Federal Way Transit Extension Project Summary of Level 1 Evaluation Organization of this Report Level 2 Definition of Alternatives 3.1 Overview of Level 2 Alternatives Detailed Descriptions of SR 99 Alternatives Detailed Descriptions of I 5 Alternatives Evaluation Criteria 4.1 Level 1 Measures Not Evaluated in Level Objective 1: Provide Effective Transportation Solution to Meet Mobility Needs Objective 2: Support Equitable Mobility Objective 3: Serve Supportive Land Use Plans and Economic Development Objectives Objective 4: Preserve a Healthy Environment Objective 5: Design an Affordable and Constructible Project Level 2 Data Results Alignment Alternatives 5.1 Ridership Potential (2035) Connections to Regional Multimodal Transportation Systems Transit Dependent and Environmental Justice Populations Federal Way Transit Extension i Level 2 Alternatives Screening Report
4 Level 2 Alternatives Screening Report 5.4 Transit Supportive Land Use and Economic Development Policies Effect on Natural Environment Effect on Built Environment Design Considerations System Costs Level 2 Findings and Conclusions Alignment Alternatives 6.1 SR 99 Corridor Alternatives I 5 Corridor Alternatives Comparing SR 99 to I Special Alignment Issues Summary of Conclusions Station Evaluation 7.1 Station Evaluation Methodology Station Evaluation Data Results Summary Findings by Station Summary of Station Evaluation Conclusions Next Steps 8 1 Federal Way Transit Extension ii Level 2 Alternatives Screening Report
5 Level 2 Alternatives Screening Report Acronyms AA ACS BAT BRT BMPs CFR CTP EDR EIS ESD FHWA FTA FWTC FWTE GIS GMA HCC HCT HOV HUD KCM LOS LRT LWCF MAP 21 MPH MPO NEPA NRHP NWI O&M OCS P&R PSE PSRC Alternatives Analysis American Community Survey Business Access Transit Bus Rapid Transit Best Management Practices Code of Federal Regulations Comprehensive Transportation Plan Environmental Data Resource Environmental Impact Statement Employment Securities Division Federal Highway Administration Federal Transit Administration Federal Way Transit Center Federal Way Transit Extension Geographic Information System Growth Management Act Highline Community College High Capacity Transit High Occupancy Vehicle Department of Housing and Urban Development King County Metro Level of Service Light Rail Transit Land and Water Conservation Fund Moving Ahead for Progress in the 21 st Century Miles Per Hour Metropolitan Planning Organization National Environmental Policy Act National Register of Historic Places National Wetlands Inventory Operation and Maintenance Overhead Catenary System Park and Ride Puget Sound Energy Puget Sound Regional Council Federal Way Transit Extension iii Level 2 Alternatives Screening Report
6 Level 2 Alternatives Screening Report RCW SCC SEPA ST ST2 TAZ TOD TSP TSM WAC WSDOT Revised Code of Washington Standard Cost Categories State Environmental Policy Act Sound Transit Sound Transit 2 Plan Traffic Analysis Zone Transit Oriented Development Transit Signal Priority Transit System Management Washington Administrative Code Washington State Department of Transportation List of Tables and Exhibits TABLES Chapter 1 Executive Summary Table 1-1: SR 99 Hybrid Alternative Alignment Variations Table 1-2: Level 2 Evaluation Criteria and Measures Table 1-3: Initial List of Potential Stations Table 1-4: Pre-Screening of Initial List of Potential Stations Table 1-5: Level 2 Station Locations Table 1-6: Summary of Station Findings Chapter 2 Introduction Table 2-1: Results of Pre-Screening: Alternatives Not Evaluated in Level 1 Table 2-2: Level 1 Alternatives Chapter 3 Definition of Alternatives Table 3-1: SR 99 Hybrid Alternative Alignment: Segments and Descriptions Relative to SR 99 Chapter 4 Level 2 Evaluation Criteria Table 4-1: Level 2 Evaluation Criteria and Measures Table 4-2: Ridership Potential Measures Table 4-3: Connections to Regional Multimodal Transportation Systems Measures Table 4-4: Transit Dependent and Environmental Justice Population Measures Table 4-5: Transit Supportive Land Use and Economic Development Measures Table 4-6: Effect on Natural Environment Measures Table 4-7: Effect on Built Environment Measures Table 4-8: Design Consideration Measures Table 4-9: System Cost Measures Federal Way Transit Extension iv Level 2 Alternatives Screening Report
7 Level 2 Alternatives Screening Report Chapter 5 Level 2 Data Results Alignment Alternatives Table 5-1: Year 2035 Daily and Annual Ridership Forecasts by Alternative Table 5-2: Year 2035 Station Boardings by Alternative Table 5-3: Alternative Travel Times and Ridership Projections Table 5-4: Existing Traffic Signals Traversed by Alternative Table 5-5: Total Transit Vehicle Trips within ½ Mile of the Proposed Alternative Table 5-6: Subsidized Housing within ½ Mile of Alternatives Table 5-7: Existing Land Uses Within ½ Mile of Alternative [Acres (%)] Table 5-8: Comprehensive Plan Land Uses Within ½ Mile of Alternative [Acres (%)] Table 5-9: Underutilized Parcels Within ½ Mile of Alignment Table 5-10: High Density Zoning within ¼ Mile of Alignment Table 5-11: Population, Households, and Employment Within ½ Mile of Alternative Table 5-12: Park and Ride Lots in FWTE Study Area Table 5-13: Parking Potential Within ½ Mile of Alternative Table 5-14: Miles of Roadway within Station Areas Table 5-15: Wetland and Stream Effects by Alternative Table 5-16: Visual Effects by Alternative Table 5-17: Potential Displacements by Alternative Table 5-18: Community Facilities Effects by Alternative Table 5-19: Potential for Noise Effects by Alternative Table 5-20: Number of Congested Intersections Affected Table 5-21: Summary of Civil Construction Effects Table 5-22: Summary of Utility Providers Table 5-23: Summary of Existing Water Utilities Table 5-24: Summary of Existing Sewer Utilities Table 5-25: Summary of Existing Electrical Transmission and Distribution Facilities Table 5-26: Summary of Existing Stormwater Facilities Table 5-27: Summary of Existing Major Utilities Table 5-28: Total High Risk Sites within 1/8 Mile by Alternative Table 5-29: Estimated Capital Cost ($billion 2013) Chapter 6 Level 2 Findings and Conclusions Alignment Alternatives Table 6-1: SR 99 Elevated Median Alternative: Summary of Strengths and Weaknesses Table 6-2: 30th Avenue S. Elevated West Side with SR 99 Elevated Median Alternative: Summary of Strengths and Weaknesses Table 6-3: SR 99 Hybrid Alternative: Summary of Strengths and Weaknesses Table 6-4: I-5 Mixed West Side Alternative: Summary of Strengths and Weaknesses Table 6-5: I-5 Mixed West Side/Median Alternative: Summary of Strengths and Weaknesses Table 6-6: SR 99 and I-5: Summary of Strengths and Weaknesses by Corridor Chapter 7 Station Location Evaluation Table 7-1: Initial List of Potential Additional Station Locations Table 7.2: Pre-Screening of Initial List of Potential Station Locations Table 7-3: Level 2 Station Locations Table 7-4: Evaluation Measures Used for Station Evaluation Table 7.5: 2035 Alignment Ridership Potential Table 7-6: Year 2035 Daily Station Boardings Table 7-7: Travel Times for Alignments with Station Options Table 7-8: Existing Land Use by Station Area by Acres and Percent of Total Table 7-9: Planned Land Use by Station Area by Acres and Percent of Total Table 7-10: TOD/High Density Zoning by Station Area by Acres and Percent of Total Federal Way Transit Extension v Level 2 Alternatives Screening Report
8 Level 2 Alternatives Screening Report Table 7-11: Underutilized Parcels by Station Area by Acres and Percent of Total Table 7-12: Current Population, Employment, and Households Within each ½ mile Station Area Table 7-13: Existing Park-and-Ride Spaces and Utilization within Station Areas Table 7-14: Existing Road and Transit Access Table 7-15: Non-motorized Access at Station Areas Table 7-16: Strengths and Weaknesses of the Kent/Des Moines Station Table 7-17: Strengths and Weaknesses of the S 272 nd Street and SR 99 Station Table 7-18: Strengths and Weaknesses of the S 272 nd Street and I-5 Station Table 7-19: Strengths and Weaknesses of the FWTC Station Table 7-20: Strengths and Weaknesses of the S 216 nd Street and SR 99 Station Table 7-21: Strengths and Weaknesses of the S 260th Street and SR 99 Station Table 7-22: Strengths and Weaknesses of the S 288 th and SR 99 Station Table 7-23: Strengths and Weaknesses of the Dash Point Road and SR 99 Station Table 7-24: Strengths and Weaknesses of the S 216 th Street and I-5 Station Table 7-25: Strengths and Weaknesses of the S 260 th Street and I-5 Station Table 7-26: Strengths and Weaknesses of the S 288 th Street and I-5 Station Table 7-27: Summary of Station Findings Chapter 8 Next Steps No tables. EXHIBITS Chapter 1 Executive Summary Exhibit 1-1: FWTE Project Study Area Exhibit 1-2: Level 2 Alternatives Exhibit 1-3: SR 99 Hybrid Alternative Conceptual Alignment Exhibit 1-4a: Alternatives Data Summary Part One Exhibit 1-4b: Alternatives Data Summary Part Two Exhibit 1-5: Initial List of Potential Station Locations Exhibit 1-6: Level 2 Station Locations Exhibit 1-7: Station Data Summary Exhibit 1-8: Level 2 Station Results Chapter 2 Introduction Exhibit 2-1: Sound Transit Current Service and Future Projects Exhibit 2-2: FWTE Project Study Area Exhibit 2-3: Alternatives Analysis Process Chapter 3 Level 2 Definition of Alternatives Exhibit 3-1: Level 2 Alternatives Exhibit 3-2: SR 99 Elevated Median Alternative Alignment Exhibit 3-3: SR 99 Elevated Median Alternative Typical Cross Section Exhibit 3-4: 30 th Avenue S. West Side Alternative Alignment Exhibit 3-5: 30 th Avenue S. West Side Alternative Typical Cross Section Exhibit 3-6: SR 99 Hybrid Alternative Alignment Exhibit 3-7: SR 99 Hybrid Alternative Typical Cross Section (West) Exhibit 3-8: SR 99 Hybrid Alternative Typical Cross Section (Median) Exhibit 3-9: SR 99 Hybrid Alternative Typical Cross Section (East) Exhibit 3-10: I-5 Mixed West Side Alternative Alignment Exhibit 3-11: I-5 Mixed West Side Alternative Typical Cross Section Federal Way Transit Extension vi Level 2 Alternatives Screening Report
9 Level 2 Alternatives Screening Report Exhibit 3-12: I-5 Mixed Median/West Side Alternative Alignment Exhibit 3-13: I-5 Mixed Median/West Side Alternative Typical Cross Section for West Side Segments Exhibit 3-14: I-5 Mixed Median/West Side Alternative Typical Cross Section for Median Segments Chapter 4 Level 2 Evaluation Criteria No exhibits Chapter 5 Level 2 Data Results Alignment Alternatives Exhibit 5-1: Total Daily Transit Trips from the FWTE Study Area to Regional Growth and Manufacturing and Industrial Centers Exhibit 5-2: Percentage of Children Eligible for Free or Reduced Lunch Exhibit 5-3: Subsidized Housing Exhibit 5-4: Commute Cost by Traffic Analysis Zone Exhibit 5-5: Access to Express Transit Exhibit 5-6: Minority Populations Exhibit 5-7: Existing Land Use Exhibit 5-8: Planned Land Use Exhibit 5-9: Underutilized Parcels Exhibit 5-10: High-Density Zoning Exhibit 5-11: Wetlands and Stream Crossings Exhibit 5-12a: Visual Conditions in Landscape Unit 1 Exhibit 5-12b: Visual Conditions in Landscape Unit 2 Exhibit 5-12c: Visual Conditions in Landscape Unit 3 Exhibit 5-13: Community Facilities within 200 Feet of Alternatives Exhibit 5-14: Potential Intersection Effects Level of Service Exhibit 5-15: Hazardous Materials Sites Exhibit 5-15: Geologic Hazards Chapter 6 Level 2 Findings and Conclusions Alignment Alternatives Exhibit 6-1: Potential SR 99/I-5 Connection Alignments Chapter 7 Station Evaluation Exhibit 7-1: Initial List of Potential Station Locations Exhibit 7-2: Level 2 Station Locations Exhibit 7-3: Existing Land Use by Station Area Exhibit 7-4: Planned Land Use by Station Area Exhibit 7-5: TOD/High Density Zoning by Station Area Exhibit 7-6: Vacant and Underutilized Parcels by Station Area Exhibit 7-7: Non-Motorized Station Access Exhibit 7-8a: Station at Kent Des Moines: Location, Demographics, and Parking Exhibit 7-8b: Station at Kent Des Moines: Land Use and Demographics Exhibit 7-9a: Station at S. 272 nd Street and SR 99: Location, Demographics, and Parking Exhibit 7-9b: Station at S. 272 nd Street and SR 99: Land Use and Demographics Exhibit 7-10a: Station at S. 272 nd Street and I-5: Location, Demographics, and Parking Exhibit 7-10b: Station at S. 272 nd Street and I-5: Land Use and Demographics Exhibit 7-11a: FWTC: Location, Demographics, and Parking Exhibit 7-11b: FWTC: Land Use and Demographics Exhibit 7-12a: Station at S. 216 th Street and SR 99: Location, Demographics, and Parking Exhibit 7-12b: Station at S. 216 th Street and SR 99: Land Use and Demographics Exhibit 7-13a: Station at S. 260 th Street and SR 99: Location, Demographics, and Parking Exhibit 7-13b: Station at S. 260 th Street and SR 99: Land Use and Demographics Exhibit 7-14a: Station at S. 288 th Street and SR 99: Location, Demographics, and Parking Exhibit 7-14b: Station at S. 288 th Street and SR 99: Land Use and Demographics Federal Way Transit Extension vii Level 2 Alternatives Screening Report
10 Level 2 Alternatives Screening Report Exhibit 7-15a: Dash Point Road and SR 99: Location, Demographics, and Parking Exhibit 7-15b: Dash Point Road and SR 99: Land Use and Demographics Exhibit 7-16a: Station at S. 216 th Street and I-5: Location, Demographics, and Parking Exhibit 7-16b: Station at S. 216 th Street and I-5: Land Use and Demographics Exhibit 7-17a: Station at S. 260 th Street and I-5: Location, Demographics, and Parking Exhibit 7-17b: Station at S 260 th Street and I-5: Land Use and Demographics Exhibit 7-18a: Station at S. 288 th Street and I-5: Location, Demographics, and Parking Exhibit 7-18b: Station at S 288 th Street and I-5: Land Use and Demographics Exhibit 7-19: Level 2 Station Results Chapter 8 Next Steps Exhibit 8-1: FWTE Process and Schedule Federal Way Transit Extension viii Level 2 Alternatives Screening Report
 have conducted an Alternatives Analysis to start the public planning and environmental processes for the Federal")
11 1.0 Executive Summary 1.1 Purpose of This Report Sound Transit and the Federal Transit Administration (FTA) have conducted an Alternatives Analysis to start the public planning and environmental processes for the Federal Way Transit Extension (FWTE) in South King County in the metropolitan Puget Sound region. The proposed project is part of the Sound Transit 2 (ST2) Plan approved by voters in 2008 and would start at the regional light rail system at the future Angle Lake Station in the City of SeaTac at S. 200 th Street. Exhibit 1 1 shows where the FWTE is located. The FWTE is an element of the region s Metropolitan Transportation Plan (the Puget Sound Regional Council s [PSRC s] Transportation 2040), and Sound Transit s Long Range Transit Plan. These plans anticipate the eventual extension of high capacity transit (HCT) service south to Tacoma. This report is organized in six key sections, as follows: Introduction Level 2 Definition of Alternatives Level 2 Evaluation Criteria Level 2 Data Results Alignment Alternatives Level 2 Findings and Conclusions Alignment Alternatives Station Location Evaluation EXHIBIT 1-1 FWTE Project Study Area Federal Way Transit Extension 1-1 Level 2 Alternatives Screening Report 6/14/2013
12 1.0 Executive Summary 1.2 Purpose and Need of the Federal Way Transit Extension Project The purpose of the Federal Way Transit Extension is to expand the Sound Transit Link light rail system from SeaTac to the cities of Des Moines, Kent, and Federal Way in King County in order to meet the following objectives: Provide a rapid, reliable, accessible, and efficient alternative for travel to and from the corridor and other urban growth and activity centers in the region with sufficient capacity to meet projected demand. Expand mobility alternatives to traveling on congested roadways and improve connections to the regional multimodal transportation system with peak and off peak service. Provide the high capacity transit (HCT) infrastructure to support adopted regional and local land use, transportation, and economic development plans. Advance the long range vision, goals, and objectives for transit service established by the Sound Transit Long Range Plan for high quality regional transit service connecting major activity centers in King, Pierce, and Snohomish counties. Implement a financially feasible system that seeks to preserve and promote a healthy environment. The following conditions within the project corridor demonstrate the need for the project: North south transit demand is expected to grow by 30 to 40 percent by 2035 as a result of residential and employment growth in the FWTE corridor and regionally. The FWTE corridor population is a highly transit dependent population with needs for efficient, reliable regional connectivity. Congestion on I 5 and on the key corridor arterials leading in and out of the study area will increase and further degrade existing transit performance and reliability. There is a lack of reliable and efficient peak and off peak transit service connecting persons in the FWTE corridor with the region s growth centers. Regional and local plans call for HCT in the corridor consistent with PSRC s VISION 2040 and the Regional Transit Long Range Plan. Implementing the project will help meet environmental and sustainability goals of the state and region, including reduced vehicle miles traveled and greenhouse gas emissions. Any alternative evaluated for the FWTE must demonstrate the ability to address these needs and achieve the project purpose. Federal Way Transit Extension 1-2 Level 2 Alternatives Screening Report
13 1.0 Executive Summary 1.3 Summary of Level 1 Evaluation The development of alternatives for the FWTE was informed by FTA guidelines on project development and alternatives analyses. Potential alternatives for the FWTE came from two sources: previous regional and local planning studies and input from the public and agencies during a 30 day early scoping period between October 18 and November 19, The early scoping period included two public open houses (one in Des Moines and one in Federal Way), an online survey, and opportunities for the public to provide comments on comment forms at the meeting, online, or via postal mail. The public open houses provided several interactive opportunities for attendees to provide input, including a large map of the project corridor where attendees could draw alignment and/or station suggestions. An online agency meeting was also conducted and provided opportunities to ask questions and provide comments. Feedback received during the early scoping period was positive and indicated a desire for improved transit service in the project area. Comments provided by agencies, local jurisdictions, institutions, and members of the general public indicate a strong preference for light rail transit. Stakeholders expressed concerns about parking, travel time, multimodal connections, and connections to Tacoma and other transit facilities. Comments received on alignment, profile preference, and station locations were varied; strong preferences for one specific alignment, profile, or station location did not emerge. The alternatives considered included different modes, profiles and alignments. Mode refers to the method of transportation, such as bus or light rail. Profile refers to a vertical location, such as above grade (elevated), at grade, below grade (retained cut or tunnel), or mixture of one or more profile. Alignment refers to the horizontal location within a corridor. The mode evaluated in Level 1 is light rail transit (LRT) only. Bus rapid transit (BRT) was screened out prior to the Level 1 analysis. This screening is documented in Chapter 3, Pre Screening of the FWTE Level 1 Alternatives Screening Report. The following alternatives were evaluated in Level 1: SR 99 At Grade Median SR 99 Mixed Median SR 99 Elevated Median SR 99 Elevated East Side SR 99 Elevated West Side I 5 Mixed West Side I 5 Mixed West Side/Median 30 th Avenue S. At Grade Median Federal Way Transit Extension 1-3 Level 2 Alternatives Screening Report
14 1.0 Executive Summary 30 th Avenue S. Elevated Median 30 th Avenue S. Elevated East Side 30 th Avenue S. Elevated West Side 24 th Avenue S. At Grade Median 24 th Avenue S. Elevated Median 24 th Avenue S. Elevated East Side 24 th Avenue S. Elevated West Side Based on the results of the Level 1 Evaluation, the following alternatives were studied further in Level 2: SR 99 Elevated Median 30 th Avenue S. Elevated West Side (with SR 99 Elevated Median) I 5 Mixed West Side I 5 Mixed West Side/Median SR 99 Hybrid (new see below) The results of the Level 1 analysis showed that different segments of each of the SR 99 alternatives could work, but each one of them as a stand alone alternative had substantial flaws. A combination of conceptual design elements (a mix of east side, west side, and median alignment; at grade and elevated profile) could result in an alternative that operates better with less adverse effects than the stand alone SR 99 alignment alternatives studied in Level 1. For the Level 2 evaluation, this new alternative became the hybrid alternative. For more details on this analysis, refer to the FWTE Level 1 Alternatives Screening Report. 1.4 Definition of Level 2 Alternatives Exhibit 1 2 displays the alternatives under evaluation in Level SR 99 Elevated Median Alternative The SR 99 Elevated Median alternative would extend south from Angle Lake Station at S. 200 th Street along the west side of 28 th Avenue S. Where 28 th Avenue S. ends and the proposed SR 509 extension would cross under SR 99, the LRT guideway would be elevated west of SR 99 to cross SR 509, then transition to the SR 99 median. The guideway would be supported by columns located generally between the northbound and southbound travel lanes in most locations. Where a planted (or otherwise un traversable) median 12 or more feet wide exists today, the support columns would be assumed to be located there. This column placement could make it possible to avoid re building SR 99 travel lanes in conjunction with this proposed LRT project at such locations. At intersections or where the median space is occupied by a left Federal Way Transit Extension 1-4 Level 2 Alternatives Screening Report
15 1.0 Executive Summary EXHIBIT 1 2 Level 2 Alternatives Federal Way Transit Extension 1-5 Level 2 Alternatives Screening Report
16 1.0 Executive Summary turn or U turn lane, either SR 99 would be widened (in order to create space for columns) by relocating turn lanes, or an alternate method of supporting the elevated guideway (such as straddle bents or more sophisticated bridge structures) would be used th Avenue S. Elevated West Side Alternative For the purposes of Level 2 evaluation, the 30 th Avenue S. Elevated West Side alternative would transition to and from the SR 99 Median Elevated alternative. At the north end of this alternative, the alignment would transition out of the SR 99 median at around S. 220 th Street and head east to 30th Avenue S. The elevated guideway would continue south along the west side of 30 th Avenue S. between the traveled way and existing buildings, which are primarily multi family residential buildings to the north of Kent Des Moines Road and industrial commercial buildings to the south. The elevated guideway would cross Kent Des Moines Road with a single span (approximately 150 to 250 feet long) to avoid the potential negative effects that could be associated with placing a column in the center of the roadway. South of the Kent Des Moines station, the 30 th Avenue S. alignment would transition on an elevated guideway west to an elevated SR 99 elevated median alignment. From there south to the end of the project corridor, it would be identical to the SR 99 Median Elevated alternative described previously SR 99 Hybrid Alternative During the Level 1 evaluation, it became apparent that the SR 99 Elevated East Side and SR 99 Elevated West Side alternatives would each have too many substantial flaws to be considered on their own. However, these flaws were not consistent throughout the corridor. Each of these alternatives was defined for Level 1 as having the guideway only on one side of SR 99, but a closer look revealed that a viable alternative could be designed with the elevated guideway on one side of SR 99 in certain locations and on the other side (or in the median) in other locations, or even be at grade for certain side running segments to reduce costs. The alternative resulting from this combination approach was carried forward to be studied in Level 2, as the SR 99 Hybrid. The approximate alignment variations of the SR 99 Hybrid alternative are shown in Table 1 1. Federal Way Transit Extension 1-6 Level 2 Alternatives Screening Report
17 1.0 Executive Summary TABLE 1-1 SR 99 Hybrid Alternative Alignment Variations From To Orientation Relative to SR 99 Angle Lake Station S. 208 th Street Along 28 th Avenue S. and West of SR 99 S. 208 th Street North of Kent-Des Moines Road Median of SR 99 North of Kent-Des Moines Road S. 260 th Street West of SR 99 S. 260 th Street 16 th Avenue S. East of SR th Avenue S. S. 304 th Street West of SR 99 S. 304 th Street S. 312 th Street East of SR 99 Exhibit 1 3 shows the conceptual alignment variations for the SR 99 Hybrid alternative. Federal Way Transit Extension 1-7 Level 2 Alternatives Screening Report
18 1.0 Executive Summary EXHIBIT 1-3 SR 99 Hybrid Alternative Conceptual Alignment Federal Way Transit Extension 1-8 Level 2 Alternatives Screening Report
19 1.0 Executive Summary I-5 Mixed West Side Alternative At the north end of the corridor (just south of the Angle Lake Station), the I 5 Mixed West Side alternative would be identical to the other alternatives, extending the elevated guideway to the south along the west side of 28 th Avenue S. After crossing over SR 99 and the proposed SR 509 extension, the guideway would turn east to run along the south side of the proposed SR 509 extension to I 5, then south along the west side of the I 5 right of way. Near S. 316 th Street the alignment would turn west toward the FWTC. Mixed refers to the alternative s profile and indicates a combination of elevated and at grade profiles. This alternative would be at grade for the most part, but would be grade separated from all cross streets (S. 211 th Street, S. 216 th Street, Kent Des Moines Road [SR 516], S. 259 th Place, S. 272 nd Street, Military Road S. [twice], and S. 288 th Street) as well as other potential obstacles. The I 5 Mixed West Side alternative s proposed location places it close to several facilities that could affect the alignment and/or profile, including Highline Water District storage tanks, Puget Sound Energy s Midway Switch Station, the Midway Landfill, Mark Twain Elementary School, and the Truman High School complex I-5 Mixed West Side/Median Alternative The I 5 Mixed Median/West Side alternative would be identical to the I 5 Mixed West Side alternative from the north end of the project area to S. 240 th Street. At that point, the guideway would transition from the west side of the I 5 right of way, via elevated structure, to the freeway median. It would remain in the I 5 median to the Star Lake Park and Ride area, where it would transition back to the west side so that the S. 272 nd Street station could be placed close to the Park and Ride and avoid issues involved with fitting the station footprint in the median. South of the station, the guideway would transition back to the freeway median via elevated structure. Near S. 316 th Street the alignment would turn west toward the FWTC. 1.5 Evaluation Criteria The criteria used to evaluate the Level 2 alternatives originated from objectives derived from the project s Purpose and Need, described in Section 1.2. These objectives are: Objective 1: Provide an effective transportation solution to meet mobility needs Objective 2: Support equitable mobility Objective 3: Serve supportive land use plans and economic development objectives Objective 4: Preserve a healthy environment Objective 5: Design an affordable and constructible project Federal Way Transit Extension 1-9 Level 2 Alternatives Screening Report
20 1.0 Executive Summary Table 1 2 shows the evaluation criteria established for the Level 2 evaluation for alignments and stations. Each criterion has one or more quantitative or qualitative measures that are described in Chapter 4. These criteria and measures are intended to differentiate between alternatives in terms of project performance and potential impacts. Table 1-2 Level 2 Evaluation Criteria and Measures Evaluation Criteria Ridership potential Connections to regional multimodal transportation systems Transit-dependent and Environmental Justice populations Transit-supportive land use and economic development policies Effect on natural environment Effect on built environment Design considerations Level 2 Measures Daily and annual project riders Station boardings Travel time Transit integration with Link system Integration with bus facilities and services Student poverty Subsidized housing Cost of commuting Access to express transit Minority Populations Existing land use Planned land use High Density/TOD Zoning Underutilized parcels Population Employment Households Parking opportunities Non-motorized access Wetlands Streams Visual effects Potential displacements Community facilities Noise Vibration Traffic Construction effects Utilities Hazardous materials Geologic risks Federal Way Transit Extension 1-10 Level 2 Alternatives Screening Report
21 1.0 Executive Summary Table 1-2 continued System costs Station access Estimated capital costs Estimated operations and maintenance costs Daily project ridership and station boardings Travel time Existing land use Planned land use High Density/TOD Zoning Underutilized parcels Population Employment Households Access to regional activity centers Parking opportunities Motorized access Non-motorized access Estimated cost 1.6 Level 2 Findings and Conclusions Alignment Alternatives This section presents the results of the Level 2 analysis. Exhibits 1 4a and 1 4b contain a summary of the data results from the analysis of the alignment alternatives, organized by the evaluation criteria used to collect and analyze data. For a more detailed look at these results, refer to Chapter 5 of this report. The text that follows Exhibits 1 4a and 1 4b outlines the key findings and conclusions for each alternative studied in Level SR 99 Corridor The SR 99 corridor generally features robust land use variety and corridor access, with areas of opportunity for targeted transit oriented land use improvements along the proposed Light Rail Transit (LRT) alternatives. The SR 99 alternatives have been designed to connect these areas and optimize ridership by balancing the need for LRT system access with the need to serve regional destinations. The following subsections compare the SR 99 alternatives to each other SR 99 Elevated Median Alternative The SR 99 Elevated Median alternative would include a light rail guideway on vertical columns in the median of SR 99. It would require construction of guideway support columns in the median of SR 99, which currently has a planted strip or intersection turning lanes for nearly all of the length of the study corridor. Federal Way Transit Extension 1-11 Level 2 Alternatives Screening Report


22 1.0 Executive Summary EXHIBIT 1-4a Alternatives Data Summary Part 1 Federal Way Transit Extension 1-12 Level 2 Alternatives Screening Report

23 1.0 Executive Summary EXHIBIT 1-4b Alternatives Data Summary Part Two Federal Way Transit Extension 1-13 Level 2 Alternatives Screening Report
24 1.0 Executive Summary The location of the columns for the proposed transit guideway in the existing median of SR 99 would be positive for this alternative because it would, in many locations, minimize or eliminate the need to widen the SR 99 roadway. Where the proposed columns would be placed in an existing planted strip, it has been assumed that the columns would fit within the available space. As a result, the SR 99 Elevated Median alternative would have fewer business displacements than the SR 99 Hybrid. With the SR 99 Elevated Median alternative, residential displacements would be less than with each of the other SR 99 alternatives. Lane closures during construction activities would affect mobility within the SR 99 corridor. The elevated guideway would cross over major intersections such as the Kent Des Moines Road intersection on a long elevated structure in the median of SR 99, which would increase cost and complexity. With the elevated alignment in the median of SR 99, the number and locations of mid block left turns and U turns could be reduced and the revised median configuration could require additional roadway improvements to facilitate local circulation. This could result in additional traffic impacts at nearby signalized intersections. The SR 99 Elevated Median alternative would be somewhat close to noise sensitive receivers on both sides of the roadway, resulting in more potential noise effects than the SR 99 Hybrid alternative, as well as more potential indirect effects on community facilities th Avenue S. Elevated West Side Alternative The 30 th Avenue S. Elevated West Side alternative would include a light rail guideway on vertical columns on the west side of 30th Avenue S. between S. 220 th Street and S. 240 th Street. North and south of these points it would have the same alignment as the SR 99 Elevated Median alternative, and effects in these areas would be the same as the SR 99 Elevated Median alternative. North of Kent Des Moines Road, 30 th Avenue S. is a primarily residential street with several large multi family complexes as well as some single family homes. Locating the alignment on 30 th Avenue S. in this area would avoid the traffic, design and cost issues associated with putting the light rail guideway through the complex SR 99/Kent Des Moines Road intersection. It has greater potential for residential displacements and visual, noise and vibration effects than the other SR 99 alternatives, but would have fewer effects on businesses along SR 99 in this area. Some of the negative effects could be reduced by moving the transition from SR 99 to 30 th Avenue S. farther south than S. 220 th Street. Also, although this alternative was evaluated as if it was connected to the SR 99 Elevated Median alternative, it could be combined with the SR 99 Hybrid alternative to the north or the south, or it could be connected to an I 5 alternative to the south. Federal Way Transit Extension 1-14 Level 2 Alternatives Screening Report
25 1.0 Executive Summary SR 99 Hybrid Alternative The SR 99 Hybrid alternative light rail guideway would be constructed primarily (although not entirely) on either the east or the west side of SR 99, minimizing reconstruction of SR 99 and potential traffic effects associated with occupying the median. It would also avoid crossing the SR 99/Kent Des Moines Road intersection in the median by crossing Kent Des Moines Road on the west side of SR 99. This alternative would have the least potential for noise and vibration effects on residences among the SR 99 alternatives, as well as less potential for effects on traffic during construction and operation. This alternative would be located on the east side of SR 99 near the McSorley Creek wetland complex, resulting in potential effects to this wetland. These effects would be further defined in the EIS and would require additional information on the wetland boundary and the extent to which the wetland could be avoided. Being located on the side of the predominantly commercial SR 99 corridor, however would result in the greatest number of business displacements of any alternative, and could displace up to three commercial buildings where space is leased for religious facilities. The design of this alternative could be further refined to further avoid or minimize many of the identified adverse effects I-5 Corridor The I 5 corridor studied is primarily within the I 5 right of way, which is adjacent to primarily single family land uses, except at the interchanges at Kent Des Moines Road and S. 317 th /320 th streets, which have commercial land uses. The alternatives within this corridor are designed to connect access points at freeway interchanges to optimize ridership by balancing the need for LRT system access with the need to serve regional destinations. The I 5 alternatives are subject to ongoing review and coordination with WSDOT. The SR 167, SR 509, and I 5 Puget Sound Gateway Project ( the Gateway Project ) is a long term effort to improve roadway access to the ports of Seattle and Tacoma, in the interest of maintaining and enhancing Washington s global economic competitiveness. The Gateway Project features three projects that, when combined, could add substantial width to I 5 in the FWTE project study area. In some parts of the study area, this additional roadway width would occupy all or most of the available WSDOT right of way. The two I 5 alternatives being considered in this Level 2 screening process are subject to substantial change as new information becomes available about the right of way needs of the Gateway Project. Although these widening projects are not currently funded, discussions continue regarding the appropriate placement of the proposed LRT guideway along I 5. The assumptions contained in this report about LRT guideway placement represent the best Federal Way Transit Extension 1-15 Level 2 Alternatives Screening Report
26 1.0 Executive Summary information available at the time regarding right of way availability and WSDOT design coordination I 5 Mixed West Side Alternative The I 5 Mixed West Side alternative would be located along the west side of I 5, primarily within or adjacent to the WSDOT right of way. It would be at grade in some locations and grade separated in others. Construction within WSDOT right of way on the west side of I 5 would minimize the need for lane closures on local roads as well as on I 5. The land uses adjacent to I 5 are primarily residential. Consequently, this alignment has more potential for effects on residences, including displacements, noise, vibration and visual effects. This alternative would cross the Midway Landfill, which presents engineering challenges and additional costs. Both I 5 alternatives would also need to avoid or relocate the Highline Water District tanks and a major Puget Sound Energy substation. Coordination with WSDOT during the Level 2 process indicated that the availability of their right of way may be limited north of Kent Des Moines Road, due to potential conflicts with the planned SR 509 extension (as part of the Gateway Project) I 5 Mixed West Side/Median Alternative The I 5 Mixed West Side/Median alternative would be along the west side of I 5 primarily within or adjacent to the WSDOT right of way and within the median between the north and south bound lanes of I 5. This alternative would transition from west of I 5 to the I 5 median near S. 240 th Street, primarily to avoid crossing the Midway Landfill, and would cross back to the west side of I 5 for stations at S. 272 nd Street and the Federal Way Transit Center. Construction in the I 5 right of way would minimize disruption to the community, but could have effects on I 5 traffic. Construction in the median and to cross into and out of the median would result in lane closures and some traffic disruption on I 5, which would not occur with the I 5 Mixed West Side alternative. Land use adjacent to I 5 is primarily residential, and therefore the alignment would have less potential for effect on businesses. The potential for noise, vibration and visual effects on residences would be similar to the I 5 Mixed West Side alternative where the alignment is on the west side of I 5, but would be avoided when in the median. Coordination with WSDOT during the Level 2 process indicated that the availability of their right of way may be limited north of Kent Des Moines Road, due to potential conflicts with the planned SR 509 extension (as part of the Gateway Project). Other components of the Gateway Project may require use of the median south of Kent Des Moines Road. Federal Way Transit Extension 1-16 Level 2 Alternatives Screening Report
27 1.0 Executive Summary 1.7 Station Location Evaluation Identifying Station Locations The Level 2 alignment alternatives were evaluated with three proposed station locations as defined by previous planning documents. These three station locations, Kent Des/Moines, S. 272 nd, and Federal Way Transit Center (FWTC), are considered part of the baseline project definition and are referred to as baseline stations in this analysis. As part of the Level 2 Evaluation a comprehensive look at potential additional station locations was undertaken. The station evaluation began with identification of an initial list of potential station locations. The initial list was based in part on input received from the public during early scoping and agencies through agency coordination, and staff assessment of possible station locations. The initial list included 22 potential locations that were subjected to a pre screening process. Seven proposed locations were in very close proximity to baseline stations and were combined with these stations for purposes of this evaluation and are noted in Table 1 3. The initial list of potential station locations are listed in Table 1 3 and shown on Exhibit 1 5. Table 1-3 Initial List of Potential Stations Station Location Corridor (SR 99, I-5 or other) In Vicinity of Baseline Station? S. 216th St SR 99, I-5 No Kent/Des Moines Park-and-Ride I-5 No Highline Community College (HCC) parking lot SR 99 Yes, in vicinity of Kent/Des Moines Station Lowes parking lot along SR 99 (near HCC) SR 99 Yes, in vicinity of Kent/Des Moines Station S. 252nd Street Near Fred Meyer SR 99 No S. 260th Street SR 99, I-5 No Woodmont Library SR 99 Yes, in vicinity of S. 272nd Station LA Fitness parking lot (near Redondo Heights Park-and-Ride lot) SR 99 Yes, in vicinity of S. 272nd Station S. 288th Street SR 99, I-5, Military Road No S. Dash Point Road SR 99 No Easter Lake (approximately S. 312 th Street) SR 99 No S. 320th Street SR 99 Yes, in vicinity of FWTC Station The Commons at Federal Way SR 99, I-5 Yes, in vicinity of FWTC Station S. 320 th Park-and-Ride at I-5 I-5 Yes, in vicinity of FWTC Station 21 st Avenue S. near S. 336 th Street Beyond limits of study area No S. 348 th Street Park-and-Ride Beyond limits of study area No Kent Sounder Station Beyond limits of study area No The list of pre screened locations and the reasons for not evaluating them further are summarized below in Table 1 4. Federal Way Transit Extension 1-17 Level 2 Alternatives Screening Report
28 1.0 Executive Summary Table 1-4 Pre-Screening of Initial List of Potential Stations Station Location Kent/Des Moines Park-and-Ride (with an east side I-5 alignment) S. 252 nd St. near Fred Meyer S. 288 th St. between Military Road and I-5 Easter Lake 21 st Ave/S. 336 th Street (beyond the FWTE study area) S. 348 th Park-and-Ride (outside the FWTE study area) Kent Sounder Station (outside the FWTE study area) Pre-Screening Results This station location would only work with an east of I-5 alignment. An east of I-5 alignment is not under consideration. Existing land uses and planned land uses would not be very supportive of a light rail station in this location. This location is not well connected to cross streets that would provide good access to a station and additional transit transfer opportunities. This location is approximately 0.5 miles east of the SR 99 alternatives and 0.4 miles west of the I-5 alternatives. This location is approximately 0.2 miles west of the SR 99 alternatives, is farther away from the FWTC, and in a predominantly single-family neighborhood. There is no proposed light rail alignment in this area. This location is over 1 mile south of the southern terminus at the FWTC and outside the study area. There is no proposed light rail alignment in this area. This location is approximately 3 miles southwest of the southern terminus at the FWTC and outside the study area. There is no proposed light rail alignment near the Sounder alignment through Kent. This location is approximately 3 miles east of I-5 in downtown Kent and is outside the FWTE study area. After the pre screening, a smaller list of 11 potential station locations remained and were evaluated in the Level 2 evaluation. These included the 4 baseline stations (Kent/Des Moines Road, two at S. 272nd Street, and one at the FWTC) and 7 potential additional station locations. Four of the potential additional station locations are associated with the SR 99 alternatives and three are associated with the I 5 alternatives. The Level 2 stations are listed in Table 1 5 and shown in Exhibit 1 6. Federal Way Transit Extension 1-18 Level 2 Alternatives Screening Report


29 1.0 Executive Summary EXHIBIT 1-5 Initial List of Potential Station Locations Federal Way Transit Extension 1-19 Level 2 Alternatives Screening Report


30 1.0 Executive Summary EXHIBIT 1-6 Level 2 Station Locations Federal Way Transit Extension 1-20 Level 2 Alternatives Screening Report
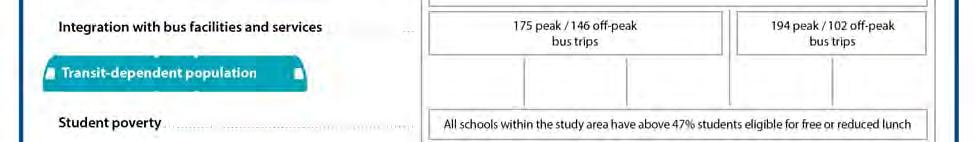
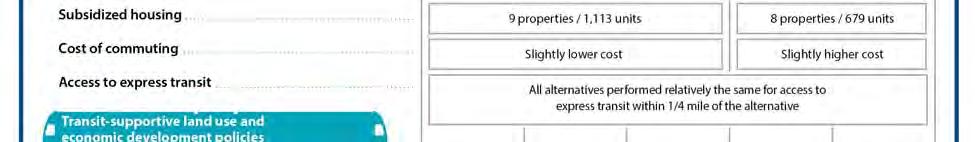
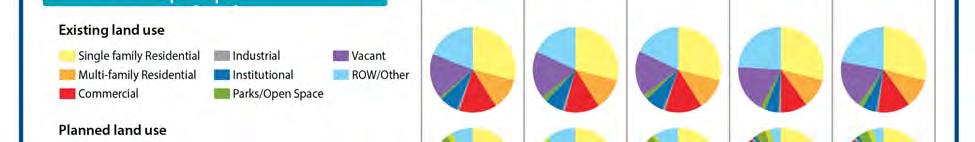
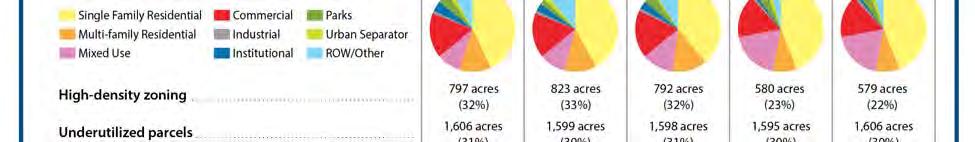
31 1.0 Executive Summary Table 1-5 Level 2 Station Locations Baseline Stations Potential Additional Stations-SR 99 Potential Additional Stations-I-5 Kent/Des Moines S. 216th Street S. 216th Street S. 272nd Street (Redondo Heights Park-and-Ride) S. 272nd Street (Star Lake Parkand-Ride) FWTC S. 260th Street S. 260th Street S. 288th Street S. 288th Street S. Dash Point Road Evaluating Station Locations Eleven station locations (four baseline stations, four potential additional stations on SR 99, and three potential additional stations on I 5) were evaluated using primarily the same evaluation measures as described for evaluation of the Level 2 alignment alternatives, Objective 3: Serve Supportive Land Use Plans and Economic Development Objectives. These measures were applied to a half mile radius around each potential station location in order to provide a more direct comparison between potential station locations. Additional measures for station boardings, access to activity centers and motorized access were also included. For more details on the specific measures, see Chapter 7 of this report. Daily project ridership and station boardings Employment Households Travel time Access to regional activity centers Existing land use Parking opportunities Planned land use Motorized access High Density/TOD Zoning Non motorized access Underutilized parcels Estimated costs Population Station Location Evaluation Results Exhibit 1 7 contains a summary of the station location evaluation. The summary graphic is organized by the evaluation criteria used to collect and analyze data. For a more detailed look at the station results by measure, refer to Chapter 7 of this report. Federal Way Transit Extension 1-21 Level 2 Alternatives Screening Report

32 1.0 Executive Summary Exhibit 1-7 Station Data Summary Federal Way Transit Extension 1-22 Level 2 Alternatives Screening Report
33 1.0 Executive Summary Station Location Findings and Conclusions The purpose of this section is to summarize the station evaluation findings and conclusions in a more comparative way to understand and document which station locations could be expected to be stronger performing stations and which would be weaker performing stations. The data compiled for the station location evaluation has been grouped into some general categories that put related characteristics together, as follows. 1. Transit characteristics: Includes ridership, increase in travel time, capital costs, and operations costs. 2. Existing conditions: Includes existing land use, proximity to activity centers, existing population and employment. 3. Potential for TOD: Includes planned land uses, TOD and high density zoning and vacant and underutilized parcels. 4. Access: Includes motorized and non motorized access such as roadway access, parkand ride access, bus access, pedestrian and bike access. 5. Included and authorized in the ST2 Plan or not. Table 1 6 summarizes the evaluation of each station by these generalized categories, with the exception of transit characteristics, which were found to be similar for all alternatives. It includes a generalized brief discussion about each of the above categories for each of the station locations. The results are also shown on Exhibit 1 8, with the strongest stations at the top of the results and the weaker stations lower in the results. The results of the station evaluation indicate that all baseline stations (Kent/Des Moines, S. 272 nd, FWTC) would be expected to perform strongly because they have transit supportive existing and planned land use and/or good multi modal access. In addition, two of the potential additional station locations, located at S. 216 th Street and S. 260 th Street at SR 99, show promise as potential future light rail stations. The remaining five station locations do not appear to be as strong candidates for future light rail stations because they do not have supportive existing or planned land use and/or good multimodal access. Federal Way Transit Extension 1-23 Level 2 Alternatives Screening Report
34 1.0 Executive Summary TABLE 1-6 Summary of Station Findings Baseline Station Existing Conditions Potential for TOD Access Kent Des/Moines S. 272nd Street (Redondo Heights Park-and-Ride) S. 272nd Street (Star Lake Park-and-Ride) FWTC SR 99 S. 216th Street S. 260th Street S. 288th Street S. Dash Point Road I-5 S. 216th Street S. 260th Street S. 288th Street High diversity, includes singlefamily, multi-family, commercial and institutional; highest population and HCC as employment base Moderate diversity, includes single-family, multi-family, and commercial; moderate population and employment base Primarily single family and multifamily residential; moderate population and low employment base Primarily commercial with some residential and park; high population and highest employment base High diversity, includes singlefamily, multi-family, commercial and institutional; moderate population and high employment base Mix of single family residential, multi-family residential and commercial; moderate population and employment base Primarily single family and multifamily residential; moderate population and employment base Primarily single family residential; moderate population and lower employment base High diversity, includes singlefamily, multi-family, commercial and institutional; moderate population and high employment base Mix of single family residential, multi-family residential and commercial; moderate population and employment base Primarily single family and multifamily residential; moderate population and low employment base Higher, mix of commercial, mixed use, and residential planned Higher, mix of commercial, mixed use, and residential Lower, primarily residential Higher, over 50% mixed use Planned mixed use and commercial in Pacific Ridge area Moderate, planned increase in single family residential, multi-family residential and commercial; highest amount of underutilized parcels Lower, predominantly single family residential Lower, predominantly single family residential Planned mixed use in Pacific Ridge area Lower, predominantly single family residential Lower, predominantly single family residential Good vehicle and transit access, improvements planned for bikes and pedestrians Good vehicle and transit access, improvements planned for bikes and pedestrians Good vehicle and transit access, improvements planned for bikes and pedestrians Good vehicle and transit access, improvements planned for bikes and pedestrians Good vehicle and transit access, bike lanes and sidewalks present on S. 216th Good vehicle and transit access, improvements planned for bikes and pedestrians Moderate vehicle and good transit access, improvements planned for bikes and pedestrians Moderate vehicle and good transit access, improvements planned for bikes and pedestrians No north/south access or transit service, bike lanes and sidewalks on S. 216th Street west of I-5 No north/south access or transit service, improvements planned for bikes and pedestrians No north/south access, one transit route, improvements planned for bikes and pedestrians Note: Ridership, increase in travel time, capital costs and operations costs would be similar for all station locations. ST2 Authorized Yes Yes Yes No No No No No No No No Federal Way Transit Extension 1-24 Level 2 Alternatives Screening Report
35 1.0 Executive Summary Exhibit 1-8 Level 2 Station Results Federal Way Transit Extension 1-25 Level 2 Alternatives Screening Report
36 1.0 Executive Summary 1.8 Summary Conclusions and Next Steps All of the alignment alternative evaluated in Level 2 will be presented to the public during the Environmental Impact Statement (EIS) scoping period including: SR 99 Elevated Median 30 th Avenue S. Elevated West Side (with SR 99 Elevated Median) I 5 Mixed West Side I 5 Mixed West Side/Median SR 99 Hybrid In addition, the results of the station location evaluation will be presented. This evaluation indicated that all of the baseline station locations performed strongly and two potential additional stations show good promise. Based on input received during the EIS scoping period, these alignment and station alternatives may be further refined. Subsequently, the Sound Transit Board will identify which alternatives to carry forward for further development, analysis, and environmental review under the National Environmental Policy Act (NEPA) and the State Environmental Policy Act (SEPA). The potential effects of the FWTE Project would be such that a NEPA/SEPA EIS is expected to be prepared to document the impacts of the project alternatives, and inform the decision making process. Work on the Draft EIS will start at the end of 2013 and take approximately 12 to 18 months to complete. A No Build Alternative will be identified to provide the basis for comparison of the impacts and benefits of the build alternatives. Multiple build alternatives are expected to be studied in the Draft EIS. Following public review and comment on the Draft EIS, the Sound Transit Board of Directors is expected to identify a preferred alternative for study in the Final EIS. Once a preferred alternative has been identified, Sound Transit will begin preliminary engineering on the preferred alternative and develop a Final EIS. Following publication of the Final EIS, the Sound Transit Board is expected to select the project to build and operate. Sound Transit anticipates FTA will issue a Record of Decision (ROD) in 2016 and the project will then move into final design, followed by construction, startup and testing, and ultimately operation. Service is planned to begin in Federal Way Transit Extension 1-26 Level 2 Alternatives Screening Report
37 2.0 Introduction This chapter provides an introduction to the Alternatives Analysis (AA) phase of the Federal Way Transit Extension (FWTE) project, some background on the study corridor, and an overview of the AA process. The Central Puget Sound Regional Transit Authority (Sound Transit) intends to extend regional high capacity transit (HCT) between the cities of SeaTac and Federal Way. The Sound Transit 2 (ST2) Plan, approved by voters in 2008, included environmental study and design of this extension. This 7.6 mile extension would extend HCT south from the future Angle Lake Station terminus of the Sound Transit Link light rail system at S. 200 th Street in SeaTac (scheduled to open in 2016) to the Federal Way Transit Center at S. 317 th Street. The voter approved additions to the ST Central Link light rail system over the next few years will bring 36 new miles of service to the north, south, and east, creating a 55 mile light rail system serving the Puget Sound region. The FWTE will help fulfill regional plans developed by the Puget Sound Regional Council (PSRC) and Sound Transit. PSRC s Vision 2040 (PSRC 2009) and Sound Transit s 2005 Regional Transit Long Range Plan (Sound Transit 2005) both call for future HCT in the FWTE corridor. Exhibit 2 1 shows the Regional Transit System Plan map. Exhibit 2 2 shows the project study area. Federal Way Transit Extension 2-1 Level 2 Alternatives Screening Report 6/13/2013


38 2.0 Introduction EXHIBIT 2-1 Sound Transit Current Service and Future Projects Federal Way Transit Extension 2-2 Level 2 Alternatives Screening Report


39 2.0 Introduction EXHIBIT 2-2 FWTE Project Study Area Federal Way Transit Extension 2-3 Level 2 Alternatives Screening Report
40 2.0 Introduction 2.1 Relationship of this Study to Project Development This report summarizes the portion of the AA process that has been completed to identify and evaluate viable alternatives. The purpose of this is to define the transportation needs in the corridor and identify alternatives to study in the EIS. While this AA is a local process, because the resulting project would potentially use some federal funding, and the Federal Transit Administration (FTA) is the steward of federal transit funding, the FTA s general guidelines for how to conduct AA have been incorporated into the study. The alternatives that best meet the project Purpose and Need would later be analyzed in a draft Environmental Impact Statement (EIS) under the National Environmental Policy Act (NEPA) and under the Washington State Environmental Policy Act (SEPA). The study has identified an initial range of potential alternatives (based on previous plans and studies and input from the public and agencies) and evaluated the alternatives to determine which of the alternatives have the most promise and should undergo further study and design during the EIS process. At the end of the project development process, the preferred project will be selected by the Sound Transit Board and moved forward into further design, construction and eventual operations. The Level 1 evaluation applied both qualitative and quantitative criteria to measure the benefits, effects, and costs of the Level 1 alternatives. The best performing alternatives from Level 1 were carried forward for further study in Level 2. The Level 2 evaluation further developed the alternatives that were carried forward and then applied more rigorous criteria and analyses to that remaining, smaller set of alternatives. This evaluation compares each alternative s strengths and weaknesses relative to the other Level 2 alternatives. The technical analysis results of this Level 2 screening, along with the results of the scoping process, will be presented to the Sound Transit Board for identification of the alternatives that should be carried forward for more detailed analysis in the Draft Environmental Impact Statement (EIS). Exhibit 2 3 illustrates the steps in the AA process. Federal Way Transit Extension 2-4 Level 2 Alternatives Screening Report

41 2.0 Introduction EXHIBIT 2-3 Alternatives Analysis Process Federal Way Transit Extension 2-5 Level 2 Alternatives Screening Report
42 2.0 Introduction For the FWTE Sound Transit plans to maintain eligibility for future federal New Starts funding from the FTA. To be eligible for federal funding the planning process for the project must be done in compliance with FTA planning and project development guidance. The new transportation funding bill, Moving Ahead for Progress in the 21st Century (MAP 21), eliminates the formal AA requirement from the New Starts Program and instead relies on the review of alternatives performed during the metropolitan planning and environmental processes. However, in the FWTE corridor the AA process is continuing to evaluate a range of alternatives in order to complete a thorough corridor focused planning process. The following chapters document this local planning process both prior to initiation of the FWTE project and as part of this alternatives analysis. Throughout the AA and NEPA/SEPA processes, Sound Transit is committed to engaging the public, agencies, and key stakeholders. Agencies involved in the Interagency Working Group include each city in the corridor (SeaTac, Des Moines, Kent and Federal Way), Washington State Department of Transportation (WSDOT), PSRC, Highline Community College, and King County Metro. Key stakeholders include local community and business organizations and community service providers. Input from each of these groups (public, agencies, and stakeholders) is important throughout the process to ensure that community concerns and issues are considered during the evaluation and design process. 2.2 Purpose and Need of the Federal Way Transit Extension Project The purpose of the FWTE is to expand the Sound Transit Link light rail system from SeaTac to the cities of Des Moines, Kent, and Federal Way in King County in order to meet the following objectives: Provide a rapid, reliable, accessible, and efficient alternative for travel to and from the corridor and other urban growth and activity centers in the region with sufficient capacity to meet projected demand. Expand mobility alternatives to traveling on congested roadways and improve connections to the regional multimodal transportation system with peak and off peak service. Provide the HCT infrastructure to support adopted regional and local land use, transportation, and economic development plans. Advance the long range vision, goals, and objectives for transit service established by the Sound Transit Long Range Plan for high quality regional transit service connecting major activity centers in King, Pierce, and Snohomish counties. Implement a financially feasible system that seeks to preserve and promote a healthy environment. Federal Way Transit Extension 2-6 Level 2 Alternatives Screening Report
43 2.0 Introduction The following conditions within the project corridor demonstrate the need for the project: North south transit demand is expected to grow by 30 to 40 percent by 2035 as a result of residential and employment growth in the FWTE corridor and regionally. The FWTE corridor population is a highly transit dependent population with needs for efficient, reliable regional connectivity. Congestion on I 5 and on the key corridor arterials leading in and out of the study area will increase and further degrade existing transit performance and reliability. There is a lack of reliable and efficient peak and off peak transit service connecting people in the FWTE corridor with the region s growth centers. Regional and local plans call for HCT in the corridor consistent with PSRC s VISION 2040 and the Regional Transit Long Range Plan. Implementing the project will help meet environmental and sustainability goals of the state and region, including reducing vehicle miles traveled and greenhouse gas emissions. Any alternative evaluated for the FWTE must demonstrate the ability to address these needs and achieve the project purpose. 2.3 Summary of Level 1 Evaluation The Level 1 evaluation consisted of several steps, including: an analysis of comments received during the early scoping period, development of an initial list of mode and alignment alternatives, a pre screening of alternatives that did not meet the objectives identified in the Purpose and Need for the FWTE project, and an analysis of the Level 1 alternatives based on evaluation criteria established for the Level 1 evaluation. For more details, refer to the FWTE Level 1 Alternatives Screening Report Summary of Early Scoping Process Feedback received during the early scoping period was positive and indicated a desire for improved transit service in the project area. Alternatives considered include different modes, profiles, and alignments. Mode refers to the method of transportation, such as bus or light rail. Profile refers to a vertical orientation, such as above grade (elevated), at grade, below grade (retained cut or tunnel), or mixture these. Alignment refers to the horizontal location within a corridor. Comments provided by agencies, local jurisdictions, institutions, and members of the general public indicate a strong preference for light rail transit. Stakeholders expressed concerns about parking, travel time, multimodal connections, and connections to Tacoma and to other transit facilities. Comments received on alignment, profile preference, and station locations were varied; strong preferences for one specific alignment, profile, or station location did not emerge. Federal Way Transit Extension 2-7 Level 2 Alternatives Screening Report
44 2.0 Introduction For a more detailed explanation of the Early Scoping results, see the FWTE Early Scoping Summary Report Summary of Pre-Screening Process Some of the modes, profiles and alignment alternatives were not evaluated in the Level 1 process because they would not meet the stated purpose and need for the project or they had design features that would substantially increase the project cost compared to other alternatives without providing substantial benefits. Table 2 1 lists the results of the prescreening process, identifying the alternatives that were not further evaluated in Level 1. Table 2-1 Results of Pre-Screening: Alternatives Not Evaluated in Level 1 Alternative Type Alternative Corridor Reason for Not Evaluating in Level 1 Mode Transportation System Management (TSM) Bus Rapid Transit (BRT) I-5 or SR 99 I-5 or SR 99 Would not meet Purpose & Need Greater travel time, lower capacity, and inconsistency with existing local plans Profile Tunnel SR 99 Unnecessary risk and cost Alignment East Side I-5 Crossing at S. 272 nd Street Behind Businesses- West Side SR 99 I-5 and SR 99 combination West Side 24 th Avenue S. Higher cost, reduced accessibility, and inconsistency with local plans Increased travel time and avoidable environmental impacts Higher cost and lower ridership than other similar alternatives Extensive impacts to parks and other community facilities Alternatives Evaluated in Level 1 Table 2 2 lists the light rail alternatives that were considered in the Level 1 evaluation. Federal Way Transit Extension 2-8 Level 2 Alternatives Screening Report
45 2.0 Introduction Table 2-2 Level 1 Alternatives Corridor SR 99 I-5 30 th Avenue S. 24 th Avenue S. Profile At-grade Median Mixed Median Elevated Median Elevated West Side Elevated East Side Mixed West Side Mixed Median At-grade Median Elevated Median Elevated West Side Elevated East Side At-grade Median Elevated Median Elevated East Side A detailed explanation of the evaluation criteria used to analyze the Level 1 alternatives can be found in the FWTE Level 1 Alternatives Screening Report, Chapter Summary of Level 1 Results Based on the results of the Level 1 evaluation, the following alternatives are evaluated in the Level 2 Alternatives Screening Report: SR 99 Elevated Median 30 th Avenue S. Elevated West Side (with SR 99 Elevated Median) I 5 Mixed West Side I 5 Mixed West Side/Median SR 99 Hybrid (see below) The results of the Level 1 analysis showed that different segments of each of the SR 99 alternatives could work, but each one of them as a stand alone alternative had substantial flaws. A combination of conceptual design elements (a mix of east side, west side, and median alignment; at grade and elevated profile) could result in an alternative that operates better with less adverse effects than the stand alone SR 99 alignment alternatives studied in Level 1. For the Level 2 evaluation, this new alternative became the hybrid alternative. Federal Way Transit Extension 2-9 Level 2 Alternatives Screening Report
46 2.0 Introduction 2.4 Organization of this Report This report is organized by the following chapters: Chapter 1 Executive Summary: This chapter provides an overview of the alternatives evaluated in this study and the key findings and conclusions. Chapter 2 Introduction: This chapter provides an introduction to the alternatives analysis phase of the FWTE, some background on the corridor and an explanation of the alternatives analysis process. Chapter 3 Definition of Alternatives: This chapter describes the Level 2 alternatives. Maps and cross sections of each alternative are provided here. Chapter 4 Evaluation Criteria: This chapter presents the evaluation criteria used to examine and compare the alternatives defined in Chapter 3. These criteria relate directly to the Purpose and Need goals and objectives for the project. Chapter 5 Alignment Alternatives Data Results: This chapter provides the results of how each Level 2 alternative, described in Chapter 3, performs under each criterion described in Chapter 4. Results are organized by criteria and provide a comparison between alternatives for each criterion. Chapter 6 Level 2 Findings and Conclusions Alignment Alternatives: This chapter summarizes the key findings of each alternative as they relate to the evaluation criteria, and draws conclusions about the relative performance of each alternative. Chapter 7 Station Evaluation: This chapter identifies the station locations that are evaluated in Level 2 and provides the results of this evaluation. Chapter 8 Next Steps: This chapter indicates what steps will be taken next to advance the project, and how those steps fit in to the overall project development timeline. Federal Way Transit Extension 2-10 Level 2 Alternatives Screening Report
47 3.0 Definition of Alternatives The purpose of this chapter is to document the definition of the five alternatives evaluated in Level 2 of the Federal Way Transit Extension (FWTE) Alternatives Analysis (AA). Four of these alternatives were identified as exhibiting strong performance during the Level 1 evaluation and carried forward for further analysis in Level 2. The fifth is a hybrid made up of parts of multiple SR 99 alignment alternatives, that has been designed to capture the best performing parts of the elevated alignments on the east, west, and in the median of SR 99. The SR 99 Hybrid alternative was not evaluated in Level 1 in the configuration it has in Level 2, but nearly all of its components came from elements that were previously evaluated in Level Overview of Level 2 Alternatives Entering the Level 2 evaluation, there were two alternatives on I 5, two alternatives on SR 99, and one that uses both SR 99 and 30 th Avenue S. The Level 2 alternatives are listed below and shown schematically in Exhibit 3 1. SR 99 Elevated Median 30 th Avenue S. Elevated West Side (with SR 99 Elevated Median) SR 99 Hybrid I 5 Mixed West Side I 5 Mixed West Side/Median The use of mixed in the names of the I 5 alternatives refers to their vertical profile. It is intended to indicate that the tracks would be at grade in some locations and on an elevated structure in others. While it is possible that the proposed guideway could go under some roadways along I 5, those segments would be at grade for this analysis. Tunnel segments were suggested during early scoping, but the pre screening process, documented in the Level 1 Alternatives Screening Report, removed tunnels from further consideration for any alignment. Federal Way Transit Extension 3-1 Level 2 Alternatives Screening Report
48 3.0 Definition of Alternatives EXHIBIT 3-1 Level 2 Alternatives Federal Way Transit Extension 3-2 Level 2 Alternatives Screening Report
49 3.0 Definition of Alternatives Stations Each of the five Level 2 alignment alternatives has been evaluated with three proposed stations locations as defined by previous planning documents, including: Kent/Des Moines station (near S. 240 th Street) S. 272 nd Street station Federal Way Transit Center (FWTC)/S. 317 th Street station The specific location of the S. 272 nd Street station would vary depending on the alignment alternative. For example, a stop at S. 272 nd Street along I 5 would be at or near the existing Star Lake Park and Ride, while along SR 99 it would be at or near the existing Redondo Heights Park and Ride. Although Chapter 7 documents the analysis of some additional potential station locations in the project study area, only these three general station locations were assumed for the Level 2 comparison of alignment alternatives. Because the timing of funding for construction of the entire project is uncertain, each of these three stations could represent an interim southern terminus of the Link Light Rail system when it is built. Although the FWTC represents the southern limit of the Federal Way Transit Extension study, a further extension of the system south to Tacoma is in Sound Transit s Regional Transit Long Range Plan Alignment Design The alignment alternatives have been developed with attention to the design speed of the tracks. A key design objective for the project has been to optimize the time it takes for a light rail train to travel through the corridor, which in most cases means to design assuming that the vehicles can travel their maximum speed for the type of guideway, power, and control systems in place elsewhere on the Link system, which is 55 mph. Design speed was considered along with other issues including property impacts, utility impacts, and traffic operations constraints to define the Level 2 alternative alignments Operations Plan The light rail operations plan describes how frequently and in what hours of the day trains would run, in addition to which stations would be served and what the train lengths would be. This operations plan is the same for each of the five alternatives considered in the Level 2 evaluation. The light rail service would be provided at headways (distance or time between vehicles in a transit system) based on the service levels needed to meet the projected demand in the study area and the overall operations plan for the Link system. Peak headways are planned to be 8 minutes, and off peak headways are planned be 10 to 15 minutes, with service Federal Way Transit Extension 3-3 Level 2 Alternatives Screening Report
50 3.0 Definition of Alternatives provided between 5 a.m. and 1 a.m. (20 hours) daily. The system is designed to accommodate four car trains Transit Integration Transit integration for the Level 2 alternatives was not defined specifically for each individual alternative, but it could vary based on whether the light rail alignment would be primarily along SR 99 or along I 5. Below in the discussion of transit service integration, the integration with existing and other planned Link light rail service is discussed separately from integration with existing bus service Light Rail The proposed LRT service would be an extension of the existing Seattle oriented Link light rail service, including its extension from Sea Tac Airport south to the Angle Lake station at S. 200 th Street, which is currently under construction. The proposed Federal Way extension would extend the trackway by approximately 7.5 miles to the south, such that route and schedule information would be modified to reflect a longer system than prior to the extension. Light rail riders who would board at the new stations would not be required to transfer to reach the light rail stations north of the Federal Way extension. The same headways, train lengths, and schedules would be maintained throughout the extended line. Light rail vehicles serving the new stations would likely be stored and maintained at the existing operations and maintenance facility at S. Forest Street in Seattle Bus A preliminary concept of bus service has been developed for the study area for the purpose of providing information needed to generate preliminary ridership estimates in support of the alternatives screening process. Bus routes and headways in the corridor will be reviewed in greater detail during the EIS process, for potential optimization related to each EIS alternative. These changes could include the modification, combination, or elimination of routes, as well as increases or decreases in headway and/or service times (such as having routes that serve proposed LRT stations run more frequently). Potential changes to existing regional bus routes that travel in or through the study area could include: Elimination of some routes that would be duplicated by the proposed project Truncation of some routes that overlap with all or part of the proposed project Increasing frequency on some routes that would provide feeder service to proposed LRT stations Federal Way Transit Extension 3-4 Level 2 Alternatives Screening Report
51 3.0 Definition of Alternatives The following bus routes serving the study area were assumed to remain the same with the FWTE project, as described below: Inter county Pierce Transit routes serving the FWTC RapidRide service Some peak commuter routes that use I 5 in the study area 3.2 Detailed Descriptions of SR 99 Alternatives The detailed descriptions presented below for each alternative include an alignment map on an aerial photo background, typical cross section sketches and a narrative description highlighting key defining principles. General station locations have been identified for each alternative, but their specific locations and guideway alignments in the immediate vicinity of stations would be subject to additional design refinement in subsequent phases of the project SR 99 Elevated Median Alternative The SR 99 Elevated Median alternative would extend south from the future Angle Lake Station at S. 200 th Street along the west side of 28 th Avenue S. Where 28 th Avenue S. ends and the proposed SR 509 extension would cross under SR 99, the LRT guideway would be elevated west of SR 99 to cross SR 509, then transition to the SR 99 median. The guideway would be supported by columns located generally between the SR 99 northbound and southbound travel lanes in most locations. Where a planted (or otherwise un traversable) median 12 or more feet wide exists today, the support columns would be assumed to be located there. This column placement could make it possible to avoid re building the SR 99 travel lanes at such locations. At intersections or where the median space is occupied by a left turn or U turn lane, either SR 99 would be widened (in order to create space for columns) by relocating turn lanes, or an alternate method of supporting the elevated guideway (such as straddle bents or more sophisticated bridge structures) would be used. The alignment and a typical cross section for the SR 99 Elevated Median alternative are shown in Exhibits 3 2 and 3 3, respectively Stations Stations for the SR 99 Elevated Median alternative are anticipated to be located along the trackway and would feature center platforms (passengers waiting for northbound and southbound trains would wait on the same platform) with vertical circulation elements at or near each end. Parking, bus transfers, auto pick up/drop off, and most other station related facilities would be located at ground level. Federal Way Transit Extension 3-5 Level 2 Alternatives Screening Report
52 3.0 Definition of Alternatives The Kent/Des Moines station would be located at or near S. 240 th Street. The exact location and configuration would be worked out as the alignment design and station planning processes move forward. The S. 272 nd Street station would be located at or near the Redondo Heights Park and Ride. As with all other signalized intersections along SR 99 in the study corridor, crossing the Redondo Heights Park and Ride signal (S. 276 th Street) with a median elevated guideway would require widening SR 99 and/or longer spans for the elevated structure. The SR 99 Elevated Median alternative alignment would leave the SR 99 median between approximately S. 312 th Street and S. 316 th Street and turn east to connect with a proposed endof line station near the FWTC. The specific guideway alignment in the FWTC station area, the station location, and the station platform orientation would depend on several factors and their relationships, including ST s operating speed goals, existing and planned development, access features in the immediate area, utility conflicts, the LRT station platform s proximity to the existing bus transfer facility, and the preferred alignment for a potential future extension south toward Tacoma. Federal Way Transit Extension 3-6 Level 2 Alternatives Screening Report
53 3.0 Definition of Alternatives EXHIBIT 3-2 SR 99 Elevated Median Alternative Alignment Federal Way Transit Extension 3-7 Level 2 Alternatives Screening Report
54 3.0 Definition of Alternatives EXHIBIT 3-3 SR 99 Elevated Median Alternative Typical Cross Section Construction Construction in the SR 99 median would likely require the closure of the two center lanes of the roadway to provide adequate separation between the construction activities and adjacent vehicle travel. It could also require utility relocations associated with widening SR 99 in some locations th Avenue S. Elevated West Side Alternative For the purposes of the Level 2 evaluation, the 30 th Avenue S. Elevated West Side alternative would be combined with the SR 99 Median Elevated alternative. At the north end the alignment would transition from the SR 99 median at around S. 220 th Street and head east to 30 th Avenue S. The elevated guideway would then continue south along the west side of 30 th Avenue S. between the roadway and existing buildings, which are primarily multi family residential buildings, to the north of Kent Des Moines Road and industrial buildings to the south. The elevated guideway would cross Kent Des Moines Road with a single span (approximately 150 to 250 feet long) to avoid the potential negative effects that could be associated with placing a column in the center of the roadway. South of the Kent/Des Moines station, the 30 th Avenue S. alignment would transition on an elevated guideway west to an elevated SR 99 median alignment. From there south to the end of the project corridor, it would be identical to the SR 99 Median Elevated alternative described previously. The alignment and a typical cross section for the 30 th Avenue S. alternative are shown in Exhibits 3 4 and 3 5, respectively. Federal Way Transit Extension 3-8 Level 2 Alternatives Screening Report
55 3.0 Definition of Alternatives EXHIBIT th Avenue S. West Side Alternative Alignment Federal Way Transit Extension 3-9 Level 2 Alternatives Screening Report

56 3.0 Definition of Alternatives EXHIBIT th Avenue S. West Side Alternative Typical Cross Section Stations Because the 30 th Avenue S. Elevated West Side alternative is identical to the SR 99 Elevated Median alternative at the S. 272 nd Street and FWTC station areas, only the Kent/Des Moines station would differ in its potential location. As such, it is the only station with a location that is unique to the 30 th Avenue S. Elevated West Side Alternative. With the 30 th Avenue S. Elevated West Side alternative, the Kent/Des Moines station would be located along 30 th Avenue S. The exact location and configuration would be worked out as the alignment development and station planning processes move forward Construction Construction along 30 th Avenue S. would likely require closure of one lane of the roadway to provide adequate separation between the construction activities and adjacent vehicle travel. Because 30 th Avenue S. is a two lane street, only one lane would remain open during construction. Some driveways might need to be consolidated during construction but signage regarding business or residential access would be provided. Where this alternative would be on SR 99, construction in the SR 99 median would likely require the closure of two lanes of the roadway (one lane in each direction) to provide adequate separation between the construction activities and adjacent vehicle travel SR 99 Hybrid Alternative During the Level 1 evaluation, it was concluded that the SR 99 Elevated East Side and SR 99 Elevated West Side alternatives would each have too many substantial flaws to be considered Federal Way Transit Extension 3-10 Level 2 Alternatives Screening Report
57 3.0 Definition of Alternatives further on their own. Each of these alternatives was defined for the Level 1 analysis as having the guideway only on one side of SR 99, however it was determined that a viable alternative could be designed using a combination of elements from each, with the elevated guideway on one side of SR 99 in certain locations and on the other side (or in the median) in other areas. In addition, there were areas where it appeared that the guideway could be at grade for certain side running segments. Because of the recognition that different SR 99 Level 1 alignments could work better in different segments of the corridor (and would not work well in others) a hybrid alignment was suggested for development and evaluation in Level 2. The hybrid alternative has been designed to optimize the SR 99 alignment opportunities based on knowledge gained in the Level 1 analysis. The hybrid alignment was designed to include the least disruptive parts of each previous alignment and avoid the more difficult alignment segments. The approximate locations where the SR 99 Hybrid alternative s alignment would shift relative to SR 99 are shown in Table 3 1. The alignment for the Hybrid alternative is shown in Exhibit 3 6. The typical sections for the various segments of the alignment oriented to the west, in the median, and to the east of SR 99 are shown in Exhibits 3 7, 3 8, and 3 9, respectively. Table 3-1 SR 99 Hybrid Alternative Alignment: Segments and Descriptions Relative to SR 99 From To Orientation Relative to SR 99 Angle Lake Station S. 208 th Street Along 28 th Avenue S. and West of SR 99 S. 208 th Street North of Kent-Des Moines Road Median of SR 99 North of Kent-Des Moines Road S. 260 th Street West of SR 99 S. 260 th Street 16 th Avenue S. East of SR th Avenue S. S. 304 th Street West of SR 99 S. 304 th Street S. 312 th Street East of SR 99 In addition to alignment variations there are some segments along the SR 99 Hybrid alternative where at grade trackway could be considered. These are all located west of SR 99 and are based on the surrounding land profile. There could be both potential impacts and cost savings resulting from at grade segments. These segments are identified for general interest, but are not reflected in cost estimates. Federal Way Transit Extension 3-11 Level 2 Alternatives Screening Report

58 3.0 Definition of Alternatives EXHIBIT 3-6 Alignment of SR 99 Hybrid Alternative Federal Way Transit Extension 3-12 Level 2 Alternatives Screening Report
 EXHIBIT 3-8 SR 99")

59 3.0 Definition of Alternatives EXHIBIT 3-7 SR 99 Hybrid Alternative Typical Cross Section (West) EXHIBIT 3-8 SR 99 Hybrid Alternative Typical Cross Section (Median) Federal Way Transit Extension 3-13 Level 2 Alternatives Screening Report

60 3.0 Definition of Alternatives SR 99 Hybrid Alignment Description, by Segment EXHIBIT 3-9 SR 99 Hybrid Alternative Typical Cross Section (East) Below is a brief description, by segment, of the reasons for locating the SR 99 Hybrid alternative as proposed in Table 3 1 above. Angle Lake Station to S. 208 th Street In this segment the guideway would be located along 28 th Avenue S. because this location is consistent with the planned alignment of the tail tracks south of Angle Lake Station. The alignment was located to minimize conflict with the proposed SR 509 extension. S. 208 th Street to North of Kent Des Moines Road The guideway would be located in the median in this segment to avoid disruption to commercial properties on both sides of SR 99 and to avoid high voltage power lines on the east side. North of Kent Des Moines Road to S. 260 th Street The alignment would be located west of SR 99 to optimize commercial redevelopment opportunities and because crossing the Kent Des Moines Road intersection in the median would require substantial widening and reconstruction of SR 99. The alignment would remain on the west side of SR 99 to provide a station location close to Highline Community College and to avoid high voltage power lines on the east side. A west side alignment would also have fewer direct property impacts than an east side alignment in this segment. Federal Way Transit Extension 3-14 Level 2 Alternatives Screening Report
61 3.0 Definition of Alternatives S. 260 th Street to 16 th Avenue S. In this segment, the guideway would transition to east of SR 99 at S. 260 th to avoid impacts to a health clinic and to minimize the traffic impacts of a median alignment. The east side alignment would avoid impacts to the SR 99/S. 272 nd Street intersection and would allow the S. 272 nd Street station to be located at the Redondo Heights Park and Ride. 16 th Avenue S. to S. 304 th Street The SR 99 Hybrid alignment would transition to the west side of SR 99 near 16 th Avenue S. to take advantage of natural terrain variation (lower terrain on the west side helps to avoid visual impacts) and to avoid impacts to the S. 288 th Street and S. Dash Point Road intersections. South of S. Dash Point road, the west side alignment would meet a hillside and provide an opportunity for the guideway to be located at grade, which could reduce project cost. S. 304 th Street to S. 312 th Street The guideway would return to the east side of SR 99 at S. 304 th to avoid impacts to Federal Way High School and to position the guideway for connecting to the FWTC Stations Stations associated with the SR 99 Hybrid alignment would be located in the same basic areas as for the SR 99 Elevated Median alternative (Kent/Des Moines, S. 272 nd Street, and FWTC). The Kent Des Moines station would likely be located between Kent Des Moines Road and the vicinity of S. 240 th Street. The alignment would be just east of SR 99 at S. 272 nd Street, and the S. 272 nd Street station would be located east of SR 99 between SR 99 and the bus turnaround area at the Redondo Heights Park and Ride. The exact location and configuration of each station would be worked out as the alignment design and station planning processes move forward Construction Where the SR 99 Hybrid would be aligned to the east or west of SR 99, up to one lane of traffic would be likely to close during construction, which could affect the business access and transit (BAT) lane. Driveways might need to be consolidated during construction but signage regarding business access would be provided. Portions of the SR 99 Hybrid alternative that would be in the median would have construction effects to traffic that would be similar to the SR 99 Elevated Median alternative. Federal Way Transit Extension 3-15 Level 2 Alternatives Screening Report
62 3.0 Definition of Alternatives 3.3 Detailed Descriptions of I-5 Alternatives The I 5 corridor studied is generally along west side of the I 5 right of way, which is adjacent to primarily single family land uses, except at the interchanges at Kent Des Moines Road and S. 317 th /320 th streets. The two alternatives within this corridor are designed to connect access points at freeway interchanges to optimize ridership by balancing the need for LRT system access with the need to serve regional destinations. The I 5 alternatives are subject to ongoing review and coordination with WSDOT. The SR 167, SR 509, and I 5 Puget Sound Gateway Project ( the Gateway Project ) is a long term effort to improve roadway access to the ports of Seattle and Tacoma, in the interest of maintaining and enhancing Washington s global economic competitiveness. The Gateway Project features three projects that, when combined, could add substantial width to I 5 in the FWTE project study area. In some parts of the study area, this additional roadway width would occupy all or most of the available WSDOT right of way. The two I 5 alternatives being considered in this Level 2 screening process are subject to substantial change as new information becomes available about the spatial needs of the Gateway Project. Although these widening projects are not currently funded, discussions continue regarding the appropriate placement of the proposed LRT guideway along I 5. The assumptions contained in this report about LRT guideway placement represent the best information available at the time regarding ROW availability and WSDOT design coordination I-5 Mixed West Side Alternative At the north end of the corridor (just south of the future Angle Lake Station), the I 5 Mixed West Side alternative would be identical to the other alternatives, extending the elevated guideway from the Angle Lake Station to the south along 28 th Avenue S. After crossing over SR 99 and the proposed SR 509, the guideway would turn southeast to run along the south side of the proposed SR 509 to I 5, then it would turn south along the west side of the I 5 right of way. Near S. 316 th Street the alignment would turn west toward the FWTC. The specific alignment of the guideway and FWTC station in this area has not been determined. The alignment and typical cross section for the I 5 Mixed West Side alternative are shown in Exhibits 3 10 and 3 11, respectively. Mixed refers to the profile, and it would include a combination of elevated and at grade segments. This alternative would be elevated for the most part, and would be grade separated from all east west cross streets south of the SR 509/I 5 interchange (S. 216 th Street, Kent Des Moines Road [SR 516], S. 259 th Place, S. 272 nd Street, Military Road S. [twice], and S. 288 th Street) as well as other potential obstacles. The I 5 Mixed West Side alternative s proposed Federal Way Transit Extension 3-16 Level 2 Alternatives Screening Report
63 3.0 Definition of Alternatives location places it close to several facilities that could affect both the alignment and profile, including Highline Water District storage tanks, Puget Sound Energy s Midway Switch Station/Freeway Substation, Midway Landfill, Mark Twain Elementary School, and the Truman High School complex. This alternative is subject to ongoing review and coordination with WSDOT. The Gateway Project is a long term effort to improve roadway access to the ports of Seattle and Tacoma, in the interest of maintaining and enhancing Washington s global economic competitiveness. The Gateway Project features projects that, when combined, could add substantial width to I 5 in the FWTE project study area. In some parts of the study area, this additional roadway width would occupy all or most of the available WSDOT right of way Stations The stations associated with the I 5 Mixed West Side Alternative would serve the same general transit markets as the three SR 99 based alternatives: Kent/Des Moines, S. 272 nd Street, and FWTC. At S. 272 nd Street the station platform would be located at the Star Lake Park and Ride. The Kent/Des Moines and FWTC station locations would be driven more by local factors and by the alignment of a potential future extension further south to Tacoma than by the choice of FWTE alignment alternatives. The exact station locations and configurations would be worked out as the alignment development and station planning processes move forward Construction The I 5 Mixed West Side alternative would be along the west side of I 5 and would likely have some effects at or near the I 5 southbound on and off ramps but would not likely affect any I 5 mainline operations or require lane closures on I 5 in the study area. Federal Way Transit Extension 3-17 Level 2 Alternatives Screening Report
64 3.0 Definition of Alternatives EXHIBIT 3-10 Alignment of I-5 Mixed West Side Alternative Federal Way Transit Extension 3-18 Level 2 Alternatives Screening Report

65 3.0 Definition of Alternatives I-5 Mixed West Side/Median Alternative EXHIBIT 3-11 I-5 Mixed West Side Alternative Typical Cross Section The I 5 Mixed West Side/Median alternative would be similar to the I 5 Mixed West Side alternative from the north end of the project area to the S. 240 th Street area. At that point, the guideway would transition from the west side of I 5 to the I 5 median via elevated structure. It would remain in the I 5 median to the Star Lake Park and Ride area, where it would transition back to the west side so that the S. 272 nd Street station could be located close to the Park and Ride and avoid issues involved with fitting the station footprint in the median. South of the station, the guideway would transition back to the freeway median via elevated structure. Near S. 316 th Street, the alignment would turn west toward the FWTC. The alignment for the guideway and station in this area has not been fully developed, but for the purposes of this study, it has been assumed to follow S. 317 th Street and terminate at 21 st Avenue S. The alignment and typical cross sections for the I 5 Mixed West Side/Median alternative are shown in Exhibits 3 12, 3 13, and 3 14, respectively Stations The stations for the I 5 Mixed West Side/Median alternative would be in similar locations as the stations for the I 5 Mixed West Side alternative. The two I 5 alternatives would serve a Kent/Des Moines station, and both would have a station located near the east edge of the Star Lake Park and Ride. The FWTC station would be configured the same whether the LRT guideway along I 5 is located in the median or along the west side of the right of way. Federal Way Transit Extension 3-19 Level 2 Alternatives Screening Report
66 3.0 Definition of Alternatives Construction Where the I 5 Mixed West/Median alternative would be in the median of I 5, it would likely require full lane closures of the northbound and southbound HOV lanes on I 5 due to the proximity of construction activities to the travel lanes and the high operating speed on I 5. Where this alternative would be along the west side, it would likely have some effects at or near the I 5 southbound on and off ramps at S. 272 nd Street but would not likely affect any I 5 mainline operations or require lane closures on I 5 in these sections. Federal Way Transit Extension 3-20 Level 2 Alternatives Screening Report

67 3.0 Definition of Alternatives EXHIBIT 3-12 I-5 Mixed West Side/Median Alternative Alignment Federal Way Transit Extension 3-21 Level 2 Alternatives Screening Report

68 3.0 Definition of Alternatives EXHIBIT 3-13 I-5 Mixed Median/West Side Alternative Typical Cross Section for West Side Segments EXHIBIT 3-14 I-5 Mixed Median/West Side Alternative Typical Cross Section for Median Segments Federal Way Transit Extension 3-22 Level 2 Alternatives Screening Report
69 4.0 Evaluation Criteria The criteria used to evaluate the Level 2 alternatives originated from objectives derived from the project s Purpose and Need, described in Chapter 2. These objectives are: Objective 1: Provide an effective transportation solution to meet mobility needs Objective 2: Support equitable mobility Objective 3: Serve supportive land use plans and economic development objectives Objective 4: Preserve a healthy environment Objective 5: Design an affordable and constructible project Table 4 1 presents the evaluation criteria established for the Level 2 evaluation. It shows how each relates to Level 1 measures and the objectives with which they correspond. Each criterion has one or more quantitative or qualitative measures that are listed below and further described later in this chapter. They are intended to differentiate between alternatives in terms of project performance and potential effects. Some measures from the Level 1 evaluation were found to not provide meaningful differentiation between alternatives, or they do not differentiate between the alternatives that are being evaluated in Level 2. These measures are identified in the table below, and when possible, new measures were identified to attempt to better differentiate between the Level 2 alternatives. Table 4-1 Level 2 Evaluation Criteria and Measures Purpose and Need Objective Evaluation Criterion Level 1 Measures Level 2 Measures Provide Effective Transportation Solution to Meet Mobility Need Support Equitable Mobility Ridership potential (2035) Connections to regional multimodal transportation systems Transit-dependent and Environmental Justice populations M1: 2035 daily project riders and 2035 annual project riders Daily and annual project ridership Station boardings M2: Travel time in study area Travel time M3: Transit integration with Link system Integration with Link system M4: Transit integration with facilities in the study area EM5: Low-income population within ½ mile of station EM6: Elderly population (age 65 or older) within ½ mile of station EM7: Youth population (age 16 or younger) within ½ mile of station EM8: 0-car households within ½ mile of stations Integration with bus facilities and services Does not differentiate between alternatives; not considered in Level 2 Does not differentiate between alternatives; not considered in Level 2 Does not differentiate between alternatives; not considered in Level 2 Does not differentiate between alternatives; not considered in Level 2 Student poverty Subsidized housing Cost of commuting Federal Way Transit Extension 4-1 Level 2 Alternatives Screening Report
70 4.0 Evaluation Criteria Purpose and Need Objective Evaluation Criterion Level 1 Measures Level 2 Measures Access to express transit Minority populations Existing land use Planned land use High Density/TOD zoning Support Land Use Plans and Economic Development Transit-supportive land use and economic development policies LU9: How well an alternative provides enhanced mobility to existing high density land use centers Underutilized parcels Population Employment Households Parking opportunities Non-motorized access Effect on natural environment EN10: Impacts on wetlands EN11: Potential to affect streams crossings Wetlands Streams EN12: Visual aesthetic impacts of alternative Visual effects EN13: Potential property acquisition Potential displacements EN14: Impacts to known parks Does not differentiate between alternatives; not considered in Level 2 Preserve a Healthy Environment Effect on built environment EN15: Number of community facilities affected EN16: Impacts on known or eligible historic or other sensitive properties access; number EN17: Number of potentially impacted noise receptors Community facilities Does not differentiate between alternatives; not considered in Level 2 Noise Vibration EN18: Level of Service (LOS) at intersections; evaluation of capacity/flow (existing conditions) EN19: Traffic circulation and access; number of mid-block opportunities Traffic Construction effects DC20: Potential utility effects Utilities Design an Affordable and Constructible Project Design considerations DC21: High-risk hazardous materials within ¼ mile of alternative DC22: Geologic hazards DC23: Park-and-Ride lot locations Hazardous materials Geologic issues Combined with parking measure under Transit-supportive land use and economic development policies System costs DC24: Estimated capital cost ($2013) DC25: Estimated annual operations and maintenance cost ($2013) Estimated capital cost Estimated operations and maintenance cost Federal Way Transit Extension 4-2 Level 2 Alternatives Screening Report
71 4.0 Evaluation Criteria Criteria used to evaluate stations are discussed in Section Level 1 Measures Not Evaluated in Level 2 The Level 1 evaluation showed that some measures that did not effectively differentiate between alternatives. The measures also would not differentiate between the alternatives in Level 2 because there are either no resources present for these categories in the corridor or the available data is collected at too large a study area. These measures included evaluation of effects to parks and historic resources. Although a park was adjacent to the 24 th Avenue S. alternatives in Level 1, the S. 24 th Avenue alternatives are not being evaluated further in Level 2, and none of the Level 2 alternatives is adjacent to an existing park. Only one property known to have buildings listed on, or known to be eligible for, the National Register of Historic Places (NRHP) is present within the vicinity of any of the alternatives evaluated in Level 1 or Level 2. This property is the Highline Community College (HCC) campus, where three buildings have been determined eligible and the campus may be considered eligible as a historic district. The buildings are over 500 feet from any of the alternatives, and therefore unlikely to be directly or indirectly affected by any of the other alternatives. A preliminary assessment of the project area did not identify any other structures potentially eligible for listing on the NHRP. These resources are therefore not being evaluated as part of Level 2, but are expected to be evaluated later in the Draft Environmental Impact Statement (EIS). 4.2 Objective 1: Provide Effective Transportation Solution to Meet Mobility Needs This objective has two criteria: the ridership potential of an alternative and how an alternative improves connections to regional multimodal transportation systems. Criterion: Ridership Potential (2035) This criterion is intended to illustrate the ridership potential based on three measures: forecasted daily and annual ridership in 2035, station boardings, and travel time within the corridor for each alternative. Federal Way Transit Extension 4-3 Level 2 Alternatives Screening Report
72 4.0 Evaluation Criteria TABLE 4-2 Ridership Potential Measures Evaluation Measure Daily and annual project ridership Station boardings Travel time Methodology Using Sound Transit forecasting model and general station area assumptions, produced 2035 estimated daily and annual ridership. This criterion also qualitatively addressed how well each alternative would serve forecasted ridership. Unit of measure: Average 2035 daily and annual riders. Using Sound Transit forecasting model and general station area assumptions, 2035 station boardings were estimated. Unit of measure: Average 2035 daily station boardings. Travel times were developed for alternatives using a simple distance/speed estimate with time added for each station, and all Level 1 travel times were affirmed by Sound Transit operations staff. Unit of measure: One way travel time between S. 200 th Street and S. 320 th Street. Criterion: Connections to Regional Multimodal Transportation Systems This criterion addresses the connectivity of each alternative to the rest of the regional transit system and to existing transit routes and facilities within the study area. TABLE 4-3 Connections to Regional Multimodal Transportation Systems Measures Evaluation Measure Integration with Link system Integration with bus facilities and services Methodology Qualitative assessment of project effect on current and planned Link light rail system. Key considerations were schedule adherence, fleet management and potential extensions beyond the FWTE project. Unit of measure: Number of traffic signals traversed at-grade by alternative. Using existing transit service data, assessed the number of transit vehicle trips by time of day at stops within ½ mile of stations, the geographic coverage of these routes, connections to employment centers around the region, and the ability to reassign or reroute routes to stations (both local and regional bus routes). Unit of measure: Transit vehicle trips by alignment, trips to regional centers, and a qualitative assessment of the integration with the transit system. 4.3 Objective 2: Support Equitable Mobility This objective has one criterion, which is how well an alternative improves transit access to transit dependent and environmental justice populations. Criterion: Transit Dependent and Environmental Justice Populations In Level 1, this criterion evaluated transit dependent populations using available U.S. Census data for low income, elderly, youth, and zero car household populations, which did not show a substantial difference between alternatives due to the large size of census tracts and block groups that include much of the study area for both SR 99 and I 5 corridors. In lieu of more specific census data, four new Federal Way Transit Extension 4-4 Level 2 Alternatives Screening Report
73 4.0 Evaluation Criteria measures were identified that provide additional information on low income populations in the study area that may be transit dependent and how difficult commuting to work may be in this area. These measures are based on the number of elementary school students in local public schools that qualify for free or reduced lunches due to income, the number of subsidized housing facilities, the average cost of a commute to work, and the area within ¼ mile of an express bus stop. In addition, the minority population within a ½ mile of each alternative was evaluated to consider the potential for improved transit service to benefit this population, as well as the potential for adverse effects on this population, which must be considered under Executive Order 12898, Federal Actions to Address Environmental Justice Impacts in Minority Population and Low Income Populations. TABLE 4-4 Transit Dependent and Environmental Justice Population Measures Evaluation Measure Student poverty Subsidized housing Cost of commuting Access to express transit Minority Populations Methodology Identified percentage of elementary school population that qualifies for free or reduced lunch within school service areas adjacent to or intersecting an alternative centerline using data from Washington Office of Superintendent of Public Instruction. Unit of measure: Qualitative discussion of percentage of children receiving free or reduced lunch. Using PSRC data, calculated the number of U.S. Department of Housing and Urban Development (HUD) subsidized housing complexes and units within ½ mile of the alternative centerline. Unit of measure: Number of subsidized housing complexes and units. Using PSRC data for average cost of commute of a one-way commute to work within each PSRC traffic analysis zone (TAZ), discussed the costs of the average commute along each alternative. Unit of measure: Qualitative discussion. Using PSRC data for areas within ¼ mile of an express bus stop, discussed the degree of access to express buses along each alternative. Unit of measure: Qualitative discussion. Using U.S. Census data for minority population, identified areas within the alternative study areas that include high minority population. Unit of measure: Qualitative discussion. 4.4 Objective 3: Serve Supportive Land Use Plans and Economic Development Objectives This objective has one criterion, which is the extent to which an alternative would be consistent with local transit supportive plans. Criterion: Transit Supportive Land Use and Economic Development Policies The intent of this measure is to evaluate the extent to which the alternatives are consistent with and support local plans to create more compact, livable, and sustainable communities with transit in mind, and the degree to which an alternative could help facilitate implementation of Federal Way Transit Extension 4-5 Level 2 Alternatives Screening Report
74 4.0 Evaluation Criteria these plans. In Level 1, the measure for this criterion was the acreage and percentage of highdensity zoning within each station access area. For Level 2, additional measures were identified to try to get better differentiation between alternatives and to allow for a clearer understanding of what the long term plans for each corridor are and the potential for transit supportive land use to develop adjacent to each alternative. Existing land use, planned land use (based on comprehensive plans), high density zoning, and an assessment of parcels that could be developed or redeveloped were measured, along with existing population, employment, households, parking opportunities, and existing and planned non motorized infrastructure. Federal Way Transit Extension 4-6 Level 2 Alternatives Screening Report
75 4.0 Evaluation Criteria TABLE 4-5 Transit Supportive Land Use and Economic Development Measures Evaluation Measure Existing land use Planned land use High Density/TOD Zoning Underutilized parcels Population Employment Households Parking opportunities Non-motorized access Methodology Determined acres and percentage of single family residential, multi-family residential, commercial, industrial, public and vacant land uses within ½ mile of each alternative s centerline, using King County Assessor data. Land uses were generalized between jurisdictions as necessary. Unit of measure: Acres (and percent) of each existing land use. Determined acres and percentage of planned land uses based on local comprehensive plans within ½ mile of each alternative s centerline. Land uses were generalized between jurisdictions as necessary. Unit of measure: Acres (and percent) of each planned land use. Determined acres and percentage of existing zoning that is either high-density residential, transit oriented development, or allows mixed use within a ¼ mile of the alternative centerline. Zoning data was obtained from the cities of SeaTac, Des Moines, Kent and Federal Way. Unit of measure: Acres (and percent) of high density/tod zoning. Determined number of acres considered underutilized based on ratio of building to land value within ½ mile of the alternative centerline. Underutilized parcels are those with a ratio of improvement value to land value of 1:1 or less. Unit of measure: Acres (and percent) of underutilized land. Determined total population within ½ mile of the alternative centerline based on U.S. Census data. Population was estimated based on percentage of each census block within study area. Unit of measure: Total population (rounded to nearest 1,000). Determined total employment within ½ mile of the alternative centerline based on data supplied by the Employment Securities Department (ESD) through PSRC. Employment data exists as points that were be aggregated for a ½ mile buffer around the centerline of the alternative. Unit of measure: Total employment (rounded to the nearest 1,000). Determined total number of households within ½ mile of the alternative centerline based on U.S. Census data. Households were estimated based on percentage of each census blocks within study area. Unit of measure: Total households (rounded to the nearest 1,000). This measure included the current number of park & ride parking spaces (publicly owned or leased facilities) and the number of potential park & ride facilities (such as church parking lots) within ½ mile of each alternative. Utilization of existing park and ride lots was reported. The measure also qualitatively discussed areas where overflow parking from park & rides could be a problem. Unit of measure: Number and utilization of existing park-and-ride spaces, number of potential park and ride locations, and qualitative discussion. This measure qualitatively discussed existing and planned bike and pedestrian facilities and options within each alternative corridor. Density of roadways that are arterials or smaller were calculated within ½ mile of the alternative centerline. Unit of measure: Linear feet of roadway within ½ mile of each alternative. 4.5 Objective 4: Preserve a Healthy Environment This objective has two criteria, which are to assess the degree to which each alternative would have effects on the natural environment and the built environment. Federal Way Transit Extension 4-7 Level 2 Alternatives Screening Report
76 4.0 Evaluation Criteria Criterion: Effect on Natural Environment This criterion addresses the potential to minimize and mitigate adverse effects to the natural environment. The FWTE corridor is highly developed, so natural resources are generally limited to stream crossings and wetlands. Due to the regulatory permitting requirements associated with adverse effects to these resources, any adverse effects to these resources would need to be minimized or avoided to the extent possible. Level 1 used measures to assess the presence of wetlands and streams within 100 feet of each alternative. For Level 2, direct effects to wetland and streams were more clearly defined by identifying the potential effects to these resources within the project construction footprint, based on a conceptual design. TABLE 4-6 Effect on Natural Environment Measures Evaluation Measure Wetlands Streams Methodology Wetlands or waters of the U.S. within the alternative construction footprint were identified; because there is potential these could be permanently or temporarily affected. Wetland data was obtained from King County and the U.S. Fish and Wildlife Service National Wetlands Inventory (NWI). Unit of measure: Acreage of wetlands within the alternative construction footprint. The length of streams within the alternative construction footprint was identified using available mapping of streams. It is likely any alternative that reconstructs a roadway would affect these crossings. Data on streams were obtained from King County. Unit of measure: Length of stream crossings within alternative construction footprint. Criterion: Effect on Built Environment The Level 1 screening evaluated the effects on the built environment based on the alternatives potential to affect the cohesion of the neighborhood and/or community resources as well as potential effects to residential and commercial property, parks, visual aesthetics, community facilities, eligible historic properties, noise receptors, traffic flow, and intersection capacity and level of service. Many of these measures were evaluated in Level 2 as well, with some refinement. As discussed earlier, parks and historic resources were not used as evaluation measures in Level 2 because of the lack of potential effects to these resources within the study area for the alternatives that are evaluated in Level 2. New measures were also added to evaluate potential effects to properties considered highly sensitive to vibration and to evaluate potential construction effects on traffic, businesses and residents. Federal Way Transit Extension 4-8 Level 2 Alternatives Screening Report
77 4.0 Evaluation Criteria TABLE 4-7 Effect on Built Environment Measures Evaluation Measure Visual effects Potential displacements Community facilities Noise Vibration Traffic Construction effects Methodology The rating considered whether important views would be blocked or if the bulk and mass of the light rail are not congruent with the surrounding landscape (built or natural). Unit of measure: Qualitative discussion. Residential and business displacements were determined based on buildings assumed to be removed for capital cost estimate. Number of residences or businesses within each building was verified using King County Assessor data and field visits. Unit of measure: Number of potential residential and business displacements. Direct effects to community facilities were assessed by determining the number of facilities that would be displaced. Indirect effects were assessed by determining the number of community facilities within 200 feet of the alternative right-of-way. Level 1 community facility information was used and was supplemented with field data collected to identify facilities not listed in King County Assessor data. Unit of measure: Direct: Number of displaced community facilities; Indirect: Number of community facilities within 200 feet Using Federal Transit Administration screening guidance, Category II (residential properties and hotels) and Category III (schools and churches) noise receivers within 350 feet of each alternative were identified. The number of receivers within 350 feet of the alternative centerline was determined for buildings with an unobstructed view of the alternative and up to 175 feet for buildings with shielding from the study area. Potential noise sensitive receivers were identified using aerial base maps, with information verified using King County Assessor data and Google Earth. Updated information on Category III receivers collected during field visits was used. Unit of measure: Category II and III noise sensitive receivers potentially affected by the project. Identified number of highly sensitive locations within 100 feet of the alternative right-of-way based on site visit. Unit of measure: Number of highly sensitive locations. Using Level 1 results that documented where congested intersections are, evaluated the station and alignment characteristics by identifying level of traffic that would travel through those congested intersections. This included either through traffic re-circulation caused by turn restrictions, mid-block u-turns or midblock access control as well as additional vehicles forecasted at the stations based on changes to parking supply. The parking allocation by station was based on the best available information to date and would be an assumption. Unit of measure: Qualitative assessment of traffic effects at each station. A qualitative assessment of construction effects to the existing transportation system and businesses and residences along each alternative was developed (based on the construction description provided in Chapter 3, Definition of Alternatives). 4.6 Objective 5: Design an Affordable and Constructible Project This objective has two criteria: the degree to which physical and engineering constraints and system costs would affect the ability to design an affordable and constructible project. Design Considerations Similar to the consideration of wetlands and water bodies, there are a number of important engineering considerations during Level 1 that help to inform the alternative s future design to be carried into Level 2, including potential for utility relocations, encountering hazardous Federal Way Transit Extension 4-9 Level 2 Alternatives Screening Report
78 4.0 Evaluation Criteria materials and geologic hazards, and park and ride lot locations that would provide access to station areas. The measures used in Level 2 generally remain the same as in Level 1, although alternatives were looked at in greater detail relative to these measures. The Level 1 parking measure was consolidated with the parking evaluation for station locations in Chapter 7. TABLE 4-8 Design Consideration Measures Evaluation Measures Utilities Hazardous materials Geologic issues Methodology Easily available major utility lines were reviewed (water, sanitary sewer, and gas and oil main lines) to determine the potential risk and level of effect within the vicinity of the alignments. Data were obtained from local jurisdictions and utility companies. Unit of measure: Qualitative assessment of potential for utility relocations and conflicts. Data from Environmental Data Resource (EDR), a database research company, was reviewed for potential high-risk hazardous materials sites that could affect construction. High risk sites within 1/8 mile were identified. Unit of measure: Location and number of high-risk hazardous materials site within project footprint and 1/8 mile of alternative right-of-way. A qualitative geologic risks assessment was completed, including review of steep slopes, seismic ground shaking, liquefiable soils, fault crossings, and erosion potential from King County Geologic Hazards maps, U.S. Department of Agriculture soils maps, and surface geology. Unit of measure: Qualitative assessment. System Costs These screening measures capture the estimated capital costs to build, operate, and maintain the project alternatives. TABLE 4-9 System Cost Measures Evaluation Measure Estimated capital cost Estimated operations and maintenance cost Methodology Using Sound Transit's database of recent capital costs, a range of capital cost estimates was determined for alternatives in current year dollars. Unit of measure: Range of capital costs for alternatives ($2013). Sound Transit modeled annual operations and maintenance (O&M) costs. Unit of measure: Annual O&M cost ($2013). Federal Way Transit Extension 4-10 Level 2 Alternatives Screening Report
79 5.0 Level 2 Data Results - Alignment Alternatives The Level 2 light rail transit (LRT) alignment alternatives defined in Chapter 3 were evaluated using the criteria presented in Chapter 4. These criteria and the associated measures were driven by the project s objectives, which in turn were based on the project s purpose and need statements. Data collected for each Level 2 evaluation measure help to improve understanding of each alternative, which in turn facilitates the comparisons that will determine which alternative (or alternatives) move(s) forward for full consideration in the Environmental Impact Statement (EIS) process. The data collected are presented in this chapter by criterion and measure, ordered the way the evaluation measures were presented in Chapter Ridership Potential (2035) The ridership potential of the alternatives is a reflection of surrounding land uses and population, access to the station, and the travel time of the alternative. This ridership criterion provides a comparison of how attractive each alternative would be to potential riders in the greater project area Daily and Annual Project Ridership The daily project ridership indicates the estimated number of riders each day within the project area. The annual project ridership indicates the estimated number of riders within the project area on an annual basis. Methodology Year 2035 daily project wide ridership was forecasted for the five project alternatives using Sound Transit s Ridership Model. Ridership estimates were prepared for the full length alternatives to understand the potential project wide benefits. All of the full length alternatives included three LRT stations Kent/Des Moines (KDM) (near S. 240 th Street), S. 272 nd Street, and Federal Way Transit Center (FWTC). Key considerations for the ridership forecasts are station and profile assumptions and travel time estimates. All I 5 and SR 99 alternatives in the Level 2 screening are either elevated or otherwise grade separated from vehicle travel and therefore have similar travel time characteristics. The Level 2 ridership forecasts are based on year 2035 land use forecast and a Federal Way Transit Extension 5-1 Level 2 Alternatives Screening Report
80 5.0 Data Results conceptual bus network that would support LRT to FWTC. A summary of the daily and annual ridership forecasts for the Level 2 alternatives is provided in Table 5 1. Discussion of Results The year 2035 project wide ridership for all five project alternatives is forecasted to be approximately 23,500 riders per day. The similarity in the ridership forecasts between alternatives is due to the fact that two of the three station areas (Kent/Des Moines and FWTC) have a similar geographic location to one another and therefore serve similar markets and the travel times for the alternatives vary by less than one minute. TABLE 5-1 Year 2035 Daily and Annual Ridership Forecasts by Alternative Alternative 2035 Daily Riders 2035 Annual Riders SR 99 Alternatives SR 99 Elevated Median 23, million 30 th Avenue. S. Elevated West Side (w/sr 99 Elevated Median) 23, million SR 99 Hybrid 23, million I-5 Alternatives I-5 Mixed West Side 23, million I-5 Mixed West Side/Median 23, million Estimates of 2035 daily riders are rounded to the nearest 500. Estimates of 2035 annual riders are rounded to the nearest 0.1 million. Due to the I 5 and SR 99 project alternatives having similar travel times and, for the most part, station areas, the alternatives show similar ridership potential. Key Result System wide ridership projections are the same for all five Level 2 alternatives Station Boardings Station boardings are a criterion that shows the differences in potential ridership between specific station locations, and indicate potential differences in attractiveness of station locations to riders. Methodology Year 2035 daily station boardings for the five project alternatives were calculated using Sound Transit s Ridership Model. Station boarding forecasts were prepared for three project station areas Kent/Des Moines, S. 272 nd Street corridor, and FWTC. Key considerations for the Level 2 Federal Way Transit Extension 5-2 Level 2 Alternatives Screening Report
81 5.0 Data Results station boarding forecasts are station access and transit integration assumptions. A summary of the estimated daily boardings for the alternatives is provided in Table 5 2. TABLE 5-2 Year 2035 Station Boardings by Alternative Station Area Boardings Alternative SR 99 Alternatives KDM S. 272 nd St. FWTC SR 99 Elevated Median 3,000 2,000 8, th Avenue. S. Elevated West Side (w/sr 99 Elevated Median) 3,000 2,000 8,000 SR 99 Hybrid 3,000 2,000 8,000 I-5 Alternatives I-5 Mixed West Side 2,500 2,000 8,500 I-5 Mixed West Side/Median 2,500 2,000 8,500 Daily boardings are rounded to the nearest 500. Discussion of Results The year 2035 daily station boardings show similarities between the I 5 and SR 99 alternatives. The station with the highest daily boardings (8,000 or more) is the FWTC. The results at the station areas vary by approximately 500 boardings per day at the north and south ends of the corridor with similar boardings at the S. 272 nd Street station locations for either corridor (SR 99 versus I 5). With boardings estimates rounded to the nearest 500, these variations are the smallest possible. Such variations could result from small differences in travel times and/or transit access to the proposed station. Due to the similarity in travel times and station areas between the alternatives, the station boardings estimates are similar at all of the three station areas within the Federal Way Transit Extension (FWTE) study area. Key Results Station boardings would be the same for a S. 272 nd Street station in either corridor. The SR 99 alternatives would have approximately 500 more boardings at Kent/Des Moines, but 500 fewer boardings at the FWTC than the I 5 alternatives Travel Time Travel time is generally a reflection of the alignment length, profile, and design speed, and is a factor in determining the ridership potential of an alignment alternative. Federal Way Transit Extension 5-3 Level 2 Alternatives Screening Report
82 5.0 Data Results Methodology Estimated travel times represent the time for light rail to travel the full length of the FWTE study area between the Angle Lake Station (near S. 200 th Street) and the FWTC (near S. 317 th Street). Travel times for any given segment can be affected by multiple variables including the alignment curvature and profile, station locations, and the effects of traffic signals, if applicable, in the case of at grade operation. A summary of the project alternative travel time is provided in Table 5 3. TABLE 5-3 Alternative Travel Times and Ridership Projections Light Rail Alternative SR 99 Alternatives Travel Time (minutes) SR 99 Elevated Median th Avenue. S. Elevated West Side (w/sr 99 Elevated Median) 15.0 SR 99 Hybrid 14.5 I-5 Alternatives I-5 Mixed West Side 14.0 I-5 Mixed West Side/Median 14.0 Note: Travel Times are rounded to the nearest half minute. Discussion of Results Because all Level 2 alternatives are similar in length and the alignment profile is either elevated or grade separated from the roadway right of way, the travel times for each of the project alternatives are similar, ranging between 14 and 15 minutes. As noted in the discussion of the ridership measures, this results in similar ridership potential for all the Level 2 alternatives. Because all of the Level 2 project alternatives are either elevated or grade separated from the roadway right of way, all alignments have similar travel times. Minor differences in alignment length and curvature result in slight travel time differences of one minute or less. In particular, the 30 th Avenue alignment is longer than the other SR 99 alternatives, and the I 5 alignments are slightly shorter and have fewer curves. Key Results The I 5 alternatives would have a slightly faster travel time than the SR 99 alternatives. The 30 th Avenue S. Elevated West Side alternative would have the longest travel time, one minute longer than the I 5 alternatives. Federal Way Transit Extension 5-4 Level 2 Alternatives Screening Report
83 5.0 Data Results 5.2 Connections to Regional Multimodal Transportation Systems The potential connections with the larger Link system and other transit systems in the area are important to understanding how the project would integrate with the regional and local transit systems and the quality of connections that would be provided to potential riders Integration with Link System The ability of the project to integrate with the existing Link system is important because system wide integration can affect travel times and on time performance for the entire system. Methodology Transit integration with the Link Light Rail system was evaluated based on the potential for delays that the Level 2 alternatives could experience due to the alignment interfacing with roadway traffic, especially at traffic signals. Because all Level 2 alternatives are either fully elevated or grade separated from the roadway right of way, there are minimal opportunities for the light rail operations to be affected by roadway operations. The only alternative that could have segments with at grade profile is the SR 99 Hybrid alternative. Even so, the at grade sections of this alternative would occur between intersection signals and operate with full priority for the train and include crossing gates and other rail protection at driveways. Table 5 4 summarizes the number of traffic signals that each alternative would traverse at grade. TABLE 5-4 Existing Traffic Signals Traversed by Alternative Alternative Traffic Signals Traversed SR 99 Alternatives SR 99 Elevated Median 0 30 th Avenue. S. Elevated West Side (w/sr 99 Elevated Median) 0 SR 99 Hybrid 0 I-5 Alternatives I-5 Mixed West Side 0 I-5 Mixed West Side/Median 0 Discussion of Results By avoiding at grade operations, elevated alternatives are expected to be more effective at maintaining scheduled headways; therefore, they are not expected to affect system wide Link operations and reliability. Federal Way Transit Extension 5-5 Level 2 Alternatives Screening Report
84 5.0 Data Results Because all of the Level 2 alternatives would not interface with roadway operations and would avoid existing traffic signals, all alternatives are expected to have the ability to maintain scheduled service headways and would therefore have a low potential to affect system wide Link operations. Key Result Level 2 alternatives would not affect operations of the greater Link system Integration with Bus Facilities and Services Transit integration with facilities in the study area is a qualitative assessment of the interface between the FWTE Level 2 alternatives to existing transit services (such as King County s RapidRide A Line and Sound Transit Express bus routes) and transit facilities (such as Park and Ride lots). The way in which each alternative would integrate with existing bus facilities and services is reflective of the type and degree of transit access to potential FWTE stations. A halfmile radius was used because routes within that area could be re routed slightly, if necessary, to serve proposed LRT stations. Methodology To assess integration with existing bus service and facilities, the number of peak and off peak transit vehicle trips that would provide access to stations on an alignment was identified. The regional activity centers that could be accessed with these existing routes were also considered. A qualitative discussion of the potential effects to existing transit services and opportunities to connect to existing transit facilities by station area are documented in this section. Table 5 5 illustrates the total transit vehicle trips that serve each alternative and Exhibit 5 1 shows how those transit routes/vehicle trips serve the greater Puget Sound regional centers (designated by the Puget Sound Regional Council). TABLE 5-5 Total Daily Transit Vehicle Trips within ½ Mile of the Proposed Alternative Alternative Peak Period Off-Peak Total SR 99 Alternatives SR 99 Elevated Median th Avenue. S. Elevated West Side (w/sr 99 Elevated Median) SR 99 Hybrid I-5 Alternatives I-5 Mixed West Side I-5 Mixed West Side/Median Federal Way Transit Extension 5-6 Level 2 Alternatives Screening Report
85 5.0 Data Results South Kitsap Industrial Area Port of Tacoma Paine Field / Boeing Everett North Tukwila Kent Industrial Center Frederickson Duwamish Ballard-Interbay Uptown Queen Anne University Community Tukwila Totem Lake Tacoma Mall Tacoma Downtown South Lake Union South Hill Silverdale Seattle CBD SeaTac Renton Redmond-Overlake Redmond Puyallup Downtown Northgate Lynnwood Lakewood Kent Downtown First Hill/Capitol Hill Everett Canyon Park Burien Bremerton Bellevue Auburn Off Peak Transit Vehicle Trips Peak Transit Vehicle Trips Notes: Based on Spring 2012 service from King County Metro, Pierce Transit and Sound Transit. Information on Regional Growth and Manufacturing and Industrial Centers can be found at Exhibit 5-1 Total Daily Transit Vehicle Trips from the FWTE Study Area to Regional Growth and Manufacturing and Industrial Centers Discussion of Results All alternatives along SR 99 and I 5 would connect with existing transit service that provides access to about a quarter of all the jobs in the region. This service includes access to cities north, south and east of the FWTE study area. Results are discussed by station below. Federal Way Transit Extension 5-7 Level 2 Alternatives Screening Report
86 5.0 Data Results Transit Routes near the Kent/Des Moines Station Area There are currently five King County Metro routes that serve this station area: 121, 122, 156, 166 and RapidRide A Line. These routes connect the station area with Seattle, Burien, Tukwila, and Kent, as well as Sea Tac Airport. Of the five routes, only Route 166 serves the Kent Des Moines Park and Ride on the way to Kent. The other routes travel north on either SR 99 or roadways west of it through Des Moines. RapidRide A Line is the only route that serves the HCC area that also travels south on SR 99. In general, transit routes that serve HCC are easier to integrate with a station located closer to SR 99; however, the I 5 alternatives could also be integrated to existing transit service along SR 99 as the SR 99 and I 5 alignments are within close proximity of each other. Near the Kent/Des Moines station area is the Kent Des Moines Park and Ride. The Kent Des Moines Park and Ride is located on the east side of I 5, north of Kent Des Moines Road. Seven King County Metro (KCM) routes and one Sound Transit Express route serve the Kent Des Moines Park and Ride lot: 158, 159, 166, 173, 192, 193, 197 and 574. These routes serve Lakewood, Tacoma, Federal Way, Kent, Seattle and the University District. A majority of the routes that serve the Kent Des Moines Park and Ride also serve the Federal Way Transit Center and Star Lake Park and Ride in the FWTE study area but do not serve areas west of I 5 near HCC. Due to substantial congestion at the I 5/Kent Des Moines Road interchange and a challenging pedestrian environment, the I 5/Kent Des Moines Road interchange could be a substantial barrier for accessing any station area west of I 5 from the Kent Des Moines Park and Ride and therefore re routing any of the transit routes that currently serve this park and ride to the Kent/Des Moines station area would likely affect that route s operating performance. Transit Routes serving the Redondo Heights Park and Ride Three KCM routes serve Redondo Heights Park and Ride lot: 173, 190 and RapidRide A Line. These routes serve Federal Way and Downtown Seattle as well as Sea Tac Airport. Routes 173 and 190 proceed to I 5 along S. 272 nd Street and heads north to Downtown Seattle. The lack of transit service at the Redondo Heights Park and Ride and more convenient bus service at other park and rides in the FWTE is one reason that its occupancy rate is less than ten percent. Two (173 and 190) of the three existing transit routes at the Redondo Heights Park and Ride also serve the Star Lake Park and Ride and as such would serve a station area associated with either the SR 99 or I 5 alternatives without requiring any re routing. Re routing of other transit service to serve the Redondo Heights Park and Ride, for example, I 5 bus routes that stop at Federal Way Transit Extension 5-8 Level 2 Alternatives Screening Report
87 5.0 Data Results Star Lake Park and Ride, would be unlikely as it would create out of direction travel that would add travel time to the route and likely affect reliability. Transit Routes serving the Star Lake Park and Ride Eight King County Metro routes and one Sound Transit Express route serve the Star Lake Parkand Ride lot: 152, 173, 177, 178, 190, 192, 193, 197 and 574. These routes serve Auburn, Lakewood, Tacoma, Federal Way, Kent, Seattle and the University District. Most of these routes are destined for Downtown Seattle and/or serve the FWTC and Kent/Des Moines Park and Ride within the FWTE study area. The Star Lake Park and Ride is located on the west side of I 5 at the S. 272 nd Street interchange. Connecting RapidRide A Line with the Star Lake Park and Ride would be unlikely, as it would require re routing and out of direction travel for RapidRide A Line, and this route would already be connected, or close to, all of the five project alternatives at the Kent/Des Moines and FWTC station areas. Transit Routes serving the Federal Way Transit Center (FWTC) The FWTC is a major regional transit hub with nine KCM, three Pierce Transit, and three Sound Transit routes, for a total of 15 routes that serve the FWTC. The nine KCM routes are: 173, 179, 181, 182, 183, 187, 193, 197, and RapidRide A Line. The three Pierce Transit routes are 402, 500, and 501, and all terminate at FWTC. The three ST routes are 574, 577, and 578. In addition to these, KCM routes 177 and 178 stop adjacent to the FWTC. With all the SR 99 and I 5 alternatives terminating at or near the FWTC, no re routing of the transit routes that serve FWTC is expected. Overall Bus Transit Integration for the FWTE Project Although some routes could be restructured or truncated, the I 5 alternatives would provide access to, and in some cases duplicate, the existing regional express transit service that already serves the Kent Des Moines, Star Lake and FWTC Park and Ride facilities. Both the SR 99 and I 5 alternatives would likely have a connection to RapidRide A Line at the Kent/Des Moines and FWTC station areas. Due to peak period congestion at the I 5 interchanges with Kent Des Moines Road and S. 272 nd Street, rerouting of current peak only express bus service in the I 5 corridor to serve SR 99 alternatives could result in increased travel time and less reliable service for those routes.. The SR 99 alternatives would integrate better overall with existing service, in large part because RapidRide provides all day service with frequent stops between light rail stations. While the proposed I 5 stations would connect to a large number of existing transit routes, they are more Federal Way Transit Extension 5-9 Level 2 Alternatives Screening Report
88 5.0 Data Results predominantly peak period ones. The RapidRide A Line functions as a frequent, all day extension of the proposed service throughout the corridor. The proposed LRT service is more of a complement to existing transit service if it s on 99, and somewhat more of a duplication of existing transit service if it s on I 5. As shown previously in Exhibit 5 1, transit service in the study area connects to about half of the areas designated by the PSRC as Regional Growth Centers or as Regional Manufacturing and Industrial Centers. This connectivity is important because it indicates that those who live in the corridor are connected by transit to about 25% of the jobs in the region. To further this connection between housing and jobs, more than half of this transit service is peak period service, which addresses traditional commuter demand, rather than all day service, which is more oriented toward transit dependent populations and those who commute outside the normal rush hours. Key Results SR 99 alternatives would connect to about 8 percent more daily transit vehicle trips than the I 5 alternatives. This is mainly due to the all day frequency of service for King County Metro s RapidRide A Line that accounts for close to 60 percent of the total transit vehicle trips associated with the SR 99 alternatives. Transit routes that serve the I 5 alternatives are more peak oriented, while SR 99 service features more all day service. Overall, transit service within the FWTE study area connects to 18 of 35 Regional Growth and Regional Manufacturing and Industrial Centers in the region. These centers have 25 percent of the total employment in the region. 5.3 Transit-Dependent and Environmental Justice Populations A goal of the FWTE project is to support equitable mobility, which means providing similar options for getting around, such as transit, for all populations. The criterion for this objective is how well the alternative could be accessed by transit dependent populations. Measures for this criterion evaluated in Level 1 included U.S. Census data for low income, elderly, youth and zerocar household populations, but they did not differentiate noticeably between alternatives, and therefore alternate measures were identified for Level 2 to better understand the potential differences in transit dependent populations along each alternative alignment. Federal Way Transit Extension 5-10 Level 2 Alternatives Screening Report
89 5.0 Data Results Student Poverty The number of children in a given area eligible for the free or reduced lunch program can serve as an indicator of the overall income level of that area. To qualify for this program, the family income must be 130% or less of the poverty level figures on the U.S. Department of Health and Human Services Poverty Level Table. Methodology The percentage of students at each elementary school whose service area intersects with or is adjacent to an alternative alignment was identified and mapped. Elementary school data was used because they have the smallest service areas when compared to middle schools, junior highs, or high schools. Data for each school was obtained from the Washington State Office of Superintendent of Public Instruction website Washington State Report Card ( 12) and the data for students receiving free or reduced lunches was current as of May To illustrate student poverty, Exhibit 5 2 shows the elementary schools within or adjacent to each alternative and the percentage of each school s students that qualify for free or reduced lunch programs. Federal Way Transit Extension 5-11 Level 2 Alternatives Screening Report

90 5.0 Data Results Exhibit 5-2 Percentage of Children Eligible for Free or Reduced Lunch Federal Way Transit Extension 5-12 Level 2 Alternatives Screening Report
91 5.0 Data Results Discussion of Results Schools near the northern edge of the study have the highest share of students who qualify for free or reduced lunches, with over 90% of the elementary school population. All schools whose service area includes the area between SR 99 and I 5 have at least 60% qualifying, with most above 80%. The lowest percentage for any school adjacent to or intersecting an alternative alignment is Nautilus K 8 School in Federal Way, on the west side of SR 99, which has a qualifying percentage of 47.5%. All other schools have qualifying populations of over 50%. Key Results Student poverty rates are similar between alternatives. Student poverty rates are highest at the north end of the project area and lowest west of SR 99 near S. 260 th Street and near S. Dash Point Road Subsidized Housing Subsidized housing can be an indicator of the general income levels in a greater area and shows where lower income populations may be concentrated. For this measure, the locations of subsidized housing developments administered by the U.S. Department of Housing and Urban Development (HUD) were identified along each alternative alignment. Methodology Data on HUD housing in the study area was obtained from PSRC and mapped to show the HUD housing developments within ¼ mile and a ½ mile of each alternative. The number of HUD developments and units within a ½ mile of each alternative is summarized in Table 5 6 and Exhibit 5 3. This dataset, however, represents only these HUD housing locations and does not include other subsidized housing programs, such as the Section 8 voucher program administered by the King County Housing Authority, which could increase the number of subsidized housing units in either corridor. Federal Way Transit Extension 5-13 Level 2 Alternatives Screening Report
92 5.0 Data Results TABLE 5-6 Subsidized Housing within ½ Mile of Alternatives Alternative SR 99 Alternatives HUD Properties within ½ Mile Number of Units within ½ Mile SR 99 Elevated Median 9 1, th Avenue. S. Elevated West Side (w/sr 99 Elevated Median) 9 1,113 SR 99 Hybrid 9 1,113 I-5 Alternatives I-5 Mixed West Side I-5 Mixed West Side/Median Discussion of Results The SR 99 alternatives have a greater number of subsidized housing developments within a ½ mile than the I 5 alternatives do. Property sizes range from approximately 50 to 200 units, and although SR 99 alternatives have only one more HUD property within a ½ mile, the properties located along SR 99 tend to be larger complexes, resulting in over 400 more units along SR 99. Federal Way Transit Extension 5-14 Level 2 Alternatives Screening Report

93 5.0 Data Results Exhibit 5-3 Subsidized Housing Federal Way Transit Extension 5-15 Level 2 Alternatives Screening Report
94 5.0 Data Results Key Results Alternatives along SR 99 have slightly more HUD housing developments within a ¼ and a ½ mile than alternatives along I 5. SR 99 alternatives have over 400 more HUD housing units than alternatives along I Cost of Commuting The cost of getting to work can be a hardship for low income populations if it accounts for a substantial percentage of their income and it reduces the amount of income available for other necessities, such as housing and food. While measuring the average commute cost within the study area is not an indicator of transit dependent populations, when compared with data on income it can provide insight into where commute costs may be a financial burden on residents and where more affordable options, such as transit, may reduce this burden. Methodology Data for this measure was provided by PSRC, which calculated the average one way morning commute cost by Traffic Analysis Zone (TAZ) for vehicles and actual transit fare for transit riders. This calculation included estimated parking and gas costs for those that commute by car. Exhibit 5 4 shows the average commute cost by TAZ for the zones on each side of the SR 99 and I 5 alignments in the study area. Discussion of Results The average commute cost did not vary greatly within the study area, and the highest commute costs were found to occur on the east side of I 5. These areas are generally low density areas, however, and much of this area is used for agriculture or warehousing. Along the more populated SR 99 and west of I 5 corridors, the data at this level does not differentiate between these corridors, and it appears that commute costs are generally the same throughout the project area. Key Results Commute costs are highest east of I 5. Commute costs along SR 99 and between SR 99 and I 5 are generally the same. The lowest commute costs in the corridor are at the very north and very south ends of the corridor. Federal Way Transit Extension 5-16 Level 2 Alternatives Screening Report

95 5.0 Data Results Exhibit 5-4 Commute Cost by Traffic Analysis Zone Federal Way Transit Extension 5-17 Level 2 Alternatives Screening Report
96 5.0 Data Results Access to Express Transit For transit dependent populations, the walking distance to transit is important, and access to express buses can be important for minimizing the time to get to work, school, or other destinations on a daily basis. Methodology Data from PSRC shows the percentage of total population within ¼ mile of an express transit stop. A distance of ¼ mile is considered a walkable distance. Express transit routes included in the dataset from PSRC included KCM Express routes and Rapid Ride routes and express routes operated by Sound Transit and Pierce Transit. Information on access to express transit by TAZ is presented in Exhibit 5 5. Discussion of Results The percentage of population within ¼ mile of an express bus stop is fairly low, with only TAZs at the very north and south ends of the corridors and the area between Kent Des Moines Road and S. 260 th Street having percentages over 10 percent. Populations west of SR 99 and east of I 5 appear equally likely to have limited access to express bus stops. These results are due to the majority of express bus stops occurring on either SR 99 or I 5. Key Results The highest percentage of population within ¼ mile of an express bus stop is around the Federal Way Transit Center. The percentage of the population within ¼ mile of an express bus stop is below 10 percent for much of both the SR 99 and I 5 corridors. Federal Way Transit Extension 5-18 Level 2 Alternatives Screening Report

97 5.0 Data Results Exhibit 5-5 Access to Express Transit Federal Way Transit Extension 5-19 Level 2 Alternatives Screening Report
98 5.0 Data Results Minority Populations Disproportionately high and adverse effects to minority populations, along with low income populations, must be considered during the NEPA process under Executive Order Lowincome population were evaluated in the Level 1 evaluation and found not to differentiate between alternative due to the scale at which income data is collected by the U.S. Census. For the Level 2 Evaluation, minority population data was evaluated to determine if one alternative would be more likely to have a disproportionately high and adverse effect on environmental justice populations. Methodology To evaluate the presence of minority populations for potential effects on environmental justice populations, 2010 U.S. Census data on minorities was mapped within the greater project area, as shown in Exhibit 5 6. Discussion of Results As shown in Exhibit 5 6, the majority of the project area, including all of the area between SR 99 and I 5 within the project limits, is at least 51 percent minority. There are also census block groups within this area that are over 75 percent minority. Due to the shape and size of the census tracts at which these data are collected, these data do not differentiate between Level 2 alternatives, and all alternatives are equally likely to provide benefits to minority communities through improved transit service as well as have potential for adverse effects, such as noise, property acquisition and visual effects. Federal Way Transit Extension 5-20 Level 2 Alternatives Screening Report

99 5.0 Data Results Exhibit 5-6 Minority Population Federal Way Transit Extension 5-21 Level 2 Alternatives Screening Report
100 5.0 Data Results 5.4 Transit-Supportive Land Use and Economic Development Policies The potential for transit supportive land uses and economic development along each alternative was evaluated by comparing the existing land use, the planned land use, and the area of underutilized parcels within a half mile, as well as considering demographic information including the population, employment, and households within a half mile. Mobility along each alternative is also important in understanding the potential for development, and therefore parking opportunities and challenges along each alternative were evaluated along with the degree of non motorized access. This purpose of these measures is to understand the level of potential development that could occur along each corridor. This potential development could result in economic development desired by the cities, as well as increase the potential ridership base for each alternative. For purposes of data presentation and discussion in this chapter, some measures were grouped together for ease of discussion, as follows: Land Use Population, Employment, and Households Parking Opportunities Non motorized Access Land Use Land use related measures included existing land use, planned land use, and underutilized parcels within a ½ mile of each alternative. High density zoning, included transit oriented development and mixed use zoning, were evaluated within a ¼ mile of each alternative. Existing land uses along each alignment were evaluated in order to better understand the dominant existing land uses in the corridor and how well they align with each city s vision for that corridor which are reflected in the planned land uses. Planned land uses in the project area are determined by each city through their comprehensive planning process. The amount of underutilized land along each alternative was evaluated in order to better understand the area of land that could be available for redevelopment in the future. High density zoning indicates where the highest density development is likely to occur, and was focused on a smaller area adjacent to the alternatives because this area within an easy walking distance of the corridors and existing transit routes on these corridors. The planned land use data was compared with the existing land use data, underutilized parcel data and high density zoning to understand the level of potential development that could occur along each corridor. This potential development could result in economic development desired by the cities, as well as increase the potential ridership base for each alternative. The presence of underutilized land, however, Federal Way Transit Extension 5-22 Level 2 Alternatives Screening Report
101 5.0 Data Results does not guarantee that it will be redeveloped, but when evaluated in comparison to existing land use and planned land use, it can provide a picture of the degree of development potential along a corridor. Methodology Existing land use data was obtained from the King County Assessor database and was grouped into the following categories: Single family residential Multi family residential Commercial Industrial Institutional Parks/Open Space Vacant Existing land use data does not account for public right of ways. The total acres of each existing land use and the percent of the total area within a half mile of the centerline of each alternative was calculated and reported below in Table 5 7. Existing land uses are also shown on Exhibit 5 7. TABLE 5-7 Existing Land Uses Within ½ Mile of Alternative [Acres (%)] Alternative Single family Residential Multi-family Residential Commercial Industrial Institutional Parks/Open Space Vacant SR 99 Alternatives SR 99 Elevated Median 1,533 (29%) 615 (12%) 710 (14%) 10 (< 1%) 375 (7%) 78 (1%) 892 (17%) 30 th Avenue. S. Elevated West Side (w/sr 99 Elevated Median) 1,540 (29%) 612 (12%) 704 (13%) 10 (< 1%) 367 (7%) 79 (2%) 929 (18%) SR 99 Hybrid 1,524 (29%) 614 (12%) 710 (14%) 10 (< 1%) 378 (7%) 79 (2%) 887 (17%) I-5 Alternatives I-5 Mixed West Side 1,560 (29%) 597 (11%) 633 (10%) 8 (< 1%) 293 (5%) 83 (2%) 989 (18%) I-5 Mixed West Side/Median 1,570 (29%) 595 (11%) 630 (12%) 8 (< 1%) 295 (5%) 83 (2%) 992 (18%) Note: Percentages do not add to 100 because total land use acreage includes public and other unusable rights of way. Federal Way Transit Extension 5-23 Level 2 Alternatives Screening Report

102 5.0 Data Results Exhibit 5-7 Existing Land Use Federal Way Transit Extension 5-24 Level 2 Alternatives Screening Report
103 5.0 Data Results Planned land use data from each city were grouped into the following categories: Single family residential Multi family residential Mixed Use Commercial Industrial Institutional Parks Urban Separator (City of Kent only) The current Comprehensive Plan data for the City of Kent does not incorporate the land uses proposed in the 2012 Midway Subarea Plan. The data set used for this Level 2 study has been updated to include the Midway Subarea Plan land uses. The Urban Separator land use category within the City of Kent is a special designation for areas that are intended to protect environmentally sensitive areas, including lakes, streams, wetlands, and geologically unstable areas. These areas allow no more than one dwelling unit per acre, and within the project study area are primarily located on the steep hillside between I 5 and the Green River valley, with the exception of the McSorley Creek area, which also carries this designation. The total acres of each planned land use and the percent of the total area within a half mile of the footprint of each alternative was calculated and reported below in Table 5 8. Planned land uses are also shown on Exhibit 5 8. TABLE 5-8 Comprehensive Plan Land Uses Within ½ Mile of Alternative [Acres (%)] Alternative SR 99 Alternatives Single Family Residential Multi-family Residential Mixed Use Commercial Industrial Institutional Parks Urban Separator SR 99 Elevated Median 2,113 (40%) 604 (12%) 623 (12%) 857 (17%) 3 (<1%) 175 (3%) 260 (5%) 77 (1%) 30 th Avenue S. Elevated West Side w/sr 99 Elevated 2,118 (40%) 600 (11%) 640 (12%) 860 (17%) 5 (<1%) 161 (3%) 276 (6%) 83 (2%) Median SR 99 Hybrid 2,107 (40%) 603 (12%) 620 (12%) 855 (16%) 3 (<1%) 177 (3%) 263 (5%) 77 (1%) I-5 Alternatives I-5 Mixed West Side 2,318 (43%) 493 (9%) 636 (12%) 763 (15%) 5 (<1%) 64 (1%) 277 (5%) 116 (2%) I-5 Mixed West Side /Median 2,335 (43%) 491 (9%) 636 (12%) 760 (14%) 5 (<1%) 63 (1%) 280 (5%) 116 (2%) Note: Percentages do not total 100 because total land use acreage includes public and other unusable rights of way. Underutilized parcels were identified using the improvement value and land value for each parcel within a half mile based on 2012 King County Assessor data. If the ratio of improvement to land value is 1:1 or less, the land is considered underutilized and could have greater value if redeveloped. The acres and percentage of underutilized land within a ½ mile of each alternative are provided in Table 5 9 and in Exhibit 5 9. Federal Way Transit Extension 5-25 Level 2 Alternatives Screening Report


104 5.0 Data Results Exhibit 5-8 Planned Land Use Federal Way Transit Extension 5-26 Level 2 Alternatives Screening Report

105 5.0 Data Results Exhibit 5-9 Underutilized Parcels Federal Way Transit Extension 5-27 Level 2 Alternatives Screening Report
106 5.0 Data Results TABLE 5-9 Underutilized Parcels within ½ Mile of Alignment Alternative Underutilized Parcels [Acres (%)] SR 99 Alternatives SR 99 Elevated Median 1,606 (31%) 30 th Avenue. S. Elevated West Side (w/sr 99 Elevated Median) 1,599 (30%) SR 99 Hybrid 1,598 (31%) I-5 Alternatives I-5 Mixed West Side 1,595 (30%) I-5 Mixed West Side/Median 1,606 (30%) High density zoning within each city was identified, and included areas zoned as high density, mixed use or transit oriented development, as well as commercial and multi family residential areas that allowed mixed use. The acres and percentage of high density zoning within a 1/4 mile of each alternative are provided in Table 5 10 and in Exhibit TABLE 5-10 High Density Zoning Within 1/4 Mile of Alignment Alternative High-Density Zoning [Acres (%)] SR 99 Alternatives SR 99 Elevated Median 797 (32%) 30 th Avenue. S. Elevated West Side (w/sr 99 Elevated Median) 823 (33%) SR 99 Hybrid 792 (32%) I-5 Alternatives I-5 Mixed West Side 580 (23%) I-5 Mixed West Side/Median 579 (22%) Discussion of Results Existing land uses within a ½ mile of each alternative are similar between all alternatives, with approximately one third of the land used for single family residential, which is the dominant use. Public and private right of way (not included in Table 5 7) generally accounts for 20 percent of each study area, and all other land uses account for less than 20 percent of the study area. Almost all land uses are within one to two percent of each other between alternatives, with the largest difference between alternatives being 4% for commercial land between the SR 99 Hybrid and SR 99 Elevated Median alternative when compared with the I 5 Mixed West Side alternative. Federal Way Transit Extension 5-28 Level 2 Alternatives Screening Report

107 5.0 Data Results Exhibit 5-10 High-Density Zoning Federal Way Transit Extension 5-29 Level 2 Alternatives Screening Report
108 5.0 Data Results Over the full length of each alternative, planned land uses do not vary noticeably between alternatives. The predominant planned land use for all alternatives is single family residential, followed by commercial. Multi family and mixed use categories are the next largest categories, and have similar planned areas of approximately 10 percent of the study area. Compared with the percentages of existing land uses, the greatest areas of planned growth appear to be for single family, mixed use and commercial land uses. The area of underutilized land within the study area for each alternative is very similar for all alternatives. As shown in Table 5 7 (Existing Land Uses), all alternatives have 17 to 18% vacant land within a half mile. This would suggest that approximately 20 to 30% of land within a ½ mile of each alternative could be developed or redeveloped. As described under the discussion of planned land uses, it is most likely that this land would be developed as single family residential, commercial, or mixed use. The greatest amount of high density zoning is along the 30 th Avenue S. alternative, with 823 acres and 33 percent of all land within a ¼ mile of the alternative. The SR 99 alternatives had slightly less area, with 32 percent of the area within a ¼ zoned as high density. The I 5 alternatives had between 22 and 23 percent of the area zoned as high density, with the I 5 Mixed West Side having slightly greater area (one acre) than the I 5 Mixed West/Median alternative. Key Results Existing and planned land uses are similar within a ½ mile between all alternatives. The predominant existing use in each study area is single family residential, followed by vacant land. Commercial development and multi family residential are both about 10% to 15% of existing land use. Most planned land uses are within 1 3 percent of other alternatives. The largest difference in planned land uses occurs between the SR 99 Hybrid and the I 5 alternatives for single family residential, with a difference of 3%. All alternatives have approximately 30% underutilized parcels. The alternatives predominantly along SR 99 had approximately 10 percent more land zoned for high density within ¼ mile Population, Households, and Employment The existing population, households, and employment within a half mile of each alternative was evaluated to understand the density of existing development and how this relates to planned land uses. Federal Way Transit Extension 5-30 Level 2 Alternatives Screening Report
109 5.0 Data Results Methodology 2010 U.S. Census data was used for population and households, and the total population and households within a half mile of each alternative was determined using GIS. This methodology assumes that the populations and households are distributed evenly within each census block, so these numbers are estimates only for blocks that are not entirely within the half mile study area. The alternative centerlines were provided to PSRC, who provided data on employment within a half mile of each alternative based on 2011 data from the Washington State Employment Security Department. Employment data are tied to specific locations and therefore are an accurate representation of employment in this study area. Table 5 11 shows current population, household, and employment data with ½ mile of each alternative. TABLE 5-11 Population, Households and Employment Within ½ Mile of Alternative Alternative Population Households Employment SR 99 Alternatives SR 99 Elevated Median 35,800 14,000 14, th Avenue. S. Elevated West Side (w/sr 99 Elevated Median) 35,900 14,000 14,000 SR 99 Hybrid 35,700 14,000 14,000 I-5 Alternatives I-5 Mixed West Side 35,100 13,300 11,400 I-5 Mixed West Side/Median 34,900 13,200 11,400 Key Results Households numbers are the same for all SR 99 alternatives, while population differs by 100 to 200 between these alternatives. The I 5 Mixed West Side alternative has slightly more population and households than the I 5 Mixed West Side/Median alternative. SR 99 has slightly higher populations and households than the I 5 alternatives. Employment is the same for all SR 99 alternatives and for both I 5 alternatives. SR 99 alternatives have approximately 2,600 additional jobs within a ½ mile. Discussion of Results Within a half mile of each alternative, the current population and number of households do not differ substantially. Between the SR 99 alternatives, the 30 th Avenue S. Elevated West Side alternative has the highest population, but the number of households is the same as the other SR 99 alternatives. The maximum difference between alternatives is 1,000 people and 800 households. Employment along SR 99 is approximately 14,000, which is 20% higher than along Federal Way Transit Extension 5-31 Level 2 Alternatives Screening Report
110 5.0 Data Results I 5. Total employment is the same between all SR 99 alternatives and between both I 5 alternatives Parking Opportunities Park and Ride facilities expand the effective service area of individual transit routes and the transit system as a whole. These facilities attract passengers who either prefer to access transit by automobile or who have no other efficient or viable means of access. Methodology Based on the proximity of existing Park and Ride facilities to each alternative, the number of parking stalls and observed utilization rates are summarized to identify the total parking available within a ½ mile by FWTE alternative. Beyond the current active Park and Ride locations, an assessment of future potential Park and Ride locations was conducted by identifying existing church properties that are located within a ½ mile of a station area or accessible to RapidRide A Line. Although Sound Transit has not done so, other transit agencies commonly lease church parking lots for use as park and rides because they often have excess capacity during weekday commute hours. Lastly, a qualitative assessment of the potential for on street transit parking and/or hide and ride activity was performed within a ½ mile of a station area. This was conducted by examining the relative convenient access from existing onstreet non restricted public parking to station areas in relationship to the existing Park and Ride utilization rates. Data for the existing park and ride lots in the study area are provided in Table TABLE 5-12 Park-and-Ride Lots in FWTE Study Area Park-and-Ride Lot Number of Existing Park-and-Ride spaces Utilization of Existing Park-and-Ride spaces Alternative Alignments Served Kent-Des Moines % I-5 St Columba's Episcopal Church* 15 33% I-5 Star Lake % I-5 Redondo Heights 697 8% SR 99 All Saints Lutheran Church* 75 75% I-5 Federal Way Transit Center 1,190 99% I-5 and SR 99 Federal Way/S 320 th St % I-5 and SR 99 * leased lots Note: Parking Utilization data from King County Metro as of 4th Qtr 2012 Federal Way Transit Extension 5-32 Level 2 Alternatives Screening Report
111 5.0 Data Results Discussion of Results Seven Park and Ride locations have been identified in the FWTE study area. Three Park and Ride facilities, Federal Way Transit Center, the Federal Way/S. 320 th Park and Ride and the Kent/Des Moines Park and Ride, are assumed to be within a ½ mile of a potential station area for all five FWTE project alternatives. These lots account for over 2,400 total spaces but two out of three of these lots are currently at capacity. The only lot of these three with available capacity is the Federal Way/S. 320 th Street lot. In addition to the three Park and Ride lots that serve both the SR 99 and I 5 alternatives, the two I 5 alternatives are also near or adjacent to three Park and Ride facilities: Star Lake Parkand Ride Lot, All Saints Lutheran Church, and St. Columbia s Episcopal Church. The two church lots are leased lots with less than 100 total spaces between them. The Star Lake Park and Ride currently operates at 58% utilization with approximately 225 spaces still available for use. The SR 99 alternatives are adjacent to one additional Park and Ride lot, the Redondo Heights Park and Ride Lot. Based on existing capacity and availability, the SR 99 alternatives have about 70 additional total parking spaces than the I 5 alternatives. This is primarily because the Redondo Heights Park and Ride has limited commuter oriented transit service to Downtown Seattle and other regional centers and therefore is currently only eight percent utilized. Table 5 13 provides the total Park and Ride parking capacity and utilization of current parking by alternative. TABLE 5-13 Parking Potential within 1/2-Mile of Alternative Land Use SR 99 Alternatives Number of Existing Park and Ride spaces Utilization of Existing Park and Ride spaces Number of Potential New Park and Ride locations SR 99 Elevated Median 3,134 64% 4 30 th Avenue. S. Elevated West Side (w/sr 99 Elevated Median) 3,134 64% 4 SR 99 Hybrid 3,134 64% 4 I-5 Alternatives I-5 Mixed West Side 3,067 75% 1 I-5 Mixed West Side/Median 3,067 75% 1 In terms of potential additional Park and Ride lot areas, there are only a handful of churches within reasonable proximity (1/2 mile) to either the station areas or a RapidRide A Line stop. Four of these churches are along SR 99. Only one additional church location was identified east of I 5 near the S. 272 nd Street interchange. Federal Way Transit Extension 5-33 Level 2 Alternatives Screening Report
112 5.0 Data Results The three possible station areas have various levels of available on street parking supply and degree of ease between the station area and that on street parking that influence their potential for hide and ride activity. In general, the stations along the S. 272 nd Street corridor have the likeliest probability of hide and ride activity while the Federal Way Transit Center has the lowest potential. Kent/Des Moines Station Area The neighborhoods surrounding the Kent/Des Moines station area have a high degree of restricted parking with over 70 percent of the on street parking restricted for residential use only. The high level of restricted parking makes the likelihood of station users parking in the neighborhood low. S. 272 nd Street Station Areas (Star Lake and Redondo Park and Rides) The majority of residential development south of the Star Lake Park and Ride is multi family with private resident only parking. The residential neighborhood north of the Park and Ride lot off of 28 th Avenue S. is relatively small with unrestricted on street parking that is less than 10% utilized. The neighborhood south of S. 272 nd Street and west of Star Lake Road has on street parking that is about 10% utilized during the day. The distance from this neighborhood is about ½ mile from both the Star Lake Park and Ride and the Redondo Heights Park and Ride lots; however due to a combination of vegetation barriers and street connectivity, access to either the Star Lake or Redondo Heights station areas would require walking along S. 272 nd Street. This would likely require a 15 to 20 minute walk to these station areas. FWTC The nearest neighborhood to the FWTC area with on street parking is located north of S. 312 th Street. Access to the station area would require walking along 28 th Avenue S. past Truman High School. This is approximately a ½ mile walk that would take about 10 minutes. Therefore there is a low potential of riders parking in the neighborhood and walking to the transit center. Key Results All five project alternatives (along both I 5 and SR 99) have similar parking availability. The Redondo Heights Park and Ride has the lowest utilization rate of all Park and Ride lots in the FWTE study area. Only a few existing locations could likely provide future leased Park and Ride space. The stations in the S. 272 nd Street area (Star Lake and Redondo Heights) have some potential for hide and ride parking to occur. The on street parking near the Kent/Des Moines and FWTC station areas are either restricted or are not easily accessible. Federal Way Transit Extension 5-34 Level 2 Alternatives Screening Report
113 5.0 Data Results Non-Motorized Access Existing and planned pedestrian facilities around the light rail station areas provide an opportunity to connect the adjacent land uses and the stations. A higher concentration of a street system is generally reflective of higher intersection density and improved non motorized accessibility. Methodology The density of the existing street system within a ½ mile buffer of the station areas was calculated using GIS. The roadways are classified into two types: Local and Collectors Minor and Principal Arterials Freeways were not included in this calculation as non motorized access is not provided on freeways. Local Bicycle and Pedestrian Master Plans from the cities of SeaTac, Kent, Des Moines, and Federal Way as well as King County were also reviewed to understand any nonmotorized deficiencies in and around the planned station areas as well as plans for future nonmotorized investments. The number of miles of roadway in station areas is shown for each alternative in Table TABLE 5-14 Miles of Roadway within Station Areas Alternative SR 99 Alternatives Roadway Classification (in miles) Local and Collector Arterial Total SR 99 Elevated Median th Avenue. S. Elevated West Side (w/sr 99 Elevated Median) SR 99 Hybrid I-5 Alternatives I-5 Mixed West Side I-5 Mixed West Side/Median Note: a ½-mile buffer around the station area was used to calculate the roadway miles and values were round to the nearest ½ mile. Discussion of Results The roadway system density (in miles) is similar for all of the alignment alternatives, although pedestrian and bicycle access for the station areas associated with the I 5 alternatives would be limited at the Kent Des Moines Road and S. 272 nd Street interchanges. Access between the station areas and areas east of I 5 would require crossing under I 5 at these interchanges. The combination of high roadway volume and congestion at these interchanges along with minimal Federal Way Transit Extension 5-35 Level 2 Alternatives Screening Report
114 5.0 Data Results bicycle and pedestrian facilities create a non motorized access barrier. These interchange areas are both shown as priority pedestrian and bicycle areas in the City of Kent s Non Motorized Plan, but currently lack bicycle facilities and sidewalks around the interchanges are sporadic. In general, SR 99 has sidewalks on both sides of the roadway and could provide access for nonmotorized users to the light rail stations. Most other streets surrounding the station areas do not have continuous sidewalks. There are limited bicycle facilities along SR 99, however all potential station areas have been indicated as locations for future investments in both bicycle and pedestrian improvements by the local agencies. The City of Des Moines has future plans for a bike lane along S. 240 th Street as well as S. 272 nd Street, which would connect with the City of Federal Way s future bicycles plans along S. 272 nd Street. Key Results Many of the streets within the station areas lack sidewalks and have limited bicycle facilities. The SR 99 alternatives have a larger local street network than the I 5 alternatives which could provide greater non motorized access. 5.5 Effect on Natural Environment Wetlands and Streams Wetlands are important ecosystem areas that provide habitat, contribute to hydrologic function, and water quality function in a given area. Streams are important aquatic habitats for salmonids and other fish. This criterion had two measures: direct effect on wetlands direct effect on streams. Methodology Existing wetland and stream data was obtained from King County and wetland data was provided by the City of Kent. These datasets were used to identify potential direct effects to wetlands and streams for each alternative as follows: Acreage of wetlands within the project construction footprint Length of streams within the project construction footprint Wetlands and streams in the project area are shown on Exhibit Quantified direct effects to wetlands and streams are shown in Table Federal Way Transit Extension 5-36 Level 2 Alternatives Screening Report

115 5.0 Data Results Exhibit 5-11 Wetlands and Stream Crossings Federal Way Transit Extension 5-37 Level 2 Alternatives Screening Report
116 5.0 Data Results TABLE 5-15 Wetland and Stream Effects by Alternative Alternative SR 99 Alternatives Acres of Wetlands Directly Affected Length of Streams Potentially Affected (feet) Number of Stream Crossings SR 99 Elevated Median th Avenue. S. Elevated West Side (w/sr 99 Elevated Median) SR 99 Hybrid I-5 Alternatives I-5 Mixed West Side I-5 Mixed West Side/Median Discussion of Results Based on available wetland and stream data and the current level of design, the only alternative with potential direct effects on wetlands would be the SR 99 Hybrid. This impact would occur on the west side of the McSorley Creek wetland complex between S. 260th Street and S. 272 nd Street. A total of 0.7 acres would be within the permanent right of way for this alternative, however the actual permanent impact may be less since the guideway would be elevated in this location. Field verification of wetlands in both corridors during the EIS process may identify new wetlands or revise the boundaries of known wetlands and when combined with further refined design of alternatives, additional direct effects to wetlands may still occur for all alternatives. All Level 2 alternatives have streams within their construction footprints, with the shortest length of stream associated with the SR 99 Hybrid alternative, which crosses short distances of an unnamed stream near S. 204 th Street and McSorley Creek. The SR 99 Elevated Median alternative would cross these streams as well, but has a larger footprint at these crossing because of greater roadway reconstruction at intersections. The I 5 alternatives would only affect the unnamed stream near S. 204 th Street, but would parallel it for much of its length between SR 99 and I 5, resulting in the greatest length of stream within the construction footprint. It is important to note that these streams are likely in culverts for much if not all of the length where they occur in the project footprint, so it is likely there would be no permanent impacts to these streams and that temporary impacts may only occur if the culvert needs to be disturbed or extended during construction. Federal Way Transit Extension 5-38 Level 2 Alternatives Screening Report
117 5.0 Data Results Key Results There would be no wetland effects for either of the I 5 alternatives. The SR 99 Hybrid alternative would have the greatest amount of wetland directly affected. The SR 99 alternatives would have the most potential for effects to streams, while the I 5 alternatives would have the least. 5.6 Effect on Built Environment The evaluation of effects on the built environment includes measures to identify potential effects to residences, neighborhoods, businesses, and the greater community. Individual measures are discussed below Visual Effects Visual and aesthetic environments are the landscape s natural and cultural features that can be seen and that contribute to the public s appreciation and enjoyment of the landscape. Effects on the visual environment are defined in terms of the extent to which the project s presence would change the perceived visual character and quality of the environment. Methodology Three measures were used to evaluate potential visual effects. The first is the total length of the alternative adjacent to visually sensitive areas. Visually sensitive areas contain viewers such as residents or park users that have high visual sensitivity to changes in the viewed landscape because of their familiarity with an area, and/or, their frequent and long viewing duration of it. Areas containing single family residential neighborhoods, multifamily complexes, community centers (such as the Woodmont Library) and parks are considered to be sensitive viewing areas. These areas were initially identified using aerial photographs and online aerial imagery resources and were confirmed during site visits. In some locations there are sensitive viewers on both sides of an alignment. In these situations both sides were measured. The second factor is the total length of the visual quality categories of areas the alternatives would pass by or through. This assessment was based upon Federal Highway Administration (FHWA) visual quality assessment methodology and guidance. Visual quality categorized by considering a viewed landscape s vividness (sense of drama, memorability, or distinctiveness), intactness (the visual integrity of a landscape and its freedom from visually encroaching and unattractive elements), and unity (the degree of visual coherence and compositional harmony). Vividness, intactness and unity are considered in establishing visual quality categories. In this assessment visual quality is categorized as high, average, or low. The visual quality of most landscapes is average. For the visual quality of a landscape to be considered high, it must be Federal Way Transit Extension 5-39 Level 2 Alternatives Screening Report
118 5.0 Data Results exceptional in terms of vividness, intactness and unity. To be considered low, a landscape must be lacking in vividness, intactness and unity. Landscapes that are utilitarian in use and appearance, such as automobile oriented businesses frequently found along transportation corridors, are often considered to have low visual quality. The visual quality of an area can indicate how responsive an area s most sensitive viewers would likely be to changes in the visual environment. For example, viewers such as residents with high viewer sensitivity in areas that are categorized as having medium visual quality would be expected to react more to changes in the visual environment than would viewers with low visual sensitivity in areas that have low visual quality. Visual quality was established by visual analysts as they drove through the project area to become familiar with it and by taking representative photographs of various parts of the project area to confirm the categories. The project area for visual assessment primarily follows the SR 99 and I 5 corridors. Most of the areas along the corridors are considered to be of average or low visual quality. There are a number of residential areas outside of the two corridors that were considered in this evaluation that have high visual quality. However, because views from these areas would likely not be affected by the alternatives being considered, they were not included in this evaluation. The third factor is views of distant features such as Puget Sound and the Olympic Mountains. Several areas along the SR 99 corridor have these views, as identified during a site visit to the study area. The presence of the alternatives in these areas could interrupt or block views. Additional field investigations will be conducted during the EIS to determine specific areas with views (particularly if there are specific views identified in local plans or ordinances), the nature of the views (panoramic, narrow, only from elevated areas east of SR 99, etc.) and how specific alternatives might affect views. Information on visual effects is presented in Table 5 16 and in Exhibit 5 12 (in three parts). Federal Way Transit Extension 5-40 Level 2 Alternatives Screening Report


119 5.0 Data Results Exhibit 5-12a Visual Conditions in Landscape Unit 1 Federal Way Transit Extension 5-41 Level 2 Alternatives Screening Report


120 5.0 Data Results Exhibit 5-12b Visual Conditions in Landscape Unit 2 Federal Way Transit Extension 5-42 Level 2 Alternatives Screening Report


121 5.0 Data Results Exhibit 5-11c Visual Conditions in Landscape Unit 3 Federal Way Transit Extension 5-43 Level 2 Alternatives Screening Report
122 5.0 Data Results TABLE 5-16 Visual Effects by Alternative Alternative SR 99 Alternatives Route Length Adjacent to Visually Sensitive Areas (feet) Visual Quality (VQ) of Areas Adjacent to Visually Sensitive Areas (feet) Average VQ Low VQ Number of Areas Near Alternative with Water and/or Mountain Views to West SR 99 Elevated Median 7,275 5,050 2, th Avenue. S. Elevated West Side (w/sr 99 Elevated Median) 10,050 9, SR 99 Hybrid 7,275 5,050 2,225 6 I-5 Alternatives Notes Potential at-grade parts of alignment not near sensitive viewing areas I-5 Mixed West Side 21,025 16,650 4,375 0 I-5 Mixed West Side/Median 6,050 4,450 1,600 0 Most of route in I-5 median Notes: All alternatives have a profile that is predominantly elevated. No areas of high visual quality were identified in the study area. Discussion of Results Changes related to alternatives that would be routed along the west side of I 5 have the potential to have visual impacts along greater lengths of sensitive viewing areas than the alternatives along SR 99. This is due to the number of residential areas adjacent to the west side of I 5 and because vegetation along the west side of I 5 (within the I 5 right of way and next to it on private lands) has formed a backdrop to these residential areas that lines much of I 5 and blocks views of it from nearby areas. Although many residences that back up to I 5 face away from it, removing vegetation (mainly tall trees) and potentially seeing project components could change the character and visual quality of eastern views from these neighborhoods. This could be important if changes associated with removing vegetation along I 5 and building the elevated structure would lower average visual quality to low. Alternatives that would be routed along SR 99 would pass by fewer sensitive viewing areas than the I 5 alternatives. In some locations the alternatives could impinge upon, or block, views to the west of Puget Sound and the Olympic Mountains from sensitive viewing areas. These areas can include locations at street level and higher areas to the east, which include multistory residential buildings and single family residences on the slopes east of SR 99. The City of Federal Way may have some protected views within the project area that will need to be identified and evaluated in the EIS. Federal Way Transit Extension 5-44 Level 2 Alternatives Screening Report
123 5.0 Data Results Although this measure identifies the areas where visual effects may occur along each alternative, there are ways in which the alternatives can be designed to reduce or minimize this potential for impacts, and these will be evaluated further in the EIS. Key Results The SR 99 Elevated Median and SR 99 Hybrid alternatives would pass next to the second shortest length (7, 275 feet) of visually sensitive areas of all the alternatives and the second least amount of areas with average visual quality (5,050 feet). The 30 th Avenue S. Elevated West Side alternative would pass through a residential area, and therefore would pass by more visually sensitive areas (a total of 10,050 feet) than the SR 99 Elevated Median and the SR 99 Hybrid alternatives. It would also pass near more areas with average visual quality (9,900 feet total) than the other SR 99 alternatives. The I 5 Mixed West alternative would pass by the longest length of visually sensitive areas (21,025 feet) of all of the alternatives. The alternative would also pass next to the most sensitive areas that are adjacent to areas with average visual quality (16,650 feet). The I 5 Mixed West/Median alternative would pass by the least amount of visually sensitive areas (6,050 lineal feet) of all the alternatives and the least (4,450 lineal feet) amount of areas with average visual quality Potential Displacements Properties would need to be purchased for right of way and other project related facilities and would involve the displacement and relocation of residences and businesses. Projects receiving federal funding are required to comply with the Uniform Relocation Assistance and Real Property Acquisition Policies Act of 1970 (Code of Federal Regulations [CFR] Title 49, Part 24), as amended. This Act provides guidance on how property owners will be compensated and relocated as necessary. Sound Transit adopted the Real Property Acquisition and Relocation Policy, Procedures, and Guidelines to guide its compliance with Chapter 8.26 Revised Code of Washington (RCW) and Chapter Washington Administration Code (WAC). Methodology Individual properties and buildings may have one or multiple residential units or businesses, so potentially displaced buildings were field checked to confirm the number of residences or businesses that would potentially be displaced. Table 5 17 provides the total number of residences and businesses that could potentially be displaced for each alternative. Federal Way Transit Extension 5-45 Level 2 Alternatives Screening Report
124 5.0 Data Results Discussion of Results The SR 99 Hybrid alternative would result in the greatest number of potential business displacements, with up to 108, which is more than twice the number of businesses displaced by any other alternative. Both the I 5 Mixed West and I 5 Mixed West/Median alternatives would result in the greatest number of potential residential displacements, with up to 131, but would only displace three businesses. TABLE 5-17 Potential Displacements by Alternative Alternative SR 99 Alternatives Potential Residence Displacements Potential Business Displacements SR 99 Elevated Median th Avenue. S. Elevated West Side (w/sr 99 Elevated Median) SR 99 Hybrid I-5 Alternatives I-5 Mixed West Side I-5 Mixed West Side/Median Key Results Displacements would be required for all alternatives. SR 99 alternatives would require more business displacements than alternatives along I 5. I 5 alternatives would require more residential displacements than alternatives along SR Community Facilities For Level 2, community facilities are defined as schools, libraries, and religious institutions, based on available information from the King County Assessor as well as data collected in the field, which identified additional facilities than were identified in Level 1. These social centers and important meetings areas unify the community as well as provide vital services to communities. Methodology Community facilities have potential to be directly affected if they are within the project footprint and would be displaced. They may be indirectly affected by noise, visual, traffic, or construction effects if located up to 200 feet from the centerline of the alternative. As the alternatives are refined, many potential effects may be avoided or mitigated; therefore, this measure is intended to show relative differences among the alternatives. Exhibit 5 13 identifies school, church, and government parcels within 200 feet of each alternative. Table 5 18 shows the total number of these resources that could be directly and indirectly affected for each alternative. Federal Way Transit Extension 5-46 Level 2 Alternatives Screening Report

125 5.0 Data Results EXHIBIT 5-13 Community Facilities within 200 Feet of Alternatives Federal Way Transit Extension 5-47 Level 2 Alternatives Screening Report
126 5.0 Data Results TABLE 5-18 Community Facilities Effects by Alternative SR 99 Alternatives Alternative Number of Resources Directly Affected Number of Resources Potentially Indirectly Affected SR 99 Elevated Median th Avenue. S. Elevated West Side (w/sr 99 Elevated Median) 0 15 SR 99 Hybrid 3 13 I-5 Alternatives I-5 Mixed West Side 0 6 I-5 Mixed West Side/Median 0 6 Discussion of Results The SR 99 Hybrid alternative would displace three churches and would be the only alternative with direct effects on community facilities. These churches are leased facilities within existing strip malls. The SR 99 Elevated Median alternative would have the greatest potential for indirect effects, with 16 community facilities within 200 feet, while the I 5 alternatives would have the least potential for indirect effects. Community facilities near stations, however, could experiences a benefit from improved access. Key Results The SR 99 Hybrid alternative is the only alternative that would have direct effects on community facilities, displacing three churches. The I 5 alternatives would have less potential for indirect effects to community facilities than alternatives along SR Noise Noise sensitive receivers were evaluated for Level 2 based on Federal Transit Administration s (FTA) criteria in the Transit Noise and Vibration Impact Assessment (FTA 2006), which groups noise sensitive land uses into the following categories: Category 1: Certain buildings or outdoor spaces, where quiet is an essential element of their purpose. Category 2: Residences and buildings where people normally sleep, including residences, hospitals, and hotels where nighttime sensitivity is assumed to be important. Category 3: Institutional land uses with primarily daytime and evening use, including schools, libraries, churches, and certain parks. Federal Way Transit Extension 5-48 Level 2 Alternatives Screening Report
127 5.0 Data Results Methodology Within the FWTE study area, potential noise sensitive receivers evaluated for Level 2 include residences and hotels (Category 2 receivers) and schools and churches (Category 3 receivers). No Category 1 receivers were identified in the alternative corridors. All Category 2 receivers would be assumed to have a high potential for noise effects at distances of up to 175 feet from the track. Category 2 receivers along elevated alternatives or in areas with little or no shielding from at grade alternatives would be considered to have a high potential for noise effects out to 350 feet from the alignment. Schools and churches were considered if within 175 feet of the alternative with no obstructions. Only minimal physical and topographical shielding was considered and used to reduce effects. Existing background noises were not taken into account for the purposes of the Level 2 evaluation (i.e., noise from I 5). Table 5 19 summarizes the effects along the entire length of each alternative. Discussion of Results The 30 th Avenue S. Elevated West Side alternative would result in the greatest potential for noise effects at both Category 2 and Category 3 receivers, with almost 2,500 Category 2 and 12 Category 3. The I 5 Mixed West alternative would have the next highest number of Category 2 receivers, with just over 2,000, but only five Category 3 receivers. The remaining alternatives would have fairly similar effects on Category 2 receivers, with approximately 1,600 to 1,700 affected; but there is a wider range of potential Category 3 receivers affected. TABLE 5-19 Potential for Noise Effects by Alternative Alternative SR 99 Alternatives Category 2 Noise-Sensitive Receivers (Residences, Hotels) Category 3 Noise-Sensitive Receivers (Schools, Churches) SR 99 Elevated Median 1, th Avenue. S. Elevated West Side (w/sr 99 Elevated Median) 2, SR 99 Hybrid 1,600 9 I-5 Alternatives I-5 Mixed West Side 2,000 5 I-5 Mixed West Side/Median 1,700 3 Key Results The 30 th Avenue S. Elevated West Side alternative would result in the highest number of potential noise effects. The SR 99 Hybrid alternative would result in the lowest number of potential noise effects. Federal Way Transit Extension 5-49 Level 2 Alternatives Screening Report
128 5.0 Data Results The I 5 Mixed West Side/Median alternative would have the fewest Category 3 noisesensitive receivers Vibration The FTA criteria in the Transit Noise and Vibration Impact Assessment (FTA 2006) identifies three types of land use for vibration: Category 1 High Sensitivity, Category 2 Residential and Category 3 Institutional. The criteria for determining impacts to these land uses are based on the frequency of events, with Category 1 having the most sensitive criteria for vibration and ground borne noise impacts and Category 3 having the least sensitive criteria. The potential for vibration and ground borne noise impacts also depends on the soils in the area and how vibration travels through these soils, requiring vibratory testing along the corridor to determine the properties of the soils in the project area, although residences within 150 feet will generally be considered vibration sensitive for purposes of the impact analysis. This testing and analysis will be completed for the EIS, but was not completed for screening, however the number of Category 2 receivers is expected to similar to but less than the number of Category 2 noise sensitive receivers. For this reason, the Level 2 evaluation prioritized the most sensitive land uses (Category 1) along each alternative, because assessing the sensitivity of other land use categories appropriately would require field vibratory testing. Methodology A field survey of properties along all alternative alignments was completed to identify buildings that would be potentially high sensitivity land uses, known as Category 1. Category 1 land uses are described as buildings where vibration would interfere with operations within the building, including levels that may be well below those associated with human annoyance (FTA 2006). Typical land uses covered by Category 1 include: Vibration sensitive research and manufacturing Hospitals with vibration sensitive equipment University research operations The FTA guidance also identifies special buildings that can be very sensitive to vibration but do not fit into Categories 1 through 3. These include concert halls, TV studios, recording studios, auditoriums, and theaters. The FTA screening manual treats concert halls and TV studios as Category 1 and auditoriums and theaters as Category 2. Discussion of Results No highly sensitive receptors were identified along any of the alternative alignments; therefore none of the alternatives have potential to affect highly sensitive receptors. Federal Way Transit Extension 5-50 Level 2 Alternatives Screening Report
129 5.0 Data Results Key Result No Category 1 vibration sensitive land uses or special buildings were identified along any alternative alignment Traffic Potential traffic effects include increased waiting time at intersections, which can affect an intersection s Level of Service (LOS). This increase in delay is generally attributable to higher volumes of traffic traversing an intersection, but can be caused by changes in the distribution of traffic as well. Methodology This evaluation used local agency transportation plans to identify intersections that are currently operating near, at, or worse than a jurisdiction s LOS threshold. LOS describes traffic operations service quality and ranges from A (best) to F (worst). A LOS of D was chosen to identify intersections that are currently congested. Intersections that are currently congested (i.e. LOS D or worse) and would likely have additional project related traffic travel through it are identified. Project related traffic is defined as: Vehicles to or from a proposed station (with a park and ride), or Traffic re circulation caused by a project related restriction of current acceptable traffic movements. Roadway access changes due to an alternative could restrict access at existing un signalized intersections and mid block U turns and/or left turn lanes. To evaluate these potential effects, traffic occurring at these locations was re circulated to identify congested intersections that would likely see an increase in traffic. Table 5 20 documents the number of congested intersections that would experience a noticeable increase in traffic due to station related traffic and/or traffic re circulated because of roadway access changes caused by the alignment. The locations of these congested intersections are indicated in Exhibit Federal Way Transit Extension 5-51 Level 2 Alternatives Screening Report


130 5.0 Data Results EXHIBIT 5-14 Potential Intersection Effects - Level of Service Federal Way Transit Extension 5-52 Level 2 Alternatives Screening Report
131 5.0 Data Results TABLE 5-20 Number of Congested Intersections Affected Alternative SR 99 Alternatives Number of Congested Intersections with Potential Traffic Effects Total Number of Total: Alignments and Station Signalized Intersections Alignments Station Areas Areas SR 99 Elevated Median th Avenue. S. Elevated West Side (w/sr 99 Elevated Median) SR 99 Hybrid I-5 Alternatives I-5 Mixed West Side I-5 Mixed West Side/Median Discussion of Results The I 5 alternatives are not expected to create any turn restrictions that would cause additional traffic to re circulate and impact congested intersections along the alignment. There are 11 intersections at possible I 5 station areas that are at or worse than LOS D that could see an increase in traffic. Five intersections are near the Kent Des Moines interchange with I 5, one is at Star Lake Park and Ride, and five of these are near the FWTC. The most substantial alignment related traffic impacts occur with the alternatives that have a median alignment. With the SR 99 Elevated Median alternative up to 8 intersections would see a noticeable increase in volume due to turn restrictions caused by the alignment. Six congested intersections are within the station areas for a total of 14 congested intersections that would potentially have project related traffic through them. In contrast, the SR 99 Hybrid Alternative would only have two congested intersections impacted by re circulating traffic caused by the alignment along with nine station area congested intersections, for a total of 11 congested intersections that would potentially have project related traffic through them. This is because there are substantial sections of the SR 99 Hybrid Alternative that are side aligned and not in the SR 99 median. The I 5 Alternatives have a total of 11 congested intersections within the station areas and no congested intersections that are affected by the alignment. Key Results The SR 99 Elevated Median alternative is expected to have the greatest traffic effects at congested intersections because this alternative has the highest business traffic recirculation effect. The SR 99 Hybrid alternative would have the fewest congested intersections. Federal Way Transit Extension 5-53 Level 2 Alternatives Screening Report
132 5.0 Data Results The I 5 alternatives would not restrict any traffic movements and have the fewest number of congested intersections that would have potential traffic effects Construction Effects Identifying the potential effects on traffic and the subsequent effect this has on businesses and residents due to construction activities of the project alternatives is an important aspect to understand with the FWTE project. Construction impacts for the Level 2 screening are estimated based on a high level understanding of the design and construction requirements of the Level 2 alternatives. Methodology A qualitative assessment of potential construction related effects was performed based on a high level understanding of how the alternatives might be constructed. This assessment was based on the need for lane closures during the major construction period(s) required for those closures. Table 5 21 summarizes the anticipated construction effects on traffic. The potential effects of these construction activities on the local communities, including residents and businesses, are discussed qualitatively. TABLE 5-21 Summary of Construction Effects Alternative SR 99 Alternatives SR 99 Elevated Median 30 th Avenue. S. Elevated West Side (w/sr 99 Elevated Median) SR 99 Hybrid I-5 Alternatives I-5 Mixed West Side I-5 Mixed West Side/Median Summary of Construction Effects Highest Effect Likely up to two lane closures on SR 99 during the construction period. High Effect - Likely up to two lane closures on SR 99 during the construction period. 30 th Avenue South would likely be restricted to local access only. Medium Effect Could require closure of the outside lanes on SR 99 during construction activities which would impact the operations of the BAT lane. When alignment in median up to two SR 99 lane closures during the civil construction period. Lowest Effect Would likely avoid I-5 mainline impacts but would require some closures of the southbound on- and off-ramps. High Effect - Likely requires the closure of the I-5 HOV lanes during the construction period as well as at least some southbound I-5 lanes during any crossing related construction work. Discussion of Results The median options on both the SR 99 and I 5 alternatives would likely have the greatest impact to traffic operations during construction activities. On I 5, the median alternative would likely require full lane closures of the northbound and southbound HOV lanes on I 5 due to the proximity of construction activities to the travel lanes and the higher operating speed on I 5. To Federal Way Transit Extension 5-54 Level 2 Alternatives Screening Report
133 5.0 Data Results cross I 5, at least some of the southbound I 5 lanes would be closed when there is active construction work being done on the elevated structure. Closures would be timed to minimize effects on traffic; however some traffic effects could still occur. On SR 99, while construction is active in the median, it would likely require the closure of two lanes of the roadway to provide adequate separation between the construction activities and adjacent vehicle travel. Construction of elevated median stations would likely require additional lane closures. The construction activities could possibly be staggered between the construction staging areas but this would need further review. With the SR 99 Hybrid alternative, there are substantial portions that are side aligned and therefore would likely require closure of up to one lane of traffic. This could temporarily affect the business access transit (BAT) lane, affecting business access and transit reliability. Portions of the SR 99 Hybrid alternative that are in the median would have similar construction effects to traffic as the SR 99 Median Alternative. The 30 th Avenue S. alternative would avoid construction across the congested SR 99 and Kent Des Moines Road intersection, reducing the potential for effects on traffic at this intersection during construction. The I 5 Mixed West Side alternative would likely have some effects at or near the I 5 southbound on and off ramps but would not likely affect any I 5 mainline operations. As such, this alternative has the lowest construction related traffic impacts of all alternatives because it would have the least potential for lane closures and would have the least community disruption. Construction impacts would mostly be noticed by residential properties that are adjacent to I 5, and the construction area would be behind back yards and could be buffered by existing stands of large trees. Potential construction effects to these residences include noise, dust, and visual effects. Based on the traffic effects described above, the SR 99 Elevated Median and 30 th Avenue S. Elevated West Side alternatives would have the most disruption to the community in terms of general mobility, as lane reductions on SR 99 would reduce traffic capacity and potentially result in delays along the corridor. The 30 th Avenue S. Elevated West Side alternative would also be the only alternative to pass directly through a residential neighborhood, and this neighborhood has high concentrations of minority and low income populations. Potential construction effects to these residences include access, noise, dust, and visual effects. Where the SR 99 Hybrid alternative would be side running, it would have greater impacts on businesses and residents on that side of the road, although access would be maintained through the construction area to the extent possible. Driveways may need to be consolidated during construction but signage regarding business access would be provided. Effects on overall mobility during construction of the SR 99 Hybrid are expected to be less than the SR 99 Elevated Median alternative, which would close two travel lanes during construction. Federal Way Transit Extension 5-55 Level 2 Alternatives Screening Report
134 5.0 Data Results Key Results The SR 99 Elevated Median alternative would require closure of up to two lanes of traffic along SR 99 during construction and would have the greatest construction effect on mobility within the community. The SR 99 Hybrid alternative would have less effect on traffic than the SR 99 Elevated Median alternative, but would have more effect on adjacent businesses and residents on the side of the road where it is being constructed. The 30 th Ave S. alternative would construct a portion of the alternative in a residential neighborhood that has a high proportion of minority and low income residents. The I 5 Mixed West Side/Median alternative would likely require closure of the HOV lanes on I 5 during construction activities and would require at least some I 5 southbound lane closures during the elevated construction across those southbound lanes. The I 5 Mixed West Side alternative would likely have the lowest impact with ramp closures for short durations, as it would likely avoid impacts to the I 5 mainline, but could have effects on adjacent residences during construction. 5.7 Design Considerations Utilities Methodology Existing utility location information was obtained from publicly available Geographic Information System (GIS) data for the Cities of SeaTac, Des Moines, Kent, and Federal Way and from as built information or system maps provided by utility owners. This information was used to perform a high level evaluation of existing utilities, including water, sanitary sewer, electrical transmission/distribution, telecommunications, natural gas, and stormwater. Most providers have their own standards for utility construction, which tends to increase complexity when the same type of utility is affected in multiple jurisdictions. A more detailed evaluation of utility relocation requirements will be conducted as part of the EIS process after the engineering design process has advanced. Discussion of Results In general, roadway replacement and/or roadway widening is expected to require replacement in kind of affected utilities. Direct conflict between the proposed LRT guideway and utilities is similarly expected to require replacement. Damage to existing infrastructure during construction is likely to require additional replacement. Federal Way Transit Extension 5-56 Level 2 Alternatives Screening Report
135 5.0 Data Results Existing utility systems in the study area and their associated agencies are identified in Table 5 22 below: TABLE 5-22 Summary of Utility Providers Utility Discipline City of SeaTac City of Des Moines City of Kent City of Federal Way Highline Water District Midway Sewer District Lakehaven Utility District Puget Sound Energy Comcast CenturyLink Level 3 Communications Seattle Public Utilities Water Sanitary Sewer Electrical Communications Natural Gas Stormwater Solid Waste Only those water systems with mains 12 inches or greater in diameter were evaluated. Highline Water District has numerous storage tanks adjacent to the western edge of the I 5 right of way north of S. 216 th Street. Table 5 23 provides a summary of the existing water facilities that parallel or cross SR 99 or I 5 within the study area. Table 5 24 provides a summary of the existing sewer facilities that parallel or cross SR 99 or I 5 within the study area. There are no sewer pump stations or treatment plants within the study area. Federal Way Transit Extension 5-57 Level 2 Alternatives Screening Report
136 5.0 Data Results TABLE 5-23 Summary of Existing Water Utilities Alternative SR 99 Elevated Median SR 99 Hybrid I-5 Mixed West Side I-5 Mixed West Side/Median 30 th Avenue S. Elevated West Side Existing Water Facilities 16-inch water main along 28 th Avenue S. from Angle Lake Station to SR 99. Water mains along both sides of SR 99 from S. 200 th Street to S. 279 th Street. Generally, the 16-inch water main is on the east side of SR 99 and the 8-inch and 12-inch mains are on the west side. 12-inch water main on the east side of SR 99 from S. 288 th Street to S. 308 th Street. Dual 12-inch water mains, one on each side of SR 99, from S. 308 th Street to S. 320 th Street. 10-inch to 18-inch water mains perpendicular to the alignment at arterial intersections from S. 200 th Street to S. 320 th Street (8 total). 16-inch water main along 28th Avenue S. from Angle Lake Station to SR inch to 12-inch water mains along the streets crossed from S. 204 th Street to I inch water main along I-5 from S. 208 th Street to near S. 216 th Street. Multiple water tanks (Highline Water District) on the west side of I-5 north of S. 216 th Street. 6-inch to 18-inch water mains perpendicular to the alignment along I-5 from S. 216 th Street to S. 317 th Street. (12 total) 12-inch water main along the east side of 30th Avenue S. from S. 216th Street to S. 240th Street. TABLE 5-24 Summary of Existing Sewer Utilities Alternative SR 99 Elevated Median SR 99 Hybrid I-5 Mixed West Side I-5 Mixed West Side/Median Existing Sewer Facilities 8-inch sewer along 28 th Avenue S. from Angle Lake Station to SR 99. The west side of SR 99 has an 8-inch sewer from S. 208 th Street to S. 216 th Street. The east side of SR 99 has a 10-inch sewer from S. 208 th Street to S. 211 th Street, and an 8- inch sewer from S. 211 th Street to S. 216 th Street. Intermittent 8-inch to 12-inch sewers on the east side of SR 99 from S. 216 th Street to S. 320 th Street. 8-inch to 14-inch sewer on the west side of SR 99 from S. 260 th Street to S. 272 nd Street. 8-inch sewer along 28 th Avenue S. from Angle Lake Station to SR 99. Various crossings, ranging from 8-inch to 18-inch along the alignment from S. 204 th Street to S. 217 th Street. 30 th Avenue S. Elevated West Side 8-inch sewer on the west side of 30 th Avenue S. from S. 224 th Street to S. 240 th Street. Sound Transit requires a minimum clearance be maintained between its Overhead Catenary System (OCS) wires and any power lines. The electrical transmission facilities within the study area are primarily overhead lines, and are typically 115kV; these would need to be raised or relocated where they would not meet OCS separation standards with the proposed LRT guideway. The electrical distribution system is typically underground along SR 99 and overhead along surrounding streets. Except for a few crossings, there is no electrical transmission or distribution along the I 5 right of way. PSE s Midway Switch Station and Freeway Substation are co located along I 5 south of S. 221 st Street, and PSE has indicated that the steel lattice towers on either side of I 5 near S. 224 th Street that serve these facilities would need to be replaced, Federal Way Transit Extension 5-58 Level 2 Alternatives Screening Report
137 5.0 Data Results given their age and structure type, to accommodate a line raise/relocation. Table 5 25 provides a summary of the existing electrical facilities that parallel or cross SR 99 or I 5 within the study area. TABLE 5-25 Summary of Existing Electrical Transmission and Distribution Facilities Alternative SR 99 Elevated Median SR 99 Hybrid I-5 Mixed West Side I-5 Mixed West Side/Median 30 th Avenue S. Elevated West Side Existing Electrical Transmission and Distribution Facilities 115kV on the east side of 28 th Avenue S. from Angle Lake Station to SR kV on the west side of SR99 from S. 204 th Street to S. 212 th Street. 115kV on the east side of SR 99 from S. 212 th Street to S. 220 th Street. 115kV on the west side of SR 99 from S. 240 th Street to S. 288 th Street. 115kV on the east side of SR 99 from S. 300 th Street to S. 320 th Street. PSE substation on the east side of SR 99 at approximately S. 290 th Street. PSE substation on the east side of SR 99 at S. 316 th Street. 115kV on the east side of 28 th Avenue S. from Angle Lake Station to SR 99. PSE substation at S. 221 st Street. Transmission lines cross I-5 at S. 216 th Street, the PSE substation, and S. 288 th Street. Distribution lines cross I-5 at S. 221 st Street, S. 259 th Court, S. 272 nd Street, S. 304 th Street, and Military Road S. 115kV on the east side of 30 th Avenue S. Distribution on the west side of 30 th Avenue S, except where it is on the east side of 30 th Avenue S as it crosses Kent-Des Moines Road. PSE substation at S. 221 st Street. The two primary telecommunications providers with major utility infrastructure in the study area are Comcast and CenturyLink. Their systems generally follow the electrical distribution network, buried along SR 99 and overhead on surrounding streets. There are no major telecommunications facilities parallel to I 5. A fiber optic system owned by Level 3 Communications follows Military Road S. through the study area and crosses I 5 at each Military Road S. undercrossing. Puget Sound Energy is the natural gas provider within the study area. Most of the infrastructure encountered is local distribution consisting of 2 inch, 4 inch and 6 inch diameter intermediatepressure pipelines. A 16 inch diameter high pressure pipeline parallels the alignments along 28th Avenue S., and then follows SR 99 to S. 208 th Street where it turns west; all alternatives have the potential to conflict with this pipeline segment as they depart Angle Lake Station. The 16 inch pipeline is encountered again at S. 272 nd Street, where it crosses the SR 99 and I 5 alternatives. A branch of the 16 inch pipeline crosses the I 5 alignments once more at the southernmost crossing of Military Road S. Only existing stormwater conveyance open channels and closed pipes that are 12 inches in diameter or greater and that parallel or cross SR 99 or I 5 within the study area were evaluated. Existing flow control and treatment facilities located along or downstream of the alternative routes were also located. Table 5 26 provides a summary of the existing stormwater facilities. Federal Way Transit Extension 5-59 Level 2 Alternatives Screening Report
138 5.0 Data Results TABLE 5-26 Summary of Existing Stormwater Facilities Alternative Existing Stormwater Facilities Approximately 71,300 feet of 12- to 24-inch-diameter conveyance pipe Approximately 2,300 feet of 30- to 36-inch-diameter conveyance pipe Approximately 1,000 feet of greater than 36-inch-diameter conveyance pipe SR 99 Elevated Median SR 99 Hybrid Publicly-owned 48-inch-diamter box culvert on the west side of SR 99, approximately 600 feet northwest of the intersection with S. 208 th Street. Approximately 4,300 feet of open channel conveyance 7 flow control facilities 4 water quality treatment facilities Approximately 29,000 feet of 12- to 24-inch-diameter conveyance pipe Approximately 690 feet of 30- to 36-inch-diameter conveyance pipe Approximately 1,600 feet of greater than 36-inch-diameter conveyance pipe I-5 Mixed West Side Privately-owned 42-inch-diamter pipe crossing I-5, approximately 1,000 feet north of the S. 288th Street underpass I-5 Mixed West Side/Median Approximately 36,300 feet of open channel conveyance 4 flow control facilities Privately-owned 84-inch-diamter detention pipe on the west side of I-5, approximately 1,000 feet north of the S. 288th St. underpass 3 water quality treatment facilities Approximately 62,400 feet of publically owned 12- to 24-inch-diameter conveyance pipe Approximately 1,200 feet of privately owned 12- to 24-inch-diameter conveyance pipe 30 th Approximately 2,300 feet of publically owned 30- to 36-inch-diameter conveyance pipe Avenue S. Elevated Publicly-owned 48-inch-diamter box culvert on the west side of SR 99, approximately 600 West Side (connected to the feet northwest of the intersection with S. 208 th Street. SR 99 Elevated Median Approximately 970 feet of publically owned conveyance pipe greater than 36-inch-diameter alternative) Approximately 5,000 feet of open channel conveyance 7 flow control facilities 4 water quality treatment facilities No information on existing stormwater management facilities was available for the section of I 5 north of S. 224 th Street Midway Landfill is a closed municipal solid waste facility maintained by Seattle Public Utilities, located west of I 5 between S. 244 th and S. 252 nd Streets (see Section for additional information). The potential presence of hazardous materials at the facility led to its designation as a Superfund site (see Section for additional information). A summary of the existing major utilities encountered along the SR 99 and I 5 corridors is listed in Table Federal Way Transit Extension 5-60 Level 2 Alternatives Screening Report
139 5.0 Data Results TABLE 5-27 Summary of Existing Major Utilities Utility Type SR 99 I-5 Water 16-inch, 18-inch, and 60-inch pipes 16-inch, 30-inch and 60-inch pipes Highline Water District Tanks at S. 216 th Street Sanitary Sewer 36-inch pipe (None) Electrical 115kV transmission parallel and crossing 115kV transmission crossing 230kV transmission crossing Substation adjacent Stormwater 36-inch and 42-inch pipes 48-inch box culvert (None) Solid Waste (None) Midway Landfill Key Results Utility work may cause service interruptions, requiring coordination with agencies, jurisdictions and affected neighborhoods to minimize disruptions. Utility construction work in SR 99 may affect traffic flow, potentially requiring lane closures and/or detours. Such conflicts are not likely to be substantial for I 5 alternatives. High voltage electrical transmission facilities along the length of corridor, both parallel and crossing, will require line raising and/or relocation. These facilities affect the SR 99 alternatives more than they affect the I 5 alternatives. Highline Water District storage tanks and the Midway Landfill affect the LRT guideway for I 5 alternatives Hazardous Materials The presence of contaminated sites in the project area can affect a project in multiple ways. Investigation may be required to determine the potential construction cost impacts of the contaminated site. Contaminated sites can also result in reduced property acquisition cost to account for the cost of mitigation during construction. Contaminated properties that are acquired could require remediation in order to serve their intended purpose on the project (such as a station, maintenance facility, etc.). Engineering controls (such as vapor intrusion mitigation) could also be required. Methodology Information on sites reported to be contaminated with hazardous materials within 1/8 mile of the alternative centerline was collected using a database research company and evaluated to determine which ones should be considered high risk for purposes of the project. High risk sites Federal Way Transit Extension 5-61 Level 2 Alternatives Screening Report
140 5.0 Data Results are defined as sites that might be substantially contaminated and might create liability for Sound Transit either due to construction activities or by virtue of acquiring all or a portion of the site, such as for a station or parking facility. The 1/8 mile distance was used to identify sites that could be directly within the project footprint or could have contaminated groundwater that has spread within the project footprint. Discussion of Results Table 5 28 shows total high risk sites by alternative. Exhibit 5 15 maps the locations of the identified high risk hazardous material sites. The SR 99 alternatives have the greatest number of high risk sites, with a total of 68, which is roughly ten times the numbers of sites along the I 5 alternatives. This is not unusual, however, given the commercial oriented nature of the SR 99 corridor and the large number of gas stations and auto repair oriented businesses along this corridor. The Midway Landfill, located between SR 99 and I 5, is not considered a high risk hazardous materials site, but has been designated as a Superfund site. The landfill was first capped in 1983 following its closure. Beginning in 1985, combustible gas was detected in nearby houses. The site has since been cleaned up by the City of Seattle with oversight from Washington Department of Ecology. The landfill remains capped and there are numerous wells in place to collect gases from below the cap. If an I 5 alignment is chosen, these documented issues will require extensive permitting work and carefully planned waste disposal procedures and construction techniques to prevent potential groundwater contamination during construction. TABLE 5-28 Total High Risk Sites within 1/8 Mile by Alternative Alternative High Risk Sites within 1/8 Mile SR 99 Alternatives SR 99 Elevated Median th Avenue. S. Elevated West Side (w/sr 99 Elevated Median) 68 SR 99 Hybrid 68 I-5 Alternatives I-5 Mixed West Side 6 I-5 Mixed West Side/Median 7 Key Results Alternatives along SR 99 have more high risk sites than alternatives along I 5. The closed Midway Landfill, managed by SPU, could have similar permitting and disposal issues to a high risk hazardous materials site if an I 5 alternative is chosen. Federal Way Transit Extension 5-62 Level 2 Alternatives Screening Report

141 5.0 Data Results EXHIBIT 5-15 Hazardous Materials Sites Federal Way Transit Extension 5-63 Level 2 Alternatives Screening Report
142 5.0 Data Results Geologic Issues The Washington State Growth Management Act (GMA) (Revised Code of Washington Chapter 36.70A) requires all cities and counties to identify critical areas within their jurisdictions and to formulate development regulations for their protection. The GMA defines critical areas, including geologically hazardous areas, as areas that are susceptible to erosion, sliding, earthquake, or other geological events; therefore, they are not suited to the siting of commercial, residential, or industrial development consistent with public health or safety concerns. Methodology The FWTE passes through four cities (SeaTac, Des Moines, Kent, and Federal Way) and parts of unincorporated King County, all of which have defined geologically hazardous areas in their respective codes. These definitions and maps were reviewed to evaluate geologic hazards. Mapped geologic hazards are shown on Exhibit Erosion hazard areas are not shown, although most of the project area would be subject to erosion during construction without the use of best management practices (BMPs). Discussion of Results Erosion and steep slope hazards are present throughout the study area. The Midway Landfill is a 60 acre former gravel quarry that was used as an unlined landfill from 1966 to 1983, ultimately taking approximately 3,000,000 cubic yards of waste, including demolition debris and municipal waste. The I 5 Mixed West Side alternative would cross the eastern edge of the Midway Landfill and the mitigation and construction challenges associated with this crossing could be a primary factor in the alternative selection. These challenges include increased effort for design and permitting as well as increased construction costs due to the undocumented (but likely contaminated) character of the landfill debris present. There is a large area of wetland soils (identified as a seismic and settlement hazard area) bounded by S. 260 th Street to the north, SR 99 to the west, S. 272 nd Street to the south, and I 5 to the east. The selection of the location for the station at S. 272 nd Street could be influenced by the presence of seismic and settlement hazards. Decisions on preferred foundation types would be affected by the presence of these hazards, as could the performance of surface parking facilities. Federal Way Transit Extension 5-64 Level 2 Alternatives Screening Report

143 5.0 Data Results EXHIBIT 5-16 Geologic Hazards Federal Way Transit Extension 5-65 Level 2 Alternatives Screening Report
Federal Way Link Extension
 Federal Way Link Extension Draft EIS Summary Route & station alternatives and impacts Link Light Rail System Map Lynnwood Mountlake Terrace Lynnwood Link Extension Shoreline 14th Northgate 40 Northgate
Note: The October 2007 version of this report has been updated in this December 2008 report to present costs in year 2007 dollars.
 Sound Transit Phase 2 South Corridor LRT Design Report: SR 99 and I-5 Alignment Scenarios (S 200 th Street to Tacoma Dome Station) Tacoma Link Extension to West Tacoma Prepared for: Sound Transit Prepared
7 COMPARATIVE EVALUATION OF ALTERNATIVES
 7 COMPARATIVE EVALUATION OF ALTERNATIVES 7.1 INTRODUCTION This chapter presents the comparative analysis of the four Level 2 build alternatives along with a discussion of the relative performance of the
Executive Summary. Draft Environmental Impact Statement/Environmental Impact Report ES-1
 Executive Summary Introduction The Eastside Transit Corridor Phase 2 Project is a vital public transit infrastructure investment that would provide a transit connection to the existing Metro Gold Line
Executive Summary. Treasure Valley High Capacity Transit Study Priority Corridor Phase 1 Alternatives Analysis October 13, 2009.
 Treasure Valley High Capacity Transit Study Priority Corridor Phase 1 Alternatives Analysis October 13, 2009 Background As the Treasure Valley continues to grow, high-quality transportation connections
FINAL. Sound Transit Long-Range Plan Update. Issue Paper S.1: Tacoma Link Integration with Central Link. Prepared for: Sound Transit
 Sound Transit Long-Range Plan Update Issue Paper S.1: Tacoma Link Integration with Central Link Prepared for: Sound Transit Prepared by: Quade & Douglas, Inc. FINAL March 2005 Foreword This issue paper
Sound Transit East Link: Bus/LRT System Integration Study
 Sound Transit East Link: Bus/LRT System Integration Study Prepared For: Sound Transit King County Metro Mercer Island WSDOT Prepared By: CH2M HILL July, 2014 1 SOUND TRANSIT EAST LINK: BUS/LRT SYSTEMES
1.0 Purpose and Need for Federal Way Link Extension
 1.0 Purpose and Need for Federal Way Link Extension The Central Puget Sound Regional Transit Authority (Sound Transit) is proposing the Federal Way Link Extension (FWLE) to expand the regional light rail
Restoration of Historic Streetcar Services in Downtown Los Angeles
 Restoration of Historic Streetcar Services in Downtown Los Angeles Alternatives Analysis Community Update Meeting August 2, 2011 Introduction Key players Local lead agency: Metro Federal lead agency: Federal
3.0 Transportation Environment and Consequences
 3.0 Transportation Environment and Consequences 3.1 Summary This chapter describes the characteristics of the transportation system in the FWLE vicinity and discusses potential impacts and mitigation measures
Pacific Electric Right-of-Way / West Santa Ana Branch Corridor Alternatives Analysis
 Pacific Electric Right-of-Way / West Santa Ana Branch Corridor Alternatives Analysis Transit Coalition September 26, 2012 2 Study Area Pacific Electric Rightof-Way/West Santa Ana Branch (PEROW/ WSAB) extends
Energy Technical Memorandum
 Southeast Extension Project Lincoln Station to RidgeGate Parkway Prepared for: Federal Transit Administration Prepared by: Denver Regional Transportation District May 2014 Table of Contents Page No. Chapter
Restoration of Historic Streetcar Services in Downtown Los Angeles
 Restoration of Historic Streetcar Services in Downtown Los Angeles Early Scoping Meeting for Alternatives Analysis (AA) May 17, 2011 Introduction Key players Local lead agency: Metro Federal lead agency:
Attachment D Environmental Justice and Outreach
 Attachment D Environmental Justice and Outreach ATTACHMENT D Environmental Justice and Outreach Indicate whether the project will have disproportionately high and adverse impacts on minority or low income
Bi-County Transitway/ Bethesda Station Access Demand Analysis
 Bi-County Transitway/ Bethesda Station Access Demand Analysis Prepared for: Washington Metropolitan Area Transit Authority Office of Planning and Project Development May 2005 Prepared by: in conjunction
Northeast Corridor Alternatives Analysis. Public Involvement Round 2 Input on Alternatives for Further Study
 Northeast Corridor Alternatives Analysis Public Involvement Round 2 Input on Alternatives for Further Study Feb. 7-9, 2012 Agenda Review project background Progress summary Recommended alternatives for
HIGH CAPACITY TRANSIT CORRIDOR STUDY UTILITIES TRANSPORTATION ECOSYSTEMS DEMOGRAPHICS TECHNICAL MEMORANDUM 12/20/2013 7/17/2014 DRAFT
 HIGH CAPACITY TRANSIT CORRIDOR STUDY FEDERAL WAY TO TACOMA REPORT LEVEL 2 OPTIONS EVALUATION 12/20/2013 7/17/2014 DRAFT CULTURAL, VISUAL UTILITIES TRANSPORTATION PROPERTY PARKS NOISE LAND HAZARDOUS ECOSYSTEMS
4.0 TIER 2 ALTERNATIVES
 4.0 TIER 2 ALTERNATIVES The Tier 2 Alternatives represent the highest performing Tier 1 Alternatives. The purpose of the Tier 2 Screening was to identify the LPA utilizing a more robust list of evaluation
METRO Orange Line BRT American Boulevard Station Options
 METRO Orange Line BRT American Boulevard Station Options Bloomington City Council Work Session November 18, 2013 Christina Morrison BRT/Small Starts Project Office Coordinating Planning and Design AMERICAN
US 29 Bus Rapid Transit Planning Board Briefing. February 16, 2017
 US 29 Bus Rapid Transit Planning Board Briefing February 16, 2017 Project Goals Improve the quality of transit service Improve mobility opportunities and choices Enhance quality of life Support master
6/6/2018. June 7, Item #1 CITIZENS PARTICIPATION
 June 7, 2018 Item #1 CITIZENS PARTICIPATION 1 Item #2 APPROVAL OF MINUTES Item #3 TRAC GOALS, FRAMEWORK & AGENDA REVIEW 2 COMMITTEE GOALS Learn about Southern Nevada s mobility challenges, new developments
FREQUENTLY ASKED QUESTIONS
 FREQUENTLY ASKED QUESTIONS 2018 What is the More MARTA Atlanta program? The More MARTA Atlanta program is a collaborative partnership between MARTA and the City of Atlanta to develop and implement a program
3.1 Introduction Transportation Elements and Study Area Meeting the Need for the Project
 Chapter 3 Transportation Environment and Consequences 3. Introduction This chapter summarizes the characteristics of the transportation system in the East Link Project vicinity and discusses potential
Midtown Corridor Alternatives Analysis. Policy Advisory Committee Meeting February 12, 2014
 Midtown Corridor Alternatives Analysis Policy Advisory Committee Meeting February 12, 2014 Today s Agenda Introductions Outreach efforts and survey results Other updates since last meeting Evaluation results
US 81 Bypass of Chickasha Environmental Assessment Public Meeting
 US 81 Bypass of Chickasha Environmental Assessment Public Meeting March 14, 2013 Introductions ODOT FHWA SAIC Meeting Purpose Present need for bypass Provide responses to 10/04/11 public meeting comments
Tempe Streetcar. March 2, 2016
 Tempe Streetcar March 2, 2016 Tempe Profile 40 sq. miles, highest density in state University Town, center of region Imposed growth boundaries (density increase) Mixed use growth/intensifying land use
Public Meeting. March 21, 2013 Mimosa Elementary School
 Public Meeting March 21, 2013 Mimosa Elementary School Today s Meeting Purpose 2 Where We Are The Process What We ve Heard and Findings Transit Technologies Station Types Break-out Session Where We Are
Alternatives Analysis Findings Report
 6.0 This chapter presents estimates of the potential capital, operations and maintenance costs associated with the alternatives carried forward for detailed evaluation. The methodology used to develop
Attachment E3 Vibration Technical Memorandum
 Attachment E3 Technical Memorandum 77 South Bedford Street Burlington, MA 01803 T 781.229.0707 F 781.229.7939 E jross@hmmh.com W www.hmmh.com TECHNICAL MEMORANDUM To: Alisa Swank, CH2M HILL Jodi Ketelsen,
CEDAR AVENUE TRANSITWAY Implementation Plan Update
 CEDAR AVENUE TRANSITWAY Implementation Plan Update EECUTIVE SUMMARY DECEMBER 2015 Executive Summary In 2013, the Twin Cities metropolitan area s first bus rapid transit (BRT) line, the METRO Red Line,
Alpine Highway to North County Boulevard Connector Study
 Alpine Highway to North County Boulevard Connector Study prepared by Avenue Consultants March 16, 2017 North County Boulevard Connector Study March 16, 2017 Table of Contents 1 Summary of Findings... 1
Parking Management Element
 Parking Management Element The State Transportation Planning Rule, adopted in 1991, requires that the Metropolitan Planning Organization (MPO) area implement, through its member jurisdictions, a parking
I-20 EAST TRANSIT INITIATIVE Tier 1 and Tier 2 Alternatives Screening Report EXECUTIVE SUMMARY
 EXECUTIVE SUMMARY The purpose of this report is to document the results of the Tier 1 and Tier 2 Screening of alternatives for the I-20 East Transit Initiative. The two-tier screening process presented
EUGENE-SPRINGFIELD, OREGON EAST WEST PILOT BRT LANE TRANSIT DISTRICT
 EUGENE-SPRINGFIELD, OREGON EAST WEST PILOT BRT LANE TRANSIT DISTRICT (BRIEF) Table of Contents EUGENE-SPRINGFIELD, OREGON (USA)... 1 COUNTY CONTEXT AND SYSTEM DESCRIPTION... 1 SYSTEM OVERVIEW... 1 PLANNING
West Broadway Transit Study. Community Advisory Committee September 17, 2015
 West Broadway Transit Study Community Advisory Committee September 17, 2015 Introductions Community Engagement Summer Outreach Fall Outreach Technical Analysis Process Update Alternatives Review Economic
Community Advisory Committee. October 5, 2015
 Community Advisory Committee October 5, 2015 1 Today s Topics Hennepin County Community Works Update Project Ridership Estimates Technical Issue #4:Golden Valley Rd and Plymouth Ave Stations Technical
Kendall Drive Premium Transit PD&E Study Project Kick-Off Meeting SR 94/Kendall Drive/SW 88 Street Project Development and Environment (PD&E) Study
 Study") Florida Department of Transportation District Six Kendall Drive Premium Transit PD&E Study Project Kick-Off Meeting SR 94/Kendall Drive/SW 88 Street Project Development and Environment (PD&E) Study What
Florida Department of Transportation District Six Kendall Drive Premium Transit PD&E Study Project Kick-Off Meeting SR 94/Kendall Drive/SW 88 Street Project Development and Environment (PD&E) Study What
RTID Travel Demand Modeling: Assumptions and Method of Analysis
 RTID Travel Demand Modeling: Assumptions and Method of Analysis Overall Model and Scenario Assumptions The Puget Sound Regional Council s (PSRC) regional travel demand model was used to forecast travel
6.1 Performance in Meeting Project Goals and Objectives
 Chapter 6 Alternatives Evaluation This chapter evaluates how East Link would meet the project Purpose and Need, and analyzes the benefits, environmental impacts, and cost-effectiveness of the project as
EAST LINK PROJECT. Environmental Scoping Information Report. Seattle to Bellevue to Redmond. September 2006
 SCOPING EAST LINK PROJECT Environmental Scoping Information Report Seattle to Bellevue to Redmond September 2006 CENTRAL PUGET SOUND REGIONAL TRANSIT AUTHORITY TABLE OF CONTENTS Introduction... 2 What
Waco Rapid Transit Corridor (RTC) Feasibility Study
 Feasibility Study") Waco Rapid Transit Corridor (RTC) Feasibility Study Chris Evilia, Director of Waco Metropolitan Planning Organization Allen Hunter, General Manager Waco Transit System Jimi Mitchell, Project Manager AECOM
Waco Rapid Transit Corridor (RTC) Feasibility Study Chris Evilia, Director of Waco Metropolitan Planning Organization Allen Hunter, General Manager Waco Transit System Jimi Mitchell, Project Manager AECOM
King County Metro. Columbia Street Transit Priority Improvements Alternative Analysis. Downtown Southend Transit Study. May 2014.
 King County Metro Columbia Street Transit Priority Improvements Alternative Analysis Downtown Southend Transit Study May 2014 Parametrix Table of Contents Introduction... 1 Methodology... 1 Study Area...
Preliminary Definition of Alternatives. 3.0 Preliminary Definition of Alternatives
 3.0 What preliminary alternatives are being evaluated? The alternatives for the East San Fernando Valley Transit Corridor project that were considered for screening include the No Build Alternative, Transportation
Subarea Study. Manning Avenue (CSAH 15) Corridor Management and Safety Improvement Project. Final Version 1. Washington County.
 Corridor Management and Safety Improvement Project. Final Version 1. Washington County.") Subarea Study Manning Avenue (CSAH 15) Corridor Management and Safety Improvement Project Final Version 1 Washington County June 12, 214 SRF No. 138141 Table of Contents Introduction... 1 Forecast Methodology
Subarea Study Manning Avenue (CSAH 15) Corridor Management and Safety Improvement Project Final Version 1 Washington County June 12, 214 SRF No. 138141 Table of Contents Introduction... 1 Forecast Methodology
LOS ANGELES COUNTY METROPOLITAN TRANSPORTATION AUTHORITY (LACMTA) AND FEDERAL TRANSIT ADMINISTRATION (FTA)
 AND FEDERAL TRANSIT ADMINISTRATION (FTA)") LOS ANGELES COUNTY METROPOLITAN TRANSPORTATION AUTHORITY (LACMTA) AND FEDERAL TRANSIT ADMINISTRATION (FTA) NOTICE OF PREPARATION (NOP)/NOTICE OF INTENT (NOI) OF AN ENVIRONMENTAL IMPACT STATEMENT (EIS)/ENVIRONMENTAL
LOS ANGELES COUNTY METROPOLITAN TRANSPORTATION AUTHORITY (LACMTA) AND FEDERAL TRANSIT ADMINISTRATION (FTA) NOTICE OF PREPARATION (NOP)/NOTICE OF INTENT (NOI) OF AN ENVIRONMENTAL IMPACT STATEMENT (EIS)/ENVIRONMENTAL
5 EVALUATION OF ALTERNATIVES
 5 EVALUATION OF ALTERNATIVES This chapter begins by evaluating how well the Lynnwood Link Extension alternatives meet the project s Purpose and Need Statement. It then compares the environmental and transportation
5. OPPORTUNITIES AND NEXT STEPS
 5. OPPORTUNITIES AND NEXT STEPS When the METRO Green Line LRT begins operating in mid-2014, a strong emphasis will be placed on providing frequent connecting bus service with Green Line trains. Bus hours
Crenshaw-Prairie Transit Corridor Study Public Meetings
 Crenshaw-Prairie Transit Corridor Study Public Meetings Darby Park: Wednesday, February 20, 2008 6:30 8:00 PM US Bank Community Room: Thursday, February 21, 2008 6:30 8:00 PM Nate Holden Performing Arts
Green Line Long-Term Investments
 Enhancements Short-term improvements to keep Austin moving. Investments Long-term projects to support our future. Mobility Hubs MetroRapid MetroRail MetroExpress Connectors Circulators Project Connect
Highway 18 BNSF Railroad Overpass Feasibility Study Craighead County. Executive Summary
 Highway 18 BNSF Railroad Overpass Feasibility Study Craighead County Executive Summary October 2014 Highway 18 BNSF Railroad Overpass Feasibility Study Craighead County Executive Summary October 2014 Prepared
Harlem Avenue between 63 rd and 65 th
 Harlem Avenue between 63 rd and 65 th Public Meeting #2 March 13, 2018 Summit Park District Welcome to the second Public Meeting for the preliminary engineering and environmental studies of Illinois 43
Challenges in a Post-Katrina Environment East-West Corridor Project Overview February, 2007
 EAST-WEST CORRIDOR Challenges in a Post-Katrina Environment East-West Corridor Project Overview February, 2007 Presentation Agenda Project Overview / Purpose and Need Highway Component Transit Component
Tier 1 and Tier 2 Alternatives Screening Report
 I - 2 0 E A S T T R A N S I T I N I T I A T I V E Tier 1 and Tier 2 Alternatives Screening Report Prepared for: Metropolitan Atlanta Rapid Transit Authority Prepared by: AECOM/JJG Joint Venture Atlanta,
CITY OF ANN ARBOR, MICHIGAN 301 E. Huron St., P.O. Box 8647 Ann Arbor, Michigan
 Date: Wednesday, June 18, 2014 Location: Ann Arbor District Library Attendees: 14 citizen attendees Ann Arbor Station Environmental Review Citizen Working Group Meeting Notes Meeting #3 The third meeting
Policy Note. Vanpools in the Puget Sound Region The case for expanding vanpool programs to move the most people for the least cost.
 Policy Note Vanpools in the Puget Sound Region The case for expanding vanpool programs to move the most people for the least cost Recommendations 1. Saturate vanpool market before expanding other intercity
West Seattle and Ballard Link Extensions
 West Seattle and Ballard Link Extensions Stakeholder Advisory Group Meeting April 17, 2018 Agenda Welcome & Introductions Previous Meeting Summary What We Heard March Alternatives Development Process Level
Funding Scenario Descriptions & Performance
 Funding Scenario Descriptions & Performance These scenarios were developed based on direction set by the Task Force at previous meetings. They represent approaches for funding to further Task Force discussion
DRAFT METROCENTER CORRIDOR STUDY
 DRAFT METROCENTER CORRIDOR STUDY TIER 2 EVALUATION OF ALTERNATIVES JUNE 20, 2005 TABLE OF CONTENTS SECTION PAGE 1.0 INTRODUCTION... 1 1.1 Overview... 1 1.2 Project Description... 1 2.0 EVALUATION PROCESS...
CITY OF ANN ARBOR, MICHIGAN 301 E. Huron St., P.O. Box 8647 Ann Arbor, Michigan
 Date: Wednesday, June 24, 2014 Location: Ann Arbor District Library Attendees: 40 citizen attendees Ann Arbor Station Environmental Review Public Meeting Meeting Notes Meeting #2 The second public meeting
TORONTO TRANSIT COMMISSION REPORT NO.
 Form Revised: February 2005 TORONTO TRANSIT COMMISSION REPORT NO. MEETING DATE: October 24, 2012 SUBJECT: DOWNTOWN RAPID TRANSIT EXPANSION STUDY (DRTES) PHASE 1 STRATEGIC PLAN ACTION ITEM RECOMMENDATIONS
29 April Sound Transit 3 Draft Plan. Dear Sound Transit Boardmember:
 29 April 2016 Re: Sound Transit 3 Draft Plan Dear Sound Transit Boardmember: Thank you for the opportunity to comment on the Sound Transit 3 Draft Plan. Sierra Club supports transportation policies that
Exhibit A Sound Transit Board Resolution R Selecting the bicycle, pedestrian, and parking access improvements to be built for the Puyallup
 Exhibit A Sound Transit Board Resolution R2016-07 Selecting the bicycle, pedestrian, and parking access improvements to be built for the Puyallup Access Improvement Project. RESOLUTION NO. R2016-07 Selecting
RECOMMENDED ALTERNATIVE REPORT
 DRAFT METROCENTER CORRIDOR STUDY RECOMMENDED ALTERNATIVE REPORT JULY 12, 2005 TABLE OF CONTENTS SECTION PAGE 1.0 INTRODUCTION... 1 2.0 TIER 1 ALTERNATIVES EVALUATION... 1 3.0 TIER 2 ALTERNATIVES EVALUATION...
NEW HAVEN HARTFORD SPRINGFIELD RAIL PROGRAM
 NEW HAVEN HARTFORD SPRINGFIELD RAIL PROGRAM Hartford Rail Alternatives Analysis www.nhhsrail.com What Is This Study About? The Connecticut Department of Transportation (CTDOT) conducted an Alternatives
Public Meeting. City of Chicago Department of Transportation & Department of Housing and Economic Development
 Public Meeting City of Chicago Department of Transportation & Department of Housing and Economic Development Funded by Regional Transportation Authority September 12, 2011 In partnership with Presentation
Chapter 9 Recommended Locally Preferred Alternative and Alternatives for Evaluation in Draft SEIS/SEIR
 Chapter 9 Recommended Locally Preferred Alternative and Alternatives for Evaluation in Draft SEIS/SEIR 9.0 RECOMMENDED LOCALLY PREFERRED ALTERNATIVE AND ALTERNATIVES FOR EVALUATION IN DRAFT SEIS/SEIR
Sound Transit 3. Appendix C: Benefits, Costs, Revenues, Capacity, Reliability, and Performance Characteristics
 Sound Transit 3 Appendix C: Benefits, Costs, Revenues, Capacity, Reliability, and Performance Characteristics Table of contents Introduction... 4 Background... 5 Benefits of ST3 investments in the regional
STRATEGIC PRIORITIES AND POLICY COMMITTEE MAY 5, 2016
 STRATEGIC PRIORITIES AND POLICY COMMITTEE MAY 5, 2016 Shift Rapid Transit Initiative Largest infrastructure project in the city s history. Rapid Transit initiative will transform London s public transit
Chapter 7: Travel Demand Analysis. Chapter 8. Plan Scenarios. LaSalle Community Center. Image Credit: Town of LaSalle
 Chapter 7: Travel Demand Analysis Chapter 8 Plan Scenarios LaSalle Community Center. Image Credit: Town of LaSalle 164 Chapter 8: Plan Scenarios Moving Ahead for Progress in the 21 st Century Act (MAP
I-26 Fixed Guideway Alternatives Analysis
 I-26 Fixed Guideway Alternatives Analysis Steering & Technical Advisory Committees Joint Meeting January 15, 2016 @ 10:00 AM SC/TAC Meeting Winter 2016 Agenda I. Welcome & Introductions II. III. Project
Summary. S.1 Lynnwood Link Extension
 Summary S.1 The Central uget Sound Regional Transit Authority (Sound Transit) is proposing to build and operate the, which would expand the regional light rail system from Seattle to Lynnwood, Washington.
DRAFT Evaluation Scores. Transit
 DRAFT Evaluation s The criteria for evaluating applications for new funding commitments are used to measure how well they advance the six goals identified for the MTP. Through transportation: Reduce per
I-494/I-35 Interchange Vision Layout Development - BRT Station Concepts S.P B SEH No
 TECHNICAL MEMORANDUM TO: FROM: Transit Advisory Group Jeff Rhoda DATE: RE: I-494/I-35 Interchange Vision Layout Development - BRT Station Concepts S.P. 2785-330B SEH No. 123252 04.00 I-494/I-35W Interchange
Public Information Workshop
 Public Information Workshop Charlotte County-Punta Gorda MPO - Meeting Rooms A and B March 29, 2018 Welcome to the Public Information Workshop for Harborview Road Project Development and Environment (PD&E)
Link LRT: Maintenance Bases, Vehicles and Operations for ST2 Expansion
 Project Number SYS-LRT Subareas All Primary Mode Impacted Link Facility Type Link Service Version Number 4.0 Date Last Modified 7/24/2008 Project Locator Map Short Project Description Construct new light
TEXAS CITY PARK & RIDE RIDERSHIP ANALYSIS
 TEXAS CITY PARK & RIDE RIDERSHIP ANALYSIS This document reviews the methodologies and tools used to calculate the projected ridership and parking space needs from the proposed Texas City Park & Ride to
Leadership NC. November 8, 2018
 v Leadership NC November 8, 2018 Planning for our region s growth The Triangle is one of the fastestgrowing regions in the nation. More than 2 million people are already part of the equation, and the
West Broadway Reconstruction/LRT Design. March 19, 2015
 West Broadway Reconstruction/LRT Design March 19, 2015 1 Meeting Agenda 6:05 6:30 PM Brief presentation What we heard Project overview 6:30 8:00 PM Visit Six Topic Areas Road and LRT design elements Pedestrian
Sales and Use Transportation Tax Implementation Plan
 Sales and Use Transportation Tax Implementation Plan Transportation is more than just a way of getting from here to there. Reliable, safe transportation is necessary for commerce, economic development,
Needs and Community Characteristics
 Needs and Community Characteristics Anticipate Population and Job Growth in the City Strongest density of population and jobs in Ann Arbor are within the Study Area Population expected to grow 8.4% by
Transportation Demand Management Element
 Transportation Demand Management Element Over the years, our reliance on the private automobile as our primary mode of transportation has grown substantially. Our dependence on the automobile is evidenced
EXECUTIVE SUMMARY. The following is an outline of the traffic analysis performed by Hales Engineering for the traffic conditions of this project.
 EXECUTIVE SUMMARY This study addresses the traffic impacts associated with the proposed Shopko redevelopment located in Sugarhouse, Utah. The Shopko redevelopment project is located between 1300 East and
Letter EL652 City of Mercer Island. Page 1. No comments n/a
 Letter EL652 City of Mercer Island Page 1 No comments n/a Page 2 Response to comment EL652 1 Section 4.5.3 of the Final EIS presents the range of potential impacts of the project. This project also lists
3.0 Transportation Environment and Consequences
 3.0 Transportation Environment and Consequences 3.1 32BSummary This chapter describes the characteristics of the transportation system in the Federal Way Link Extension (FWLE) vicinity and discusses potential
BROWARD BOULEVARD CORRIDOR TRANSIT STUDY
 BROWARD BOULEVARD CORRIDOR TRANSIT STUDY FM # 42802411201 EXECUTIVE SUMMARY July 2012 GOBROWARD Broward Boulevard Corridor Transit Study FM # 42802411201 Executive Summary Prepared For: Ms. Khalilah Ffrench,
Table Existing Traffic Conditions for Arterial Segments along Construction Access Route. Daily
 5.8 TRAFFIC, ACCESS, AND CIRCULATION This section describes existing traffic conditions in the project area; summarizes applicable regulations; and analyzes the potential traffic, access, and circulation
Sepulveda Pass Corridor Systems Planning Study Final Compendium Report. Connecting the San Fernando Valley and the Westside
 Los Angeles County Metropolitan Transportation Authority November 2012 Connecting the San Fernando Valley and the Westside Interstate 405 Sepulveda Pass THIS PAGE INTENTIONALLY LEFT BLANK Sepulveda Pass
Tier 2 Screening and Selection522. of the Short List Alternatives KISSIMMEE CORRIDOR. Downtown CRA. US 192 Alternatives Analysis
 LAKE COUNTY ORANGE COUNTY Ticket and Transportation Center Walt Disney / Reedy Creek Improvement District CR 535 John Young Parkway 441 17 92 Florida s Turnpike VE 92 mee Hall JOHN YOUNG PKY 192 OAK ST
Feasibility Study. Community Meeting March, North-South Commuter Rail Feasibility Study
 Feasibility Study Community Meeting March, 2017 1 Agenda 1. Welcome / Introductions 2. Background / Meeting Purpose 3. Progress to Date Options Evaluated Capital/Operating Costs Ridership 4. Financial
August 2, 2010 Public Meeting
 Public Meeting LYMMO Expansion Alternatives Analysis Study Purpose of study is to provide a fresh look at potential LYMMO expansion, following Federal Transit Administration (FTA) Alternatives Analysis
Central City Line Locally Preferred Alternative (LPA) Amendment Public Hearing. July 24, 2014
 Amendment Public Hearing. July 24, 2014") Central City Line Locally Preferred Alternative (LPA) Amendment Public Hearing July 24, 2014 Project Description The Central City Line is a High Performance Transit project that will extend from Browne
Central City Line Locally Preferred Alternative (LPA) Amendment Public Hearing July 24, 2014 Project Description The Central City Line is a High Performance Transit project that will extend from Browne
APPENDIX VMT Evaluation
 APPENDIX 2.7-2 VMT Evaluation MEMORANDUM To: From: Mr. Jonathan Frankel New Urban West, Incorporated Chris Mendiara LLG, Engineers Date: May 19, 2017 LLG Ref: 3-16-2614 Subject: Villages VMT Evaluation
I-10 West AA/EIS Pre-Screening and Tier 1 Analysis Results. Public Meeting. Wulf Grote, Director Project Development Rick Pilgrim, Project Manager
 I-10 West AA/EIS Pre-Screening and Tier 1 Analysis Results Public Meeting Wulf Grote, Director Project Development Rick Pilgrim, Project Manager March 4 & 5, 2008 Today s Agenda Overview of Alternatives
2016 PSRC REGIONAL & KING COUNTYWIDE EASTSIDE FUNDING AWARDS. Eastside Transportation Partnership September 9, 2016
 2016 PSRC REGIONAL & KING COUNTYWIDE EASTSIDE FUNDING AWARDS Eastside Transportation Partnership September 9, 2016 1 2 PSRC 2016 Project Selection Process 2018-2020 Estimated FHWA Funds Available: (Summary)
PROPOSAL OF HIGH CAPACITY URBANAUT PUGET SOUND REGIONAL MONORAIL MASTERPLAN WASHINGTON STATE, USA
 PROPOSAL OF HIGH CAPACITY URBANAUT PUGET SOUND REGIONAL MONORAIL MASTERPLAN WASHINGTON STATE, USA Not to be copied in part without reference to author Urbanaut Company Inc. Monorail Tel: 425 434-6570 Fax:
Location Concept Plan Amendment Recommendation Approved 2011 Concept Plan
 Valley Line West LRT Concept Plan Recommended Amendments Lewis Farms LRT Terminus Site Location Concept Plan Amendment Recommendation Approved 2011 Concept Plan Lewis Farms LRT terminus site, 87 Avenue/West
Michigan/Grand River Avenue Transportation Study TECHNICAL MEMORANDUM #18 PROJECTED CARBON DIOXIDE (CO 2 ) EMISSIONS
 EMISSIONS") TECHNICAL MEMORANDUM #18 PROJECTED CARBON DIOXIDE (CO 2 ) EMISSIONS Michigan / Grand River Avenue TECHNICAL MEMORANDUM #18 From: URS Consultant Team To: CATA Project Staff and Technical Committee Topic:
TECHNICAL MEMORANDUM #18 PROJECTED CARBON DIOXIDE (CO 2 ) EMISSIONS Michigan / Grand River Avenue TECHNICAL MEMORANDUM #18 From: URS Consultant Team To: CATA Project Staff and Technical Committee Topic:
CITY OF LONDON STRATEGIC MULTI-YEAR BUDGET ADDITIONAL INVESTMENTS BUSINESS CASE # 6
 2016 2019 CITY OF LONDON STRATEGIC MULTI-YEAR BUDGET ADDITIONAL INVESTMENTS BUSINESS CASE # 6 STRATEGIC AREA OF FOCUS: SUB-PRIORITY: STRATEGY: INITIATIVE: INITIATIVE LEAD(S): BUILDING A SUSTAINABLE CITY
Recommended Vision for the Downtown Rapid Transit Network
 Recommended Vision for the Downtown Rapid Transit Network April 2008 Presentation Overview Context Transit options Assessment of options Recommended network Building the network 2 1 Rapid Our Vision Reliable
East San Fernando Valley Transit Corridor. TAC Briefing December 4, 2013
 East San Fernando Valley Transit Corridor TAC Briefing December 4, 2013 Overview Measure R Project Long Range Transportation Plan Reserves $170.1 Million 2018 Revenue Operations Date Coordination with