Energy Efficiency Policies in the Transport Sector in the EU. ODYSSEE/MURE Project Phase 12
|
|
|
- Brice McCormick
- 6 years ago
- Views:
Transcription


1 Energy Efficiency Policies in the Transport Sector in the EU ODYSSEE/MURE Project Phase 12 Report for the EACI AEA/ED46824 Issue Number 2 October 2012
2 Customer: Executive Agency for Competitiveness and Innovation/European Commission. Customer reference: IEE/09/801/SI Confidentiality, copyright & reproduction: This report is the Copyright of AEA Technology plc and has been prepared by AEA Technology plc under contract to the European Commission dated 11 th May The contents of this report may not be reproduced in whole or in part, nor passed to any organisation or person without the specific prior written permission of AEA Technology plc. AEA Technology plc accepts no liability whatsoever to any third party for any loss or damage arising from any interpretation or use of the information contained in this report, or reliance on any views expressed therein. Contact: Heather Haydock AEA Technology plc Gemini Building, Harwell, Didcot, OX11 0QR t: e: AEA is a business name of AEA Technology plc AEA is certificated to ISO9001 and ISO14001 Authors: Heather Haydock, Anne Misra, Judith Bates, Gill Wilkins Approved By: Heather Haydock. Date: 31 st October 2012 Signed: AEA reference: Ref: ED Issue Number 2 This book reflects the author s views and the European Commission is not liable for any use that may be made of the information contained therein
3 Acknowledgements AEA would like to acknowledge the support of the ODYSSEE-MURE project coordination team and other members of the ODYSSEE-MURE family in the preparation of this brochure and in the diligent updating of the MURE database that underpins it. We would also like to thank the European Commission, European Agency for Competitiveness and Innovation (EACI) and UK Department of Energy and Climate Change (DECC) for their financial support.
4 Key Messages There is a growing realisation that a focus on improving the efficiency of vehicles is only part of the solution in the transport sector. A more holistic approach involving the reduction of transport demand and the shift of transport to more environmentally friendly and energy efficient modes is needed if the European Union is to meet its 2030 and 2050 targets. However very few EU Member States presented a comprehensive package of transport measures in their National Energy Efficiency Action Plans (NEEAPs). The most commonly implemented policies at Member State level are those that seek to improve the efficiency of vehicles (e.g. implementation of Regulation 443/2009/EC into national law) or encourage the purchase of cleaner vehicles. Other measures seek to encourage modal shift or change driver behaviour. The majority of policies focus on cars: improving the efficiency of cars, encouraging the take-up of energy efficient cars and changing the behaviour of car drivers. This focus on cars may be partly due to the homogeneous nature of cars and partly to their large share of the overall vehicle fleet. However, cross-cutting measures such as voluntary agreements and white certificates are now being applied to other vehicle types, and may be more appropriate than codes and standards when dealing with heterogeneous technologies like heavy goods vehicles (HGVs). Vehicle efficiency improvement measures are predominantly implemented at EU level through regulations targeted at vehicle manufacturers. There are also some novel policies at the national level, particularly on HGVs and public transport vehicles, including the introduction of longer road trains and voluntary agreements with freight logistics companies. Modal shift can play an important role in reducing energy consumption and greenhouse gas (GHG) emissions from transport. Measures include enhancements to public transport provision (e.g.. extending the public transport network), fiscal incentives to encourage the use of public transport or non-motorised modes, differential toll charges, the promotion of walking and cycling, and urban mobility planning. Measures to encourage the uptake of cleaner vehicles include labelling, taxation and infrastructure charges, grants and subsidies and scrappage schemes. Differentiation of car purchase tax by fuel efficiency/co 2 emissions have now been introduced in almost two-thirds of Member States, but differentiation of annual circulation taxes is less common. Scrappage schemes for older inefficient cars have been introduced quite widely across the EU, although often for relatively limited periods. Many of the schemes also provide incentives for the purchase of new cars, often stipulating CO 2 performance standards which must be met. Measures to promote the uptake of electric vehicles have expanded substantially in the last few years, and seek to combat the most common barriers, high capital cost and lack of charging infrastructure. Changing driver behaviour to encourage more fuel efficient driving is widely recognised as potentially offering significant savings, and several countries have introduced training courses and awareness raising campaigns for both car drivers and freight, and bus and coach drivers.
5 Increasing the utilisation of vehicles, e.g. through car sharing, can also contribute to improving the overall efficiency of passenger transport, and is typically encouraged though a range of soft measures to change driver and passenger behaviour.
6 Table of contents 1 Introduction Policy Overview Energy Consumption in the Transport Sector EU wide policies Policy Measures in Member States Transport Measures in the NEEAPs Modal Shift Shift between motorised modes Shift to non-motorised modes Mobility plans Vehicle Efficiency Cars Vans and HGVs Public transport Encouraging Uptake of Cleaner Vehicles Labelling Taxation Electric vehicles Scrappage schemes Driver Behaviour Traffic management Eco-driving Optimised logistics Conclusions References...48 Appendices Appendix 1 Measures on Transport in the MURE database
7 List of Figures Figure 1.1 Sustainable hierarchy for transport measures... 7 Figure 2.1 Average annual passenger km per capita in EU... 9 Figure 2.2 Car ownership per capita...10 Figure 2.3 Freight tonne km in EU...11 Figure 2.4 Average fuel consumption (l/100km) of new cars...11 Figure 2.5 Energy efficiency progress in transport in the EU...12 Figure 2.6 Measures in the MURE database...13 Figure 2.7 Types of measures implemented...14 Figure 2.8 Number of ongoing and proposed measures by country...14 Figure 2.9 Main aims of ongoing measures...15 List of Tables Table 2.1 Member States identified as having good practices in their first NEEAPs... Erreur! Signet non défini. Table 5.1 Date of introduction of differentiated tax rates...30 Table 5.2 Examples of scrappage schemes...38 Table 5.3 Scrappage scheme in Italy...39 List of Boxes Box 1.1 MURE database... 6 Box 1.2 IEA recommendations on transport energy efficiency... 8 Box 3.1 Increasing the availability and accessibility of bicycles...20 Box 4.1 Schemes to encourage energy efficient technologies for HGVs...24 Box 4.2 Trial of longer and heavier goods vehicles in the Netherlands...24 Box 5.1 Car labelling - differences in implementation...28 Box 5.2 Extending labelling to vans in Denmark...29 Box 5.3 Tolls for HGVs in new member states...31 Box 5.4 Heavy goods vehicle toll charges in Germany...31 Box 5.5 Company car CO 2 taxation in UK...32 Box 5.6 Definition of electric vehicles...34 Box 5.7: UK Plug-In Grants...35 Box 5.8: Integral strategy to encourage uptake of EV/PHEV in Spain Box 5.9: Examples of charging infrastructure schemes...37 Box 5.10 Bonus-Malus scheme in France...40 Box 6.1 Ecodriving programme in Austria...42 Box 6.2 Ecodriving programme in Spain...43 Box 6.3 Management of road transport fleets in Spain...44 Box 6.4 White certificates scheme for transport in France...45
8 1 Introduction The aim of this brochure is to provide insight into developments in policy measures to improve energy efficiency in the transport sector in the EU-27. This should help policy makers and other parties involved in energy efficiency and CO 2 emission reduction to adapt current policies and to define new, effective policy measures. As well as providing an overview of transport policy measures, the brochure highlights innovative measures in Member States which could be considered for use by other Member States. This publication was created using the data contained in the MURE databases (Box 1.1) which includes details of policy measures on energy efficiency, including details of their impact, for all EU-27 Member States, plus Croatia and Norway: The brochure also makes use of information from the ODYSSEE database ( on energy efficiency indicators to provide information on trends on mobility and energy efficiency trends in the transport sector. A more detailed analysis of data on energy trends, drivers for energy use, explanatory variables and energy-related CO 2 emissions in the transport sector is contained in a further report from the ODYSSEE-MURE Project 1. Box 1.1 MURE database The MURE database ( provides an overview of the most important energy efficiency policy measures by sector (households, industry, transport and tertiary), as well as general or crosscutting measures. Information about these measures is collected by national energy agencies or institutes according to harmonised guidelines. The measures are classified according to various criteria: their status (completed, ongoing or planned) and year of introduction and completion; their type: legislative/normative (e.g. standards for new dwellings), legislative/informative (e.g. mandatory labels for appliances), financial (e.g. subsidies), fiscal (e.g. tax deductions), information/education, co-operative (e.g. voluntary agreements) and taxes on energy/co 2 ); their qualitative impact: low, medium or high impact, based on quantitative evaluations or expert estimates; the targeted energy users, the actors involved, etc. For each policy measure a detailed description is available which contains, if available, a quantitative impact in terms of energy savings and/or CO 2 emission reduction. The MURE database provides EU Member States with a structured format to report on measures taken under the National Energy Efficiency Action Plans requested by the European Commission in compliance with the Energy Service Directive (ESD). In addition, the MURE simulation tool, which is linked to the database, was used by the EU Commission to assess the energy saving potentials over the period Globally transport is the sector with the highest final energy consumption and, without any significant policy changes, is likely to remain so. It is responsible for about one-fifth of CO 2 emissions in the EU, and emissions from the sector are still rising rapidly. The recent EU White Paper (EC, 2011) has however set a clear quantitative target for the reduction of GHG emissions from transport i, of 60% by 2050 from 1990 levels (which is equivalent to about a 1 ADEME (2012) Energy Efficiency Trends in the Transport Sector in the EU: Lessons from the ODYSSEE MURE project, March DG TREN (2009): Energy Savings Potentials in EU Member States, Candidate Countries and EEA Countries

 which prioritises demand reduction, and modal shift (Figure 1.1). Figure 1.")


9 70% reduction from 2008 levels), with an interim goal of reducing emissions by around 20% below their 2008 level by It is widely recognised that the transport sector remains one of the most challenging areas for improving energy efficiency, and that while in the past, measures have focussed on technological improvements, there is the need to move towards a more holistic approach, which includes reduction of transport demand and shift of transport to more environmentally friendly and energy efficient modes. A hierarchy for sustainable transport policies has been identified (e.g. SDC, 2011; EEA, 2010) which prioritises demand reduction, and modal shift (Figure 1.1). Figure 1.1 Sustainable hierarchy for transport measures AVOID Reduce demand for powered transport Wide range of measures ranging from good spatial planning through to technological solutions such as telecommuting SHIFT Modal shift to more sustainable modes Shifting away from motorised modes to cycling and walking Shifting from private motor vehicles to public transport Includes better integration between different public transport systems, walking and cycling IMPROVE Efficiency improvements Behavioural changes including encouraging higher occupancy rates for both private vehicles (e.g. lift sharing) and public transport; promotion of car clubs; promotion of ecodriving techniques Technical interventions to improve vehicle efficiency Technical interventions to promote more efficient use of transport infrastructure and net works Historically there has been a tendency for measures to focus on technological solutions to improve vehicle efficiency, particularly of cars. For example, a review of the first National Energy Efficiency Action Plans (NEEAPs) submitted by Member States 3, found that although there had been significant improvements over recent years in vehicle technology, particularly fuel efficiency, these were not sufficient to neutralize the effect of increases in traffic and car size. On the other hand the review also found that only a few Member States reported a clear and consistent strategy for modal shifts to more energy saving modes of transport. The IEA has also recognised the need to tackle transport sector energy consumption in a more comprehensive way. In 2008 it made four key recommendations on transport, concerning tyre efficiency, fuel economy of light and heavy duty vehicles and ecodriving, In 3 SEC(2009)889 final MOVING FORWARD TOGETHER ON SAVING ENERGY Synthesis of the complete assessment of all 27 National Energy Efficiency Action Plans as required by Directive 2006/32/EC on energy end-use efficiency and energy services COMMISSION STAFF WORKING DOCUMENT
10 2010, a review of implementation of these recommendations in Member States (which concluded that none of the recommendations had been fully implemented in all counties) recognised that the original recommendations mainly focused on vehicle and tyre efficiency and did not address driver behaviour (aside from the recommendations on eco-driving) or travel demand. Their recommendations have subsequently been expanded to include other aspects of vehicle efficiency and modal shift (Box 1.2). Box 1.2 IEA recommendations on transport energy efficiency As part of a set of 25 energy efficiency recommendations, the IEA has made the following five recommendations for measures to tap energy savings in the transport sector: Implement and periodically strengthen mandatory fuel-efficiency standards for lightand heavy-duty vehicles; for heavy duty vehicles this includes establishing testing procedures Adopt measures such as labelling, incentives and taxes to boost vehicle efficiency and accelerate the market penetration of new efficient vehicle technologies. This should include Infrastructure support and incentive schemes for very low CO 2 - emitting and fuel-efficient vehicles. Put in place policies to improve the performance of tyres, air conditioning, lighting and other non-engine components that affect a vehicle s fuel efficiency. This should include mandatory fitting of tyre-pressure monitoring systems on new road vehicles and the introduction of energy efficiency requirements for air-conditioning systems Promote eco-driving by making it a required element of driver s education programmes and requiring feedback instruments in new vehicles. Enable policies that increase the overall energy efficiency of national, regional and local transport systems, and promote shifts of passengers and freight to more efficient modes. Policies should ensure that users pay the economic, environmental and energy security-related costs of the transport system, that transport infrastructure is built to support the most energy efficient transport modes, and that urban and commercial development planning takes into account the likely implications for transport and energy demand. Source: IEA, A wide range of types of measures are discussed in the report, ranging from regulations, to fiscal measures to information type measures and voluntary agreements. Most of the measures discussed in the report are national measures, as the MURE database is not designed to include local or regional measures (unless the measure is particularly innovative and could be easily replicated in a number of regions or localities). Similarly, infrastructure developments (such as introduction of high speed rail lines) are not included. However both of these types of measures can have a role to play in developing programmes to reduce transport energy demand. Section 2 of this brochure gives an overview of trends and polices at the European Level, summarising underlying mobility and energy efficiency trends and discussing key EU level policies. It also gives an overview from the database of the types of measures which have been implemented. Section 3 discusses policies aimed at reducing transport demand and for modal shift, booth between motorised modes and to non-motorised modes. Measure to improve vehicle efficiencies are discussed in Section 4, and measures to encourage the update of cleaner vehicles are summarised in Section 5. Examples measures to improve efficiency through driver behaviour or optimisation of logistics are covered in section 6.
11 passenger km per capita Energy Efficiency Policies in the Transport Sector in the EU 2 Policy Overview 2.1 Energy Consumption in the Transport Sector The MURE report Energy Efficiency Trends in the Transport Sector (ADEME, 2012) examined trends in energy consumption and energy efficiency in the sector in detail. It found that transport has exhibited the most rapid growth in energy consumption of all sectors within the EU, and accounted for 33% of final energy consumption in the EU in 2009 (up from 31% in 2000). Road transport accounted for 81% of total EU transport consumption, and of this about 60% was accounted for by cars. The increase in energy consumption in the sector has largely been driven by the growth in passenger mobility (Figure 2.1), particularly that in car use. However the rate of increase has more than halved over the last decade (from 1.7% per year between 1990 and 2000 to 0.6% per year), and in particular the economic crisis has slowed growth since The level of mobility varies significantly between EU countries due to differences in car ownership levels, income, country size and density, ranging from 4,211 passenger km (pkm) per capita in Romania to over 16,000 pkm per capita in Luxembourg. In general mobility has increased most significantly in most new Member States as well as Greece and Ireland. As shown in Figure 2.2, levels of car ownership per capita also vary significantly between Member States; while historically levels of car ownership in the newer Member States were significantly lower than in the older Member States, this gap has declined due to rapid growth in car ownership in a number of the new Member States. Figure 2.1 Average annual passenger km per capita in EU 12,000 10,000 8,000 6,000 4,000 Air Rail Bus Cars 2,000 Source: ODYSSEE


12 EU12 EU15 Energy Efficiency Policies in the Transport Sector in the EU Figure 2.2 Car ownership per capita Luxembourg Italy Germany Austria Finland France Belgium Sweden Netherlands UK Greece Ireland Denmark Portugal Spain Cyprus Malta Slovenia Lithuania Poland Czech Rep Estonia Croatia Bulgaria Hungary Slovakia Latvia Romania 1995 Growth to 2009 Source: ODYSSEE In the case of freight, total tonne km in the EU has increased significantly possibly due to increased intra-eu trade following the expansion of the internal market. Between 2002 and 2007 it grew at a faster pace than GDP, however since 2008 and the economic recession, transportation of goods has shown a sharp decline (Figure 2.3). The potential increases in transport energy consumption from these increases in the drivers of transport demand have been moderated by improvements in the energy efficiency of the transport fleet. Overall energy efficiency of transport is improving by about 1% per year, with the greatest improvements coming in passenger cars and aviation. This can be seen in the steady rate of improvement in the fuel efficiency of the fleet (Figure 2.4). Improvements in the energy efficiency of new cars has led to reductions of about 17% in their fuel consumption per km driven The rate of improvement for goods vehicles has however slowed, and since 2008 has worsened, presumably due to the effects of the economic crisis (Figure 2.5).
13 litres/100 km tonne km (thousand millions) Energy Efficiency Policies in the Transport Sector in the EU Figure 2.3 Freight tonne km in EU 3,000 2,500 2,000 1,500 Inland Waterway Rail 1,000 Road Source: ODYSSEE Figure 2.4 Average fuel consumption (l/100km) of new cars All cars Gasoline cars Diesel cars Source: ODYSSEE
14 Figure 2.5 Energy efficiency progress in transport in the EU 4 Energy Efficiency Policies in the Transport Sector in the EU 2.2 EU wide policies Within the EU, policies to improve transport energy efficiency have been focussed on passenger cars, but have more recently been expanded to include vans and, through its inclusion in the ETS, aviation. Specific policies include: Regulations setting CO 2 limits for new passenger cars and vans from 2012; Regulations requiring gear shift indicators in new passenger cars from 2012; Regulations requiring tyre pressure monitoring systems in new cars from 2012, the use of low rolling resistance tyres on new cars from November 2014, and the introduction of a labelling scheme specifying the rolling resistance of tyres in 2012; Inclusion of the aviation sector in the EU ETS from More details of these policies and discussions of how some of these policies have been implemented in Member States are included in the relevant sections of the report. Looking forward, the recent EU White Paper on transport (EC, 2011) has set a target for the reduction of GHG emissions from transport ii, of 60% by 2050 from 1990 levels (which is equivalent to about a 70% reduction from 2008 levels), with an interim goal of reducing emissions by around 20% below their 2008 level by In addition to this there are specific targets for reducing CO 2 emissions from maritime bunker fuel use (40% reduction by 2050). On the passenger side, a key aim is to phase out the use of conventionally-fuelled cars in urban transport, and on the freight side, The paper proposes that 30% of road freight over 300 km should shift to other modes such as rail or waterborne transport by 2030, and more than 50% by The energy efficiency indicator, ODEX is calculated as a 3-year moving average and is based on fuel consumption per km for cars, buses and motorcycles, per pkm for passenger rail, per passenger for air transport, and per tkm for all freight transport, The overall trend is an average of the trend by mode weighted according to the share of each mode in the energy consumption of the transport sector.
15 2.3 Policy Measures in Member States Energy Efficiency Policies in the Transport Sector in the EU Member States have implemented a wide range of policy measures in the transport sector. The MURE database contains examples of 427 measures in the MURE database in the EU, Norway and Croatia, of which just over three-quarters (333) are ongoing (Figure 2.6). 30% of the reported measures have been implemented since Figure 2.6 Measures in the MURE database Status not specified Proposed Ongoing Completed 50 0 All Implemented since 2000 Implemented since 2008 A wide range of policy instruments are used; the most common is fiscal measures, which now account for 28% of all measures, and are used in almost every Member State. In recent years (since 2008) there is a trend towards using fewer regulatory or normative measures, and more co-operative measures such as voluntary agreements (Figure 2.7). The number of measures reported by Member States varies considerably (Figure 2.8), with the newer Member States generally having fewer measures implemented, although there are some exceptions. The most common aim of measures (Figure 2.9) is improving the efficiency of passenger transport, predominantly through improvements to the efficiency of cars or measures to increase the uptake of cleaner vehicles, but also through promoting modal shift. Measures are however also beginning to tackle improving the efficiency of other modes, and encouraging modal shift of freight from road to other less energy intensive modes such as sea and rail. 5 Measures were extracted from the database in November 2011.
16 Figure 2.7 Types of measures implemented Fiscal or financial 40% 30% Co-operative measures 20% 10% 0% Regulations Information Organisational All dates Since 2000 Since 2008 Note: Regulations includes normative measures and organisational measures includes infrastructure and social planning measures Source: MURE database Figure 2.8 Number of ongoing and proposed measures by country Lithuania Slovakia Belgium Czech Rep. Greece Malta Norway Slovenia Croatia Cyprus Romania Bulgaria Latvia Poland Austria Portugal Denmark Hungary Luxemburg Sweden UK Germany Netherlands Italy Finland Ireland Spain Estonia France Ongoing Proposed Source: MURE database
17 Figure 2.9 Main aims of ongoing measures Modal shift passenger Modal shift freight Efficiency cars Efficiency other modes Cleaner vehicles - labelling Cleaner vehicles - fiscal Cleaner vehicles - electric Speed limits Driver behaviour Other Biofuels Note: adds to >100% as measures may target more than one aspect Source: Derived from MURE database 2.4 Transport Measures in the NEEAPs Energy Efficiency Policies in the Transport Sector in the EU 0% 10% 20% 30% 40% 50% A review by the Commission of the first National Energy Efficiency Action Plans (NEEAPS) found a similar pattern in terms of types of measures and aim of measures. A large number included technological measures to improve vehicle efficiency and fiscal incentives and subsides to encourage cleaner vehicles, but fewer had policies on other strategies such as modal shift and mobility management (Table 2.1) Overall the Commission concluded that while the increasing importance of energy use in the transport sector called for a more comprehensive and strategic approach that captured technological, infrastructural, financial, behavioural and spatial planning measures, only a few Member States had presented clear and consistent strategies in transport. In particular it found that well-described and sound packages of transport measures targeting behaviour change, including modal shift were rare and/or had been introduced as separate fragments that did not seem to form part of a coherent strategy encompassing other measures. In addition very few Member States included spatial planning aspects, although it was acknowledged that spatial and urban planning measures are related to local policies and hence may be only broadly sketched out at central level in the NEEAPS. Similarly, the wide variety of issues which need to be tackled in the transport sector, are often decided at different levels of government (central, regional and local) and fall within the competence of a number of departments and ministries.
18 Table 2.1 States identified as having good practices in their first NEEAPs Type of measure No. of Member States Tax incentives and disincentives: passenger vehicles 15 Support for public transport 13 Tax incentives and disincentives: freight vehicles 13 Eco-driving 12 Modal shift 9 Comprehensive strategies in transport 8 Mobility management 6 Tele-commuting 4 Car-sharing 3 Spatial planning provisions 2 Source: Derived from EC, 2009
19 3 Modal Shift Energy savings for road transport can be achieved indirectly by reducing traffic whilst increasing the use of public transport (such as rail, metro and buses), cycling and walking, as well as the use of more sustainable modes for the transport of goods (such as shipping and rail)., This section discusses the uptake of policies that aim to encourage modal shift, either between motorised modes (e.g. private cars to public transport, heavy duty vehicles to rail) or to non-motorised (e.g. cars to bicycles). It is interesting to note that more than half of the measures in the MURE database include an infrastructure element, i.e. involving the development, extension or improvement of the transport infrastructure, although a quarter of these also include an information / education / training element to maximise the efficiency of the initiative. Furthermore, nearly a third of the measures aim to promote or provide information, education and training, although this is once again often combined with other types of action (e.g. infrastructure, financial, fiscal, social planning / organisational and co-operative elements). Overall, from the 27 EU countries, Norway and Croatia, all but Romania, Portugal and Lithuania have implemented national or local modal shift measures (a total of 122 measures 6 ) that aim to change traffic patterns and reduce the use of cars. Nearly a third of these measures were put in place since 2008, of which, three quarters are still on-going and most of the remaining ones are proposed. Two of the most active countries putting in place modal shift measures recently are Spain and France, whilst overall, Estonia, Germany, Ireland, Italy and the Netherlands have also been very active in putting in place modal shift measures. With regards to the impact of modal shift measures, approximately half of the measures are expected to have a low impact, whilst nearly a quarter are expected to have a medium impact and even fewer than that are expected to have a high impact. It should be noted that measures that have been categorised under modal shift and are included in the analysis in this section may also be relevant and included in the analysis of other sections. For instance, a measure may promote modal shift between motorised modes by extending / improving the transport infrastructure, whilst at the same time encouraging the uptake of cleaner vehicles. The same applies for the sub-sections on modal shift, i.e. a measure may include actions that promote both a shift between motorised modes and to non-motorised modes, thus, will be considered in both categories. 3.1 Shift between motorised modes Modal shift between motorised modes has been considered separately for the transport of passengers and for that of goods. The first primarily targets private cars, shifting passengers towards the use of public transport, whilst the latter targets vans and heavy duty vehicles, shifting the transport of goods to more sustainable modes Modal shift for passengers A total of 88 modal shift measures have been implemented or have been proposed, in order to encourage passengers to use more energy efficient transport modes across the EU27 countries. These can be split into the three following categories: 6 The MURE Transport brochure is based on measures entered in the MURE database as of December 2011.
20 Energy Efficiency Policies in the Transport Sector in the EU To develop and / or improve public transport services to encourage and incentivise passengers to use public transport services, a number of countries have implemented or proposed measures that further develop, extend or improve public transport services and infrastructure such as increase transportation links between cities and airports (Cyprus), improve and extend existing metro lines with construction of organized parking near suburban bus and metro stations (Greece), build new metro lines (Greece, Hungary), improvements in the connections and effectiveness of the existing network (Greece, Ireland) and interventions in the traffic network of buses (Greece). To provide financial incentives or disincentives a number of countries have implemented or proposed measures that encourage and incentivise passengers to use public transport services. A number of countries have implemented or proposed measures that either increase the cost of travelling by car / air (using a tax, or penalties) (Germany, Denmark, Hungary) or subsidise the use of public transport (Germany, Slovenia, France). To provide information and promote behavioural change to encourage and incentivise passengers to use public transport services, a number of countries have implemented or proposed measures that provide information, raise awareness (Slovenia, Spain) and promote behavioural change, for instance by establishing information centres or developing website tools (Estonia) that facilitate the use of public transport as well as through campaigns or education programmes raising awareness on the benefits of using public transport. The majority of measures are complementary and not implemented in isolation to each other, thus combining, improving and extending the existing infrastructure with providing information and incentives to get passenger to switch from using their cars to public transport Modal shift for freight A total of 43 modal shift measures have been implemented or have been proposed that encourage a shift for the transport of goods to more energy efficient modes by further developing (and/or improving) the transport infrastructure such as the Italian subsidies for road hauliers using maritime routes rather than the road network, the French Sea motorways measure that supports sea motorway routes between France, Spain and Portugal and the Spanish measure to encourage the larger participation of railways in passenger and goods transport aiming to internalise the real road costs and improve the quality of both the railway service and infrastructure. Other measures focus on providing financial incentives or disincentives for moving goods from road to other modes of transport, such as the French measure on developing the infrastructure for combined transport: road/rail, road/river, short sea shipping by providing grants, or cost savings for acquiring high-performance combined transport equipment. The German Heavy goods vehicle toll charge measure sets a distance-based toll, for all vehicles or vehicle combinations, using the German toll-road network, with a gross vehicle weight of 12 tonnes or more and designed or used exclusively for goods transport (See Section for more details). A similar measure is being introduced in France. Slovenia introduced a measure promoting sustainable freight transport that provides direct subsidies from the national budget to increase inter-modality and rail freight transport. It should be noted that some measures described in the section focusing on modal shift for passengers also promote modal shift for freight, for instance, the Operational Programme on Transport in Bulgaria, as well as other measures that aim to improve and / or extend the existing railway network (e.g. in Spain, Greece and Ireland).. In particular most measures that introduce a toll on roads, highways, motorways etc. or that introduce a tax on fuels used by road vehicles, for instance the German Ecological Tax Reform, encourage a shift for the transport of goods to more energy efficient and cheaper modes.
21 3.2 Shift to non-motorised modes Energy Efficiency Policies in the Transport Sector in the EU A total of 61 modal shift measures have been implemented or have been proposed that encourage passengers to walk or cycle instead of using a car, by improving and developing new transport infrastructures and / or by promoting cycling or walking. To encourage and incentivise passengers to cycle or walk instead of using a car, a number of countries have implemented or proposed measures that either develop or improve cycling and walking infrastructures (e.g. Germany, Finland, Belgium) in order to increase the attractiveness of cycling and walking and minimise any safety considerations, or make it increasingly difficult / expensive for people to use cars (e.g. Malta, Austria). It should be noted that the latter types of measures may also promote the use of public transport. To encourage passengers to cycle or walk instead of using a car, a number of countries have also implemented or proposed measures that promote cycling and walking, either by raising awareness of the benefits of cycling and walking, through information programmes or campaigns (e.g. car free day campaigns in various cities in Finland, France, Ireland etc.) or by making bicycles readily available (see Box 3.1 for specific examples for the latter). It should be noted that in most cases these measures may also promote the use of public transport, in a few cases the use of more energy efficient modes for transport of goods as well.
22 Box 3.1 Increasing the availability and accessibility of bicycles Austria: Vienna city bikes In Vienna, 1,200 public bicycles are currently available for use from 92 stations, usually located near subway stations or other public transportation. Users must register themselves by using a debit or credit card to unlock a bicycle (with a one-off registration fee of 1) and can then hire one bike per card, rental charges can be paid via bank card, credit card or a so called Citybike Card, In the past, the scheme used to have more bicycles and stations, however, as the deposit required to use the bicycles was very low (2 ), the service was free of charge, bicycles were locked using a coin-system and no identification or registration was required, many bikes ended up outside the designated zones or got vandalised or stolen. Tourists in Vienna can also use the service even without an Austrian debit card or credit card, with the Citybike Tourist Card that can be rented and returned on a daily basis at two terminals and at many hotels in Vienna. The rental charge is 2 Euros per calendar day. If the bicycle is lost, the renter is liable for the value of the Citybike (600 ). There are also bicycle rental system run by Nextbike in the provinces of Lower Austria, Upper Austria, Burgenland, Salzburg and Vorarlberg. 170 bicycles can be rented at 256 stations with a rental charge of 1 per hour or 8 per day. In some regions the first half hour rental is free and at some stations, pedelecs (e-bikes) are available as well. UK: London Barclays Cycle Hire Under the Barclays Cycle Hire scheme, 8,300 bicycles are available from 567 docking stations across the city. Casual users can buy daily or weekly access at a docking station terminal, online or by phone with a credit or debit card (available for non-uk residents as well). Alternatively, regular users can become a member of the scheme (for 3.6), which allows a cheaper annual access fee, and a card key to release bikes from the docking station. The scheme is intended for short journeys. In addition to the access and usage charges, there is a late return charge ( 180 if the cycle is kept for more than 24 hours or the access period runs out), a damage charge (up to 360) and a non-return charge ( 360). There have been over 14 million cycle hires in the first two years of the scheme, which launched at the end of July The scheme is intended for relatively short term hire, with charges increasing substantially for longer periods, and average hire times are less than half an hour (19 minutes on week days and 29 minutes for weekend journeys). France: A bike rental system is available for short journeys in big cities (Nantes, Paris, Toulouse, Marseille, Lyon and Rennes etc) for both tourists and inhabitants of the city. Subscription and usage fees vary by city. In addition to these charges there are late return fees and a non-return charge. Residents that have a subscription for the local public transport network can use the same card for the bike rental system. In Paris, of the 18,000 bikes available form 1,200 rental stations, about 80% have had to be replaced due to vandalism or theft, leading to a tightening of security procedures. Access and Usage Charges for Cycle Hire Schemes Scheme Access fee Usage charge ( ) for number of hours shown Day Week Year 1/2 1 1½ 2 2½ Vienna Free Free Other Austrian cities Free 1 8 London* Paris * * Converted at 1= 0.83 Source: MURE database; and It should be noted that some measures described in the section focusing on modal shift for passengers, especially the measures that provide financial disincentives for using cars or
23 raise awareness on the benefits of using more sustainable modes of transport, may also promote modal shift to non-motorised modes. 3.3 Mobility plans A sustainable mobility plan aims to promote the use of different modes of transport by implementing several of the measures described in the previous sections. Key characteristics of a mobility plan include (IDAE, 2006): It is applicable at a local or metropolitan / urban level; It covers all applicable modes of transport for both freight and passengers It reduces adverse effects from transport, reduces traffic in roads, promotes modal shifts to cleaner and more energy efficient modes It guarantees the accessibility and demand for municipal mobility It is linked to national and regional plans Examples of measures that may be included in such a plan include Promoting modal shift through campaigns and information programmes (such as walking, cycling and public transport); Promoting more sustainable behaviour and practices (e.g. introducing car-pooling, car sharing, parking management, congestion charges); Improving public transport (e.g. optimising public traffic, changing bus routes to more efficient ones, creating mobility centres, creating bus lanes and tramways, eco-driving for public transport drivers etc.) Improving existing transport infrastructures (e.g. developing new cycling paths, bicycle parking, pedestrian zones and sea motorways ) A few countries, such as Spain and France, have introduced sustainable urban mobility plans. Other countries have proposed to introduce mobility plans, such as Greece and Bulgaria (in Bulgaria it is called municipal programmes for public transport optimisation). Mobility management can be incorporated in mobility plans. The European Platform on Mobility Management (EPOMM) is an international partnership that aims to promote and further develop mobility management in Europe. According to EPOMM mobility management is a concept to promote sustainable transport and manage the demand for car use by changing travellers attitudes and behaviour. At the core of Mobility Management are "soft" measures like information and communication, organising services and coordinating activities of different partners. 7 Some countries have introduced urban mobility plans at a local level targeting specific groups or area, e.g. schools and companies in France to promote the use of public or collective transport either through information provision or grants and subsidies. In Malta proposed Green travel plans for the public sector target specifically government employees and large employers in the Valletta/Floriana area. In Belgium, the Flemish government intends to develop cross-network collection services for the transport of schoolchildren. In Spain, the Action Plan , includes a measure on Transport Plans in firms and activity centres that aims to establish transport plans for all firms and activity centres (such as industrial estates, leisure centres, hospitals, educational centres), to reduce the number of journeys from low-occupancy private cars from and to the workplace / study place. 7
24 4 Vehicle Efficiency 4.1 Cars Measures to improve the efficiency of cars are generally undertaken at the EU level. As discussed in section 2, the key EU policy to improve the efficiency of cars is a 2009 regulation 8 which sets CO 2 limits for new passenger cars from passenger cars from By 2015 the fleet average (for each manufacturer) for new passenger cars must be less than or equal to 130 g CO 2 /km with a long term target of 95 g CO 2 /km in Intermediate targets are also set, by 2012, 65% of each manufacturer s cars must comply with the 130 g CO 2 limit value, 75% in 2013 and 80% in Manufacturers who exceed the limit will have to pay an excess emissions premium for each car registered. This premium amounts to 5 for the first g/km of exceedance, 15 for the second g/km, 25 for the third g/km, and 95 for each subsequent g/km. From 2019, the first g/km of exceedance will cost 95. The Directive was brought in after a target (of an average emission of 140 g CO 2 /km for new cars sold in 2008), set in an earlier voluntary agreement with the three main car manufacturers associations for Europe, Japan and Korea 9 was not achieved. Incentives to encourage the uptake of more fuel efficient cars, such as graduating car purchase tax and road tax on the basis of fuel consumption or CO 2 emissions, and raising consumer awareness through the labelling of cars with their fuel efficiency and CO 2 emissions are discussed in Section 5. Other EU measures to improve the efficiency of cars as driven in the real world include legislation on tyres and gear shift indicators. A 2009 regulation 4 requires all new car models to be fitted with tyre pressure monitoring systems by November 2012 and all new cars by November The systems will alert the driver when the tyre pressure falls by 20% from its normal warm running pressure, as under-inflated tyres can increase fuel consumption. Tyre pressure monitoring systems are estimated to reduce CO 2 emissions by around 2.5% for a typical car (Álvarez, 2008). The same Regulation requires all new car models to be equipped with low rolling resistance tyres by November 2013, and all new cars by November A second phase, with stricter rolling resistance limits, will apply for new car models from November 2017 and all new cars from November Additional consumer information will be provided by a tyre labelling scheme which will enter into force in The fuel efficiency (rolling resistance), wet grip and external rolling noise performances of tyres will be displayed by means of a grading (A-G scale). Expected fuel savings from the increased use of fuel efficient tyres are estimated at between 2.4 and 6.6 mtoe (million tonnes of oil equivalent) in 2020 depending on the speed of market transformation. The technical CO 2 reduction potential of gear shift indicators is estimated at 6%, but real reductions will be lower than this, depending on the degree to which drivers respond to the indicator. All new car models should have gear shift indicators by 2012 and all new cars by Regulation (EC) No 443/2009 of the European Parliament and of the Council of 23 April 2009 setting emission performance standards for new passenger cars as part of the Community's integrated approach to reduce CO2 emissions from light-duty vehicles 9 European Automobile Manufacturers Association (ACEA), Japan Automobile Manufacturers association (JAMA) and Korean Automobile Manufacturers Association 10 Regulation (EC) No 1222/2009 of the European Parliament and Council of 25 November 2009 on the labelling of tyres with respect to fuel efficiency and other essential parameters 11 Regulation (EC) No 661/2009 of the European Parliament and Council of 13 July 2009 concerning type-approval requirements for the general safety of motor vehicles, their trailers and systems, components and separate technical units intended therefore
25 4.2 Vans and HGVs Vans A similar regulation to that setting a limit for CO 2 emissions from cars was adopted for vans in May The regulation will cut emissions from new vans to an average of 175 g CO 2 /km by 2017 with the reduction phased in from and to 147g CO 2 /km by Similar penalties as for passenger cars apply to manufacturers exceeding the limit. The Vans Regulation gives manufacturers additional incentives to produce vehicles with extremely low emissions (below 50g/km). Each low-emitting van will be counted as 3.5 vehicles in 2014 and 2015, 2.5 in 2016 and 1.5 vehicles in HGVs In the case of heavy goods vehicles (HGVs), there is no EU wide legislation to improve fuel efficiency. This is partly because agreeing emissions standards for HGVs is much more complex for HGVs than cars, as the HGV fleet is much more heterogeneous than the car fleet. There is a diversity of body types, and several types of gross weight class, axle numbers and variations in the nature of auxiliary equipment, meaning that there is a large degree of variety, particularly for articulated vehicles. Such vehicles typically combine subsystems (engines, vehicle body, trailers and ancillary equipment such as refrigeration) produced by different manufacturers, and individual manufacturers therefore, have much less control over the fuel performance of the final lorry than their counterparts in the car sector (McKinnon, 2008). A number of countries have sought to improve the energy efficiency of HGVs and the efficiency with which they are operated however, using a variety of policies and measures. Box 4.1 gives details of a subsidy scheme in Denmark aimed at improving the aerodynamic performance of trailers, and of a competition run in the UK to bring the developers of some of the most promising technologies for improving fuel efficiency to the attention of key vehicle and component manufacturers and fleet operators. An approach being trialled in Denmark and the Netherlands focuses on improving the overall efficiency of freight transport is the use of longer road trains (or longer heavier vehicles). While European legislation controls the maximum dimensions of vehicles, and the maximum weight that guarantees free circulation within the EU, it permits trials and the use of longer, heavier vehicles under certain strict conditions within national boundaries. Long road trains of 25m are permitted on the major part of the road network in Finland and Sweden, where transport distances are often large, and are also used in Germany. The trial in Denmark, which began in 2008, has allowed longer road trains on a limited road network consisting mainly of motorways and other intercity roads, but also a number of roads connecting company sites to the designated road network. The longer road trains offer fuel savings of 15% per tonne km. In the Netherlands, a large scale five year trial, which will end in November 2012 has been assessing, fuel savings and impacts on traffic safety, infrastructure and modal split (see Box 4.2). To date, experience has been positive and if the final evaluation confirms this, then longer heavier vehicles will become the normal combination in the Netherlands. 12 Regulation (EU) No 510/2011 of the European Parliament and of the Council of 11 May 2011 setting emission performance standards for new light commercial vehicles as part of the Union's integrated approach to reduce CO2 emissions from light-duty vehicles
26 Box 4.1 Schemes to encourage energy efficient technologies for HGVs In Denmark, the Danish Transport Authority began operating a 5.6 million grant scheme in 2010 to subside the price of aerodynamic devices for trucks and trailers. Initially subsidies have been paid for side skirts for trailers and low floor volume trailers; but are likely to be expanded to include rearmounted devices aimed at reducing rear drag. Subsides are 55 % of the price of side skirts for trailers, up to a maximum of about 2000 per vehicle. Fuel savings from side skirts are estimated to be about 5% and with the subsidy, payback times are about one and a half years. However, only a moderate interest has been shown, and the Danish NEEAP reports that applications for subsidies were only 40,000. In the UK the Low Carbon Vehicle Partnership, which is a public-private partnership that exists to accelerate a sustainable shift to lower carbon vehicles, ran a competition for supply chain companies and technology suppliers offering technologies which could reduce CO 2 emissions from heavy goods vehicles by around 20%. The technologies also needed to be able to be commercially deployed in 3 5 years; be on-vehicle; and be compatible or easily integrated into the existing transport, energy and fuel infrastructures. The prize was for the companies to present winning innovative products to a group of key vehicle and component manufacturers and fleet operators, thus helping them to identify the most promising technologies that reduce fuel consumption. The solutions include products to: use dual fuel (gas-diesel); improve trailer designs to increase carriage capacity and also to reduce drag; optimise driving efficiency though use of a dynamic throttle control system; adopt a hybrid-hydraulic power-train and a separate hybrid systems based on high-speed flywheels. Source: MURE, Danish NEEAP, and LCVP website ( Box 4.2 Trial of longer and heavier goods vehicles in the Netherlands A longer and heavier good vehicle (LHV) or Ecocombi, can be up to m long with a weight of 60 tonnes, whereas (in the Netherlands) an ordinary lorry is at most m long, with a weight of 50 tonnes. The Ecocombi vehicles are able to combine parts that are standard throughout Europe so the additional costs of assembling the parts of the vehicle are relatively low. The vehicle parts can also be used separately as normal vehicles, making this a flexible concept. As the fuel consumption of an Ecocombi is only marginally higher than the consumption of an ordinary lorry, transport of goods with an Ecocombi saves 4 to 30 % on fuel per lorry. A large-scale trial of LHVs started in November 2007 and will end in November There are a number of requirements for participation in the trial. The LHV drivers must take additional examinations, and vehicles must have electronic braking systems, axle load meters and appropriate markings. The LHVs are only permitted to use motorways and main roads to commercial sites. An intensive evaluation in close cooperation with hauliers participating in the scheme has demonstrated that the use of LHVs has been unproblematic. They are hardly noticed in daily use, more than 90% weigh no more than 50 tonnes and there have been no incidents that can be related to the additional length or weight of LHVs. This suggests that LHVs are a cost-effective solution particularly for bulk transport and for distances of over 75 km. In the Netherlands the largest users are retailers, flower transporters and container transporters. If the trial continues to demonstrate positive results for the environment and no negative effects on traffic safety, the infrastructure and the modal split, longer heavier goods vehicles will become the normal combination in the Netherlands. Another approach taken to improving the overall fuel efficiency of freight transport is the use of voluntary agreements. In France, a voluntary agreement charter, drawn up in partnership with the trade associations, the National Federation of Road Carriers (FNTR) and the Federation of the Haulage Companies and Logistics of France (TLF) was launched in The number of companies signing the charter has risen significantly each year, and by the end of 2010, 233 road transport companies running more than vehicles had signed up. Companies make a commitment for 3 years, developing a plan with concrete actions to decrease their fuel consumption. The target reductions agreed by the end of 2010 equate to a reduction of around 8% in fuel consumption per unit of activity. In Finland, the
27 Government has an Energy Efficiency Agreement for Freight Transport and Logistics, with the Finnish Transport and Logistics (SKAL) and its member associations, the Association of Logistic Enterprises in Finland (LL) and the rail company VR. The agreement which covers the period is a continuation of former agreements and programmes in the sector; and is intended to realise about one-third of the total savings target for the transport sector set in the NEEAP. It sets a numerical target for participants of a 1% annual improvement from 2008 to 2016 in the specific energy consumption (MJ/tonne-km) of freight transport, and the aim is for 60% of the companies or registered vehicles in the sector to be covered by the agreement. Rather than signing an agreement, companies register by joining EMISTRA 13 (Use of the Energy and Environmental Accounting and Reporting System for Transport and Logistics Sector), a nationwide energy and environmental accounting and reporting system for transport and logistics businesses. In Denmark businesses and municipalities can commit to a reduction in fuel consumption though the green certification scheme implemented by the Danish Transport Authority. To achieve certification, participants, must map their fleet and fuel consumption and set a CO 2 reduction target to be achieved within the following year, with an action plan detailing the CO 2 reducing projects to be implemented e.g. by introducing more energy efficient vehicles and making more efficient use of existing fleet. They must evaluate and report progress after one year, after which they can be recertified if they achieve their goal and set a new CO 2 reduction target for the following year. 4.3 Public transport In Finland, the voluntary agreements approach used in the freight sector is also being used to improve energy efficiency in the public transport sector. In Finland, there is a voluntary agreement between the Government and the Finnish Bus and Coach Association (LAL) and the VR rail company (long-distance transport), which individual companies join by signing an Association Agreement. The aim is for 80% of public transport in 2016 to be covered by the agreement and for signatories to achieve a 1% annual reduction in energy consumption in the public transport covered by the Agreement during the period. Participants must adopt a recognised environmental management system, such as ISO 14001, EMAS or BAK, must report their fuel consumption and other energy consumption data into a database, to allow monitoring of energy efficiency. Annual monitoring reports will be prepared, and after every three years, the scheme will be evaluated to establish whether it needs to be reviewed. France is also planning to extend the scheme where road transport companies make a commitment to reduce CO 2 emissions to road passenger transport. More generally, in the longer term improvements in the energy efficiency of public transport fleet should be aided by the European Directive 2009/33/EC on the promotion of clean and energy-efficient road transport vehicles. This requires that public authorities and some other operators, take into account the impact of energy consumption, CO 2 emissions and other pollutant emissions during the operational lifetime of the vehicles, either by setting technical specifications for energy and environmental or including energy and environmental impacts in the purchasing decision. As public transport fleets are renewed then this should lead to an overall improvement in the energy efficiency of the fleet. This could be of particular importance in some of the newer Member states, where public transport has a relatively high share of passenger mobility, but the fleet is relatively old and inefficient. In Estonia, renewal of the public transport fleet has been aided by revenue from the sale of assigned amount units (AAU) to Spain under a green investment system (GIS). From the first sale in July 2010, 21million were invested in about 100 energy efficient and environment friendly buses which will be replacing the most out-of-date vehicles in use on regional and outlying urban routes. 45 million from the second sale in May 2011 will be invested in about 15 modern 13 At publication of this report the EMISTRA monitoring and reporting system has been replaced by PIHI monitoring and reporting system. The basic principle of joining through registering to the system has not changed, just the tool has. The name will be updated in the MURE database shortly.
28 city trams, for the city of Tallinn which will use electricity generated from renewable energy sources. Currently, the average age of trams in Tallinn is 25 years.
29 5 Encouraging Uptake of Cleaner Vehicles 5.1 Labelling The majority of labelling policies are aimed at passenger cars, however there are a few policies that are aimed at tyres, road freight vehicles, and France has a labelling policy for aviation. There are 34 transport related labelling policies in the MURE database, 80% are related to new vehicles and 70% are aimed at cars or passenger vehicles. Car Labelling The EU vehicle labelling Directive 14, requires for new passenger cars that: information on fuel economy and CO 2 emissions is shown on a fuel economy label to be displayed at the point of sale; a guide on fuel economy and CO 2 emissions should be available at the point of sale and from designated bodies; a poster (or a display) showing the official fuel consumption and CO 2 emissions data of all new passenger car models displayed or offered for sale or lease at, or through, the respective point of sale; all promotional literature must contain the official fuel consumption and specific CO 2 emission data for the passenger car model to which it refers. These minimum requirements have been implemented in all Member States, but some have gone beyond the Directive in terms of additional legislative and voluntary requirements for the information tools. This is discussed in more detail in Box 5.1. In addition some countries have extended the car labelling scheme. For example, Denmark has extended the scheme to Light Goods Vehicles (see Box 5.2). The UK enables a label for used cars to be generated on a voluntary basis including the same information as the required label for new passenger cars (data are available for cars registered from 2001). An online database was initially developed by the Low Carbon Vehicle Partnership (LowCVP) with support from the Retail Motor Industry Federation, the Society of Motor Manufacturers and Traders and the UK government; the scheme was originally run by the Vehicle Certification Agency (VCA), but is now provided by two external organisations. Dealers register with the organisation, and can them submit registration details for the used vehicle online to receive a label; participation is free. Finland also has a scheme for labelling used cars, and France is considering introducing a mandatory label for used car registered from In Finland, a revised energy label looking at CO 2, which more closely resembled the energy efficiency labels for consumer appliances, was introduced in Use of the new label, which makes comparison between cars of different sizes easier as ratings also take into account the vehicle weight, is voluntary. As well as fuel efficiency data, the EU CO 2 emission limit for the same weight category is given, together with emissions of pollutants and fuel costs based on an assumed annual mileage (of km mileage per year). 14 Directive 1999/94/EC on )Passenger Car Labelling on fuel economy rating

30 Box 5.1 Car labelling - differences in implementation While some countries simply require a label that lists the required information (e.g. Hungary), others have prescribed a format. Several countries have based the label on the household product energy labelling format, a comparative label that uses colours in a scaled format. Some countries (e.g. Denmark, France, Romania and the UK) use an absolute label format, whereby each car is categorized according to a comparison against all cars, but others (e.g. Germany and Spain) use a relative scheme is where a car is categorized according to a comparison of similar cars. Denmark plans to revise the label requirements in 2012 to include 3 new classes to the label, A+, A++, and A+++, as over 50% of new passenger cars in 2010 were rated as class A. Some Member States (e.g. UK, Germany, Denmark, and Finland) include additional information on running costs, including fuel cost and vehicle circulation tax. Germany requires an indication of the electricity consumption, which aims to address the increasing development of electric mobility. The CO 2 emissions of electric vehicles are currently listed as zero on the labels (as based on tail pipe emissions), so this action aims to provide more relevant information to the consumer All countries produced a printed guide to the fuel economy of cars, but many (e.g. Spain, Poland, UK, Belgium, and Denmark, France) also provide a searchable online database. This has the advantage that it is far more easily (and cheaply) kept up to date than printed guide, which may take several months to prepare. It can also be easier for user to find and compare information on different vehicles of interest using such a database. Additional measures taken by countries with regards to promotional materials include a requirement in Denmark for advertising to include (as well as the mandatory information on CO 2 and fuel consumption), the colour coded arrow indicating the cars energy class (with a minimum size specified). Example of Danish car advertising with inclusion of colour coded arrow
31 Box 5.2 Extending labelling to vans in Denmark In 2010 the Danish Transport Authority expanded legislation on labelling of cars to also cover light goods vehicles (vans) up to 3,500kg: The main reasoning behind the application of the label to vans was that vans are included in the annual taxation system used for passenger vehicles, and it was therefore logical to bring them into the same labelling system. Vans are also often bought for noncommercial reasons in Denmark. The labelling scheme uses the same fuel economy classes as are used for labelling cars. The implementation authority, the Danish Transport Authority (Trafiksytrelsen), acknowledges that labelling of vans is more troublesome than for passenger cars due to the number of model variants for example there may be more than 20 variants of a model, so that e.g. in July 2011 there were 3735 different vans listed on the official website ( with energy labels. However, each type of van that is available for purchase from a showroom must have an official energy label. If the information is not available for fuel consumption of that specific model then a formula is applied to estimate the fuel consumption per km. This estimation will result in a higher annual tax than if they were able to calculate fuel consumption. Typically manufacturers are able to provide information on the fuel consumption of a van under various different configurations so this is not a problem The labelling of vans in Denmark applies to the vehicle on display. The information on labelling is also available online as in the same format as for passenger cars. However, other elements of the EU car labelling legislation have not been implemented for vans. For example a hardcopy guide is not produced for vans nor is it a requirement for a poster display at points of sale. Sources: MURE database; AEA and TEPR (2011) 5.2 Taxation Road transport One of the most common fiscal instruments used to encourage the uptake of more energy efficient vehicles or modal shift is taxation. In the case of road transport, a wide range of taxes apply, including: annual circulation tax (road tax), vehicle purchase tax, infrastructure charge (tolls on specific parts of the network, e.g. motorways, tunnels, bridges), parking fees, congestion charge, company car taxation fuel excise tax insurance tax Car Purchase and Circulation Taxes The two most commonly used tax related policies to encourage the uptake of cleaner vehicles are differentiation of car registration taxes paid on purchasing a car, and annual circulation tax on the basis of energy efficiency. Historically, car purchase taxes in most countries were usually linked to the type of fuel, size of car and status (private versus company). However 16 Member States and Norway have now introduced registration taxes which are dependent on the fuel efficiency or CO 2 emissions of the vehicle. These vary from systems offering rebates for cars with low CO 2 emissions and surcharges for high CO 2 emissions to simple banding systems based on CO 2 emissions, and to systems where tax is calculated as the product of CO 2 emissions per km and a value per g of CO 2, which increases the higher the CO 2 emissions rate. There are also hybrid systems which also take into account engine size or the classification of the car for other emissions. In the case of Austria, which was the first Member State to introduce a differentiated, scheme based on fuel
32 consumption in 1992, the tax was reformed in 2008 to a bonus/malus system where cars with relative low CO 2 -emissions get tax breaks and cars with higher CO 2 -emissions have to pay a higher tax. Fewer Member States (seven) have a differentiated system for annual road tax. Table 5.1 Date of introduction of differentiated tax rates Year Member States Car Purchase Tax 1992 Austria 2000 Denmark 2002 UK (company cars) 2006 Cyprus, France, Netherlands, Portugal 2007 Luxembourg, Norway 2008 Spain, Finland, Ireland 2009 Germany 2010 Greece, Latvia, Slovenia, UK (private cars) 2012 Belgium Annual tax 1997 Denmark 1998 UK 2006 France (company cars only), Sweden 2008 Netherlands, Ireland 2010 Finland Infrastructure Charges While a number of countries have some toll roads where a charge is made for all vehicles using the road, a number have introduced tolls specifically aimed at heavy goods vehicles, with the aim of encouraging the use of less polluting vehicles, maximising the efficiency of freight distribution, and encouraging modal shift of freight. Examples of such schemes in the New Member States are given in Box 5.3. One of the most innovative schemes, which is much more targeted, is the distance based HGV toll system in Germany which uses GPS satellite systems, rather than conventional toll booths, and links charges to the vehicles emissions category. Revenue from the system is intended to be used to subsidise rail and water transport infrastructure. More details of the scheme are given in Box 5.4. France is also introducing a levy on HGVs to encourage modal shift for long distances transport and improvements in freight logistics. Legislation in 2009 paved the way for the introduction of a charge on a per kilometre basis for HGVs using the national road network (where tolls are not already in place). The levy collected will be allocated to the Agency responsible for the national road network to finance improvements in the road infrastructure. It is planned that implementation and operation of the scheme will be carried out by a third party, under a public-private partnership contract, but due to legal challenges in the process of appointing a supplier, the scheme has not yet begun. It is hoped that these issues will be resolved in time to introduce the charge in 2013.
33 Box 5.3 Tolls for HGVs in new member states Latvia is planning to introduce tolls for vehicles above 12 tonne for the use of motorways (with some exemptions e.g. for vehicles transporting agricultural and timber products). Tolls are based on the Euro class of the vehicle (and no. of axles) with less polluting vehicles (Euro IV and above) paying about 75% of rates for the most polluting vehicles, and are on a time basis (e.g. weekly, monthly, yearly) rather than distance based. Initially due to be introduced in 2011, implementation has now been delayed to A tool will be used to maintain and develop the motorway. Poland introduced a toll for HGVs above 12 tonne for use of the national road network, again on a time basis. Vehicles are split into two classes Euro 0 and 1, and Euro 2 and above, with the annual rate for the less polluting vehicles being about 80% of that for older vehicles. The rate is about 760 per year for Euro 0&1 vehicles and 630 per year for Euro 2 and above vehicles. There are separate km based charges for toll motorways, but these take no account of the age of the vehicle. Box 5.4 Heavy goods vehicle toll charges in Germany Tolls for heavy goods vehicles (with a gross vehicle weight of 12 tonnes or more) were introduced at the start of 2005 in Germany. All users of the German toll road network, irrespective of their country of origin, must pay for the distance travelled on toll-routes. Since 2009, substantial differentiation has been introduced into the toll rates, to take account of the truck s emission category and number of axles, and charges vary between 0.14 and 0.29 per kilometre. The average rate is about 0.163/km, representing a significant increase from the average rate pre 2009 of 0.135/km (Kfz- Auskunft 2008). The toll system is organised by Toll Collect ( and a number of payment methods have been set up in order to ensure that collection of road tolls does not disrupt traffic flow, by requiring vehicles to slow down or stop, or restrict them to a designated lane. Vehicles regularly using the toll network can be fitted with an on board unit, in which the driver confirms a small amount of data before the start of the journey. Using GPS satellite signals and other positioning sensors, the on board unit identifies the route segments travelled, calculates the toll charges due and transmits this information by mobile communications to Toll Collect for invoicing. Vehicle users may also log their journey in advance over the internet, or at around 3,500 toll-station terminals located close to toll-route entry points, at motorway/trunk road services and lay-bys and at fuel stations in Germany and in bordering countries. It was originally estimated that the introduction of tolls would save about 33 PJ (or 2.4 Mt. CO 2 ) in 2010, with savings increasing by 2.7 PJ once stronger differentiation of the levy was introduced (Öko- Institut et al.2008, 2009). In the second German NEEAP (BMWi, 2011) the impact of the measure is quantified as much smaller however, saving only 5 PJ per year. On board unit and toll station kiosk Source: Source: MURE data base, NEEAP
34 Company car taxation Box 5.5 Company car CO 2 taxation in UK Employees provided with a company car by their employer must pay tax on the value of the benefit of having that car. In April 2002, the UK Company Car Tax system which determines the tax that must be paid was revised to make it carbon-based. The aim was to incentivise the purchase of energy efficient vehicles and to remove a perverse incentive in the previous system which led to unnecessary business miles being driven in order to reach the threshold mileage for obtaining a reduction in tax. It was reformed again in 2009 to set new rates of company car taxation for 2011/12 onwards. Company car tax is calculated by applying the appropriate percentage to the list price of the car. The appropriate percentage is related to the CO 2 emissions of the car and ranges from 15 per cent (for cars with lower CO 2 emissions) to 35 per cent in 1 per cent increments for every 5g/km of CO 2 emissions for a petrol car. Most diesel cars attract a 3 per cent supplement (though the maximum is also capped at 35 per cent). A lower rate of 10 per cent for cars with CO 2 emissions of exactly 120 g/km or less (13 per cent for most diesels) was introduced from 6 April 2008 to promote environmentally friendly vehicles. These cars are known as qualifying low emissions cars (QUALECs). A lower rate of 9 per cent applies to electrically propelled cars, and there are also discounts for electric/petrol hybrid cars and Euro IV standard diesel cars registered before 1 January Discounts were also given to cars propelled by bi-fuels, road fuel gas and bioethanol, although these reductions have now been removed. Over the next few years the criteria for lower tax rates will gradually be made more stringent, as shown in the Table below. Pre / / /14 Lowest rate 0% for zero emissions cars 0% for zero emissions cars 0% for zero emissions cars 5% rate <75 g/km <75 g/km <75 g/km 10% rate < 120g/km or 76 to 120 g/km 76 to 99 g/km 76 to 94 g/km less (then 1% extra for each 5 g/km) 15% rate 130g/km 125g/km 120 g/km 115 g/km 35% rate 230 g/km 225 g/km 220 g/km 215 g/km According to the HMRC (2006) Report on the evaluation of the Company Car Tax Reform, it is leading to significant reductions in CO 2 emissions from cars. This was around MtC for 2005 and exante predictions were that this might increase to around MtC for 2010 and reach a maximum level of savings in the long run of around MtC per year towards the end of the next decade. Average CO 2 emissions figures from company cars were around 15g/km lower in 2004 than would have been the case if the reforms had not taken place. Around 60% of company car drivers who were given a choice of company car by their employers were influenced by the Company Car Tax reform and as a result chose cars with lower CO 2 emissions figures. There are a wide range of different effects from the Company Car Tax reform and a full evaluation will take a number of years. This is because company car drivers typically change their cars on a three to four-year cycle, after which company cars then penetrate the second-hand private market Aviation Only a few countries have taxes on air travel. The UK introduced the UK Air Passenger Duty, as an environmental tax in 1994, with current charges depending on the distance travelled ranging from 30 for short haul to 218 for long haul 15. More recently Austria has introduced a levy. The Austrian Aviation Tax (Luftverkehrsteuer) was introduced in April The tax is levied on all departing flights in Austria operated by commercial airlines. The charges per passenger are 8 for short-haul, 20 for mid-haul and 35 for long-haul for short haul to 188 for long haul converted at 1= 0.86
35 flights. France also has a flight tax but it is relatively low at only 2 per person and is not differentiated by distance. Aviation taxes were introduced in the Netherlands in July 2008, resulting in ticket price increases ranging from to 45 per ticket. However the tax was withdrawn from July 2009 due to doubts over its efficacy, as instead of reducing the number of flights taken, there was evidence that travellers were using airports in neighbouring countries (Belgium and Germany) where there was no tax 16. From the start of 2012, emissions from all domestic and international flights that arrive at or depart from an EU airport are covered by the EU Emissions Trading System. In addition to the 27 EU Member States, the EU ETS for aviation covers three EEA-EFTA States (Iceland, Liechtenstein and Norway) and will extend to Croatia by 1 January 2014 due to the country's planned accession to the EU on 1 July Like industrial installations, airlines will receive tradable allowances covering a certain level of CO 2 emissions from their flights per year. After each year operators must surrender a number of allowances equal to their actual emissions in that year. 5.3 Electric vehicles The range and magnitude of incentives for the uptake of electric vehicles is particularly wide and may consist of grants, reductions in taxes and exemptions from taxes and other charges (e.g. parking charges). Some countries use a combination of different measures; for example Portugal awards a premium for purchase of electric vehicles, as well as exempting them from circulation and registration taxes. There are over 40 policies spread across 16 EU countries aimed at increasing the uptake of electric vehicles, nearly half of which were put in place since Of the total policies, three quarters are still ongoing and more are planned to start in A definition of the different types of electric vehicle is set out in Box 5.6. Studies 17 indicate that the most significant barriers to the uptake of electric vehicles relate to: High upfront cost: the premium is currently around 15,000 to 40,000, per vehicle, potentially decreasing to 5,000 in the longer term (ETC, 2009). The cost of charging an electric car is lower than the cost of refuelling a petrol vehicle; however, there is extensive evidence that consumers are more influenced by purchase prices and do not take into account savings over the lifetime of the vehicle (Ecolane, 2011). Issues related to charging: limited range, inconvenient charging and lack of charging infrastructure. Range anxiety is the fear of being stranded due to insufficient battery capacity. Electric vehicles will usually meet the daily needs of most users, however, typical home charging points take 7-8 hours to charge a battery, which can be inconvenient. 16 Egmond, and de Jong, Aviation Taxes, Capgemini Nederland B.V, Utrecht 17 Studies include: Element Energy, 2009; ARUP, 2008 and FIA, 2011.
36 Box 5.6 Definition of electric vehicles The term electric vehicles may encompass several different types of configuration including: Battery electric vehicles (BEV): run on the battery alone, and have no auxiliary on-board power. Extended-range electric vehicles (EREV): the battery is the main energy source, but a combustion engine driven range-extender running on hydrocarbons is used to sustain the battery where distances exceed the electric range. Plug-in hybrid electric vehicles (PHEV): the battery is the main energy source, but a combustion engine running on hydrocarbons is used after batteries are depleted. Conventional hybrid electric vehicles (HEVs), where the drive comes from the internal combustion engine as opposed to the electric motor, are not in this study considered to be electric vehicles, but may still be included in the scope of some EU policies Grants To address the high upfront costs of electric vehicles, the most frequently used financial incentives are: 1. Reductions in car registration tax (covered in section 5.2 above) 2. Reductions in annual circulation tax (covered in section 5.2 above) 3. Grants at the point of purchase. Grants for the purchase of electric vehicles have received much attention in Europe. Grants at the point of purchase refer to bonuses or reductions in price when a vehicle is bought, as opposed to other measures where the consumers claim a rebate back later e.g. through reductions in personal income tax. In the UK, the maximum level of subsidy is 5,000 ( 5,720) or 25% of the vehicle purchase price. The total budget is 43 million ( 49.2 million), which would support the sales of 8,600 vehicles assuming each EV purchaser receives the maximum subsidy of 5,000. Luxembourg offers up to 3,000 per vehicle provided the purchaser agrees to buy electricity from renewable energy sources. In Portugal, purchasers of the first 5,000 electric vehicles can receive a premium of 5,000, and could qualify for an additional 1,500 if they simultaneously scrap their old car. The UK implemented its Plug-in Car grant scheme in January 2011 to encourage the uptake of ultra low emissions vehicles (ULEVs). Box 5.7 provides a summary of the scheme. Spain has implemented a grant scheme to encourage the uptake of EV and PHEV, allowing grants of up to 6,000 per electric vehicle. This action is funded with an M 240 budget (M 80 in 2011 & M 160 in 2012). The grant scheme is part of a wider strategy to increase the uptake of electric vehicles see Box 5.8 for details Infrastructure Public charging infrastructure is an important means of counteracting range anxiety, which is the fear of being stranded due to insufficient battery capacity. Although most trips can easily be accommodated by modern electric cars, consumers prefer to buy cars that are capable of covering much longer distances. For instance, over 80% of car journeys are below 20km, and most Europeans drive less than 40km per day (ETC, 2009). Vehicle range and inconvenient charging, are starting to be addressed by improvements in technology, for example extended range vehicles, fast charging 3-4 hours and rapid charging 30 minutes as opposed to 7-8 hours slow charging, and new business models such as battery hire combined with battery swapping stations reducing charging time to several minutes.
37 Lack of charging infrastructure is being addressed by a number of EU countries by implementing regional policies and programmes to increase access to charging points along strategic transport routes and in major cities, as uptake of electric vehicles is likely to be higher in cities compared to rural areas. For example schemes to increase the availability of charging points have been implemented in Amsterdam, Berlin, London, Paris, Switzerland, and Denmark (see Box 5.9). City programmes serve as demonstration projects to gather data on consumer behaviour which can be used to improve subsequent projects. City authorities may partner with a private firm to ensure consistency and compatibility across all charging points. In many cases, access is controlled by cards which enable users to be billed on a subscription or pay-per-use basis. Standardisation is a particular concern in terms of battery layouts and plug design, as a harmonised standard will likely need to be in place before significant rollout. The European Standardisation Organisation has been mandated to develop a common charging system. A further issue is related to the use of a common billing system in order to ensure interoperability between different areas. Box 5.7: UK Plug-In Grants The Plug-In Car Grant 18 commenced in January 2011 to help both private consumers and businesses purchase an electric, plug in hybrid or hydrogen fuelled car. Motorists purchasing a qualifying ultra-low emission car are able to receive a grant of 25% of the vehicle price, up to a value of 5,000. These vehicles will, initially, be more expensive 'up front' than conventional cars due to low production volumes and the high cost of the battery. The grant will help to provide a more level playing field for new technologies, until the growing market drives purchase costs to a more competitive level. There is funding provision of around 300m to support consumer incentives over the lifetime of the Parliament. The approach is technology neutral. This means that cars with tailpipe emissions of 75gCO 2 /km or less, including electric, plug-in hybrid and hydrogen-fuelled cars are all potentially eligible for the subsidy. However, hydrogen-vehicles are, as yet, less available on the open market than electric and plug-in hybrid options. Currently five approved vehicle models are available on the UK market, all of which are BEV, it is expected that five more approved models will become available in 2012, one of which will be EREV and one PHEV. As of 30 th September 2011, 786 claims have been made through the Plug-In Car Grant scheme, with Society of Motor Manufacturers and Traders (SMMT) data showing that 910 cars eligible for the Grant were registered over the same period. Relative to the number of ultra-low emission cars registered in previous years, this is a step change and is part of a wider trend in the uptake of alternatively fuelled vehicles. SMMT data also shows that alternativelyfuelled vehicles represent a growing share of the total market, with registrations rising to 1.3% market share after a 9.1% rise in volumes over the year to date. 18 See DfT Plug-in Car Grant
38 Box 5.8: Integral strategy to encourage uptake of EV/PHEV in Spain The Spanish Strategy has set the goal of putting one million hybrid and electric vehicles on the nation s roads by 2014, with 250,000 of these as battery electric vehicles and Plug-In Hybrid Electric Vehicles (BEVs & PHEVs). This goal represents a very ambitious and firm commitment from Spain to promote alternative technologies in the transportation sector in general and, specifically the uptake of electric vehicles. The Programme also aims to increase access to charging infrastructure by 2014 to 62,000 charging points in homes; 263,000 points in fleet parking lots; 12,150 in public car parks and 6,200 on public thoroughfares. It is also envisaged that one in every 400 charging points for private cars will be a fast charging point, reaching 160 charging points by The Spanish government expects that introducing EVs to the nation s roads could halve the amount of oil that it would need to import, reducing the nation s current trade deficit by 25%. Moreover, Spain would achieve savings of 81 Mt CO 2 /year, which translates to 1,000 M /year in CO 2 emissions. The plan has the objective of developing a social, technical and knowledge frame for the implementation of EVs in Spain. The interim targets are to achieve 70,000 EVs/PHEVs (63,000 in fleets and 7,000 for citizens) on the road and 108,850 charging points in Spain for To reach these numbers, a budget of 590 million will be applied to four action lines as follows: Action lines 1) Boosting demand and promotion of the EV 2) Support for research, development and industrialisation of the electric vehicle Measures include: Purchase allowances up to 6,000 to buy electric vehicles. This action is funded with an M 240 budget (M 80 in 2011 & M 160 in 2012). Entrepreneurial plans whose target is the electric vehicle will be given priority. It is planned to allocate M 140 in 2011 and 2012 Support plans to communication technologies linked to the EV (between the electric grid and the vehicle), that optimise charging. The envisaged budget for this action amounts to M 35 (M 17.5 in 2011 & M 17.5 in 2012). Identify and analyse key technologies and promote them in entrepreneurial and research fields. Budget M 173 (M 86.5 in 2011 and M 86.5 in 2012). 3) Development of the charging infrastructure and its energy management Voluntary agreements with electricity suppliers for a new super off-peak electricity charging fee. Set up a governing body to specify and regulate charging and/or battery replacement, charging stations and possible services to be provided in parking lots and charging in public areas. 4) Cross cutting issues: Marketing, Standards and capacity building Marketing and communications M 2 (M 1 in 2011 and 1 M 1 in 2012). Standardisation of charging infrastructure, vehicles and components. Academic and professional training Source: Adapted from MURE
39 Box 5.9: Examples of charging infrastructure schemes In Switzerland, the basic Park & Charge network uses standard slow chargers. Electric vehicle owners in Switzerland reportedly make use of Park & Charge spaces at least once a week for around two hours, although some owners use the reserved parking spaces without recharging their vehicles (Element Energy, 2009). Around 200 standard charging points were built in Paris in the 1990s. Access is controlled by chipcards. Evidence suggests that the public provision of slow charging stations in Paris has had limited impact on electric vehicle adoption (Element Energy, 2009). Two test cases have started in Berlin, with a view to better understanding user requirements. One was initiated by RWE (a major utility) in partnership with Daimler and the other by Vattenfall (a Swedish utility) in partnership with BMW. The car manufacturers have developed battery powered cars while the utilities are installing charging infrastructure. The city of Berlin has mandated the interoperability of the two networks, which are based on semi-fast infrastructure with the option of upgrading to rapid charge. Supporting multiple providers has the advantages of fostering competition and avoiding early lock-in. In 2010, 70 spots had been installed by RWE and 30 by Vattenfall. In Denmark, project Better Place is planning to build a nationwide grid of battery switching stations. Potential customers must buy a Renault Nissan Fluence Z.E. vehicles ( DKK or ) and choose a subscription option with monthly charges ranging from DKK ( 199) to DKK ( 399). The subscription includes unlimited charging from Better Place public charging spots and battery swapping stations. 5.4 Scrappage schemes Scrappage schemes have been introduced in several Member States to further drive the replacement of old inefficient vehicles with new more fuel efficient vehicles and cover primarily passenger cars. In many cases, schemes have been introduced as a temporary measure, with the principal aim of boosting sales of new cars, as these have dropped significantly due to the effects of the economic crisis. Table 5.2 shows a comparison of the different car scrappage schemes in place in early 2010; some of these were temporary measures and are no longer in place. Some countries have also introduced scrappage schemes for HGVs and buses; for example Croatia has a subsidy programme to encourage the scrapping of older, less efficient HGVs and school buses (Euro 0,1,2 or3) and replacement with Euro 5 compliant vehicles. In the majority of countries, scrappage schemes for older inefficient cars have been combined with incentives for purchasing new, efficient or low CO 2 emitting cars, thus making it an integrated measure. The scheme in France, the Bonus-Malus scheme (see also Box 5.10) includes a penalty for purchase of cars with the highest CO 2 emissions, which is intended to make the scheme revenue neutral. From 2007 to 2009, Italy also provided incentives for scrapping old vehicles and purchasing new more efficient vehicles (Table 5.3). The scheme applied to cars, light commercial vehicles, as well as motorcycles and scooters and had the elements shown in Table 5.3, including a contribution towards public transport tickets or car sharing if no replacement vehicle was bought. The incentives were administered by the authorised centres that carried out the scrapping, or by the manufacturers or importers of the new vehicle who refunded the vendor with the amount of the contribution, recovering the said amount as a credit against taxation. The scheme is estimated to have led to savings of GWh in the period 2007 to Since 2009 a new scheme has been put in place which includes additional financial incentives for the purchase of electric and hydrogen powered vehicles and for converting existing cars to run on LPG ( 500) and methane ( 600).
40 Table 5.2 Examples of scrappage schemes Country Main characteristics of scheme Incentives Austria Purchase a new car minimum Euro-4 and scrapping a 1,500 vehicle >13 years old. Cyprus Scrapping car >15 years old only, or scrap and purchase a 675 1,700 new car with fuel economy max 7 litres/100km or max 5 litres/100km. France Scrap car > 10 years, new car with CO2 <160g/km, or LCV. 1,000 plus + rebate up to 5,000, and bonus in new if low Germany Scrap car >9 years, purchase new car minimum Euro-4, and <1 year old. Greece Scrapping a car registered pre-2005, not necessary to purchase new car. Or purchase new car or LCV, minimum Euro-4 or Euro-5. Italy Scrap car or LCV > 9 years, new car CO2 max 130g/km diesel or 140g/km gasoline (petrol). Ireland Scrapping car>10 years old and buying new car CO 2 <140g/km gives relief on Vehicle Registration Tax. Luxembourg Scrapping car >10 years old, and purchase new car CO2<120g/km, (diesel PM<5mg ) or new car CO2 <150g/km. Netherlands Buying a new vehicle and scrapping gasoline (petrol) vehicle >13 years, or buying a new vehicle and scrapping a diesel vehicle >9 years old. Portugal Scrap a car >10 years old, or >15 years old and buy new car CO2 <140g/km.From August 2009, scrap a car >8 years old, or >13 years old and buy new car CO2 <140g/km. CO2 2,500, + tax rebate if Euro-5/ ,200 Cars 500 3,700 LCVs 1,500 3,000 Cars 2,500 6,000 LCVs up to 1,500 1,500 1, ,000 1,000 1,750 1,000 1,250 purchase incentive 1,250 1,500 purchase incentive Romania Scrapping a car >10 years old Approx 900 Slovakia Purchase new car maximum 25,000 price, scrapping car >10 1,000 1,500 years old. 2,000 Spain Vive plan, 0% loan to 10,000, new or used car < 5 years, max 140g/km, and LCV max 160g/km Scrap > 10 years, fitted with seat belt sensors and ESC. 2,000 equivalent 2,000 purchase incentive Plan2000e scrap >10 years or >250,000km, and buy new car max CO2 140g/km car, lower threshold of <120g/km or LCV max 160g/km. UK Scrap car > 10 years, purchase new car. 2,000 Source: Mure Database and IHS Global Insight, March 2010
41 Table 5.3 Scrappage scheme in Italy Energy Efficiency Policies in the Transport Sector in the EU Old vehicle Replacement vehicle Incentive Car (pre 1999; Euro 0, 1 or 2) None 150 plus 1 year pass for public transport or 800 for car sharing service < 140 g CO 2 /km (petrol) <130 g CO 2 /km (diesel) 700 plus car tax exemption for one/2 years* <120 g CO 2 /km 800 plus car tax exemption for one/2 years* Light goods vehicle (pre 1999; Euro 0 or All 1500 up to 3t 3500 up to 3.5t Euro 1; <3.5t) Gas fuelled (methane or Additional 1,500 LPG) Gas fuelled and Additional 2,000 <120 g CO 2 /km Motorbike (Euro 0, < 400 cc) Euro *Additional 500 if two vehicles owned by the same family are scrapped Source: MURE database, Italian NEEAP, IEA database on energy efficiency policies and measures
42 Bonus Penalty Euro Energy Efficiency Policies in the Transport Sector in the EU Box 5.10 Bonus-Malus scheme in France The Bonus-Malus scheme in France combines incentives for the purchase of fuel efficient cars with penalties for purchases of inefficient cars. The scheme which came into operation in 2008 consists of : 1. A "bonus" for any purchase of a new low CO 2 emitting car 2. A malus or penalty on the purchase of the new cars with the highest CO 2 emissions. These were those exceeding 160 g CO 2 /km; the threshold for payment has now been reduced to 150 g (see Figure). The penalty is either added directly to the vehicle purchase price by the seller (and then paid to the government at the time of vehicle registration), or paid by the purchaser when registering their vehicle. Cars running on fuel containing 85% ethanol (E 85) do not pay a penalty as long their emissions are below 250 gco 2 /km. For a temporary period, the scheme also provided a separate "superbonus", if the acquisition of the clean vehicle was accompanied by the scrapping of an older vehicle. Initially vehicles had to be over 15 years old, but subsequently vehicles over 10 years qualified as long as the new vehicle purchased was fuel efficient. This superbonus element of the scheme is no longer in place. The Bonus-Malus scheme was intended to be revenue neutral with income from penalties funding the bonus element, but the success of the scheme in encouraging the purchase of cleaner vehicles, led to a deficit, of around 500 million in 2009 and The levels of bonuses were reduced for 2011 and 2012, and the qualification criteria tightened (see Figure below), and this should help to reduce the budget balance of the measure. The scheme has led to an increase in the proportion of more fuel efficient vehicles in the market and is estimated to have been responsible for at least half of the reduction in the average CO 2 emissions of new cars in France, from 149 gco 2 /km in 2007 to 140 gco 2 /km in 2000 (i.e. a reduction of 4.5 g CO 2 /km). It is estimated this equates to a saving of around 0.21 Mtoe (8800 TJ) per year or about 0.1% of CO 2 emissions from transport. Evolution of the Bonus- Malus Scheme in France Tightening of qualification criteria over time g CO2/km Pre & Sources: MURE database and French NEEAP.
43 6 Driver Behaviour 6.1 Traffic management Speed limits The specific fuel consumption of cars (l/100 km) is generally at a minimum at speeds of around 90 km 19 per hour, and decreases as speeds rise above this. The idea of using more stringent speed limits to reduce travelling speeds on motorways and thereby cut fuel consumption and transport emissions has received much attention recently, as it could have an immediate effect on fuel consumption and emissions. Current motorway speed limits differ across EU Member States, varying from 110 to 130 km/h; with some countries also apply variable speed limits related to traffic and weather conditions. Modelling of a reduction in motorway speed limits from 120 km/h to 110 km/h suggest that in practice this might reduce the fuel consumption of cars by 2% for diesel cars and 3% for petrol cars 20. In 2011, as part of an effort to reduce the national energy bill in the face of the large spike in global oil prices, Spain reduced speed limits on its motorways from 120 to 110 km/h. Stickers with the new speed limit were applied to 6,150 signs, at a cost of 230,000. The temporary restriction was lifted at the end of June, with the Spanish Government reporting that it saved 450 million on fuel costs 21, although this was disputed. Several other countries have legislative measures in place to reduce and/or regulate speed limits for various different vehicle classes (i.e. Bulgaria, Estonia, Finland, France, Hungary, Ireland, Luxembourg, Malta, Netherlands, Norway, Poland, Romania, Sweden, and United Kingdom). However these measures are typically driven by other factors such as safety concerns rather than their contribution to improved fuel economy and fuel savings, and cannot really be considered as energy efficiency measures. Reducing speed limits on motorways or ensuring more stringent enforcement of existing limits, will mainly deliver fuel savings from cars, as the speed of HGVs and buses (with more than 8 passenger seats) is set by a European Directive (2002/85/EC) which requires that speed limiters are fitted to restrict the speed of HGVs to 90 km per hour and buses to 100 km/h, which is close to the optimum speed for fuel efficiency. In some countries such as France, more stringent enforcement of existing limits has been found to be very effective in reducing the average speed of cars and delivering fuel savings. 6.2 Eco-driving Eco-driving often refers to driving techniques (training courses, awareness raising campaigns) that enable drivers to optimise their car fuel economy. Several countries have on-going measures in place

44 Box 6.1 Ecodriving programme in Austria An Ecodriving initiative was introduced in Austria in 2004 by the Federal Ministry of Agriculture, Forestry, Environment and Water Management, in cooperation with the Austrian Energy Agency and the Federal Branch Association of Driving Schools. The programme was initially focussed on car drivers, and about 20,000 drivers have participated, receiving a one day training session containing both theory and practical elements, and costing about 125, with a subsidy of about 25 per training day. Since 2008 Ecodriving training has become a mandatory requirement for obtaining a driving licence, resulting in 90,000 novice drivers per year being educated in Ecodriving skills, and average reductions in fuel consumption of 14%. From 2012, the programme has been extended to include shorter, 1 hour, practical training sessions as well. In 2007, the initiative was broadened to include truck and bus drivers, and in 2009, to include tractor drivers. About 2,600 bus drivers and truck drivers have now participated in Ecodriving-training. Average fuel savings are 10%. About 800 instructors have undertaken Ecodriving training for driving instructors and been certified as Ecodriving trainers. In order to guarantee the quality of subsequent training, the content and timetable for training is defined in Ecodriving handbooks. Driving schools that offer certified instructors, have a fuel efficient fleet of cars, and offer alternative vehicles can receive a special certificate. Ecodriving competitions have been held since the beginning of the initiative in order to help raise awareness. Originally held at a provincial level, the latest in 2010 was a nationwide competition with 222 participants, who travelled across Austria for 2 days, achieving, on average a 30% reduction in fuel consumption. Source: MURE database and Austria Energy Agency Examples of schemes to encourage Eco-driving, in the passenger, freight and rail sectors are: Austria: Eco-drive campaign and competition (Box 6.1) Netherlands (Het Nieuwe Rijden): This programme promotes more efficient driving methods for car drivers and professional drivers including freight.
45 Energy Efficiency Policies in the Transport Sector in the EU Germany: Rail eco-driving scheme (Activities of Deutsche Bahn): The Deutsche Bahn set specific CO 2 reduction targets for the period 2002 to 2006 for their passenger transport, rail freight transport, and logistics business areas. The business areas themselves can choose the measures to meet their respective targets. United Kingdom (SAFED): This programme was specifically aimed at vans, HGVs, bus and coach drivers. It consisted of a one day complimentary driver development course combining driver training and assessment. Spain (Action Plan ) (Box 6.2) As well as country specific initiatives there are also European wide eco-driving initiatives such as the ECOWILL project 22, which aims to reduce carbon emissions by 8Mt by 2015 through implementing more fuel efficient driving across Europe. Box 6.2 Ecodriving programme in Spain The group of Measures More Efficient Use of the Means in the Transport Sector within the Action Plan contains specific measures for: Driving of private cars: the aim of this measure is the establishment of efficient driving techniques for both new and experienced private car and van drivers. This will be achieved by training driving instructors, drivers and drivers-to-be in efficient driving, to obtain the driving licence for passenger cars and commercial vehicles under 3,500 kg. In addition, the measure considers the progressive installation of on-board computers in all new private vehicles. HGVs and buses: the aim of this measure is to establish efficient driving techniques for both new and experienced heavy duty vehicle drivers. Aircraft: the aim of this measure is to improve efficiency related to air traffic, i.e. flying at optimal speed, height, and trajectory conditions through the introduction of continuous descent/green routes, improved transatlantic routes and optimisation of existing routes. Support for the road transport measures range between 50%/80% & 100% of the training costs, depending on the kind of student (driver or instructor) and of the kind of fleet service (private or public). 6.3 Optimised logistics Freight logistics Another approach taken by countries to improving the overall fuel efficiency of freight transport is through fleet management/fleet logistics, such as voluntary agreements which are already covered in section An example for Spain is described in more detail in Box
46 Box 6.3 Management of road transport fleets in Spain As part of the basket of measures on More Efficient Use of the Means in the Transport Sector within the Action Plan , Spain introduced a measure to improve the management of the road transport fleet in order to achieve a reduction in the specific consumption per ton or transported passenger. This measure means to boost the generalised use of the new telematic applications and other fleet management tools on the side of all the road transport firms, either goods transport or collective passenger transport. This measure includes a set of actions to be carried out by various public bodies covering: Legislative: the establishment of minimum criteria in terms of efficient fleet management will be considered so as to grant licences to collective passenger and goods transport companies. Economic incentives: continued support lines envisaged within the framework of the E4 action plans to carry out audits in the field of the transport fleet efficient management and the conduction of training campaigns aimed at professionals of transport fleets. Training: enhance training in the field of transport fleet efficient management through formal training in the notion of transport manager. Information: definition and grant of the suitable accreditation to all those firms having an efficient fleet system management in their organisation. This accreditation may be combined with the accreditation corresponding to the renewal of fleets. Communication: development of demonstrative campaigns aimed at the transport sector and the general public, promoting the efficient driving. Other accompaniment mechanisms: promotion of integrated logistical centres. Source: NEEAP Car Sharing Energy efficiency of passenger transport can also be improved through soft measures such as limiting the number of trips made or making car journeys more efficiency by utilising the maximising the capacity of passengers by car journey, i.e. car sharing. Belgium is trying to incentivise car sharing through measures such as reserving a lane of traffic to make car sharing more attractive (commuters travelling by car represent 20 to 30% of road traffic). The Highway Code was modified in 2003 to allow the road system manager to reserve a lane of traffic not only to public transport vehicles, but also to private vehicles occupied by more than one passenger. France introduced the car club, which is defined as making a fleet of motorised land transport vehicles available to subscribing users on a shared basis. Each subscriber may have access to a vehicle, without a driver, for the journey of his or her choice and for a limited period. A car club label is currently being defined at national level and will be the subject of a decree stating the terms of its award and use. Town hall authorities may reserve parking spaces for vehicles with this label. A CERTU study concerns mechanisms for encouraging the use of alternatives to private cars in European countries, including car clubs. The study has been finalised but has not yet been made public. Similar measures are in place in the United Kingdom (e.g. Streetcar, City Car Club) Horizontal cross cutting measures Horizontal cross cutting measures are defined as measures that have successfully been implemented in other sectors than transport and are now introduced to the transport sector to improve energy efficiency. One example is given in Box 6.4 below and explains the application of white certificates, which were initially introduced in the household sector, in the transport sector.
47 Box 6.4 White certificates scheme for transport in France The White Certificates Scheme was launched in France in 2005, with the first obligation period running from 2006 to 2009, and placing obligations for energy suppliers the tertiary and residential sectors to achieve energy savings by promoting energy efficiency measures to their customers. Energy Efficiency Certificates (White certificates) are awarded to organisation undertaking energy saving activities, and may be traded. Suppliers unable to surrender enough certificates to meet its obligations at the end of the period, receive a financial penalty of 20 per MWh of shortfall. An electronic registry is operated for the certificates, with the cost of the registry met through registration fees and account opening fees. In 2010 the scheme was expanded to include transport fuel suppliers whose annual sales exceed a certain threshold. They will be required to achieve savings of 30 TWh cumac per year, or a total of 90TWh over the second obligation period January 2011 to December 2013). The obligation is shared between suppliers according to their sales. 15TWh per year is to come from professional vehicle fleets, 10 TWh from private vehicles and 5 TWh from freight. Energy savings are calculated on the basis of the cumulative final energy savings over the lifespan of the measure, and actualised (by discounting at a rate of 4% per year) over the life of the product (cumac kwh of final energy). Standardized energy saving measurement worksheets have been set to precisely define eligibility criteria and provide calculation methods for the most common measures implemented. Actions which can lead to the issue of certificates include contributing towards programmes to reduce the energy consumption of the least well-off households or towards programmes offering information, training and innovation in support of demand-side management, in particular aimed at developing vehicles with low carbon dioxide emissions. It has been suggested however that fuel retailers may comply with their obligations by achieving savings in other sectors; for example, supermarkets with petrol stations could gain certificates by selling energy efficient appliances. Sources: MURE database, France Second NEEAP, Leinekugel (2012), ACE (2011)
48 7 Conclusions There is a growing realisation that a focus on improving the efficiency of vehicles is only part of the solution in the transport sector. A more holistic approach involving the reduction of transport demand and the shift of transport to more environmentally friendly and energy efficient modes is needed if the European Union is to meet its 2030 and 2050 targets. Very few EU Member States presented a comprehensive package of transport measures in their National Energy Efficiency Action Plans (NEEAPs) covering technological, infrastructural, financial, behavioural and special planning measures. One of the key barriers to the development of such a package of measures is that decisions are often taken at different levels of government (central, regional, local) and by a range of departments and ministries. The MURE database developed and maintained by the ODYSSEE-MURE project contains 427 measures in the transport sector. The most commonly implemented policies at Member State level are those that seek to improve the efficiency of vehicles or encourage the purchase of cleaner vehicles. Other measures described in the MURE database seek to encourage modal shift or change driver behaviour. Biofuels policies are not within the scope of the ODYSSEE-MURE project although some Member States have chosen to include biofuels policies in the MURE database for completeness. The majority of policies focus on cars: improving the efficiency of cars, encouraging the takeup of energy efficient cars and changing the behaviour of car drivers. This focus on cars may be partly due to the homogeneous nature of cars. However, cross-cutting measures such as voluntary agreements and white certificates are now being applied to other vehicle types. Such measures are likely to be more appropriate than codes and standards when dealing with heterogeneous technologies like heavy goods vehicles (HGVs). Modal shift can play an important role in reducing energy consumption and greenhouse gas (GHG) emissions from transport. However modal shift is not an energy efficiency measure and so not a focus for the MURE database and the ODYSSEE-MURE project more generally. Nevertheless, there are a range of modal shift measures described in the MURE database and the NEEAPs including enhancements to public transport provision, fiscal incentives to encourage the use of public transport or non-motorised modes, differential toll charges, the promotion of walking and cycling, and urban mobility planning. Vehicle efficiency improvement measures are predominantly implemented at EU level through regulations targeted at vehicle manufacturers. There are also some novel policies at the national level, particularly on HGVs and public transport vehicles, which are not regulated at EU level. HGV measures include the introduction of longer road trains that offer fuel savings of ~15% per tonne km and voluntary agreements with freight logistics companies. Measures to encourage the uptake of cleaner vehicles include labelling, taxation and infrastructure charges, grants and subsidies and scrappage schemes. Labelling of new cars has been implemented at the EU level, but several Member States expanded the scheme at the national level, for example to cover used vehicles, or LGVs. Differentiation of car purchase tax by fuel efficiency/co 2 emissions have now been introduced in almost two-thirds of Member States, but differentiation of annual circulation taxes is less common. Infrastructure charging schemes are focussed on HGVs and range from simple time based usage charges to an innovative distance based scheme, using GPS satellite systems implemented in Germany. Scrappage schemes for older inefficient cars, have been introduced quite widely across the EU, although often for relatively limited periods. Many of the schemes also provide incentives for the purchase of new cars, often stipulating CO 2
49 performance standards which must be met. The last few years has also seen many countries introducing specific policies to encourage the uptake of electric vehicles. Measures generally seek to combat the most common barriers towards electric vehicle use: high capital cost, through grants towards purchase cost, and lack of charging infrastructure through regional programmes designed to increase access along strategic transport routes and in major cities. Changing driver behaviour to encourage more fuel efficient driving is widely recognised as potentially offering significant savings. Several countries have introduced training courses and awareness raising campaigns on the benefits of eco-driving, both for car drivers and for freight, and bus and coach and drivers of off-road vehicles. Increasing the utilisation of vehicles, e.g. through car sharing, can also contribute to improving the overall efficiency of passenger transport, and is typically encouraged though a range of soft measures to change driver and passenger behaviour. As with modal shift, these softer measures are not the focus of the MURE database, but nevertheless it does include examples of measures to facilitate and incentivise car sharing, e.g. through priority access to car parking or reducing journey times, by allowing car sharers access to reserved lanes on roads.
50 8 References ACE, National energy efficiency and energy saving targets further detail on Member States, 24 May 2011; Dr Joanne Wade, and Pedro Guertler, Darryl Croft and Louise Sunderland, from the Association for the Conservation of Energy ADEME (2012) Energy Efficiency Trends in the Transport Sector in the EU: Lessons from the ODYSSEE MURE project, March 2012 AEA and TEPR, Report on the implementation of Directive 1999/94/EC relating to the availability of consumer information on fuel economy and CO2 emissions in respect of the marketing of new passenger cars. Report for DG Clima Action, European Commission Álvarez, E Type approval requirements for the general safety of motor vehicles, Report for the Department Economic and Scientific Policy European Parliament ARUP (2008) Investigation into the scope for the transport sector to switch to electric vehicles and plug-in hybrid vehicles Department for Business Enterprise & Regulatory Reform & Department for Transport. BMWi (Federal Ministry of Economics and Technology) (2011) 2nd. National Energy Efficiency Action Plan (NEEAP) of the Federal Republic of Germany - Methodological Accompanying Document -in accordance with the EU Directive on Energy End-use Efficiency and Energy Services (2006/32/EC) and the Act on Energy Services and other Energy Efficiency Measures (Energiedienstleistungsgesetz, EDL-G). July DG TREN (2009): Energy Savings Potentials in EU Member States, Candidate Countries and EEA Countries EC (2009). Moving forward together on saving energy Synthesis of the complete assessment of all 27 National Energy Efficiency Action Plans as required by Directive 2006/32/EC on energy end-use efficiency and energy services. SEC(2009)889 final EC (2011). White Paper: Roadmap to a Single European Transport Area Towards a competitive and resource efficient transport system COM(2011) 144 final Ecolane (2011) Ultra-low carbon vehicles in the UK. RAC Foundation. EEA (2010) Towards a resource-efficient transport system: TERM 2009: indicators tracking transport and environment in the European Union, EEA Report No 2/2010 Element Energy (2009) Strategies for the uptake of electric vehicles and associated infrastructure implications. Committee on Climate Change. Element_Energy_-_EV_infrastructure_report_for_CCC_2009_final.pdf ETC (2009) Environmental impacts and impact on the electricity market of a large scale introduction of electric cars in Europe. European Topic Centre on Air and Climate Change. FIA (2011) Towards e-mobility and the challenges ahead. Federation Internationale de L Automobile
51 IDEA, Guia para la implementacion de Planes de Movilidad Urbana Sostenible (PMUS), Madrid. IEA (2011) 25 Energy Efficiency Policy Recommendations: 2011 Update. IEA, (2010) Transport Energy Efficiency :Implementation of IEA Recommendations since 2009 and next steps IHS Global Insight, Assessment of the Effectiveness of Scrapping Schemes for Vehicles, March 2010 Kfz-Auskunft (2008): Lkw-Maut Erhöhung ab 01. Januar Aktuelle Auto News from 7 November Leinekugel, T, The French white certificates scheme: Second target period :key issues and expectations IEA Workshop, Policies for Energy Provider Delivery of Energy Efficiency, Brussels, January 2012, Presentation by Thibaut Leinekugel Le Cocq, Ministère de L Ecologie, du Development durable, des Transports et du Logement. McKinnon, A, Advice on CO2 Emissions from the UK Freight Transport Sector, Prepared for the Shadow Committee on Climate Change MURE database, ODYSSEE, Öko-Institut, IFE-STE, DIW, Fraunhofer ISI (2008): Politikszenarien für den Klimaschutz IV. Szenarien bis On behalf of the Environmental Protection Agency (UBA). Climate Change 1/08. Dessau-Roßlau, January Öko-Institut, IFE-STE, DIW, Fraunhofer ISI, Ziesing: Politikszenarien für den Klimaschutz V- auf dem Weg zum Strukturwandel. Treibhausgas-Emissionsszenarien bis zum Jahr 2030 (2009). On behalf of the Environmental Protection Agency (UBA). Climate Change 16/2009. Dessau-Roßlau, Oktober SEC(2009)889 final MOVING FORWARD TOGETHER ON SAVING ENERGY, Synthesis of the complete assessment of all 27 National Energy Efficiency Action Plans as required by Directive 2006/32/EC on energy end-use efficiency and energy services COMMISSION STAFF WORKING DOCUMENT SDC (2011) Fairness in a Car-dependent Society, Sustainable Development Commission, London.
52 Appendices Appendix 1: Example of Measures in MURE database Ref: AEA/ED46824/Issue Number 2
53 Appendix 1 Example of Measures in MURE Database Example of measures in MURE database: fiscal measures related to purchase of cars Code Title Status Type AU2 Starting Year Semiquantitative Impact Tax Depending on Motor Vehicle's Fuel Consumption (NoVA) Ongoing Fiscal 1992 High DK9 Taxes on registration of a new cars Ongoing Fiscal 1971 Medium DK7 Green Owner Fee Ongoing Fiscal 1999 Low FIN22 Car Tax Revision Ongoing Fiscal 2008 High FRA21 Registration surcharge for cars Ongoing Fiscal 2006 Unknown FRA19 Automobile bonus malus Ongoing Fiscal 2007 Medium HUN7 Registration tax on new cars Ongoing Fiscal 2003 Low LV17 NLD27 Applying of differential tax rates for passenger cars depending on age and engine size Ongoing Fiscal 2007 Medium Other transport taxes (Motor Vehicle Tax/Private Car and Motorcycle Tax, CO2 differentiation, lease cars) (Overige transportbelastingen (MRB?BPM, CO2-differentiatie, lease-auto's)) Ongoing Fiscal 2006 Medium PL11 Vehicle taxation Ongoing Fiscal 2009 High POR9 Taxation on the purchase of passengers vehicles Ongoing Fiscal 2006 High SLO9 Motor Vehicles Tax Ongoing Fiscal 2010 Unknown Ref: AEA/ED46824/Issue Number 2

54 Example of summary of measure description in Mure database Ref: AEA/ED46824/Issue Number 2

55 Example of full description of measure in Mure database Energy Efficiency Policies in the Transport Sector in the EU Ref: AEA/ED46824/Issue Number 2
56 Ref: AEA/ED46824/Issue Number 2
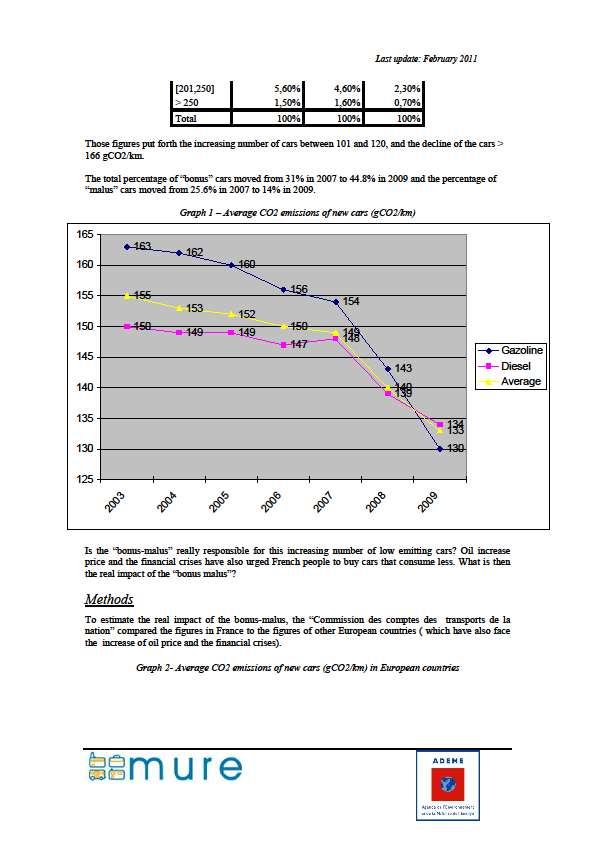
57 Ref: AEA/ED46824/Issue Number 2
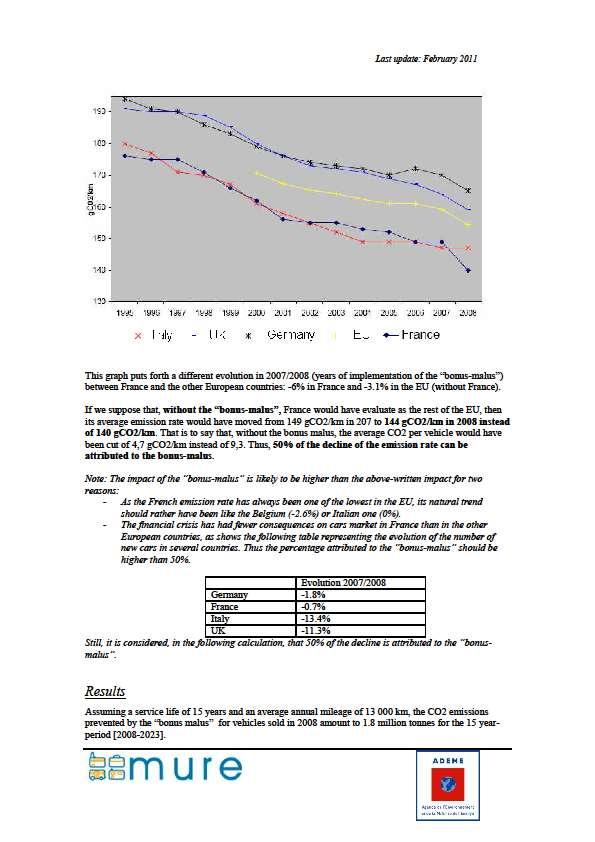
58 Ref: AEA/ED46824/Issue Number 2
Energy efficiency policies and measures in transport in the EU 27, Norway and Croatia
 ODYSSEE MURE Final Meeting Paris, May 18-19 2009 Energy efficiency policies and measures in transport in the EU 27, Norway and Croatia B Lapillonne Karine Pollier Enerdata Content Overview of measures:
Monitoring the CO 2 emissions from new passenger cars in the EU: summary of data for 2010
 Monitoring the CO 2 emissions from new passenger cars in the EU: summary of data for 2010 EXECUTIVE SUMMARY EEA has collected data submitted by Member States on vehicle registrations in the year 2010,
ACEA Report. Vehicles in use Europe 2017
 ACEA Report Vehicles in use Europe 2017 TABLE OF CONTENTS Summary... 2 Vehicles in use in Europe... 3 Passenger cars... 3 Light commercial vehicles... 4 Medium and heavy commercial vehicles... 5 Buses...
CO2 BASED MOTOR VEHICLE TAXES IN THE EU
 CO2 BASED MOTOR VEHICLE TAXES IN THE EU AUSTRIA A deduction of VAT is applicable for zero CO2 emission passenger cars. Fuel consumption/pollution tax (Normverbrauchsabgabe or NoVA) is levied on the purchase
NEW COMMERCIAL VEHICLE REGISTRATIONS EUROPEAN UNION 1. November 2018
 PRESS EMBARGO: NEW COMMERCIAL VEHICLE REGISTRATIONS EUROPEAN UNION 1 November 2018 Commercial vehicle registrations: +3.8% 11 months into 2018; +2.7% in November Total new commercial vehicles In November
RSWGM meeting European Commission DG MOVE 3-4 April 2017
 Podgorica RSWGM meeting European Commission DG MOVE 3-4 April 2017 Mobility and Transport 1 WHITE PAPER 2011: Towards a zero-vision on road safety POLICY ORIENTATIONS ON ROAD SAFETY 2011-2020 The -50%
Energy efficiency policies for transport. John Dulac International Energy Agency Paris, 29 May 2013
 Energy efficiency policies for transport John Dulac International Energy Agency Paris, 29 May 2013 Transport scene-setting Why are transport policies needed, particularly in cities? Oil demand is driven
Passenger cars in the EU
 Passenger cars in the EU Statistics Explained Data extracted in April 2018 Planned article update: April 2019 This article describes developments in passenger car stocks and new registrations in the European
Krakow, 16 September Laurence A. Bannerman President EPA
 Krakow, 16 September 2016 Laurence A. Bannerman President EPA THE URBAN MOBILITY SYSTEMS - EU - TODAY PUBLIC MOBILITY INFRASTRUCTURES : PUBLIC TRANSPORT: Rail regional, suburban, metro, light rail, train
Implementing Transport Demand Management Measures
 Implementing Transport Demand Management Measures Dominik Schmid, GIZ Transport Policy Advisory Services Urban Mobility India Conference, Delhi, December 2013 Page 1 Agenda Context: Why Transport Demand
ACEA Report. Vehicles in use Europe 2018
 ACEA Report Vehicles in use Europe 2018 TABLE OF CONTENTS Summary... 2 Vehicles in use in Europe... 3 Passenger cars... 3 Light commercial vehicles... 4 Medium and heavy commercial vehicles... 5 Buses...
NEW COMMERCIAL VEHICLE REGISTRATIONS EUROPEAN UNION 1. October 2016
 PRESS EMBARGO: NEW COMMERCIAL VEHICLE REGISTRATIONS EUROPEAN UNION 1 October 2016 Next press release: Thursday 22 December 2016 1 Data for Malta unavailable Page 1 of 7 Commercial vehicle registrations:
Energy efficiency in New Member States and Candidate countries. Policies, potentials and needed action
 Energy efficiency in New Member States and Candidate countries. Policies, potentials and needed action Paolo Bertoldi and Bogdan Atanasiu European Commission, Directorate General Joint Research Center
DEPLOYMENT STRATEGIES FOR CLEAN AND FUEL EFFICIENT VEHICLES: EFFECTIVENESS OF INFORMATION AND SENSITIZATION IN INFLUENCING PURCHASE BEHAVIOUR
 DEPLOYMENT STRATEGIES FOR CLEAN AND FUEL EFFICIENT VEHICLES: EFFECTIVENESS OF INFORMATION AND SENSITIZATION IN INFLUENCING PURCHASE BEHAVIOUR Leen GOVAERTS, Erwin CORNELIS VITO, leen.govaerts@vito.be ABSTRACT
NEW COMMERCIAL VEHICLE REGISTRATIONS EUROPEAN UNION 1 February 2018
 PRESS EMBARGO: NEW COMMERCIAL VEHICLE REGISTRATIONS EUROPEAN UNION 1 February 2018 Next press release: Tuesday 24 April 2018 1 Malta not available Page 1 of 7 Commercial vehicle registrations: +6.5% first
BREXIT AND THE AUTO INDUSTRY: FACTS AND FIGURES
 BREXIT AND THE AUTO INDUSTRY: FACTS AND FIGURES GLOBAL TRADE European Union EU vehicle imports: Total value: 48,019 million Quantity: 3,640,975 units EU vehicle exports: Total value: 138,536 million Quantity:
NEW COMMERCIAL VEHICLE REGISTRATIONS EUROPEAN UNION 1. April 2017
 PRESS EMBARGO: NEW COMMERCIAL VEHICLE REGISTRATIONS EUROPEAN UNION 1 April 2017 Next press release: Friday 23 June 2017 1 Data for Malta unavailable Page 1 of 7 Commercial vehicle registrations: +3.8%
AMENDMENTS TO BUNKER DELIVERY NOTE TO PERMIT THE SUPPLY OF FUEL OIL NOT IN COMPLIANCE WITH REGULATION 14 OF MARPOL ANNEX VI
 E SUB-COMMITTEE ON POLLUTION PREVENTION AND RESPONSE 3rd session Agenda item 10 PPR 3/10 10 December 2015 Original: ENGLISH AMENDMENTS TO BUNKER DELIVERY NOTE TO PERMIT THE SUPPLY OF FUEL OIL NOT IN COMPLIANCE
NEW COMMERCIAL VEHICLE REGISTRATIONS EUROPEAN UNION 1. December 2018
 PRESS EMBARGO: NEW COMMERCIAL VEHICLE REGISTRATIONS EUROPEAN UNION 1 December 2018 Commercial vehicle registrations: +3.2% in 2018; 4.0% in December Total new commercial vehicles In December 2018, commercial
KEY DRIVERS AND SLOWERS OF PASSENGER CAR TRANSPORT (ENERGY) DEMAND IN THE EU-27
 DEMAND IN THE EU-27") Amela Ajanovic KEY DRIVERS AND SLOWERS OF PASSENGER CAR TRANSPORT (ENERGY) DEMAND IN THE EU-27 Vienna University of Technology, Energy Economics Group, Austria, Phone +431 5881 37364, e-mail ajanovic@eeg.tuwien.ac.at
Amela Ajanovic KEY DRIVERS AND SLOWERS OF PASSENGER CAR TRANSPORT (ENERGY) DEMAND IN THE EU-27 Vienna University of Technology, Energy Economics Group, Austria, Phone +431 5881 37364, e-mail ajanovic@eeg.tuwien.ac.at
Developments within the ECMT Multilateral Quota System
 Developments within the ECMT Multilateral Quota System Elene Shatberashvili International Transport Forum IRU GOODS TRANSPORT COUNCIL (CTM) 8 November 2012 2 International Transport Forum An Intergovernmental
TAXATION N 322 JC/ 49 /14 LC/ 39 /14 BARS/ 25 /14 WG-TX/ 2 /14 WG-CO2/ 23 /14 WG-EV/ 4 /14 WG-CSG/ 10 /14
 Brussels, 3 April 2014 TAXATION N 322 JC/ 49 /14 LC/ 39 /14 BARS/ 25 /14 WG-TX/ 2 /14 WG-CO2/ 23 /14 WG-EV/ 4 /14 WG-CSG/ 10 /14 Subject: Overview of C2 taxes and incentives for EVs Dear colleagues, Please
NEW COMMERCIAL VEHICLE REGISTRATIONS EUROPEAN UNION* September 2014
 PRESS EMBARGO: 8.00 A.M. (7.00 A.M GMT), October 28, 2014 NEW COMMERCIAL VEHICLE REGISTRATIONS EUROPEAN UNION* September 2014 Next Press Release: November 27, 2014 *Data for Malta unavailable Page 1 of
Curbing emissions and energy consumption in the transport sector how can we deal with it in Warsaw 2012 Annual POLIS Conference
 Curbing emissions and energy consumption in the transport sector how can we deal with it in Warsaw 2012 Annual POLIS Conference Perugia, 29 30 November 2012 1 Covenant of Mayors (under the auspices of
Draft Marrickville Car Share Policy 2014
 Draft Marrickville Car Share Policy 2014 1. Background 1.1. Marrickville Council has supported car sharing in the LGA since 2007 as part of a holistic approach to encouraging more sustainable modes of
BREXIT AND THE AUTO INDUSTRY: FACTS AND FIGURES
 BREXIT AND THE AUTO INDUSTRY: FACTS AND FIGURES GLOBAL TRADE European Union EU vehicle imports: Total value: 45,693 million Quantity: 3,395,419 units EU vehicle exports: Total value: 135,398 million Quantity:
Access to the market & profession: quality-based regulations
 Access to the market & profession: quality-based regulations SSATP REC-TCC meeting 2-6 July 2018 Abuja iru.org 1. ECMT Quality Charter Multi-lateral permits a step towards a liberalised international market
GEAR 2030 Working Group 1 Project Team 2 'Zero emission vehicles' DRAFT RECOMMENDATIONS
 GEAR 2030 Working Group 1 Project Team 2 'Zero emission vehicles' DRAFT RECOMMENDATIONS Introduction The EU Member States have committed to reducing greenhouse gas emissions by 80-95% by 2050 with an intermediate
DAILY TRAVEL AND CO 2 EMISSIONS FROM PASSENGER TRANSPORT: A COMPARISON OF GERMANY AND THE UNITED STATES
 DAILY TRAVEL AND CO 2 EMISSIONS FROM PASSENGER TRANSPORT: A COMPARISON OF GERMANY AND THE UNITED STATES Ralph Buehler, Associate Professor, Virginia Tech, Alexandria, VA Supported by American Institute
Workshop on Road Traffic Statistics
 Document: RTS-2008-2-EN Original: English EU transport statistics Workshop on Road Traffic Statistics Luxembourg, 04-05 November 2008 Bech Building Room BECH QUETELET Beginning 10:00 AM Measuring road
Proportion of the vehicle fleet meeting certain emission standards
 The rate of penetration of new technologies is highly correlated with the average life-time of vehicles and the average age of the fleet. Estimates based on the numbers of cars fitted with catalytic converter
WLTP for fleet. How the new test procedure affects the fleet business
 WLTP for fleet How the new test procedure affects the fleet business Editorial Ladies and Gentlemen, The automotive industry is facing a major transformation process that will also affect the fleet business
Respecting the Rules Better Road Safety Enforcement in the European Union. ACEA s Response
 Respecting the Rules Better Road Safety Enforcement in the European Union Commission s Consultation Paper of 6 November 2006 1 ACEA s Response December 2006 1. Introduction ACEA (European Automobile Manufacturers
FENEBUS POSITION PAPER ON REDUCING CO2 EMISSIONS FROM ROAD VEHICLES
 FENEBUS POSITION PAPER ON REDUCING CO2 EMISSIONS FROM ROAD VEHICLES The Spanish Federation of Transport by Bus (Fenebús) is aware of the importance of the environmental issues in order to fully achieve
Labour Market Latest Trends- 1st quarter 2008 data 1
 Population and social conditions Author: Fabrice ROMANS Data in focus 34/2008 Labour Market Latest Trends- 1st quarter 2008 data 1 Chart 1: Employment rate 2 (15-64 years) for from 2000Q1 to 2008Q1 % 66.5
Mileage-based User Fees In Europe and USA
 Mileage-based User Fees In Europe and USA Dr. Toshinori Nemoto Professor at Hitotsubashi University The 31th Japan Road Congress International symposium: Road-tolling policies and technologies October
Operational Leasing in Russia Datamonitor Jugoslav Stojanov, Senior Analyst, Automotive, Datamonitor plc
 1 Emerging Markets in the European Fleet Arena: Template last updated 21.04.05 Operational Leasing in Russia Jugoslav Stojanov, Senior Analyst, Automotive, Datamonitor plc 2 Operational Leasing in Russia
THE POLISH VISION FOR ROAD SAFETY
 Road Safety PIN Talk TOWARDS SUSTAINABLE ROAD SAFETY PROGRESS Houses of Parliament, Bucharest, Romania 15 April 2013 THE POLISH VISION FOR ROAD SAFETY Ilona Buttler Motor Transport Institute Road Traffic
42/ March GDP growth in the euro area and EU28. GDP growth rates % change over the previous quarter, based on seasonally adjusted data
 2007Q1 2007Q2 2007Q3 2007Q4 2008Q1 2008Q2 2008Q3 2008Q4 2009Q1 2009Q2 2009Q3 2009Q4 2010Q1 2010Q2 2010Q3 2010Q4 2011Q1 2011Q2 2011Q3 2011Q4 2012Q1 2012Q2 2012Q3 2012Q4 2013Q1 2013Q2 2013Q3 2013Q4 2014Q1
Improved timeliness of employment data
 2007Q1 2007Q2 2007Q3 2007Q4 2008Q1 2008Q2 2008Q3 2008Q4 2009Q1 2009Q2 2009Q3 2009Q4 2010Q1 2010Q2 2010Q3 2010Q4 2011Q1 2011Q2 2011Q3 2011Q4 2012Q1 2012Q2 2012Q3 2012Q4 2013Q1 2013Q2 2013Q3 2013Q4 2014Q1
Green Mobility: The Future of Transportation in Denmark and in the EU Grøn Mobilitet: Fremtidens Transport i Danmark og EU
 Green Mobility: The Future of Transportation in Denmark and in the EU Grøn Mobilitet: Fremtidens Transport i Danmark og EU Nordisk Folkecenter for Vedvarende Energi, 7760 Hurup Thy, Danmark Incentive Schemes
June EU Countries NEW COMMERCIAL VEHICLE REGISTRATIONS. PRESS EMBARGO FOR ALL DATA: July 26, 2013, 8.00 A.M. (6.00 A.M. GMT)
") PRESS EMBARGO FOR ALL DATA: y 26, 213, 8. A.M. (6. A.M. GMT) Press s Release e e NEW COMMERCIAL VEHICLE REGISTRATIONS e 213 EU Countries 15, LCVs up to 3.5t 2, Heavy Trucks of 16t and over ons New Registrati
PRESS EMBARGO FOR ALL DATA: y 26, 213, 8. A.M. (6. A.M. GMT) Press s Release e e NEW COMMERCIAL VEHICLE REGISTRATIONS e 213 EU Countries 15, LCVs up to 3.5t 2, Heavy Trucks of 16t and over ons New Registrati
Reducing CO 2 emissions from vehicles by encouraging lower carbon car choices and fuel efficient driving techniques (eco-driving)
") Reducing CO 2 emissions from vehicles by encouraging lower carbon car choices and fuel efficient driving techniques (eco-driving) David Pryke, Head of Efficient Driving, Department for Transport, London
Reducing CO 2 emissions from vehicles by encouraging lower carbon car choices and fuel efficient driving techniques (eco-driving) David Pryke, Head of Efficient Driving, Department for Transport, London
Regional Cooperation Infrastructure Development and Operation. EU Energy Governance. Olaf Ziemann Member of ENTSO-E s System Operations Committee
 Regional Cooperation Infrastructure Development and Operation EU Energy Governance 30 April 2014, Berlin Olaf Ziemann Member of ENTSO-E s System Operations Committee About ENTSO-E 41 TSOs from 34 countries
Sectoral Profile - Services
 Sectoral Profile - Services Energy consumption Changes in energy consumption and value added in services Since 2008 strong contraction of total energy consumption (-0.3%/year) although electricity consumption
EU Road Transport Strategy ECG Conference Brussels 20 Oct. 2017
 EU Road Strategy ECG Conference Brussels 20 Oct. 2017 Main challenges Impact on the environment and climate Road sector responsible for almost a quarter of Europe's greenhouse gas emissions A source of
SUMMARY OF THE IMPACT ASSESSMENT
 COMMISSION OF THE EUROPEAN COMMUNITIES Brussels, 13.11.2008 SEC(2008) 2861 COMMISSION STAFF WORKING DOCUMT Accompanying document to the Proposal for a DIRECTIVE OF THE EUROPEAN PARLIAMT AND OF THE COUNCIL
HyLAW. HyDrail Rail Applications Assessment. Main Author(s): [Dainis Bošs, Latvian Hydrogen association] Contributor(s):
![HyLAW. HyDrail Rail Applications Assessment. Main Author(s): [Dainis Bošs, Latvian Hydrogen association] Contributor(s):](/thumbs/91/106971122.jpg "HyLAW. HyDrail Rail Applications Assessment. Main Author(s): [Dainis Bošs, Latvian Hydrogen association] Contributor(s):") HyLAW HyDrail Rail Applications Assessment Main Author(s): [Dainis Bošs, Latvian Hydrogen association] Contributor(s): Status: [V1] Dissemination level: [public] 1 Acknowledgments: The HyLAW project has
HyLAW HyDrail Rail Applications Assessment Main Author(s): [Dainis Bošs, Latvian Hydrogen association] Contributor(s): Status: [V1] Dissemination level: [public] 1 Acknowledgments: The HyLAW project has
1. INTERNATIONAL OVERVIEW. 1.0 Area and population. population (1,000) area
 area") 1.0 Area and population area population (1,000) km 2 2000 2010 2018 1 inhabitants per km 2 Belgium 30,530 10,251 10,920 11,443 375 Germany 357,380 82,212 81,777 82,952 232 Estonia 45,230 1,397 1,331 1,315
1.0 Area and population area population (1,000) km 2 2000 2010 2018 1 inhabitants per km 2 Belgium 30,530 10,251 10,920 11,443 375 Germany 357,380 82,212 81,777 82,952 232 Estonia 45,230 1,397 1,331 1,315
THE CHARGING OF THE USE OF ROAD INFRASTRUCTURE
 JUNE 2013 THE CHARGING OF THE USE OF ROAD INFRASTRUCTURE UITP (Union Internationale des Transports Publics) is the international organisation of public transport, it is based in Brussels and covers all
! " # $ % # & " ' % ( ' ) "
") "#!! $% ! " # $ % # " ' % ( ' ) ",-..*-/--0"-00"0**0 2 In agreement with the Terms of Reference, we have conducted an analysis of the road user charges (RUC) paid by the users of the road networks in the
"#!! $% ! " # $ % # " ' % ( ' ) ",-..*-/--0"-00"0**0 2 In agreement with the Terms of Reference, we have conducted an analysis of the road user charges (RUC) paid by the users of the road networks in the
Drink Driving in the EU
 Drink Driving in the EU Safe & Sober: reducing deaths and injuries from drink driving Vienna, 18 November 2010 Antonio Avenoso Executive Director Introduction to ETSC A science-based approach to road safety
ECTRI. URBAMOVE URBAn MObility initiative. Claudia Nobis (DLR) TRA 2006, Göteborg, Sweden June 13 th, 2006
 TRA 2006, Göteborg, Sweden June 13 th, 2006") URBAMOVE URBAn MObility initiative Claudia Nobis (DLR), Göteborg, Sweden June 13 th, 2006 European Conference of Transport Research Institutes Idea launched in 2001 Officially established in 2003 as a
URBAMOVE URBAn MObility initiative Claudia Nobis (DLR), Göteborg, Sweden June 13 th, 2006 European Conference of Transport Research Institutes Idea launched in 2001 Officially established in 2003 as a
REPORT FROM THE COMMISSION TO THE EUROPEAN PARLIAMENT, THE COUNCIL, THE EUROPEAN ECONOMIC AND SOCIAL COMMITTEE AND THE COMMITTEE OF THE REGIONS
 EUROPEAN COMMISSION Brussels, 12.7.2012 COM(2012) 385 final REPORT FROM THE COMMISSION TO THE EUROPEAN PARLIAMENT, THE COUNCIL, THE EUROPEAN ECONOMIC AND SOCIAL COMMITTEE AND THE COMMITTEE OF THE REGIONS
EU CO 2 emission policy : State of Play. European Commission, DG CLIMA. Climate Action
 EU CO 2 emission policy : State of Play European Commission, DG CLIMA Clean Mobility Package: an integrated approach 2016 Clean Energy Package RED II: lowemission fuels 2016 European Low-Emission Mobility
Greening transport taxation
 Greening transport taxation Jos Dings GBE conference, Budapest, 8 July 2010 www.transportenvironment.org A ranking of transport tax anomalies 1 Tax free aviation 2 Private benefits of company cars 3 Europe
NEW PASSENGER CAR REGISTRATIONS BY ALTERNATIVE FUEL TYPE IN THE EUROPEAN UNION 1 Quarter
 PRESS EMBARGO: NEW PASSENGER CAR REGISTRATIONS BY ALTERNATIVE FUEL TYPE IN THE EUROPEAN UNION 1 Quarter 3 2017 Alternative fuel vehicle registrations: +51.4% in third quarter of 2017 In the third quarter
COMMUNICATION FROM THE COMMISSION TO THE COUNCIL
 EUROPEAN COMMISSION Brussels, 25.10.2017 COM(2017) 622 final COMMUNICATION FROM THE COMMISSION TO THE COUNCIL European Development Fund (EDF): forecasts of commitments, payments and contributions from
June EU Countries NEW COMMERCIAL VEHICLE REGISTRATIONS. PRESS EMBARGO FOR ALL DATA: July 26, 2012, 8.00 A.M. (6.00 A.M. GMT) LCVs up to 3.
 LCVs up to 3.") PRESS EMBARGO FOR ALL DATA: y 26, 212, 8. A.M. (6. A.M. GMT) Press s Release e e NEW COMMERCIAL VEHICLE REGISTRATIONS e 212 EU Countries 15, LCVs up to 3.5t 2, Heavy Trucks over 16t New Regis strations
PRESS EMBARGO FOR ALL DATA: y 26, 212, 8. A.M. (6. A.M. GMT) Press s Release e e NEW COMMERCIAL VEHICLE REGISTRATIONS e 212 EU Countries 15, LCVs up to 3.5t 2, Heavy Trucks over 16t New Regis strations
actsheet Car-Sharing
 actsheet Car-Sharing This paper was prepared by: SOLUTIONS project This project was funded by the Seventh Framework Programme (FP7) of the European Commission Solutions project www.uemi.net The graphic
Euro area unemployment rate at 10.5%
 3/2016-7 January 2016 November 2015 Euro area unemployment rate at 10.5% EU28 at 9.1% The euro area (EA19) seasonally-adjusted unemployment rate was 10.5% in November 2015, down from 10.6% in October 2015,
NEW PASSENGER CAR REGISTRATIONS BY ALTERNATIVE FUEL TYPE IN THE EUROPEAN UNION 1 Quarter
 PRESS EMBARGO: NEW PASSENGER CAR REGISTRATIONS BY ALTERNATIVE FUEL TYPE IN THE EUROPEAN UNION 1 Quarter 2 2017 Alternative fuel vehicle registrations: +38.0% in second quarter of 2017 In the second quarter
Overview of Global Fuel Economy Policies
 Overview of Global Fuel Economy Policies Zifei Yang Researcher 2018 APCAP Joint Forum and Clean Air Week Theme: Solutions Landscape for Clean Air Bangkok, Mar 20, 2018 What is ICCT? ICCT is an independent
Survey on passengers satisfaction with rail services. Analytical report. Flash Eurobarometer 326 The Gallup Organization
 Flash Eurobarometer 326 The Gallup Organization Flash Eurobarometer European Commission Survey on passengers satisfaction with rail services Analytical report Fieldwork: March 2011 Publication: June 2011
PIVE 1 PIVE 2 PIVE 3 PIVE 4 PIVE 5 PIVE 6 PIVE 7 PIVE
 Title of the measure: SPA51-PIVE Efficient-Vehicle Incentive Programme General description PIVE Programme was approved in Cabinet Meeting of 27 September 2012 with an initial budget allocation of 75 million,
Alfen acquires Elkamo in Finland A platform for expansion in the Nordics
 Alfen acquires Elkamo in Finland A platform for expansion in the Nordics 2 July 2018 Disclaimer This communication may include forward-looking statements. All statements other than statements of historical
C O N S U L T JATO CONSULT CO 2 REPORT EXTRACT [AUGUST 2015] All Rights Reserved JATO Dynamics Ltd 1
![C O N S U L T JATO CONSULT CO 2 REPORT EXTRACT [AUGUST 2015] All Rights Reserved JATO Dynamics Ltd 1](/thumbs/77/75876229.jpg "C O N S U L T JATO CONSULT CO 2 REPORT EXTRACT [AUGUST 2015] All Rights Reserved JATO Dynamics Ltd 1") C O N S U L T JATO CONSULT CO 2 REPORT EXTRACT [AUGUST 2015] All Rights Reserved JATO Dynamics Ltd 1 JATO CONSULT CO 2 REPORT EXTRACT This report continues JATO s focus on the average CO 2 emissions of
C O N S U L T JATO CONSULT CO 2 REPORT EXTRACT [AUGUST 2015] All Rights Reserved JATO Dynamics Ltd 1 JATO CONSULT CO 2 REPORT EXTRACT This report continues JATO s focus on the average CO 2 emissions of
BIODIESEL CHAINS. Biofuels in Poland
 BIODIESEL CHAINS Bucharest, 28th June 2007 Biofuels in Poland Oskar Mikucki KAPE 2007-08-29 The Polish National Energy Conservation Agency 1 History 1990s at the Radom Engineering University oilseed rape
Fiscal incentives and Feebates as tools for improving efficiency in transport sector
 Fiscal incentives and Feebates as tools for improving efficiency in transport sector Zifei Yang Researcher Taller sobre Propuestas para Impuestos e Incentivos para Promover la Importación de Vehículos
Andrew Winder. Project Manager ERTICO ITS Europe.
 Intelligent mobility here and now Sustainable urban mobility through integrating usage schemes for electric light vehicles with the transport system and road infrastructure Andrew Winder Project Manager
Ref. award criteria final version of chapter from Environmental Signals 2002
 Ref. award criteria 10.3 - final version of chapter from Environmental Signals 2002 Technical annex IIb 4. Transport policy issue indicator assessment decoupling transport volume growth from economic growth
A fair deal for cars. Strategies for internalisation. Huib van Essen, 6 December 2012
 A fair deal for cars Strategies for internalisation Huib van Essen, 6 December 2012 Buzzing around for decades Fair and efficient pricing Marginal Social Cost Pricing Internalisation of external cost Market-based
NEW ALTERNATIVE FUEL VEHICLE REGISTRATIONS IN THE EUROPEAN UNION 1 Q2 2015
 NEW ALTERNATIVE FUEL VEHICLE REGISTRATIONS IN THE Q2 2015 New alternative fuel vehicle (AFV) registrations in the EU by engine type Q2 2014 Q2 2015 Thousand units 70 60 50 40 30 20 10 0 EVs HEVs AFVs other
Bus The Case for the Bus
 Bus 2020 The Case for the Bus Bus 2020 The Case for the Bus Introduction by Claire Haigh I am sure we are all pleased that the economy is on the mend. The challenge now is to make sure people, young and
Introduction of the Digital Tachograph
 European Commission Directorate-General for Energy and Transport Introduction of the Digital Tachograph Background and latest developments By Leo Huberts (EC-DG TREN) Historical overview 1992: Commission
G u i d e l i n e S U S T A I N A B L E P A R K I N G M A N A G E M E N T Version: November 2015
 G u i d e l i n e S U S T A I N A B L E P A R K I N G M A N A G E M E N T Version: November 2015 Parking management is a powerful tool for cities to influence transport. By managing the supply, design
Autumn 2015 Economic Forecast: Moderate recovery despite challenges
 European Commission - Press release Autumn 2015 Economic Forecast: Moderate recovery despite challenges Brussels, 5 November 2015 The economic recovery in the euro area and the European Union as a whole
Vossloh Rail Vehicles
 Vossloh Rail Vehicles Economic Mobility June 2010 Vossloh Rail Vehicles Business Areas LOCOMOTIVES Diesel-Electric Electric Shunting Components for locomotives (bogies) PASSENGER VEHICLES Metros Tramways
L O W E M I S S I O N CITY
 A V I SION FOR AN ULTRA - L O W E M I S S I O N CITY Improving Air Quality in London Elliot Treharne Air Quality Manager June 2014 Central London Kuwait New Zealand Qatar Czech London in 6 facts Global
CNG as a Transport Fuel - Economic Benefits 17 th November 2011
 CNG as a Transport Fuel - Economic Benefits 17 th November 2011 6 Grand Canal Wharf, South Dock Road, Ringsend, Dublin 4, Ireland. Tel: +353 1 6670372 Fax: +353 1 6144499 Web: www.dkm.ie Our scope of work
NEW PASSENGER CAR REGISTRATIONS BY ALTERNATIVE FUEL TYPE IN THE EUROPEAN UNION 1 Quarter
 PRESS EMBARGO: NEW PASSENGER CAR REGISTRATIONS BY ALTERNATIVE FUEL TYPE IN THE EUROPEAN UNION 1 Quarter 2 2016 Alternative fuel vehicle registrations: +0.6% in second quarter of 2016 In the second quarter
Labelling Smart Roads DISCUSSION PAPER 4/2015
 DISCUSSION PAPER 4/2015 December 2015 TABLE OF CONTENTS 1. Introduction... 3 2. The Smart Roads of the Future... 3 3. : Sustainability of road infrastructure... 4 4. : Sustainability in mobility management
NEW PASSENGER CARS BY FUEL TYPE IN THE EUROPEAN UNION 1 Quarter
 PRESS EMBARGO: NEW PASSENGER CARS BY FUEL TYPE IN THE EUROPEAN UNION 1 Quarter 1 2018 Next press release: Thursday 6 September 2018 1 Data for Croatia, Cyprus, Luxembourg and Malta is not available Page
The EU s Advanced Biofuels and Post 2020 policy
 The EU s Advanced Biofuels and Post 2020 policy Rob Vierhout, MSc ISCC fi?h Regional Stakeholder MeeEng 29 September 2016 - Las Vegas Agenda The EU Energy & Climate policy post 2020 Low Emission Mobility
Technologies for Urban Transport
 Downloaded from orbit.dtu.dk on: Dec 19, 2017 Technologies for Urban Transport Dhar, Subash; Shukla, P.R. Publication date: 2013 Link back to DTU Orbit Citation (APA): Dhar, S., & Shukla, P. R. (2013).
Focus on French policy for low-carbon vehicle promotion and development
 Focus on French policy for low-carbon vehicle promotion and development Pierre Mourlevat Ministre Conseiller Pauline pour GIROT les Affaires DE LANGLADE, Economiques, Counselorchef for Industry service
NEW PASSENGER CARS BY FUEL TYPE IN THE EUROPEAN UNION 1 Quarter
 PRESS EMBARGO: NEW PASSENGER CARS BY FUEL TYPE IN THE EUROPEAN UNION 1 Quarter 1 2018 Next press release: Thursday 6 September 2018 1 Data for Croatia, Cyprus, Luxembourg and Malta is not available Page
Mauritius 1.1 Background
 Mauritius 1.1 Background Mauritius depends on imported fuel for close to 83% of its energy needs. The CO2 emissions associated with the burning of fossil fuels are on the rise, with per capita emissions
THE PEP PARTNERSHIP ON ECODRIVING Goals, achievements and new projects November 2016
 THE PEP PARTNERSHIP ON ECODRIVING Goals, achievements and new projects November 2016 BENEFITS OF ECODRIVING Results all from EcoDriving projects all over Europe prove that educated and trained drivers
Transportation Demand Management Element
 Transportation Demand Management Element Over the years, our reliance on the private automobile as our primary mode of transportation has grown substantially. Our dependence on the automobile is evidenced
BIODIESEL CHAINS. Biofuels in Poland
 BIODIESEL CHAINS Nicosia, 18th January 2007 Biofuels in Poland Oskar Mikucki KAPE 2007-08-29 The Polish National Energy Conservation Agency 1 Development of biofuels market Development of biofuels in Poland
The Automotive Industry
 WLTP AUTOMOTIVE INDUSTRY GUIDE WLTP GUIDANCE FOR The Automotive Industry NEDC WLTP Executive Summary The purpose of this guide is to provide an overview of WLTP and its transition into UK policy and consumer
Energy Efficiency Transport Sector
 Energy Efficiency Transport Sector Danida Fellowship Course 2015 Xianli Zhu Copenhagen Centre on Energy Efficiency (C2E2) UNEP DTU Partnership 18 August 2015 Outline Status & trends of energy use in the
Increase of the sales by 33% mainly due to the Safelite acquisition
 36 - Vehicle Glass Repair and Replacement Increase of the sales by 33% mainly due to the Safelite acquisition 37 Key events in Vehicle Glass Repair and Replacement January 2007 The launch in the UK of
Recent development of liquid biofuels in the European Union. 14 July 2006 Sofia Jean-Marc Jossart
 Recent development of liquid biofuels in the European Union 14 July 26 Sofia Jean-Marc Jossart Content - Directives 23/3 and 96 - Biomass Action Plan - EU strategy for biofuels -BIOFRAC andebtp -Standards
COMMISSION OF THE EUROPEAN COMMUNITIES REPORT FROM THE COMMISSION. Quality of petrol and diesel fuel used for road transport in the European Union
 COMMISSION OF THE EUROPEAN COMMUNITIES Brussels, 2.3.2005 COM(2005) 69 final REPORT FROM THE COMMISSION Quality of petrol and diesel fuel used for road transport in the European Union Second annual report
Overview of Global Fuel Economy Policies
 Overview of Global Fuel Economy Policies Zifei Yang Researcher 2018 APCAP Joint Forum and Clean Air Week Theme: Solutions Landscape for Clean Air Bangkok, Mar 20, 2018 What is ICCT? ICCT is an independent
Challenges and solutions for transport in Norway
 Challenges and solutions for transport in Norway Therese Ustvedt, adviser Director General s Staff Norwegian Public Roads Administration Transport Network Public roads, total 94 600 km - National roads
NEW PASSENGER CAR REGISTRATIONS EUROPEAN UNION 1
 PRESS EMBARGO: 8.00 AM (6.00 AM GMT), 19 September 2018 NEW PASSENGER CAR REGISTRATIONS EUROPEAN UNION 1 Passenger car registrations: +6.1% eight months into 2018; +10.5% in July and +31.2% in August In
-Mobility Solutions. Electric Taxis
 -Mobility Solutions Electric Taxis This paper was prepared by: SOLUTIONS project This project was funded by the Seventh Framework Programme (FP7) of the European Commission Solutions project www.uemi.net