Published by the Stationery Office, Dublin, Ireland. To be purchased from the: or through any bookseller.
|
|
|
- Delilah Bates
- 6 years ago
- Views:
Transcription
1 Published by the Stationery Office, Dublin, Ireland. To be purchased from the: Central Statistics Office, Information Section, Skehard Road, Cork, Government Publications Sales Office, Sun Alliance House, Molesworth Street, Dublin 2, or through any bookseller. Prn A8/1880 Price 15 December 2008
2 Government of Ireland 2008 Material compiled and presented by Central Statistics Office. Reproduction is authorised, except for commercial purposes, provided the source is acknowledged. ISSN ISBN
3 3 Transport 2007 Preface Welcome to the second issue of the Transport Omnibus (Transport 2007). This annual report is also available in electronic format from the CSO website and can be downloaded free of charge at The purpose of this thematic report is to provide a comprehensive presentation of the data currently available in the field of transport. It brings together a wide range of transport statistics and provides a useful reference source to those interested in the Transport sector. The information contained in this report is sourced from statistics compiled by both the CSO and other producers of statistical data on this topic. Appreciation is extended to all such organisations for their assistance in providing CSO with administrative data on transport statistics. In general the tables contained in this report relate to the year Where 2007 data was not available 2006 data has instead been substituted. We hope that you find this publication useful and interesting and we would welcome any comments and feedback you may have. Any such should be sent to Transport Section, Central Statistics Office, Skehard Road, Cork or ed to transport@cso.ie.
4
5 5 Transport 2007 Contents Page Commentary 13 Chapter 1 Vehicle Licensing and Registrations Table 1.1 Number of Mechanically Propelled Vehicles under Current Licence, Table 1.2 Number of Mechanically Propelled Vehicles by Tax Class and County at 31/12/ Table 1.3 All Vehicles Licensed for the First Time by Class, Table 1.4 Number of New Vehicles Licensed for the First Time by Class and Type of Fuel, Table 1.5 Number of New Private Cars Licensed for the First Time by Type of Fuel, Table 1.6 Number of New Private Cars Licensed for the First Time by Engine Capacity(cc), Table 1.7 Number of New Private Cars Licensed for the First Time by Most Popular Make, Table 1.8 Number of Second-hand (Imported) Private Cars Licensed for the First Time by Most Popular Make, Table 1.9 Number of New Motor Cycles Licensed for the First Time by Engine Capacity and Make, Table 1.10 Number of Second-hand (Imported) Motor Cycles Licensed for the First Time by Engine Capacity and Make, Table 1.11 Number of New Vehicles Licensed in each Local Authority 2007 by Head of Population (2006) 27 Table 1.12 Number of New Vehicles Licensed in each Local Authority, Table 1.13 Number of Change of Vehicle Ownership Forms Processed by County, Table 1.14 Number of Change of Vehicle Ownership Forms Processed, Table 1.15 Value Profile of New Cars Registered, Table 1.16 Value Profile of Used (Imported) Cars Registered, Table 1.17 Age Profile of Used (Imported) Cars Registered, Table 1.18 Country of Last Registration of Used (Imported) Cars, Table 1.19 Annual Average Kilometres Travelled by Private Car, Table 1.20 Annual Average Kilometres Travelled by Private Car by Engine Size Band and Fuel Type, Table 1.21 Estimate of Petrol and Diesel Consumption by Emissions Category, Chapter 2 Driver and Vehicle Testing Table 2.1 Number of Current Driving Licences by Type in each Licensing Authority at 31/12/ Table 2.2 Number of Current Driving Licences by Type and Gender in each Licensing Authority at 31/12/
6 Transport Table 2.3 Number of Current Full Driving Licences by Age in each Licensing Authority at 31/12/ Table 2.4 Number of Current Provisional Driving Licences by Age in each Licensing Authority at 31/12/ Table 2.5 Number of Current Driving Licenses by Age and Gender at 31/12/ Table 2.6 Driving Tests Statistics, Table 2.7 Driving Test Pass Rates by Gender, Table 2.8 Driving Test Pass Rate by Gender and Centre, Table 2.9 Driving Test Pass Rates by First Time Applicants, Table 2.10 Driving Test Pass Rates by Non-First Time Applicants, Table 2.11 Driving Test Pass Rate by Age Group, Table 2.12 Number of tests conducted by the Driver Theory Testing Service, Table 2.13 Waiting Time for Driving Tests by Centre, Table 2.14 National Car Test Results by Test Centre for year ending 31/12/ Chapter 3 Penalty Points Table 3.1 Number of Penalty Points Issued by Offence Type (Cumulative) to 31/12/ Table 3.2 Number of Penalty Points issued By Offence Type, Table 3.3 Breakdown of Penalty Points issued By Licence Type, (Cumulative) to 31/12/ Table 3.4 Number of Penalty Points issued by Gender and County, Table 3.5 Number of Penalty Points issued by Gender and Age, Table 3.6 Number of Penalty Points issued by Gender and Offence Type, Table 3.7 Number of Penalty Points issued to Females by Age and Main Offence Type, Table 3.8 Number of Penalty Points issued to Males by Age and Main Offence Type, Table 3.9 Number of Penalty Points issued to Females by County and Main Offence Type, Table 3.10 Number of Penalty Points issued to Males by County and Main Offence Type, Chapter 4 Road Safety and Road Lengths Table 4.1 Number of Persons Killed classified by Road User Type, Table 4.2 Number of Persons Injured classified by Road User Type, Table 4.3 Number of Persons Killed and Injured by County, Table 4.4 Number of Female Casualties classified by Road User Type and Age, Table 4.5 Number of Male Casualties classified by Road User Type and Age, Table 4.6 Number of Road Deaths and Number of Vehicles under current licence, Table 4.7 Road Fatalities classified by Month of Year,
7 7 Transport 2007 Table 4.8 Number of Traffic Collisions and Casualties classified by Month of Year, Table 4.9 Number of Fatal and Injury Collisions and Casualties classified by Day of Week, Table 4.10 Number of Fatal and Injury Collisions and Casualties classified by Hour of Day, Table 4.11 Number of Traffic Collisions and Casualties in each County, Table 4.12 Table 4.13 Table 4.14 Number of Drivers of Cars Involved in Fatal and Injury Collisions classified by Age and Gender, Number of Cars and Goods Vehicles Involved in Fatal and Injury Collisions classified by Driver s Country of Residence, Number of Users of Cars Involved in Fatal and Injury Collisions classified by Seat Belt Usage, Table 4.15 National Road Length in Kilometres by Carriageway Type, Table 4.16 National Route Length in Kilometres by Carriageway Type and Local Authority, Chapter 5 Road Freight Transport Table 5.1 Road Freight Transport Statistics Summary, Table 5.2 Road Freight Transport Activity classified by Main type of work and Main use of vehicle, Table 5.3 Road Freight Transport Activity classified by Business of owner and Main use of vehicle, Table 5.4 Road Freight Transport Activity classified by Region of origin and Region of destination, Table 5.5 Road Freight Transport Activity classified by Group of goods and Main use of vehicle, Table 5.6 Average Number of Road Freight vehicles classified by Unladen weight, Year of manufacture and Main use of vehicle, Table 5.7 Number of Licensed Road Hauliers by County, Chapter 6 Aviation Transport Table 6.1 Total Passenger Numbers handled by Airport, Table 6.2 Passenger Numbers handled classified by Main Airport and Month, Table 6.3 Table 6.4 Table 6.5 Table 6.6 Number of Passengers handled by Main Airport classified by National/International traffic and Month, Number of Passengers handled by Main Airport classified by Arrivals/Departures and Month, Number of Passengers handled by Main Airport classified by Scheduled/Non Scheduled travel and Month, Number of Flights handled by Main Airport classified by National/International traffic and Month, Table 6.7 Number of Flights handled by Main Airport classified by Arrivals/Departures and Month, Table 6.8 Number of Flights handled by Main Airport classified by Scheduled/Non Scheduled travel and Month,
8 Transport Table 6.9 Air Freight handled by Main Airport classified by National/International traffic and Month, Table 6.10 Air Freight handled by Main Airport classified by Arrival/Departure and Month, Table 6.11 Top 10 International Arrivals for Cork Airport by Number of Passengers, Table 6.12 Top 10 International Arrivals for Dublin Airport by Number of Passengers, Table 6.13 Top 10 International Arrivals for Knock Airport by Number of Passengers, Table 6.14 Top 10 International Arrivals for Shannon Airport by Number of Passengers, Table 6.15 Top 5 International Arrivals for Kerry Airport by Number of Passengers, Table 6.16 Top 5 International Arrivals for Galway Airport by Number of Passengers, Table 6.17 Top 5 International Arrivals for Waterford Airport by Number of Passengers, Table 6.18 Table 6.19 International Passenger Numbers arriving in Irish Airports on Direct Flights by Region of Origin, International Passenger Numbers departing from Irish Airports on Direct Flights by Region of Destination, Chapter 7 Public Transport Table 7.1 Number of Scheduled Bus Passenger Services, Table 7.2 Average Daily Flow of Dublin Bus Passengers by Time of Day, Table 7.3 Average Weekly Flow of Dublin Bus Passengers by Day of Week, Table 7.4 Dublin Bus Passenger Numbers by Month, Table 7.5 Dublin Bus Fleet by Garage, Table 7.6 Dublin Bus Driver Profile by Gender and Age, Table 7.7 Average Daily flow of Bus Éireann Passengers by City Services and Time of Day, Table 7.8 Average Weekly flow of Bus Éireann Passengers by City Services and Day of Week, Table 7.9 Bus Éireann Passenger Numbers, Table 7.10 Bus Éireann Fleet, Table 7.11 Number of Licensed Bus Operators by County, Table 7.12 Average Daily Flow of Luas Passengers by Time of Day and Line, Table 7.13 Average Weekly Flow of Luas Passengers by Day of Week and Line, Table 7.14 Luas Passenger Numbers by Month and Line, Table 7.15 Luas Driver Age Profile, Table 7.16 Additional Luas Data, Table 7.17 Summary of Passenger and Freight Traffic by Rail, Table 7.18 Principal Commodities conveyed by Rail,
9 9 Transport 2007 Table 7.19 Rail Infrastructure, Chapter 8 Maritime Transport Table 8.1 Total Tonnage of Goods handled by Irish Ports, Table 8.2 Tonnage of Goods handled by Irish Ports classified by Region of Trade, Table 8.3 Number of Arrivals to Irish Ports and Gross Tonnage of Vessels by Type of Vessel, Table 8.4 Number of Arrivals to Irish Ports and Gross Tonnage of Vessels classified by Type of Vessel, Table 8.5 Total Tonnage of Goods handled by Irish Ports classified by Ports and Region of Trade, Table 8.6 Total Tonnage of Goods handled by Irish Ports classified by Port and Category of Traffic, Table 8.7 Number of Cruise Ships and Passengers by Port, Table 8.8 Number of Cruise Ships by Month of Arrival and Passengers, Table 8.9 Summary of Roll on / Roll off Traffic Chapter 9 Public Service Vehicle Transport Table 9.1 Number of Public Service Vehicles by Type and Age, Table 9.2 Number of Public Service Vehicles by Type and County of Licensing, Table 9.3 Number of Public Service Vehicles by Type and Main Make, Table 9.4 Number of Public Service Vehicles by County and Age of Vehicle, Table 9.5 Age Profile of Public Service Vehicle Fleet by Type, Table 9.6 Top 10 Public Service Vehicles by Model, Table 9.7 Top 10 Public Service Vehicles (Hackneys) by Model, Table 9.8 Top 10 Public Service Vehicles (Taxis) by Model, Table 9.9 Average Annual Distance Travelled by Taxi/Hackney Chapter 10 Road Traffic Volumes Graphs Average Weekday Traffic Volumes at Airport Nth (Dublin) (M01), Average Weekday Traffic Volumes at Finglas (Dublin) (M50), Average Weekday Traffic Volumes at Blanchardstown North (Dublin) (M50), Average Weekday Traffic Volumes at Blanchardstown Toll (Dublin) (M50), Average Weekday Traffic Volumes at Ballinteer (Dublin) (M50), Average Weekday Traffic Volumes at Balbriggan Sth (Dublin) (M01), Average Weekday Traffic Volumes at Little Island (Cork) (N25),
10 Transport Average Weekday Traffic Volumes at Ballincollig ByPass (Cork) (N22), Average Weekday Traffic Volumes at Blackpool (Cork) (N20), Average Weekday Traffic Volumes at Mitchelstown (Cork) (N08), Average Weekday Traffic Volumes at Hurlers Cross (Clare) (N18), Average Weekday Traffic Volumes at Cratloe (Clare) (N18), Average Weekday Traffic Volumes at Raheen (Limerick) (N20), Average Weekday Traffic Volumes at Annacotty (Limerick) (R445), Average Weekday Traffic Volumes at Edmund Rice Bridge (Waterford) (N25), Average Weekday Traffic Volumes at Dungarvan (Waterford) (N25), Average Weekday Traffic Volumes at Claregalway (Galway) (N17), Average Weekday Traffic Volumes at Tuam Road (Galway) (N17), Average Weekday Traffic Volumes at Fassaroe, Bray (Wicklow) (N11), Average Weekday Traffic Volumes at Jack Whites (Wicklow) (N11), Average Weekday Traffic Volumes at Horse and Jockey (Tipperary) (N08), Average Weekday Traffic Volumes at Abbeyleix (Laois) (N08), Average Weekday Traffic Volumes at Portlaoise East (Laois) (M07), Average Weekday Traffic Volumes at Portlaoise South (Laois) (N08), Average Weekday Traffic Volumes at Athlone (Westmeath) (N06), Average Weekday Traffic Volumes at Dunleer ByPass (Louth) (M01), Table 10.1 Comparative Bus and Car Journey Times for Dublin City, Table 10.2 Summary of Volumes of Cars, Buses and Bus Passengers on Dublin Quality Bus Corridors Chapter 11 Prices Table 11.1 Table 11.2 Table 11.3 Table 11.4 Comparison of Annual Consumer Price Index (CPI) with Fuel and Lubricants Index, 1997 to Comparison of Monthly Consumer Price Index (CPI) with Fuel and Lubricants Index, January 2006 to September Comparison of Annual Consumer Price Index (CPI) with Purchase of Vehicles Index, Comparison of Monthly Consumer Price Index (CPI) with Purchase of Vehicles Index, January 2006 to September Table 11.5 Comparison of Annual Consumer Price Index (CPI) with Transport Services Index, 1997 to Table 11.6 Comparison of Monthly Consumer Price Index (CPI) with Air and Sea Transport Index, January 2006 to September
11 11 Transport 2007 Table 11.7 Table 11.8 Comparison of Annual Consumer Price Index (CPI) with other Transport Related Costs Index, 1997 to Comparison of Monthly Consumer Price Index (CPI) with Index of Other Transport Related Costs, January 2006 to September
12
13 13 Transport 2007 Commentary Vehicle Licensing and Registrations At the end of 2007 there were almost 2.45 million vehicles licensed in Ireland. Private cars made up 77% of the total, with goods vehicles making up a further 14%. The size of the national vehicle fleet has increased by 70% since During 2007, 246,446 new vehicles were licensed for the first time with private cars making up 73% of this total. Almost 59,000 second-hand (imported) private cars were licensed during 2007, an increase of 8% of the 2006 total. Other licensing data for 2007 showed that: Of the 246,446 new vehicles licensed in 2007, 55% were petrol, 44% were diesel with the remaining 1% being alternative fuels (petrol/electric, petrol/ethanol or other). Over 47% of new private cars licensed were in the engine capacity range cc, 31% were in the 1301 to 1500 cc range, 16% were in the 1300 cc and lower range with the remaining 6% belonging to the greater than 2400 cc range. The five most popular makes of new private cars licensed were Toyota (15.0%), Volkswagen (11.7%), Ford (11.1%), Opel (9.0%) and Nissan (7.5%). The five most popular makes of second-hand (imported) private cars licensed were Toyota (15.7%), Volkswagen (11.4%), BMW (9.1%), Audi (7.3%) and Honda (7.3%). Over 51% of new car registrations had a value in the range of 15,001 to 25,000. Over 83% of second-hand (imported) cars registered in 2007 originated from the United Kingdom. In 2007, the average annual kilometres travelled by private petrol cars was 15,895 km while private diesel cars travelled on average 24,242 km. Driver and Vehicle Testing The tables in this chapter have been sourced from both the Department of Transport s annual publication Irish Bulletin of Vehicle and Driver Statistics and the Road Safety Authority. Of the 2,539,090 driving licences held at the end of 2007, 83% were full licence holders with the remaining 17% being held by provisional drivers. In 2007 a total of 290,678 applications for driving tests were received, an increase of 34% on In addition: 197,866 driving tests were conducted in 2007, an increase of 25% from the previous year. The average waiting time for a test at the end of 2007 was 18.9 weeks compared with 29.8 weeks in The driving test centre with the longest waiting time was Clifden (40 weeks) while Donegal, Monaghan and Mullingar shared the shortest waiting time for testing (9 weeks). Males had a pass rate of 55.9% while females had a pass rate of 54.6% in In 2007, the percentage of first time applicants who passed the driving test (56.6%) was higher than those who previously sat the test (52.9%) which represented a change to the trend that was evident in previous years. Applicants aged from 22 to 25 years of age had a pass rate of 60.8% in Those aged 21 years and younger had a pass rate of 58.8% while those aged 26 years and older had a pass rate of 51.8%. Almost 170,000 people sat the Driver Theory Test in 2007 with 64% passing the test.
14 Transport Over 686,000 NCT tests were carried out in 2007 with 93% of the vehicles passing the test. Almost 52% of vehicles passed the test on the first test, while 41.6% of vehicles passed following re-testing. Penalty Points At the end of December 2007, 755,015 points had been issued since the introduction of the scheme in October, During 2007, 326,598 penalty points were issued an increase of 75% on the previous year. Of these: 76% were issued to males and 24% to females. The two most common offence types for males were speeding and no safety belt on the driver. The two most common offence types for females were speeding and driving a vehicle while holding a mobile phone. 74% of all points issued during 2007 related to speeding. Drivers aged from 21 to 30 accounted for almost 24% of points issued, while those aged from 31 to 40 incurred almost 25% of the points issued. Over 14% of the points issued were unassigned, as no driver number was available. Road Safety and Road Lengths The data on Road Safety has been sourced from the Road Safety Authority. There were 338 people killed on Irish Roads in However, at the time of publication detailed tables on Road collisions for 2007 were not available so 2006 data has instead been included for analysis. In 2006: 365 people were killed on Irish Roads. Car users made up 62% of persons killed and 68% of persons injured. Pedestrians accounted for 20% of fatalities and 11% of persons injured. The worst month for fatalities was January when 40 people died. The worst days of the week for fatalities during 2006 were Sundays and Mondays. These two days accounted for 144 fatalities or 39% of the total. In 2007 there were 5,428 kilometres of National Roads. Of this 87% was single carriageway, 8% was dual carriageway and 5% was motorway. In the period from 2004 to 2007 the length of motorways increased from 192 km to 269 km, an increase of 40%. Road Freight Transport The tables in this chapter are based on the results of the CSO s National Survey of Transport of Goods by Road carried out for the year During the year information was collected concerning one week s transport activity for a random sample of goods vehicles. The sample was spread evenly over each week in the year. The principle measures used to assess transport activity are the weight of goods carried (given in tonnes) and the quantity of work done (given in tonne-kilometres). In 2007, Irish registered goods vehicles transported a total of almost 315 million tonnes of goods by road. This represents an increase of 1% on the previous year and an increase of 203% since 1997.
15 15 Transport 2007 Activity in terms of tonne-kilometres increased by 8.2% from 17,687 million in 2006 to 19,146 million in There was an increase of 174% in the figure for tonne-kilometres over the ten-year period from 1997 to A total of 2,662 million vehicle kilometres was travelled in 2007, an increase 5.5% on the 2006 figure of 2,523 million and an increase of 120% on the 1997 figure. The average number of goods vehicles with an unladen weight of 2 tonnes and over, under current license during 2007 was 121,697, representing an increase of almost 15% on the 2006 figure. The fleet size increased by 169% since The goods category Crude and manufactured minerals and building materials made up over 61% of the total tonnage carried but only made up 29% of the total tonne-kilometres in Vehicles used mainly for hire or reward transport were responsible for 57% of the total weight of goods carried in These vehicles also performed 72% of the total activity in terms of tonne-kilometres and travelled 54% of total vehicle kilometres. Given that these vehicles accounted for only 22% of the fleet size, it is clear that they were used more intensively than those vehicles used mainly for own account transport. Aviation Transport Tables 6.1 to 6.10 in this chapter have been created using data collected under Table A of EC Regulation 437/2003 which deals with commercial air traffic. The totals in the tables may differ from data published by the airports and other bodies because of the manner in which certain categories of traffic (eg transit passengers) are handled. In addition it is not possible to compute totals for some tables due to the double reporting of arrivals and departures of domestic traffic. In 2007 almost 31.5 million passengers passed through Irish airports, an increase of 7% on the previous year. Of this Dublin Airport had the majority of the passenger traffic (74%), followed by Shannon (11%) and Cork (10%). Further analysis of the 2007 data showed that: July was the busiest month of the year for international traffic with nearly 3.1 million passengers passing through Irish airports. International traffic made up 95% of all passenger movements in 2007 for Dublin airport. Scheduled flights made up 87% of Cork airport s traffic for Almost 237,000 commercial international flights were made through Irish airports in In 2007 international flights made up 86% of Shannon s commercial flight movements. Almost 117,000 tonnes of international air freight was handled by Irish airports in The data in tables 6.11 to 6.19 have been created using data extracted from the CSO s Airport Pairings database which contains information on every direct flight in and out of nine Irish Airports on a monthly basis. For further details please go to These tables show that the United Kingdom is the source of over 42% of all international direct flights into and out of Ireland. Public Transport In 2007 Bus Eireann had a vehicle fleet of 691 buses which travelled almost 93 million kilometres carrying over 95 million passengers. Over 45 million of these passengers were carried on the school transport scheme, with 22.1 million being carried on provincial city and town services and the remaining 28.1 million being carried on other scheduled services. In Cork 12.6 million passengers travelled on the city service, with 3.5 million passengers travelling on both Limerick and Galway city services. The peak travel periods on the provincial city services were from 8.00 a.m. to 9.00 a.m. and from p.m. to p.m..
16 Transport Dublin Bus had a vehicle fleet of 1,145 buses in 2007 which travelled over 63 million kilometres and carried million passengers. Over 70% of the Dublin Bus vehicle fleet were low floor (wheelchair accessible). Only 3.5% of Dublin Bus drivers were female while almost 42% of drivers were aged from 30 to 41 years of age. Almost 28.5 million people travelled on the Luas in 2007 with 15.8 million travelling on the Red line and 12.6 million on the Green line. The peak travel periods were from 8.00 a.m. to 9.00 a.m. and from p.m. to p.m. when 23.6% of the average daily passengers travelled. On average Friday was the busiest day of the week with weekdays being busier than weekend days. The age profile of Luas drivers showed that 37.7% of drivers were aged from 35 to 45 years of age while females accounted for almost 4% of drivers. Over 45.5 million passengers travelled on Irish Rail in 2007, an increase of 5% on 2006 traffic. Dart passengers accounted for 44.5% of the total number of passenger numbers. In addition Irish Rail carried over 825 thousand tonnes of freight in 2007, with mineral ores being the principle commodity carried. Maritime Transport The tables in this chapter are based on the CSO s annual release Statistics of Port Traffic, In 2007 Irish ports handled million tonnes of goods compared with million tonnes in an increase of 0.82 million tonnes (+1.5%). Goods received increased by 0.9% in comparison with 2006, while goods forwarded increased by 3.2%. The annual analysis also showed that: The number of vessels that arrived in 2007 was 16,085 compared with 16,042 in 2006 an increase of 0.3%. Imports accounted for 72% of the total tonnage of goods handled while exports accounted for 28%. Since 2001 the total tonnage of goods forwarded from Irish ports to the EU (excluding UK) has increased by 29.7%. Of the total tonnage of goods handled in 2007, dry bulk accounted for 29.2%, liquid bulk 26.5%, roll-on/roll-off 23.2%, lift-on/lift-off 16.4% and break bulk 4.7%. In cruise ships visited Irish ports carrying almost 106,000 passengers. The busiest month for cruise ship traffic was September when 33 cruise ships carrying 26,002 passengers visited Irish ports. Public Service Vehicle Transport The tables in this chapter are sourced from the data made available to the CSO from the Taxi Regulator and from Sustainable Energy Ireland. The analysis of the data for 2007 showed that: At the end of 2007 there were 25,695 public service vehicles (PSV) licensed in Ireland. Of these 17,992 (70%) were taxis, 4,868 (19%) were hackneys, 1,504 (6%) were wheelchair accessible taxis with 1,331 (5%) being limousines. Over 48 % of the PSV fleet was licensed in Dublin, with Cork having almost 9%, Galway having almost 5% and Limerick having 3% of the fleet. Over 35% of the PSV fleet was less than 4 years old, with vehicles from 5 to 6 years old making up 22% of the fleet. Toyota was the most popular car make for both taxis and hackneys with Fiat being the most popular make for Wheelchair accessible taxis and Mercedes-Benz being the most popular make for limousines.
17 17 Transport 2007 The top three car models in the PSV fleet were the Toyota Avensis (17.47%), Skoda Octavia (6.31%) and Nissan Primera (6.28%). In 2007, the average annual distance travelled for taxi/hackneys fuelled by diesel was 56,013 km while those fuelled by petrol was 36,313 km. Road Traffic Volumes The charts and tables in this Chapter have been created using the National Road Authority s (NRA) Traffic Count data. The NRA maintains a network of approximately 140 traffic counters on National Roads throughout Ireland details of which are available to download from the NRA s website ( These traffic counters provide information on the volume of traffic by hour of day and vehicle class. Vehicles are detected by passing over loops embedded in the road surface. It is possible from the data collected to establish the vehicle profiles and the various vehicle classes involved. For the charts and tables in this chapter we extracted the average hourly weekday traffic volumes at some key locations throughout the country. The analysis of this data for 2007 showed that: The southbound traffic at the Airport North/M01 junction peaked at 8.00 am on weekdays with on average 3800 vehicles per hour being recorded while northbound traffic at the same count site peaked at 6.00 pm with an average of 4280 vehicles passing. At the Blanchardstown North/M50 count site the average traffic flows travelling northbound was heavier than southbound traffic for all peak periods during the day. Average weekday traffic volumes at the N25/Little Island count site in Cork peaked at 8.00 am for westbound traffic (2570 vehicles) and at 6.00 pm for eastbound traffic (2500 vehicles). Traffic at the N20/Raheen junction in Limerick flowed evenly in both directions with the traffic flowing Southwest and Northeast peaking at 9.00 am in the morning (an average of 1350 vehicles in each direction) and 6.00 pm in the evening (an average of 1550 vehicles recorded in both directions). Prices The tables and charts presented in this chapter are sourced from the monthly and annual average Consumer Price Index (CPI) and the sub indices that relate to Transport. The base period for the monthly indices is January, 2006 = 100 with the annual indices base period being Year 1997 = 100. The monthly tables present indices from January, 2006 to September, The tables show that while the all items CPI increased by 14.1% during this period. The price of petrol increased by 25.5% (Table 11.2). The price of purchasing new and second-hand motorcars has remained very low throughout and overall has fallen by 0.3% (Table 11.4). The price of air transport is highly seasonal compared with the all items CPI with Air prices dropping every May and increasing every July (Table 11.6). The price of motor car insurance has dropped significantly since May, 2006 and overall shows a decrease of 16.8% (Table 11.8). The annual average tables look at the change in the annual average indices for the period 1997 to They show that while the all items CPI increase by 42.4% in this period:
18 Transport the price for the purchase of new and second-hand motorcars increase by 11.9% (Table 11.3). the price for taxi fares increased by 98.8% (Table 11.5). the increase in the price of motor car insurance peaked in 2002 (+59.8%) but has subsequently reduced to 2.2% in 2007 (Table 11.7).
19 Chapter 1 Vehicle Licensing and Registrations
20 Transport Table 1.1 Number of Mechanically Propelled Vehicles under Current Licence, Number Year Private Cars Motor Cycles Goods Vehicles Tractors, Excavators, Dumpers, etc Public Service Vehicles Small Large Exempt Vehicles Others Total ,555 25,208 69,978 67,595 3,960 2,949 6,407 2, , ,098 26,305 84,103 68,392 4,329 3,107 6,085 2, , ,546 26,025 93,369 68,552 4,358 3,295 6,905 2, , ,087 25, ,475 66,149 4,710 3,422 7,146 2, , ,595 25, ,023 67,597 4,826 3,521 7,525 2, , ,459 24, ,764 69,219 4,952 3,701 7,598 2, , ,396 24, ,020 72,707 5,061 3,834 7,238 2,812 1,019, ,408 22, ,166 72,814 4,977 4,047 7,255 2,848 1,054, ,583 24, ,331 75,742 5,363 4,388 7,119 3,367 1,105, ,498 24, ,798 76,784 5,711 4,557 7,514 3,962 1,126, ,027 23, ,225 77,115 6,144 4,835 7,874 5,097 1,151, ,022 23, ,809 77,680 6,925 4,985 8,052 6,168 1,202, ,384 23, ,785 77,925 8,086 5,282 8,336 7,253 1,262, ,057,383 23, ,601 78,696 9,219 5,535 8,661 8,674 1,338, ,134,429 24, ,158 78,405 10,340 5,845 10,336 10,393 1,432, ,196,901 24, ,866 78,047 11,249 6,096 11,748 11,548 1,510, ,269,245 26, ,814 75,591 13,076 6,564 12,248 15,941 1,608, ,319,250 30, ,575 73,806 13,637 6,957 13,864 18,494 1,682, ,384,704 32, ,510 73,719 16,547 7,084 14,965 20,242 1,769, ,447,908 33, ,069 73,956 18,252 7,090 16,186 20,438 1,850, ,507,106 35, ,130 76,425 19,856 7,392 17,185 23,241 1,937, ,582,833 34, ,082 76,697 20,744 7,430 18,847 26,820 2,036, ,662,157 34, ,548 76,307 21,888 7,625 20,321 29,534 2,138, ,778,861 34, ,604 78,520 23,284 7,997 22,117 32,083 2,296, ,882,901 37, ,874 80,239 26,654 8,451 24,761 35,506 2,441,564 Source: Department of Transport

21 21 Transport 2007 Table 1.2 Number of Mechanically Propelled Vehicles by Tax Class and County at 31/12/2007 Number Licensing Authority Private Cars Goods Vehicles Tractors Motor Cycles Exempt PSV Vehicles Other Classes Total Carlow 25,327 6,028 1, ,050 35,129 Cavan 27,364 7,578 2, ,784 Clare 52,377 10,165 2, ,674 69,114 Cork 230,824 40,760 8,365 4,255 2,814 3,095 6, ,122 Donegal 58,149 14,671 3, ,023 2,438 81,005 Dublin 498,839 65,108 1,271 13,537 8,810 15,589 6, ,053 Galway 98,951 20,488 4,814 1,136 1,415 1,585 3, ,407 Kerry 64,094 12,540 4, ,718 86,128 Kildare 85,643 15,261 1,782 1, ,530 1, ,868 Kilkenny 39,351 8,624 3, ,435 54,799 Laois 29,224 6,251 2, ,749 Leitrim 12,926 3, ,735 Limerick 83,627 15,046 3,216 1, ,179 2, ,447 Longford 14,585 3,525 1, ,104 Louth 42,703 8, ,548 Mayo 53,250 12,732 4, ,071 73,686 Meath 74,711 15,482 2,148 1, ,594 1,535 97,657 Monaghan 22,144 7,228 1, ,057 Offaly 30,256 6,332 2, ,095 41,171 Roscommon 26,932 6,151 2, ,862 Sligo 27,246 5,338 1, ,128 North Tipperary 33,868 7,012 2, ,442 South Tipperary 38,921 8,151 2, ,154 52,535 Waterford 51,786 8,156 1,870 1, ,425 65,514 Westmeath 35,855 7,444 1, ,772 Wexford 63,792 14,613 3,655 1, ,139 86,605 Wicklow 60,156 10,085 1,453 1, ,542 76,143 Total 1,882, ,874 70,542 37,178 24,761 35,105 45,203 2,441,564 Source: Department of Transport
22 Table 1.3 All Vehicles Licensed for the First Time by Class, Number Taxation Class New vehicles Private cars 125, , , , , , , , , , ,754 Goods vehicles 18,895 23,811 30,066 33,606 30,622 28,412 30,532 31,165 38,396 43,619 46,043 Tractors 1,848 2,318 2,762 2,816 2,681 2,868 2,970 2,881 3,168 3,687 4,442 Motor cycles 2,717 3,117 4,955 6,871 6,919 5,596 4,993 3,833 3,240 3,206 3,522 Exempt vehicles 2,042 2,481 2,664 3,321 3,709 4,114 4,022 5,099 4,851 6,169 7,422 Public service vehicles 1,051 1,380 1,795 1,774 1,335 1,149 1,081 1,181 1,400 1,732 1,956 Small , ,033 1,283 Large Machines or Contrivances , ,123 1,241 1,359 1,327 1,445 Other classes Total new vehicles 153, , , , , , , , , , ,446 Second-hand (Imported) vehicles Private cars 41,554 39,565 36,878 24,003 15,237 13,352 13,472 21,391 38,207 54,244 58,719 Goods vehicles 4,888 5,388 9,285 6,983 5,958 5,285 6,294 7,948 11,590 15,228 14,785 Tractors 3,065 3,040 3,332 2,786 2,447 2,436 3,044 3,021 3,327 3,601 3,492 Other classes 4,263 4,643 5,524 5,530 5,776 6,031 6,697 6,992 8,176 9,340 10,554 Transport Total second-hand vehicles 53,770 52,636 55,019 39,302 29,418 27,104 29,507 39,352 61,300 82,413 87,550 Total all classes 206, , , , , , , , , , ,996 Source: CSO
23 23 Transport 2007 Table 1.4 Number of New Vehicles Licensed for the First Time by Class and Type of Fuel, 2007 Number Type of Fuel Taxation Class Petrol Diesel Other Total Private cars 128,346 50,560 1, ,754 Goods vehicles 27 46, ,043 Tractors 24 4, ,442 Motor cycles 3, ,522 Exempt vehicles 4,346 3, ,422 Public service vehicles 143 1, ,956 Small 142 1, ,283 Large Machines or Contrivances 0 1, ,445 Other classes Total new vehicles 136, ,107 1, ,446 Source: CSO Table 1.5 Number of New Private Cars Licensed for the First Time by Type of Fuel, Number Type of fuel Petrol 125, , , , , ,346 Diesel 25,132 25,217 28,209 36,750 44,010 50,560 Other ,848 Total 150, , , , , ,754 Source: CSO
24 Table 1.6 Number of New Private Cars Licensed for the First Time by Engine Capacity (cc), Number and rate Engine Cubic Capacity New private cars Up to 1300 cc 41,986 40,338 56,548 79,484 45,179 36,374 34,199 31,046 28,821 30,704 28,351 % of total to 1500cc 39,940 42,557 53,282 71,008 48,348 45,727 43,139 45,115 52,971 52,160 56,116 % of total to 2400 cc 41,516 52,530 57,005 70,223 63,107 63,794 60,536 66,873 75,944 79,890 85,992 % of total cc and over 2,376 3,113 3,487 4,554 4,274 4,590 5,118 6,601 8,534 10,519 10,295 % of total Total 125, , , , , , , , , , ,754 Source: CSO Transport Number 90,000 80,000 70,000 60,000 50,000 40,000 30,000 20,000 10,000 0 Number of Private Cars Licensed for the First Time by Engine Capacity, 1997 to Year Up to 1300 cc 1301 to 1500cc 1501 to 2400 cc 2401cc and over
25 25 Transport 2007 Table 1.7 Number of New Private Cars Licensed for the First Time by Most Popular Make, 2007 Number Toyota 27,030 Volkswagen 21,087 Ford 20,027 Opel 16,222 Nissan 13,538 Peugeot 7,664 BMW 6,876 Hyundai 6,578 Renault 6,322 Skoda 5,823 Audi 5,200 Mercedes-Benz 5,179 Mazda 4,077 Honda 3,935 Suzuki 3,706 Kia 3,603 Seat 3,289 Volvo 2,937 Fiat 2,451 Citroen 2,201 Other Makes 13,009 Total 180,754 Source: CSO Table 1.8 Number of Second-hand (Imported) Private Cars Licensed for the First Time by Most Popular Make, 2007 Number Toyota 9,221 Volkswagen 6,716 BMW 5,336 Audi 4,304 Honda 4,270 Ford 3,909 Mercedes-Benz 3,152 Nissan 3,069 Vauxhall 2,440 Peugeot 2,150 Renault 1,844 Mitsubishi 1,625 Other Makes 10,683 Total 58,719 Source: CSO
26 Transport Table 1.9 Number of New Motor Cycles Licensed for the First time by Engine Capacity and Make, 2007 Number Engine Capacity (cc) Up to to to to to 1000 Over 1000 Total Aprilia BMW Ducati Gilera Harley Davidson Honda Hyosung Kawasaki Lifan MBK Peugeot Piaggio Suzuki Triumph Yamaha Other makes Total ,522 Source: CSO Table 1.10 Number of Second-hand (Imported) Motor Cycles Licensed for the First time by Engine Capacity and Make, 2007 Number Engine Capacity (cc) Up to to to to to 1000 Over 1000 Total Aprilia BMW Harley Davidson Gilera Honda ,499 Kawasaki Peugeot Piaggio Suzuki Triumph Yamaha Other makes Total , ,898 Source: CSO
27 27 Transport 2007 Table 1.11 Number of New Vehicles Licensed in each Local Authority 2007 by Head of Population (2006) Number and rate Local Authority New Vehicles % of New Vehicles Population 2006 % of Population 2006 Carlow 3, , Cavan 3, , Clare 5, , Donegal 6, , Galway 10, , Kerry 5, , Kildare 11, , Kilkenny 4, , Laois 3, , Leitrim 1, , Limerick County 8, , Longford 1, , Louth 6, , Mayo 5, , Meath 9, , Monaghan 2, , Offaly 3, , Roscommon 4, , Sligo 2, , North Tipperary 4, , South Tipperary 3, , Waterford County 3, , Westmeath 4, , Wexford 8, , Wicklow 6, , Cork City & County 31, , Dublin City & County 76, ,187, Limerick City 1, , Waterford City 3, , Total 246, ,239, Source: CSO
28 Table 1.12 Number of New Vehicles Licensed in each Local Authority, Number Local Authority Carlow 1,667 1,795 2,535 3,136 2,197 2,233 2,166 2,218 2,523 2,919 3,268 Cavan 1,603 1,946 2,334 3,315 2,477 2,308 2,263 2,506 2,989 3,241 3,465 Clare 3,998 4,267 5,107 6,080 4,522 4,032 3,979 4,329 4,783 5,119 5,526 Donegal 3,048 3,807 4,769 6,103 4,688 4,727 4,156 4,435 5,024 5,446 6,014 Galway 7,030 7,750 9,155 11,734 8,351 8,570 8,065 8,624 9,463 10,265 10,839 Kerry 3,582 3,883 4,424 6,129 4,077 4,099 3,829 4,067 4,865 5,412 5,651 Kildare 5,251 6,879 9,058 12,135 9,357 8,654 8,431 9,042 10,004 10,651 11,130 Kilkenny 2,789 3,244 4,003 5,132 3,563 3,433 3,278 3,447 4,053 4,415 4,996 Laois 1,926 2,178 2,568 3,433 2,404 2,385 2,326 2,507 3,028 3,134 3,509 Leitrim , ,182 1,223 Limerick County 5,523 5,931 6,506 9,157 6,220 6,019 5,731 6,334 6,888 7,525 8,193 Longford 990 1,023 1,288 1,632 1,261 1,271 1,224 1,220 1,494 1,523 1,776 Louth 3,151 3,821 5,040 6,700 5,110 4,725 4,426 4,525 5,150 5,647 6,018 Mayo 3,157 3,477 4,384 5,937 4,216 4,136 4,189 4,494 5,458 5,962 5,780 Meath 4,771 5,602 7,180 9,245 7,423 6,951 7,226 7,752 8,933 9,456 9,996 Monaghan 1,483 1,753 2,217 2,938 2,023 2,107 1,920 2,019 2,381 2,726 2,705 Offaly 2,212 2,283 2,990 4,100 2,798 2,803 2,702 2,933 3,244 3,516 3,751 Roscommon 1,823 1,952 2,429 3,361 2,453 2,585 2,523 2,978 3,670 3,533 4,154 Sligo 2,171 2,240 2,914 3,503 2,444 2,496 2,290 2,350 2,657 2,835 2,918 North Tipperary 2,247 2,577 3,045 3,811 2,592 2,616 2,547 2,637 3,176 3,982 4,295 South Tipperary 2,719 3,024 3,612 5,002 3,201 3,197 3,278 3,314 3,685 3,511 3,753 Waterford County 1,731 1,964 2,470 3,193 2,070 2,158 1,942 2,079 2,510 3,240 3,637 Westmeath 2,565 2,845 3,476 4,435 3,053 3,118 3,077 3,144 3,537 4,028 4,201 Wexford 4,629 5,133 6,418 8,218 6,358 6,033 5,673 6,407 7,516 8,927 8,789 Wicklow 4,100 4,639 5,978 7,879 5,866 5,075 5,057 5,161 5,812 6,398 6,782 Transport Cork City & County 18,097 21,284 27,841 35,801 25,697 24,053 25,131 26,330 28,568 30,114 31,767 Dublin City & County 55,975 61,679 74,385 93,752 76,307 67,779 64,415 64,287 70,492 72,997 76,716 Limerick City 1,990 2,058 2,894 3,532 2,601 2,171 2,074 2,097 2,259 2,022 1,940 Waterford City 2,217 2,846 3,715 4,366 3,244 3,119 3,342 3,388 4,128 4,001 3,654 Total 153, , , , , , , , , , ,446 Source:CSO
29 29 Transport 2007 Table 1.13 Number of Change of Vehicle Ownership Forms Processed by County Number Local Authority Private Garages Total Private Garages Total Carlow 10,534 3,315 13,849 10,988 3,961 14,949 Cavan 11,160 3,575 14,735 11,458 4,230 15,688 Clare 20,047 3,166 23,213 19,988 3,822 23,810 Cork 74,216 30, ,010 81,030 32, ,834 Donegal 19,119 6,946 26,065 19,579 6,861 26,440 Dublin 151,344 70, , ,969 75, ,847 Galway 36,391 9,350 45,741 38,865 10,878 47,265 Kerry 23,614 7,250 30,864 21,946 8,400 31,007 Kildare 31,247 8,420 39,667 33,707 9,061 38,787 Kilkenny 14,231 4,389 18,620 15,111 5,080 19,497 Laois 11,530 3,046 14,576 12,436 4,386 12,879 Leitrim 4, ,723 4, ,037 Limerick City 10,786 5,863 16,649 12,035 6,587 13,425 Limerick Co. Co. 21,494 4,037 25,531 22,847 4,426 29,244 Longford 5,990 1,334 7,324 7,018 1,390 13,868 Louth 16,449 4,801 21,250 17,661 6,397 26,795 Mayo 18,365 6,604 24,969 20,190 6,850 25,771 Meath 28,109 7,102 35,211 29,810 9,134 33,359 Monaghan 7,399 4,838 12,237 8,278 5,581 12,137 Offaly 12,532 3,590 16,122 13,770 3,549 15,781 Roscommon 8,850 2,868 11,718 10,149 3,859 16,370 Sligo 9,315 1,808 11,123 9,490 2,011 15,153 Tipperary N.R. 13,445 5,719 19,164 15,493 6,221 17,015 Tipperary S.R. 15,088 5,470 20,558 17,312 5,663 23,676 Waterford 9,761 1,432 11,193 12,341 1,522 23,523 Waterford City 7,162 5,843 13,005 8,564 6,680 14,975 Westmeath 14,540 5,544 20,084 16,162 6,364 91,333 Wexford 25,825 10,229 36,054 28,804 11,182 35,391 Wicklow 22,077 5,453 27,530 22,400 6,411 29,080 Total 654, , , , , ,936 Source: Department of Transport
30 Transport Table 1.14 Number of Change of Vehicle Ownership Forms Processed, Number and rate Year Total Private Owners % of total for year Garages/Trade % of total for year , , % 146, % , , % 149, % , , % 160, % , , % 186, % , , % 205, % , , % 214, % , , % 233, % , , % 258, % Source: Department of Transport Number 1,200,000 Number of change of Vehicle Ownership forms processed 1,000, , , ,000 Total Private Owners Garages/Trade 200, Year
31 31 Transport 2007 Table 1.15 Value Profile of New Cars Registered, 2007 Number and rate Value ( ) Gross Registrations Exempt Net Registrations % Registrations % , , % , , % , , % , , % ,445 1,320 47, % ,129 1,039 25, % ,642 1,210 23, % , , % , , % , , % , , % , , % % , , % % % % TOTAL 186,841 5, , % Source: Revenue Commissioners
32 Transport Table 1.16 Value Profile of Used (Imported) Cars Registered, 2007 Number and rate Value ( ) Gross Registrations Exempt Net Registrations % Registrations 0-7,000 26,155 2,711 23, % 7,001-8,000 2, , % 8,001-13,000 11,069 1,128 9, % 13,001-14,000 1, , % 14,001-15,000 1, , % 15,001-20,000 6, , % 20,001-25,000 4, , % 25,001-30,000 1, , % 30,001-40,000 1, , % 40,001-50, % 50,001-60, % 60,001-70, % 70,001-80, % 80,001-90, % 90, , % 100, , % 150, , % 200, , % 250, % Total 59,539 6,383 53, % Source: Revenue Commissioners
33 33 Transport 2007 Table 1.17 Age Profile of Used (Imported) Cars Registered, 2007 Number and rate Age Gross Registrations Exempt Net Registrations % Registrations % 2 2, , % 3 3, , % 4 7, , % 5 7, , % 6 6, , % 7 5, , % 8 5, , % 9 4, , % 10 4, , % 11 3, , % 12 2, , % >12 6, , % Total 59,539 6,383 53, % Source: Revenue Commissioners Number Age Profile Of Used Cars Registered, 2007 (Gross Registrations) 8,000 7,000 6,000 5,000 4,000 3,000 2,000 Gross Reg 1, >12 AGE
 Cars, 2007 Number and rate Country Net Registrations % of Total UK 44,252 83.")
34 Transport Table 1.18 Country of Last Registration of Used (Imported) Cars, 2007 Number and rate Country Net Registrations % of Total UK 44, % Japan 7, % Singapore % Germany % Others % Total 53, % Source: Revenue Commissioners
35 35 Transport 2007 Table 1.19 Annual Average Kilometres Travelled by Private Car, Kilometres Private Petrol Cars 16,777 16,623 16,352 16,066 15,873 15,895 Private Diesel Cars 25,999 25,708 25,239 24,697 24,338 24,242 Petrol and Diesel Combined 18,006 17,865 17,572 17,251 17,074 17,137 Source: Sustainable Energy Ireland Average Annual Kilometers 28,000 26,000 Annual Average Kilometres Travelledby Private Car, 2002 to ,999 25,708 25,239 24,697 24,338 24,242 24,000 22,000 20,000 18,000 18,006 17,865 17,572 17,251 17,074 17,137 Private Petrol Cars 16,000 16,777 14,000 16,623 16,352 16,066 15,873 15,895 Private Diesel Cars Petrol and Diesel Combined 12,000 10, Year
36 Transport Table 1.20 Fuel Annual Average Kilometres Travelled by Private Car by Engine Size Band and Fuel Type, 2007 Kilometres cc band Petrol Cars 8,843 13,106 15,562 17,916 18,483 18,492 Diesel Cars 4,996 14,014 23,922 19,202 24,160 24,784 Source: Sustainable Energy Ireland
37 37 Transport 2007 Table 1.21 Estimate of Petrol and Diesel Consumption by Emissions Category, 2007 Litres and Emissions Band Emissions Rating Emissions Band Estimated Fuel Consumption per annum Litres (Petrol) Estimated Fuel Consumption per annum Litres (Diesel) less than or equal to 120gCO2/km A 888 1, gCO2/km B 1,095 1, gCO2/km C 1,192 1, gCO2/km D 1,292 1, gCO2/km E 1,423 1, gCO2/km F 1,642 2,256 Over 225gCO2/km G 2,107 2,831 Source: Sustainable Energy Ireland Litres 3,000 Estimate of Petrol and Diesel Consumption by Emissions Category, ,500 2,000 1,500 1,000 Petrol Diesel A B C D E F G Emissions Band
38
39 Chapter 2 Driver and Vehicle Testing
40 Transport Table 2.1 Number of Current Driving Licences by Type in each Licensing Authority at 31/12/2007 Number Licensing Authority Provisional Licences Annual Licences Triennial Licences 10 Year Licences Total Number of Driving Licences County Councils Carlow 6, ,109 26,046 34,958 Cavan 6, ,919 29,865 39,095 Clare 10, ,824 54,898 69,987 Cork* 46, , , ,934 Donegal 12, ,349 72,609 91,667 Galway* 21, , , ,793 Kerry 12, ,759 69,534 88,944 Kildare 18, ,334 88, ,934 Kilkenny 9, ,723 39,579 52,802 Laois 7, ,647 28,750 38,702 Leitrim 2, ,538 14,563 18,708 Limerick 12, ,656 65,135 83,416 Longford 3, ,649 16,009 21,189 Louth 11, ,079 47,598 63,518 Mayo 10, ,490 60,339 76,707 Meath 15, ,476 74,771 96,092 Monaghan 5, ,600 28,290 36,075 Offaly 7, ,782 31,540 41,884 Roscommon 5, ,168 28,935 37,528 Sligo 5, ,033 29,705 38,561 Tipperary North 6, ,481 32,307 42,921 Tipperary South 9, ,004 38,920 52,744 Waterford 5, ,802 28,152 36,778 Westmeath 7, ,228 36,334 47,430 Wexford 14, ,727 62,173 82,891 Wicklow 13, ,922 58,723 77,869 City Councils Dublin* 126,570 1,818 44, , ,241 Limerick 5, ,021 20,270 27,792 Waterford 6, ,753 20,041 27,930 TOTAL 427,724 7, ,263 1,931,005 2,539,090 Change from 2006 return -4, ,958 89,676 94,931 * City and County Source: Department of Transport
41 41 Transport 2007 Table 2.2 Number of Current Driving Licences by Type and Gender in each Licensing Authority at 31/12/2007 Number Full Licence Provisional Licence Licensing Authority Male Female Unknown Total Male Female Unknown Total County Councils Carlow 16,288 11,990 28,278 3,215 3,465 6,680 Cavan 19,293 13,572 32,865 2,810 3,420 6,230 Clare 32,407 27,529 59,936 4,617 5,434 10,051 Cork* 102,815 76,720 76, ,887 22,154 23, ,047 Donegal 45,768 33,409 79,177 5,988 6,502 12,490 Galway* 66,234 53, ,895 10,056 11,842 21,898 Kerry 43,371 32, ,513 5,954 6,477 12,431 Kildare 52,619 41,403 94,022 8,607 10,305 18,912 Kilkenny 23,408 20,100 43,508 4,191 5,103 9,294 Laois 18,122 13,411 31,533 3,216 3,953 7,169 Leitrim 9,433 6,704 16,137 1,141 1,430 2,571 Limerick 39,134 31,853 70,987 5,977 6,452 12,429 Longford 10,437 7,263 17,700 1,575 1,914 3,489 Louth 29,667 22, ,846 5,380 6,292 11,672 Mayo 37,928 28,106 66,034 4,907 5,766 10,673 Meath 44,138 36,344 80,482 7,014 8,596 15,610 Monaghan 19,172 11,801 30,973 2,404 2,698 5,102 Offaly 19,904 14,519 34,423 3,535 3,926 7,461 Roscommon 18,672 13,533 32,205 2,506 2,817 5,323 Sligo 16,655 16,192 32,847 2,617 3,097 5,714 Tipperary North 20,362 15,560 35,922 3,328 3,671 6,999 Tipperary South 24,642 18,451 43,093 4,558 5,093 9,651 Waterford 17,542 13,529 31,071 2,797 2,910 5,707 Westmeath 22,487 17,198 39,685 3,601 4,144 7,745 Wexford 36,894 31,592 68,486 6,757 7,648 14,405 Wicklow 35,488 28,478 63,966 6,519 7,384 13,903 City Councils Dublin* 297, , ,671 59,508 67, ,570 Limerick 13,115 9,254 22,369 2,531 2,892 5,423 Waterford 12,405 9,450 21,855 2,865 3,210 6,075 TOTAL 1,145, ,495 77,333 2,111, , , ,724 * City and County Source: Road Safety Authority
42 Transport Table 2.3 Number of Current Full Driving Licences by Age in each Licensing Authority at 31/12/2007 Number Licensing Authority Under and over Total Carlow 396 1,391 3,226 7,020 6,154 4,876 3,338 1, ,278 Cavan 715 2,032 3,763 7,394 6,799 5,824 3,803 2, ,865 Clare 966 3,073 6,374 14,147 13,149 10,844 7,515 3, ,936 Cork* 1 4,057 12,515 27,805 60,847 55,802 45,347 31,612 14,233 3, ,887 Donegal 2,205 5,074 9,055 18,205 16,198 13,595 9,671 4,097 1,077 79,177 Galway* 2,103 6,612 13,996 29,829 25,427 20,682 13,850 5,993 1, ,895 Kerry 1,313 4,123 8,377 16,958 15,995 14,273 9,943 4,432 1,099 76,513 Kildare 1,209 4,360 9,982 25,197 22,615 16,804 9,906 3, ,022 Kilkenny ,987 4,468 10,026 9,689 7,979 5,444 2, ,508 Laois 429 1,722 3,563 7,579 6,967 5,418 3,554 1, ,533 Leitrim ,871 3,457 3,213 2,926 2,002 1, ,137 Limerick 1,279 3,978 8,056 16,513 14,842 12,939 8,725 3, ,987 Longford 304 1,004 2,067 3,943 3,448 3,239 2,294 1, ,700 Louth 637 2,230 5,294 13,058 11,738 9,044 6,441 2, ,846 Mayo 1,606 4,247 7,381 14,159 13,381 12,204 8,199 3,857 1,000 66,034 Meath 2 1,123 3,882 8,684 21,016 18,574 13,951 8,809 3, ,482 Monaghan 751 1,941 3,927 6,985 6,158 5,483 3,704 1, ,973 Offaly 508 1,726 3,888 8,592 7,563 5,774 3,964 1, ,423 Roscommon 657 1,834 3,546 6,731 6,486 6,051 4,150 2, ,205 Sligo 748 1,946 3,639 6,931 6,855 6,073 4,127 1, ,847 Tipperary North 498 1,769 3,879 8,090 7,442 6,534 4,635 2, ,922 Tipperary South 568 2,050 4,486 9,715 9,280 7,890 5,552 2, ,093 Waterford 554 1,617 3,291 6,972 6,602 5,361 4,135 2, ,071 Westmeath 563 1,947 4,450 9,734 8,881 6,914 4,505 2, ,685 Wexford 1,053 3,329 7,176 16,087 14,853 11,875 8,816 4, ,486 Wicklow 793 2,680 6,243 15,217 15,036 11,639 8,161 3, ,966 City Councils Dublin* 3 4,134 17,633 50, , ,836 95,318 67,097 29,642 7, ,671 Limerick ,305 5,824 4,835 3,809 2,766 1, ,369 Waterford ,198 5,681 5,052 3,712 2,729 1, ,855 TOTAL 7 30,627 99, , , , , , ,889 29,737 2,111,366 * City and County Source: Road Safety Authority
43 43 Transport 2007 Table 2.4 Number of Current Provisional Driving Licences by Age in each Licensing Authority at 31/12/2007 Number Licensing Authority Under and over Total Carlow 32 1,368 1,582 1,315 1, ,680 Cavan 72 1,597 1,421 1,098 1, ,230 Clare 65 2,512 2,358 1,750 1, ,051 Cork* ,368 10,619 8,778 8,834 3,667 1, ,047 Donegal 142 3,483 2,864 2,160 2, ,490 Galway* 138 4,880 5,109 4,435 4,371 1, ,898 Kerry 109 3,250 2,933 2,073 2, ,431 Kildare 40 3,629 4,345 3,657 4,261 1, ,912 Kilkenny 76 2,369 2,166 1,588 1, ,294 Laois 49 1,708 1,676 1,323 1, ,169 Leitrim ,571 Limerick 78 3,320 3,026 2,205 2, ,429 Longford ,489 Louth 23 1,984 2,601 2,362 2,791 1, ,672 Mayo 116 3,092 2,555 1,803 1, ,673 Meath 69 3,438 3,530 2,944 3,262 1, ,610 Monaghan 63 1,524 1, ,102 Offaly 52 1,742 1,664 1,369 1, ,461 Roscommon 73 1,488 1, ,323 Sligo 71 1,485 1,324 1, ,714 Tipperary North 52 1,610 1,643 1,273 1, ,999 Tipperary South 52 2,206 2,238 1,816 1, ,651 Waterford 47 1,563 1, ,707 Westmeath 37 1,678 1,854 1,407 1, ,745 Wexford 86 3,502 3,113 2,633 2,585 1, ,405 Wicklow 40 2,885 2,973 2,844 2,859 1, ,903 City Councils Dublin* 60 19,095 25,744 29,120 32,778 12,183 5,401 1, ,570 Limerick ,197 1,293 1, ,423 Waterford ,353 1,408 1, ,075 TOTAL 1,974 89,936 95,069 85,417 89,805 37,708 18,761 6,859 1, ,724 * City and County Source: Road Safety Authority
44 Transport Table 2.5 Number of Current Driving Licences by Age and Gender at 31/12/2007 Number Full Licence Provisional Licence Age Male Female Unknown Total Male Female Unknown Total Under , , ,335 10, ,627 48,652 41,284 89, ,669 42, ,325 43,496 51,573 95, , ,531 6, ,339 38,452 46, , , ,515 16, ,747 41,806 47, , , ,536 19, ,870 16,693 20, , , ,823 19, ,378 6,742 11, , ,389 97,838 15, ,447 1,779 5, , ,745 44, , ,170 1, and over 19,113 10, , Total 1,145, ,495 77,333 2,111, , , ,724 * City and County Source: Road Safety Authority
45 45 Transport 2007 Table 2.6 Driving Tests Statistics, Number and rate Number of Applications Received 192, , , , , ,678 Driving Tests Conducted 148, , , , ,741 * 197,866 * Applicant did not attend for Appointment 16,873 14,742 19,897 22,620 23,744 * 23,004 * Number on waiting list at end of year 65, , , , ,990 * 143,410 * Average waiting time for test at end of year 10 wks 29 wks 30 wks 32.8 wks 29.8 wks 18.9 wks Average pass rate 54.3% 54.5% 54% 54% 52.6% 55.3% Number of testers employed at end of year * Includes outsourced tests Source: Road Safety Authority Table 2.7 Driving Test Pass Rates by Gender, Number and rate Male Pass 42,545 41,821 43,531 39,937 43,992 55,880 Fail 34,157 31,949 34,920 32,653 38,853 44,041 % pass Female Pass 38,326 43,478 39,647 33,757 39,176 53,486 Fail 33,955 39,167 35,885 31,153 36,720 44,459 % pass Total 148, , , , , ,866 Source: Road Safety Authority % Pass 100 Driving Test Pass Rates by Gender Males Females Year
46 Transport Table 2.8 Driving Test Pass Rate by Gender and Centre, 2007 Number and rate Centre Male Female Pass Fail % Pass Pass Fail % Pass Overall Total Athlone ,203 Ballina ,074 Birr ,851 Buncrana ,457 Carlow ,089 1, ,974 Carrick-on-Shannon ,007 Castlebar ,994 Cavan ,618 Churchtown / Rathgar 4,649 4, ,676 4, ,476 Clifden Clonmel ,369 Cork 3,296 2, ,988 2, ,516 Donegal ,284 Dundalk 2,054 1, ,069 1, ,930 Dungarvan ,448 Ennis ,187 Finglas 4,655 4, ,776 3, ,534 Galway 1, ,378 1, ,981 Gorey ,875 Kilkenny ,298 Killarney ,410 Kilrush Letterkenny 1, , ,061 Limerick 2,267 1, ,227 1, ,175 Longford ,844 Loughrea ,856 Mallow ,078 Monaghan ,210 Mullingar 1, ,644 Naas 2,571 1, ,644 1, ,014 Navan 2,291 1, ,496 1, ,888 Nenagh ,486 Newcastle West ,807 Portlaoise ,396 Raheny 2,554 2, ,250 2, ,019 Roscommon ,437 Shannon ,586 Skibbereen ,446 Sligo 1, ,451 Tallaght 3,382 2, ,818 2, ,806 Thurles ,619 Tipperary ,397 Tralee ,317 Tuam ,716 Tullamore ,685 Waterford 1, , ,238 Wexford ,458 Wicklow ,281 Total 55,880 44, ,486 44, ,866 Source: Road Safety Authority
47 47 Transport 2007 Table 2.9 Driving Test Pass Rates by First Time Applicants, Number and rate First Time Applicant Pass 53,893 50,785 40,485 42,080 42,414 38,591 44,159 57,292 Fail 43,963 45,315 37,227 38,166 39,185 36,378 43,329 44,013 Total 97,856 96,100 77,712 80,246 81,599 74,969 87, ,305 % first time applicant pass Source: Road Safety Authority Table 2.10 Driving Test Pass Rates by Non-First Time Applicants, Number and rate Non-First Time Applicant Pass 39,422 44,784 40,386 43,219 40,764 35,103 39,009 51,086 Fail 25,418 31,492 30,885 32,950 31,620 27,428 32,244 45,475 Total 64,840 76,276 71,271 76,169 72,384 62,531 71,253 96,561 % non-first time applicant pass Source: Road Safety Authority % Pass 70 Driving Test Pass Rates First Time Applicants Non-First Time Applicants Year
48 Transport Table 2.11 Driving Test Pass Rate by Age Group, Number and rate Age Category years Pass 21,612 22,760 19,307 16,087 19,886 18,703 22,082 25,437 Fail 15,097 17,099 14,952 11,944 15,122 14,319 16,974 17,815 Total 36,709 39,859 34,259 28,031 35,008 33,022 39,056 43,252 % pass years Pass 22,423 22,764 20,434 19,546 20,222 18,445 20,447 25,998 Fail 14,334 15,696 14,211 13,594 14,465 12,950 15,176 16,732 Total 36,757 38,460 34,645 33,140 34,687 31,395 35,623 42,730 % pass or over Pass 49,280 50,045 41,130 49,666 43,070 36,546 40,639 57,931 Fail 39,950 44,012 38,949 45,578 41,218 36,537 43,423 53,953 Total 89,230 94,057 80,079 95,244 84,288 73,083 84, ,884 % pass Source: Road Safety Authority %Pass Driving Test Pass Rate by Age Group years years 26 years or over Year Table 2.12 Number of Tests conducted by the Driver Theory Testing Service, Number and rate No of Tests Conducted 101, , , , , ,600 % Pass Rate Source: Road Safety Authority
49 49 Transport 2007 Table 2.13 Waiting Time for Driving Tests by Centre, Number of Weeks Number of Weeks Waiting at Driver Testing Centres at End of Year Test Centre North Leinster Finglas Dundalk Mullingar Navan Raheny South Leinster Churchtown/Rathgar Gorey Naas Tullamore Wicklow Tallaght West Athlone Birr Castlebar Clifden Ennis Galway Loughrea Roscommon Tuam North West Ballina Buncrana Carrick-on-Shannon Cavan Donegal Letterkenny Longford Monaghan Sligo South East Carlow Clonmel Dungarvan Kilkenny Nenagh Portlaoise Thurles Tipperary Waterford Wexford South West Cork Killarney Kilrush Limerick Mallow Newcastle West Shannon Skibbereen Tralee Source: Road Safety Authority
50 Transport Table 2.14 National Car Test Results by Test Centre for year ending 31/12/2007 Number Test Centre Pass (Initial Test) Fail (Initial Test) Pass (Following Re-Test) Fail or No Show (Following Re-Test) Total Number of Passes Total Number of Cars Tested Abbeyfeale 4,948 3,610 3, ,209 8,558 Arklow 5,149 5,618 4, ,944 10,767 Athlone 5,531 5,213 4, ,950 10,744 Ballina 3,394 3,793 3, ,708 7,187 Blarney 10,120 8,452 7,237 1,215 17,357 18,572 Derrybeg 1,370 1,468 1, ,709 2,838 Deansgrange 32,315 26,296 23,334 2,962 55,649 58,611 Cahir 7,067 6,048 5, ,341 13,115 Cahirciveen 1, ,621 1,684 Carlow 6,775 6,869 5,784 1,085 12,559 13,644 Ck-on-Shannon 3,683 3,162 2, ,430 6,845 Castlerea 3,516 3,626 3, ,631 7,142 Cavan 3,262 3,662 3, ,469 6,924 Charleville 4,183 3,601 3, ,488 7,784 Clifden 904 1, ,865 2,091 Cork 20,625 17,636 15,558 2,078 36,183 38,261 Northpoint 34,623 38,783 32,566 6,217 67,189 73,406 Fonthill 30,784 28,851 24,861 3,990 55,645 59,635 Donegal 3,750 3,000 2, ,354 6,750 Drogheda 8,584 6,269 5, ,973 14,853 Dundalk 5,117 5,147 4, ,502 10,264 Ennis 7,739 7,678 6,615 1,063 14,354 15,417 Enniscorthy 8,990 8,727 7,397 1,330 16,387 17,717 Galway 16,690 17,489 14,732 2,757 31,422 34,179 Kilkenny 8,189 5,858 4, ,148 14,047 Killarney 4,975 4,025 3, ,544 9,000 Letterkenny 7,412 7,035 6, ,744 14,447 Limerick 15,556 13,719 11,808 1,911 27,364 29,275 Longford 4,015 3,788 3, ,297 7,803 Macroom 4,539 4,274 3, ,317 8,813 Monaghan 3,613 3,855 3, ,038 7,468 Mullingar 4,416 4,122 3, ,862 8,538 Kells 8,742 7,028 5,984 1,044 14,726 15,770 Nenagh 7,814 6,373 5, ,458 14,187 Naas 10,186 10,548 8,774 1,774 18,960 20,734 Portlaoise 5,036 4,985 4, ,171 10,021 Skibbereen 5,000 4,172 3, ,659 9,172 Sligo 3,953 5,111 4, ,308 9,064 Tralee 6,638 5,518 4, ,613 12,156 Tullamore 4,533 4,356 3, ,293 8,889 Waterford 10,431 9,502 8,129 1,373 18,560 19,933 Westport 6,164 5,698 4, ,159 11,862 Youghal 4,355 4,183 3, ,104 8,538 Total 355, , ,556 45, , , % 48.2% 41.6% 6.6% 93.4% 100.0% Source: Road Safety Authority
51 Chapter 3 Penalty Points
52 Table 3.1 Number of Penalty Points Issued by Offence Type (Cumulative) to 31/12/2007 Offence Type Carlow Cavan Clare Cork Donegal Breach of motorway outside lane driving rule Careless Driving Cross continuous white line/broken white line , Dangerous Driving Reduced to Careless Driving Drive on hardshoulder/non carriageway - motorway Driving a vehicle while holding a mobile phone , , , Driving along/across median strip Driving on/across footway Driving without reasonable consideration Entry to hatched marked area Exceed road works speed limit Fail to comply with Keep to Right/Left signs Fail to comply with mandatory traffic signs Fail to comply with No Entry traffic sign Fail to comply with prohibitory traffic signs Fail to comply with traffic lane markings Fail to drive on the left hand side Fail to obey traffic lights , Fail to stop before stop sign/stop line Fail to stop for Garda Fail to turn left onto a roundabout Fail to yield right of way Fail to yield right of way at sign/line General speed obligation - stop visible distance No child restraint front seat - child No child restraint rear seat - child No insurance - (user) No safety belt - driver ,291 6,934 1,708 1,681 2,016 2,133 1, , ,040 1, No safety belt front seat - child No safety belt rear seat - child Offence relating to Overtaking Speeding 7,292 6,192 11,914 49,559 11,851 20,585 12,427 32,461 10,594 9,118 2,939 14,926 5,136 13,802 10,673 25,819 6,002 Others Galway Kerry Kildare Kilkenny Laois Leitrim Limerick County Council Longford Louth Mayo Meath Monaghan Transport Total 9,216 7,528 14,614 65,354 15,443 25,307 16,090 37,988 13,327 11,270 3,633 18,776 6,339 15,962 12,889 30,233 7,016
53 Table 3.1 Number of Penalty Points Issued by Offence Type (Cumulative) to 31/12/ continued Number Offence Type Offaly Roscommon Sligo North Tipperary South Tipperary Waterford Co. Council Westmeath Wexford Wicklow Dublin City Council Limerick City Council Waterford City Council No Driver Number Total Breach of motorway outside lane driving rule Careless Driving ,013 2,147 Cross continuous white line/broken white line , ,543 9,376 Dangerous Driving Reduced to Careless Driving Drive on hardshoulder/non carriageway - motorway ,530 Driving a vehicle while holding a mobile phone , ,648 25,005 Driving along/across median strip Driving on/across footway Driving without reasonable consideration , ,004 4,296 Entry to hatched marked area ,678 Exceed road works speed limit , ,154 Fail to comply with Keep to Right/Left signs Fail to comply with mandatory traffic signs Fail to comply with No Entry traffic sign Fail to comply with prohibitory traffic signs , ,084 10,940 Fail to comply with traffic lane markings ,033 Fail to drive on the left hand side Fail to obey traffic lights , ,828 13,256 Fail to stop before stop sign/stop line Fail to stop for Garda Fail to turn left onto a roundabout Fail to yield right of way Fail to yield right of way at sign/line General speed obligation - stop visible distance No child restraint front seat - child No child restraint rear seat - child ,043 No insurance - (user) ,937 7,347 No safety belt - driver , ,384 1,300 8, ,012 54,645 No safety belt front seat - child ,475 No safety belt rear seat - child ,795 Offence relating to Overtaking ,881 Speeding 9,258 7,032 6,971 7,195 9,094 6,231 9,148 15,980 17, ,443 4,140 5,034 99, ,538 Others Transport 2007 Total 11,040 8,429 8,242 8,984 11,476 8,009 11,008 20,844 21, ,905 5,454 6, , ,015 * Cumulative Figure from date of Introduction of Penalty Point System Source: Department of Transport
54 Transport Table 3.2 Number of Penalty Points Issued by Offence Type, Offence Type Number Change Breach of duties on occurrence of an accident Breach of motorway outside lane driving rule Careless Driving Contravention of requirements at junctions Contravention of requirements for reversing Cross continuous white line/broken white line 3,499 5,455 1,956 Dangerous Driving Reduced to Careless Driving Drive against flow of traffic on motorway Drive on hardshoulder/non carriageway - motorway Driving a vehicle when unfit Driving a vehicle while holding a mobile phone 2,183 22,061 19,878 Driving along/across median strip Drive on/across cycle track Driving on/across footway Driving without reasonable consideration 955 3,279 2,324 Entry to hatched marked area 1,527 1, Fail to act in accordance with Garda signal Fail to comply with Keep to Right/Left signs Fail to comply with mandatory traffic signs Fail to comply with No Entry traffic sign Fail to comply with prohibitory traffic signs 3,723 7,030 3,307 Fail to comply with traffic lane markings 685 1, Fail to drive on the left hand side Fail to obey rules at railway level crossing Fail to obey traffic lights 4,505 8,495 3,990 Fail to stop before stop sign/stop line Fail to stop for Garda Fail to stop for school warden sign Fail to turn left onto a roundabout Fail to yield right of way Fail to yield right of way at sign/line General speed obligation - stop visible distance No child restraint front seat - child No child restraint rear seat - child No insurance - (user) 2,939 3, No safety belt - driver 14,356 23,712 9,356 No safety belt front seat - child No safety belt rear seat - child 739 1, Offence relating to Overtaking 1,208 1, Parking a vehicle in a dangerous position Speeding 145, ,869 95,571 Total 186, , ,251 Source: Department of Transport
55 55 Transport 2007 Table 3.3 Breakdown of Penalty Points issued By Licence Type, (Cumulative) to 31/12/2007 Number Full Licence 585,646 Provisional Licence 35,620 No Licence/ No Irish Licence 133,749 Source: Department of Transport Table 3.4 Number of Penalty Points issued by Gender and County, 2007 Number County Females Males Carlow 1,138 3,344 Cavan 956 2,580 Clare 1,980 4,362 Cork 5,911 19,260 Donegal 1,675 5,514 Dublin 25,928 62,745 Galway 3,228 8,340 Kerry 1,914 5,332 Kildare 4,750 11,608 Kilkenny 1,924 4,642 Laois 1,472 4,010 Leitrim 471 1,169 Limerick 2,703 7,705 Longford 713 1,921 Louth 2,074 4,870 Mayo 1,506 4,532 Meath 4,595 9,827 Monaghan 764 2,029 Offaly 1,325 3,784 Roscommon 977 2,904 Sligo 1,371 2,731 Tipperary NR 1,057 3,035 Tipperary SR 1,139 3,767 Waterford 1,613 5,239 Westmeath 1,367 3,564 Wexford 2,518 7,013 Wicklow 2,472 6,389 No Licence/ No Irish Licence 1 46,840 Total 77, ,056 Source: Department of Transport Table 3.5 Number of Penalty Points issued by Gender and Age, 2007 Number and rate Age Profile Female Male Total % of total Under 21 1,629 7,349 8, % 21 to 25 8,582 24,419 33, % 26 to 30 13,195 31,576 44, % 31 to 40 23,447 57,413 80, % 41 to 65 28,949 74, , % over 65 1,740 7,404 9, % Date of Birth not recorded/ No Licence/No Irish Licence 46,190 46, % Total 77, , , % Source: Department of Transport
56 Transport Table 3.6 Number of Penalty Points issued by Gender and Offence Type, 2007 Number Offence Description Female Male Breach of duties on occurrence of an accident Breach of motorway outside lane driving rule Careless Driving Contravention of requirements at junctions 9 28 Contravention of requirements for reversing 1 14 Cross continuous white line/broken white line 851 4,604 Dangerous Driving Reduced to Careless Driving Drive against flow of traffic on motorway 2 20 Drive on hardshoulder/non carriageway - motorway Driving a vehicle when unfit - 2 Driving a vehicle while holding a mobile phone 5,187 16,874 Driving along/across median strip Driving on/across cycle track 1 17 Driving on/across footway 4 30 Driving without reasonable consideration 403 2,876 Entry to hatched marked area 337 1,472 Fail to act in accordance with Garda signal 1 6 Fail to comply with Keep to Right/Left signs Fail to comply with No Entry traffic sign Fail to comply with mandatory traffic signs Fail to comply with prohibitory traffic signs 1,724 5,306 Fail to comply with traffic lane markings 236 1,000 Fail to drive on the left hand side Fail to obey rules at railway level crossing 2 4 Fail to obey traffic lights 1,725 6,770 Fail to stop before stop sign/stop line Fail to stop for Garda Fail to stop for school warden sign 5 28 Fail to turn left onto a roundabout 4 9 Fail to yield right of way Fail to yield right of way at sign/line General speed obligation - stop visible distance 6 24 No child restraint front seat - child No child restraint rear seat - child No insurance - (user) 20 3,139 No safety belt - driver 3,091 20,621 No safety belt front seat - child No safety belt rear seat - child Offence relating to Overtaking 214 1,304 Parking a vehicle in a dangerous position - 9 Speeding 62, ,718 Total 77, ,056 Source: Department of Transport
57 Table 3.7 Number of Penalty Points issued to Females by Age and Main Offence Type, 2007 Number Offence Description Under to to to to 65 over 65 Unknown Total Breach of motorway outside lane driving rule Careless Driving Contravention of requirements at junctions Contravention of requirements for reversing 1 1 Cross continuous white line/broken white line Dangerous driving reduced to careless driving 1 1 Drive against flow of traffic on motorway 2 2 Drive on hardshoulder/non carriageway - motorway Driving a vehicle while holding a mobile phone ,220 1,639 1, ,187 Driving along/across median strip Driving on/across cycle track 1 1 Driving on/across footway Driving without reasonable consideration Entry to hatched marked area Fail to act in accordance with Garda signal 1 1 Fail to comply with Keep to Right/Left signs Fail to comply with mandatory traffic signs Fail to comply with No Entry traffic sign Fail to comply with prohibitory traffic signs ,724 Fail to comply with traffic lane markings Fail to drive on the left hand side Fail to obey rules at railway level crossing 2 2 Fail to obey traffic lights ,725 Fail to stop before stop sign/stop line Fail to stop for Garda Fail to stop for school warden sign Fail to turn left onto a roundabout Fail to yield right of way Fail to yield right of way at sign/line General speed obligation - stop visible distance No child restraint front seat - child No child restraint rear seat - child No insurance - (user) No safety belt - driver , ,091 No safety belt front seat - child No safety belt rear seat - child Offence relating to Overtaking Speeding 1,052 6,224 10,168 18,909 24,245 1, ,151 Total 1,629 8,582 13,195 23,447 28,949 1, , Transport 2007 Source: Department of Transport
58 Table 3.8 Number of Penalty Points issued to Males by Age and Main Offence Type, 2007 OffenceDescription Under21 21to25 25to30 31to40 41to65 over65 Unknown Total Breach of duties on occurrence of an accident Breach of motorway outside lane driving rule Careless Driving Contravention of requirements at junctions Contravention of requirements for reversing Cross continuous white line/broken white line , ,604 Dangerous Driving Reduced to Careless Driving Drive against flow of traffic on motorway Drive on hardshoulder/non carriageway - motorway Driving a vehicle when unfit 2 2 Driving a vehicle while holding a mobile phone 512 1,852 2,672 4,446 4, ,199 16,874 Driving along/across median strip Driving on/across cycle track Driving on/across footway Driving without reasonable consideration ,876 Entry to hatched marked area ,472 Fail to act in accordance with Garda signal Fail to comply with Keep to Right/Left signs Fail to comply with mandatory traffic signs Fail to comply with No Entry traffic sign Fail to comply with prohibitory traffic signs ,265 1, ,306 Fail to comply with traffic lane markings ,000 Fail to drive on the left hand side Fail to obey rules at railway level crossing Fail to obey traffic lights ,452 1, ,279 6,770 Fail to stop before stop sign/stop line Fail to stop for Garda Fail to stop for school warden sign Fail to turn left onto a roundabout Fail to yield right of way Fail to yield right of way at sign/line General speed obligation - stop visible distance No child restraint front seat - child No child restraint rear seat - child No insurance - (user) ,820 3,139 No safety belt - driver 1,025 2,889 2,861 4,253 5, ,703 20,621 No safety belt front seat - child No safety belt rear seat - child Offence relating to Overtaking ,304 Parking a vehicle in a dangerous position 9 9 Speeding 4,129 15,985 22,427 42,818 58,081 5,959 29, ,718 Total 7,349 24,419 31,576 57,413 74,705 7,404 46, ,056 Source: Department of Transport Number Transport
59 Table 3.9 Number of Penalty Points issued to Females by County and Main Offence Type, 2007 Of which Number County Total no. of points issued Speeding Driving a vehicle while holding a mobile phone No safety belt - driver Fail to obey traffic lights Fail to comply with prohibitory traffic signs Cross continuous white line/broken white line No safety belt rear seat - child Driving without reasonable consideration Entry to hatched marked area Fail to comply with traffic lane markings Offence relating to Overtaking No safety belt front seat - child No child restraint rear seat - child Fail to comply with no entry traffic sign Drive on hard shoulder/non carriageway - motorway Carlow 1, Cavan Clare 1,980 1, Cork 5,911 4, Donegal 1,675 1, Galway 3,228 2, Kerry 1,914 1, Kildare 4,750 4, Kilkenny 1,924 1, Laois 1,472 1, Leitrim Limerick 2,174 1, Longford Louth 2,074 1, Mayo 1,506 1, Meath 4,595 4, Monaghan Offaly 1,325 1, Roscommon Sligo 1,371 1, Tipperary NR 1, Tipperary SR 1, Waterford Westmeath 1,367 1, Wexford 2,518 1, Wicklow 2,472 2, Dublin City 25,928 21,160 1, , Limerick City Waterford City No driver Number 1 1 Total 77,542 62,151 5,187 3,091 1,725 1, Source: Department of Transport 59 Transport 2007
60 Table 3.10 Number of Penalty Points issued to Males by County and Main Offence Type, 2007 County Total no. of points issued Of which Speeding No safety belt - driver Fail to obey traffic lights No insurance - (user) Cross continuous white line/broken white line Fail to comply with prohibitory traffic signs Driving a vehicle while holding a mobile phone Entry to hatched marked area Offence relating to Overtaking Driving without reasonable consideration Careless Driving Fail to comply with traffic lane markings No safety belt rear seat - child Number Driveonhard shoulder/non carriageway - motorway Carlow 3,344 2, Cavan 2,580 1, Clare 4,362 3, Cork 19,260 12,513 2, , Donegal 5,514 3, Galway 8,340 6, Kerry 5,332 3, Kildare 11,608 9, Kilkenny 4,642 3, Laois 4,010 2, Leitrim 1, Limerick 5,908 4, Longford 1,921 1, Louth 4,870 3, Mayo 4,532 3, Meath 9,827 7, Monaghan 2,029 1, Offaly 3,784 2, Roscommon 2,904 2, Sligo 2,731 2, Tipperary NR 3,035 2, Tipperary SR 3,767 2, Waterford 2,797 1, Westmeath 3,564 2, Wexford 7,013 4, Wicklow 6,389 4, Dublin City 62,745 47,171 2,906 2, ,009 3, Limerick City 1,797 1, Waterford City 2,442 1, No driver Number 46,840 29,553 3,773 1,301 2, , Total 249, ,718 20,621 6,770 3,139 4,604 5,306 16,874 1,472 1,304 2, , Transport Source: Department of Transport
61 Chapter 4 Road Safety and Road Lengths
62 Transport Table 4.1 Number of Persons Killed classified by Road User Type, Number Road User Type Pedestrians Pedal Cyclists Motor Cyclists Car Users Other Road User Total Source: Road Safety Authority Table 4.2 Number of Persons Injured classified by Road User Type, Number Road User Type Pedestrians 1,113 1,110 1, Pedal Cyclists Motor Cyclists 1, Car Users 6,803 6,025 5,349 5,187 6,406 5,798 Other Road Users ,165 1,117 Total 10,222 9,206 8,262 7,867 9,318 8,575 Source: Road Safety Authority Number 250 Number of Persons Killed Classified by Road User Type, Pedestrians Pedal Cyclists Motor Cyclists Car Users OtherRoad User Year
63 63 Transport 2007 Table 4.3 Number of Persons Killed and Injured by County, Number Persons Killed Persons Injured County Leinster Carlow Dublin ,828 1,621 1,716 1,713 Kildare Kilkenny Laois Longford Louth Meath Offaly Westmeath Wexford Wicklow Munster Clare Cork , Kerry Limerick Tipperary N Tipperary S Waterford Connacht Galway Leitrim Mayo Roscommon Sligo Ulster (part of) Cavan Donegal Monaghan Total ,262 7,867 9,318 8,575 Source: Road Safety Authority
64 Table 4.4 Number of Female Casualties classified by Road User Type and Age, 2006 Number and rate Total Pedestrians Pedal Cyclists Motor Cyclists Age Groups Killed Injured Total % Killed Injured Total % Killed Injured Total % Killed Injured Total % and over Unknown Total 97 3,268 3, Transport Car Drivers Car Passengers Total Car Users Other Road Users Age Groups Killed Injured Total % Killed Injured Total % Killed Injured Total % Killed Injured Total % and over Unknown Total 36 1,640 1, ,006 1, ,646 2, Source: Road Safety Authority
65 Table 4.5 Number of Male Casualties classified by Road User Type and Age, 2006 Number and rate Total Pedestrians Pedal Cyclists Motor Cyclists Age Groups Killed Injured Total % Killed Injured Total % Killed Injured Total % Killed Injured Total % ,073 1, and over Unknown Total 262 4,466 4, Car Drivers Car Passengers Total Car Users Other Road Users Age Groups Killed Injured Total % Killed Injured Total % Killed Injured Total % Killed Injured Total % and over Unknown Transport 2007 Total 109 1,888 1, ,674 2, Source: Road Safety Authority
66 Transport Table 4.6 Number of Road Deaths and Number of Vehicles under current licence, Number Number of Road Deaths Number of Vehicles Licensed 1,937,429 2,036,307 2,138,680 2,296,393 2,441,564 Source: Department of Transport Table 4.7 Road Fatalities classified by Month of Year, Number January February March April May June July August September October November December Total Source: Department of Transport Table 4.8 Number of Traffic Collisions and Casualties classified by Month of Year, 2006 Number and rate Month Collisions Casualties Fatal Injury Total % Killed Injured Total % January February March April May June July August September October November December Total 321 5,697 6, ,575 8, Source: Road Safety Authority
67 67 Transport 2007 Table 4.9 Number of Fatal and Injury Collisions and Casualties classified by Day of Week, 2006 Number and rate Collisions Casualties Day Fatal Injury Total % Killed Injured Total % Sunday ,474 1, Monday ,207 1, Tuesday ,157 1, Wednesday ,030 1, Thursday ,003 1, Friday ,297 1, Saturday ,407 1, Total 321 5,697 6, ,575 8, Source: Road Safety Authority Table 4.10 Number of Fatal and Injury Collisions and Casualties classified by Hour of Day, 2006 Number and rate Collisions Casualties Hour Beginning Fatal Injury Total % Killed Injured Total % 12 midnight Unknown Total 321 5,697 6, ,575 8, Source: Road Safety Authority
68 Transport Table 4.11 Number of Traffic Collisions and Casualties in each County, 2006 Collisions Casualties Number and rate County and Province Reg. Motor Pop ('000's) Vehicle (000's) Fatal Injury Total % Killed Injured Total % Leinster Carlow Dublin 1, ,288 1, ,713 1, Kildare Kilkenny Laois Longford Louth Meath Offaly Westmeath Wexford Wicklow Munster Clare Cork Kerry Limerick Tipperary N Tipperary S Waterford Connacht Galway Leitrim Mayo Roscommon Sligo Ulster (part of) Cavan Donegal Monaghan Total 4,240 2, ,697 6, ,575 8, Source: Road Safety Authority
69 69 Transport 2007 Table 4.12 Number of Drivers of Cars Involved in Fatal and Injury Collisions classified by Age and Gender, 2006 Number and rate Male Female Age Group Killed Injured Uninjured Total Killed Injured Uninjured Total Overall Total % of Total , , and over Unknown Total 109 1,888 1,835 3, , ,497 6, Source: Road Safety Authority Table 4.13 Number of Cars and Goods Vehicles Involved in Fatal and Injury Collisions classified by Driver's Country of Residence, 2006 Number and rate Fatal Injury Total % Cars Ireland 234 5,272 5, N. Ireland Britain Other Total 247 5,599 5, Goods Ireland , N. Ireland Britain Other Total 77 1,028 1, Source: Road Safety Authority
70 Transport Table 4.14 Number of Users of Cars Involved in Fatal and Injury Collisions classified by Seat Belt Usage, 2006 Number and rate Seat Belt Usage Killed Injured Uninjured Total % Car Drivers Seat Belt in Use 49 1,658 1,157 2, Seat Belt Not in Use Unknown 44 1,241 1,005 2, Not Stated , Total 147 3,759 2,858 6, Passengers (front seat) Seat Belt in Use * Seat Belt Not in Use 4 45 * Unknown * Not Stated * Total 46 1,176 * 1, Source: Road Safety Authority * Not Available
71 71 Transport 2007 Table 4.15 National Road Length in Kilometres by Carriageway Type, Kilometres and rate Carriageway Type km % km % km % km % Motorway % % % % Dual Carriageway/Two Plus One % % % % Single 4, % 4, % 4, % 4, % Total 5, % 5, % 5, % 5, % Source: National Roads Authority Table 4.16 National Route Length in Kilometres by Carriageway Type and Local Authority, 2007 Kilometres Dual Two Plus Local Authority Motorway Carriageway One Single Total Carlow Cavan Clare Cork City Cork County Donegal Dublin City Dun Laoghaire/Rathdown Fingal Galway City Galway County Kerry Kildare Kilkenny Laois Leitrim Limerick City 8 8 Limerick County Longford Louth Mayo Meath Monaghan Offaly Roscommon Sligo South Dublin Tipperary North Tipperary South Waterford City Waterford County Westmeath Wexford Wicklow Total ,714 5,427 Source: National Roads Authority
72
73 Chapter 5 Road Freight Transport
74 Transport Table 5.1 Road Freight Transport Statistics Summary, Year Tonne- Kilometres Tonnes Carried Vehicle Kilometres Average Number of Vehicles million thousand million number , ,836 1,208 45, , ,911 1,344 51, , ,972 1,452 58, , ,135 1,657 68, , ,849 1,668 76, , ,591 1,973 78, , ,465 2,124 81, , ,334 2,342 84, , ,866 2,566 94, , ,913 2, , , ,826 2, ,697 Weight of goods carried by year, , , ,000 Tonnes carried (thousand) 200, , ,000 50, Year
75 75 Transport 2007 Table 5.2 Road Freight Transport Activity classified by Main type of work and Main use of vehicle, 2007 Main type of work done by vehicle Tonne-km (million) Own Account Hire or Reward Total Tonnes carried (thousand) Own Account Hire or Reward Total Import/export work ,735 4, ,074 18,400 Carriage of livestock ,266 1,170 2,436 Carriage of other farm produce from farms ,571 4,244 5,815 Carriage of fertilisers, feedingstuffs etc. to farms ,913 5,741 8,654 Delivery of goods to road works or building sites 1,901 2,424 4,325 74,408 85, ,845 Delivery of goods to retail outlets 909 1,645 2,553 10,280 14,749 25,029 Delivery of goods to wholesalers ,250 2,884 9,780 12,665 Delivery of materials and fuels to factories 303 1,315 1,619 3,792 15,439 19,232 Delivery of goods to households ,336 1,232 7,568 Other work 1,306 1,906 3,211 30,286 24,898 55,184 Total 5,345 13,801 19, , , ,826 1 Includes work done to and from ports as well as roll-on/roll-off and cross-border work Source: CSO
76 Table 5.3 Road Freight Transport Activity classified by Business of owner and Main use of vehicle, 2007 Business of owner of vehicle Own Account Tonne-km (million) Hire or Reward Total Tonnes carried (thousand) Own Account Own Account (million) Hire or Reward Transport 0 10,919 10, , , ,068 1,068 Manufacturing industry 1, ,666 48, , Mining & quarrying (incl. sand & gravel merchants) , , Creameries & agricultural cooperative societies , , Manufacture of food & feeding stuffs , , Manufacture of drink & tobacco Hire or Reward Total Loaded vehicle kilometres Total Total vehicle kilometres (million) Own Hire or Total Account Reward Transport Manufacture of glass, cement & clay products , , Other manufacturing , , Building & Construction , , Distribution 2,007 2,430 4,438 37,581 56,351 93, Agriculture & livestock dealing , , Local Authorities , , Other ,486 9,819 20, Total 5,345 13,801 19, , , , ,674 1,227 1,435 2,662 Source: CSO
77 Table 5.4 Road Freight Transport Activity classified by Region of origin and Region of destination, 2007 Region of Destination Region of Origin Border Midland West Dublin Mid-East Mid-West South-East South-West Northern Ireland Other Countries Total Tonne-km (million) Border ,923 Midland ,094 West ,383 Dublin ,370 Mid-East ,766 Mid-West ,724 South-East , ,510 South-West , ,733 Northern Ireland Other Countries ,280 Total 1,814 1,023 1,502 3,331 1,702 1,699 2,493 2, ,313 19,146 Tonnes carried (thousand) Border 28, ,526 1, , ,440 Midland 1,250 15, , ,036 West 1,479 1,226 25, ,164 Dublin 2,977 1, ,680 12,333 1,258 2,114 1, ,757 Mid-East 1,731 1, ,867 19, , ,467 Mid-West ,898 2,541 2, ,917 South-East ,984 2,006 1,940 33,212 2, ,526 South-West , ,427 2,260 37, ,947 Northern Ireland 1, , ,764 Other Countries , ,632 3, Total 38,324 22,838 30,701 52,173 37,710 34,640 44,535 45,784 4,492 3, ,826 Vehicle kilometres (million) Border Midland West Dublin Mid-East Mid-West South-East South-West Northern Ireland Other Countries Transport 2007 Total Source: CSO ,662
78 Transport Table 5.5 Road Freight Transport Activity classified by Group of goods and Main use of vehicle, 2007 Group of goods (NST/R Chapter) Tonne-km (million) Tonnes carried (thousand) OwnAccount HireorReward Total Own Account Hire or Reward Total Agricultural products & live animals 345 1,491 1,836 4,887 11,551 16,438 Foodstuffs & animal fodder 817 3,024 3,841 9,406 22,989 32,395 Solid mineral fuels ,341 2,101 3,441 Petroleum products ,215 4,060 11,275 Ores & metal waste ,119 1,627 Metal products ,381 2,764 4,145 Crude & manufactured minerals, building materials 2,126 3,419 5,545 89, , ,497 Fertilisers ,743 3,119 4,863 Chemicals ,303 3,526 4,829 Machinery, transport equipment, manufactured articles & miscellaneous articles 860 2,149 3,009 11,998 16,010 28,008 Mixed loads 301 2,236 2,538 5,076 10,231 15,307 Total 5,345 13,801 19, , , ,826 Source: CSO
79 79 Transport 2007 Table 5.6 Average Number of Road Freight vehicles classified by Unladen weight, Year of manufacture and Main use of vehicle, 2007 Unladen weight and Year of manufacture of vehicle Number of vehicles OwnAccount HireorReward Total Unladen weight (kg) 2,000-5,000 5,001-7,500 64,937 7,509 5,576 1,656 70,513 9,165 7,501-10,000 7,264 3,441 10,705 10,001-12,500 7,818 9,221 17,039 Over 12,500 7,148 7,126 14,274 Total 94,678 27, ,697 Year of manufacture ,207 11,573 5,145 4,650 26,352 16, ,720 4,168 18, ,335 4,493 17, ,100 3,991 16, or before 21,743 4,573 26,316 Total 94,678 27, ,697 Source: CSO Table 5.7 Number of Licensed Road Hauliers by County, Number County Carlow Cavan Clare Cork Donegal Dublin Galway Kerry Kildare Kilkenny Laois Leitrim Limerick Longford Louth Mayo Meath Monaghan Offaly Roscommon Sligo Tipperary Waterford Westmeath Wexford Wicklow Total 5,153 5,173 Source: Department of Transport
80
81 Chapter 6 Aviation Transport
82 Transport Table 6.1 Total Passenger Numbers handled by Airport, Number Airport Cork 1,874,447 2,182,157 2,254,251 2,729,906 3,023,527 3,183,146 Donegal 23,977 24,156 42,675 47,793 46,731 61,410 Dublin 15,084,667 15,856,084 17,138,373 18,450,439 21,265,887 23,307,333 Galway 110, , , , , ,320 Kerry 169, , , , , ,138 Knock 191, , , , , ,042 Shannon 2,353,530 2,400,677 2,395,116 3,302,424 3,690,889 3,524,450 Sligo 26,316 30,329 41,053 39,593 34,292 44,533 Waterford 34,541 34,919 60,875 74,357 80, ,392 Total * * * * * * Source: CSO * Totals for years cannot be computed due to double reporting of arrivals and departures of national traffic Number Passenger Numbers by Main Airport by Year, ,000,000 20,000,000 15,000,000 10,000,000 Cork Dublin Shannon 5,000, Year


83 83 Transport 2007 Table 6.2 Passenger Numbers handled classified by Main Airport and Month, 2007 Number Month Cork Dublin Kerry Knock Shannon Total January 199,745 1,463,182 20,131 29, ,337 * February 206,094 1,514,142 22,578 30, ,896 * March 238,553 1,799,135 24,881 37, ,453 * April 248,050 1,866,429 29,618 42, ,053 * May 283,548 2,018,115 36,197 40, ,763 * June 314,195 2,210,712 39,057 57, ,315 * July 336,459 2,439,662 42,666 60, ,838 * August 335,765 2,419,355 46,214 70, ,002 * September 306,843 2,185,143 39,426 58, ,505 * October 264,894 2,007,957 37,820 40, ,772 * November 223,004 1,709,366 26,021 38, ,102 * December 225,996 1,674,135 26,529 38, ,414 * Total 3,183,146 23,307, , ,042 3,524,450 * Source: CSO * Totals for months cannot be computed due to double reporting of arrivals and departures of national traffic Passenger Numbers handled by Main Airport, 2007 Cork Dublin Kerry Knock Shannon
84 Transport Table 6.3 Number of Passengers handled by Main Airport classified by National/International traffic and Month, 2007 Number Month Cork Dublin Kerry Knock Shannon Total All Passengers January 199,745 1,463,182 20,131 29, ,337 * February 206,094 1,514,142 22,578 30, ,896 * March 238,553 1,799,135 24,881 37, ,453 * April 248,050 1,866,429 29,618 42, ,053 * May 283,548 2,018,115 36,197 40, ,763 * June 314,195 2,210,712 39,057 57, ,315 * July 336,459 2,439,662 42,666 60, ,838 * August 335,765 2,419,355 46,214 70, ,002 * September 306,843 2,185,143 39,426 58, ,505 * October 264,894 2,007,957 37,820 40, ,772 * November 223,004 1,709,366 26,021 38, ,102 * December 225,996 1,674,135 26,529 38, ,414 * Total 3,183,146 23,307, , ,042 3,524,450 * National Traffic January 34,855 81,222 7, ,892 * February 38,365 86,581 8,850 1,077 28,240 * March 41, ,101 9,721 1,199 37,911 * April 39,730 87,914 9,432 1,463 27,465 * May 43,005 94,449 10,226 1,356 28,274 * June 46,156 94,204 10,951 1,383 25,524 * July 47, ,096 11,430 1,477 28,390 * August 47,913 94,965 11,850 1,641 22,861 * September 42,388 85,646 11,323 1,549 15,854 * October 44,616 88,982 11,443 1,581 16,179 * November 40,829 89,188 10,444 1,346 26,603 * December 38,583 83,624 9,295 1,156 24,863 * Total 505,873 1,087, ,423 16, ,056 * International Traffic January 164,890 1,381,960 12,673 28, ,445 1,783,290 February 167,729 1,427,561 13,728 29, ,656 1,836,298 March 197,006 1,699,034 15,160 35, ,542 2,189,593 April 208,320 1,778,515 20,186 41, ,588 2,298,920 May 240,543 1,923,666 25,971 38, ,489 2,506,328 June 268,039 2,116,508 28,106 55, ,791 2,812,310 July 288,573 2,338,566 31,236 59, ,448 3,096,198 August 287,852 2,324,390 34,364 68, ,141 3,088,271 September 264,455 2,099,497 28,103 56, ,651 2,748,616 October 220,278 1,918,975 26,377 39, ,593 2,465,476 November 182,175 1,620,178 15,577 36, ,499 2,055,349 December 187,413 1,590,511 17,234 37, ,551 2,024,075 Total 2,677,273 22,219, , ,981 3,211,394 28,904,724 Source: CSO * Totals for months cannot be computed due to double reporting of arrivals and departures of national traffic
85 85 Transport 2007 Table 6.4 Number of Passengers handled by Main Airport classified by Arrivals/Departures and Month, 2007 Number Month Cork Dublin Kerry Knock Shannon Total All Passengers January 199,745 1,463,182 20,131 29, ,337 * February 206,094 1,514,142 22,578 30, ,896 * March 238,553 1,799,135 24,881 37, ,453 * April 248,050 1,866,429 29,618 42, ,053 * May 283,548 2,018,115 36,197 40, ,763 * June 314,195 2,210,712 39,057 57, ,315 * July 336,459 2,439,662 42,666 60, ,838 * August 335,765 2,419,355 46,214 70, ,002 * September 306,843 2,185,143 39,426 58, ,505 * October 264,894 2,007,957 37,820 40, ,772 * November 223,004 1,709,366 26,021 38, ,102 * December 225,996 1,674,135 26,529 38, ,414 * Total 3,183,146 23,307, , ,042 3,524,450 * Arrivals January 101, ,567 9,613 13, ,871 * February 102, ,411 11,378 15, ,148 * March 118, ,473 12,620 18, ,932 * April 123, ,740 14,714 20, ,803 * May 138, ,540 18,392 20, ,854 * June 152,234 1,076,468 18,924 27, ,156 * July 169,101 1,223,539 21,791 30, ,291 * August 168,105 1,230,396 22,845 34, ,536 * September 151,351 1,099,627 18,874 28, ,545 * October 131,460 1,004,135 18,311 21, ,998 * November 111, ,943 12,852 19, ,148 * December 110, ,788 13,794 20, ,397 * Total 1,577,824 11,668, , ,357 1,747,679 * Departures January 98, ,615 10,518 15, ,466 * February 103, ,731 11,200 15, ,748 * March 120, ,662 12,261 18, ,521 * April 124, ,689 14,904 21, ,250 * May 145,226 1,023,575 17,805 19, ,909 * June 161,961 1,134,244 20,133 29, ,159 * July 167,358 1,216,123 20,875 30, ,547 * August 167,660 1,188,959 23,369 35, ,466 * September 155,492 1,085,516 20,552 29, ,960 * October 133,434 1,003,822 19,509 19, ,774 * November 111, ,423 13,169 18, ,954 * December 115, ,347 12,735 18, ,017 * Total 1,605,322 11,638, , ,685 1,776,771 * Source: CSO * Totals for months cannot be computed due to double reporting of arrivals and departures of national traffic
86 Transport Table 6.5 Number of Passengers handled by Main Airport classified by Scheduled/Non Scheduled travel and Month, 2007 Number Month Cork Dublin Kerry Knock Shannon Total All Passengers Month January 199,745 1,463,182 20,131 29, ,337 * February 206,094 1,514,142 22,578 30, ,896 * March 238,553 1,799,135 24,881 37, ,453 * April 248,050 1,866,429 29,618 42, ,053 * May 283,548 2,018,115 36,197 40, ,763 * June 314,195 2,210,712 39,057 57, ,315 * July 336,459 2,439,662 42,666 60, ,838 * August 335,765 2,419,355 46,214 70, ,002 * September 306,843 2,185,143 39,426 58, ,505 * October 264,894 2,007,957 37,820 40, ,772 * November 223,004 1,709,366 26,021 38, ,102 * December 225,996 1,674,135 26,529 38, ,414 * Total 3,183,146 23,307, , ,042 3,524,450 * Scheduled January 182,164 1,389,568 19,946 28, ,410 * February 190,707 1,430,303 22,392 29, ,383 * March 220,720 1,714,946 24,804 35, ,751 * April 234,865 1,785,746 29,618 42, ,480 * May 245,458 1,843,306 36,197 40, ,828 * June 248,705 1,948,314 39,057 42, ,781 * July 269,486 2,134,302 42,666 45, ,223 * August 274,168 2,146,180 46,214 50, ,305 * September 246,135 1,907,176 39,426 45, ,574 * October 245,873 1,892,918 36,007 36, ,708 * November 214,632 1,669,769 25,810 36, ,641 * December 212,079 1,610,959 26,362 37, ,979 * Total 2,784,992 21,473, , ,934 3,184,063 * Non Scheduled January 17,581 73, ,137 8,927 * February 15,387 83, ,468 7,513 * March 17,833 84, ,395 11,702 * April 13,185 80, ,573 * May 38, , ,935 * June 65, , ,280 63,534 * July 66, , ,072 58,615 * August 61, , ,977 56,697 * September 60, , ,828 46,931 * October 19, ,039 1,813 4,171 25,064 * November 8,372 39, ,541 7,461 * December 13,917 63, ,239 7,435 * Total 398,154 1,833,846 2,639 73, ,387 * Source: CSO * Totals for months cannot be computed due to double reporting of arrivals and departures of national traffic
87 87 Transport 2007 Table 6.6 Number of Flights handled by Main Airport classified by National/International traffic and Month, 2007 Number Month Cork Dublin Kerry Knock Shannon Total All Flights January 2,533 14, ,105 * February 2,357 14, ,874 * March 2,752 16, ,184 * April 2,782 16, ,058 * May 3,201 17, ,371 * June 3,247 17, ,553 * July 3,397 18, ,711 * August 3,358 18, ,625 * September 3,256 17, ,356 * October 3,012 17, ,144 * November 2,602 15, ,891 * December 2,528 15, ,861 * Total 35, ,906 5,771 4,826 26,733 * National Traffic January 665 1, * February 712 1, * March 735 1, * April 733 1, * May 780 1, * June 745 1, * July 806 1, * August 890 1, * September 816 1, * October 737 1, * November 630 1, * December 574 1, * Total 8,823 20,224 2, ,820 * International Traffic January 1,868 13, ,704 17,231 February 1,645 12, ,546 16,119 March 2,017 14, ,803 18,663 April 2,049 15, ,752 19,417 May 2,421 15, ,014 20,725 June 2,502 16, ,272 21,720 July 2,591 16, ,415 22,631 August 2,468 16, ,317 22,274 September 2,440 16, ,114 21,584 October 2,275 15, ,881 20,258 November 1,972 14, ,565 18,265 December 1,954 13, ,530 17,983 Total 26, ,682 2,948 4,125 22, ,870 Source: CSO * Totals for months cannot be computed due to double reporting of arrivals and departures of national traffic
88 Transport Table 6.7 Number of Flights handled by Main Airport classified by Arrivals/Departures and Month, 2007 Number Month Cork Dublin Knock Kerry Shannon Total All Flights January 2,533 14, ,105 * February 2,357 14, ,874 * March 2,752 16, ,184 * April 2,782 16, ,058 * May 3,201 17, ,371 * June 3,247 17, ,553 * July 3,397 18, ,711 * August 3,358 18, ,625 * September 3,256 17, ,356 * October 3,012 17, ,144 * November 2,602 15, ,891 * December 2,528 15, ,861 * Total 35, ,906 4,826 5,771 26,733 * Arrivals January 1,264 7, ,056 * February 1,172 7, * March 1,383 8, ,096 * April 1,389 7, ,032 * May 1,589 8, ,184 * June 1,630 8, ,284 * July 1,699 9, ,354 * August 1,673 9, ,300 * September 1,637 8, ,160 * October 1,506 8, ,076 * November 1,300 7, * December 1,258 7, * Total 17, ,227 2,421 2,911 13,354 * Departures January 1,269 7, ,049 * February 1,185 7, * March 1,369 8, ,088 * April 1,393 8, ,026 * May 1,612 8, ,187 * June 1,617 8, ,269 * July 1,698 9, ,357 * August 1,685 9, ,325 * September 1,619 8, ,196 * October 1,506 8, ,068 * November 1,302 7, * December 1,270 7, * Total 17, ,679 2,405 2,860 13,379 * Source: CSO * Totals for months cannot be computed due to double reporting of arrivals and departures of national traffic
89 89 Transport 2007 Table 6.8 Number of Flights handled by Main Airport classified by Scheduled/Non Scheduled travel and Month, 2007 Number Month Cork Dublin Kerry Knock Shannon Total All Flights January 2,533 14, ,105 * February 2,357 14, ,874 * March 2,752 16, ,184 * April 2,782 16, ,058 * May 3,201 17, ,371 * June 3,247 17, ,553 * July 3,397 18, ,711 * August 3,358 18, ,625 * September 3,256 17, ,356 * October 3,012 17, ,144 * November 2,602 15, ,891 * December 2,528 15, ,861 * Total 35, ,906 5,771 4,826 26,733 * Scheduled January 2,274 14, ,033 * February 2,099 13, ,820 * March 2,416 14, ,104 * April 2,518 14, ,963 * May 2,717 15, ,140 * June 2,576 15, ,139 * July 2,694 16, ,281 * August 2,683 16, ,257 * September 2,548 15, ,022 * October 2,603 15, ,976 * November 2,384 15, ,838 * December 2,318 14, ,798 * Total 29, ,013 5,477 4,303 24,371 * Non Scheduled January * February 258 1, * March 336 1, * April 264 1, * May 484 1, * June 671 2, * July 703 2, * August 675 2, * September 708 2, * October 409 1, * November * December * Total 5,195 18, ,362 * Source: CSO * Totals for months cannot be computed due to double reporting of arrivals and departures of national traffic
90 Transport Table 6.9 Air Freight handled by Main Airport classified by National/International traffic and Month, 2007 Tonnes Month Cork Dublin Knock Shannon Total All Freight January 392 8, ,143 * February 416 7, ,333 * March 458 9, ,623 * April 401 8, ,423 * May 432 9, ,274 * June 470 8, ,196 * July 545 9, ,279 * August 477 9, ,082 * September 448 9, ,190 * October , ,226 * November 556 9, ,243 * December , ,996 * Total 5, , ,008 * National Traffic January 100 1, ,134 * February 96 1, ,190 * March 132 1, ,233 * April 128 1, ,221 * May 131 1, ,217 * June * July * August * September * October * November ,112 * December 104 1, * Total 1,512 12, ,540 * International Traffic January 292 7, ,009 8,447 February 320 6, ,143 8,096 March 326 8, ,390 9,793 April 273 7, ,202 9,060 May 301 7, ,057 9,188 June 311 8, ,322 9,759 July 400 8, ,315 10,212 August 346 8, ,213 10,054 September 336 8, ,367 10,383 October 398 9, ,321 11,302 November 414 8, ,131 10,327 December 316 8, ,300 Total 4,033 98, , ,921 Source: CSO * Totals for months cannot be computed due to double reporting of arrivals and departures of national traffic
91 91 Transport 2007 Table 6.10 Air Freight handled by Main Airport classified by Arrival/Departure and Month, 2007 Tonnes Month Cork Dublin Knock Shannon Total All Freight January 393 8, ,143 * February 416 7, ,333 * March 458 9, ,623 * April 402 8, ,423 * May 432 9, ,273 * June 471 8, ,196 * July 544 9, ,278 * August 477 9, ,081 * September 448 9, ,190 * October , ,226 * November 557 9, ,243 * December , ,995 * Total 5, , ,004 * Arrivals January 184 4, ,106 * February 205 4, ,188 * March 219 5, ,370 * April 186 5, ,332 * May 211 5, ,203 * June 237 5, ,122 * July 308 5, ,212 * August 253 5, ,295 * September 242 5, ,297 * October 283 6, ,313 * November 294 5, ,335 * December 219 5, ,230 * Total 2,841 65, ,003 * Departures January 209 3, ,037 * February 211 3, ,145 * March 239 4, ,253 * April 216 3, ,091 * May 221 3, ,070 * June 234 3, ,074 * July 236 3, ,066 * August 224 3, * September 206 3, * October 247 4, * November 263 3, * December 201 4, * Total 2,707 45, ,001 * Source: CSO * Totals for months cannot be computed due to double reporting of arrivals and departures of national traffic
92 Transport Table 6.11 Top 10 International Arrivals for Cork Airport by Number of Passengers, 2007 Number London - Heathrow, Great Britain 233,866 London - Stansted, Great Britain 150,734 Amsterdam, Netherlands 76,839 Birmingham, Great Britain 60,905 London - Gatwick, Great Britain 57,165 Paris - Charles De Gaulle, France 49,601 Lanzarote, Spain 46,087 Liverpool, Great Britain 45,161 Malaga, Spain 43,190 Manchester, Great Britain 42,083 Source: CSO Table 6.12 Top 10 International Arrivals for Dublin Airport by Number of Passengers, 2007 Number London - Heathrow, Great Britain 980,592 London - Stansted, Great Britain 491,659 London - Gatwick, Great Britain 442,529 Manchester, Great Britain 345,377 Paris - Charles De Gaulle, France 332,353 Birmingham, Great Britain 286,234 Amsterdam, Netherlands 251,719 New York - JFK, USA 241,644 Malaga, Spain 240,960 Edinburgh, Great Britain 221,906 Source: CSO
93 93 Transport 2007 Table 6.13 Top 10 International Arrivals for Knock Airport by Number of Passengers, 2007 Number London - Stansted, Great Britain 59,340 London - Luton, Great Britain 53,916 Manchester, Great Britain 38,810 Birmingham, Great Britain 38,802 Derby - East Midlands, Great Britain 20,614 Lanzarote, Spain 10,602 New York - JFK, USA 5,193 Reus, Spain 5,121 Palma, Spain 4,560 Malaga, Spain 4,274 Source: CSO Table 6.14 Top 10 International Arrivals for Shannon Airport by Number of Passengers, 2007 Number London - Heathrow, Great Britain 162,926 London - Stansted, Great Britain 147,084 New York - JFK, USA 119,473 Boston, USA 67,717 Newark, USA 59,388 London - Gatwick, Great Britain 56,301 Chicago - O'Hare, USA 51,803 Paris - Beauvais, France 49,434 Bristol, Great Britain 47,771 Derby - East Midlands, Great Britain 47,114 Source: CSO
94 Transport Table 6.15 Top 5 International Arrivals for Kerry Airport by Number of Passengers, 2007 Number London - Stansted, Great Britain 75,624 Frankfurt - Hahn, Germany 42,116 Manchester, Great Britain 7,851 London - Luton, Great Britain 1,758 Palma, Spain 1,240 Source: CSO Table 6.16 Top 5 International Arrivals for Galway Airport by Number of Passengers, 2007 Number London - Luton, Great Britain 38,794 Manchester, Great Britain 21,766 Edinburgh, Great Britain 11,123 Leeds Bradford, Great Britain 6,845 Southampton, Great Britain 5,590 Source: CSO Table 6.17 Top 5 International Arrivals for Waterford Airport by Number of Passengers, 2007 Number London - Luton, Great Britain 35,375 Manchester, Great Britain 10,083 Birmingham, Great Britain 7,067 Lorient, France 1,888 Faro, Portugal 1,232 Source: CSO
95 95 Transport 2007 Table 6.18 International Passenger Numbers arriving in Irish Airports on Direct Flights by Region of Origin, 2007 Number Africa 51,369 North America 1,143,394 Asia 69,598 EU 27 6,865,336 Europe other than EU ,723 United Kingdom 6,039,658 Total 14,544,078 Source: CSO Table 6.19 International Passenger Numbers departing from Irish Airports on Direct Flights by Region of Destination, 2007 Number Africa 52,240 North America 1,136,072 Asia 67,709 EU 27 6,848,589 Europe other than EU ,638 United Kingdom 6,104,986 Total 14,584,234 Source: CSO
96
97 Chapter 7 Public Transport
98 Table 7.1 Number of Scheduled Bus Passenger Services, Thousands Scheduled services Passenger journeys Dublin city services 134, , , , , , , ,532 Provincial city and town services 19,156 20,051 20,954 21,391 21,070 21,574 21,940 22,085 Other scheduled services 21,364 23,729 25,104 26,969 26,803 27,467 27,783 28,136 School transport scheme 43,797 43,610 43,300 43,554 42,402 43,596 42,367 45,507 Total 218, , , , , , , ,260 Vehicle kilometres Dublin city services 54,126 56,873 57,602 57,903 58,285 59,750 59,779 63,234 Provincial city and town services 7,197 7,593 7,745 8,201 8,027 8,236 8,317 8,529 Other scheduled services 66,363 70,457 71,840 77,095 77,551 83,074 83,401 84,400 Total 127, , , , , , , ,163 Source: Bus Éireann Dublin Bus Transport
99 99 Transport 2007 Table 7.2 Average Daily flow of Dublin Bus Passengers by Time of Day, 2007 Hour % of daily flow 00:00-06:59 4.1% 07:00-07:59 7.3% 08:00-08:59 8.0% 09:00-09:59 5.4% 10:00-12: % 13:00-15: % 16:00-16:59 8.4% 17:00-17:59 8.9% 18:00-18:59 6.8% 19:00-21: % 22:00-24:00 3.6% Total 100.0% Source: Dublin Bus Table 7.3 Average Weekly flow of Dublin Bus Passengers by Day of Week, 2007 Day of week Number Monday 423,812 Tuesday 453,995 Wednesday 477,944 Thursday 475,445 Friday 476,520 Saturday 330,737 Sunday 211,500 Total 2,849,953 Source: Dublin Bus
100 Transport Table 7.4 Dublin Bus Passenger Numbers by Month, 2007 Month Number January 12,322,909 February 12,274,265 March 12,632,915 April 12,260,405 May 12,584,916 June 11,446,716 July 12,624,972 August 11,889,756 September 12,895,868 October 13,574,961 November 12,308,708 December 10,715,609 Total 147,532,000 Source: Dublin Bus
101 101 Transport 2007 Table 7.5 Dublin Bus Fleet by Garage, 2007 Low Floor Buses Other Buses Number Total Donnybrook Donnybrook Ringsend Conyngham Road Summerhill Clontarf Phibsboro Harristown Total ,145 Source: Dublin Bus Table 7.6 Dublin Bus Driver Profile by Gender and Age, 2007 Age Profile Drivers Male Female Total Number % % % % % % % % % Total 2, , % % male/female 96.5% 3.5% 100% Source: Dublin Bus
102 Transport Table 7.7 Average Daily flow of Bus Éireann Passengers by City Services and Time of Day, 2007 Hour % of daily flow Cork Galway Limerick Waterford 00:00-00: :00-05: :00-06: :00-07: :00-08: :00-09: :00-10: :00-11: :00-12: :00-13: :00-14: :00-15: :00-16: :00-17: :00-18: :00-19: :00-20: :00-21: :00-22: :00-23: Total Source: Bus Éireann Table 7.8 Day of week Average Weekly flow of Bus Éireann Passengers by City Services and Day of Week, 2007 Number Cork Galway Limerick Waterford Monday 31,332 10,799 10,000 2,937 Tuesday 31,364 11,143 10,266 3,103 Wednesday 32,933 11,488 10,307 3,024 Thursday 35,587 11,799 11,421 3,520 Friday 35,828 11,912 11,744 3,680 Saturday 23,782 7,712 8,237 2,183 Sunday 10,674 3,188 3,101 Total 201,500 68,041 65,076 18,447 Source: Bus Éireann
103 103 Transport 2007
104 Transport Table 7.9 Bus Éireann Passenger Numbers, 2007 Million City/Town Services Cork City 12.6 Limerick City 3.5 Galway City 3.6 Waterford City 1.1 Town Services 1.3 Stage Carriage/Commuter 18.8 Expressway/Eurolines 8.7 Schools 45.5 Other Services 0.6 Total 95.7 Source: Bus Éireann Table 7.10 Bus Éireann Fleet, 2007 Number of Buses Expressway/Eurolines 190 Stage Carriage/Commuter 303 City/Town Services Cork City 87 Limerick City 28 Galway City 28 Waterford City 11 Sligo Town 4 Navan Town 3 Athlone Town 4 Dundalk, Drogheda, Balbriggan 5 Other Services 28 Total 691 Source: Bus Éireann
105 105 Transport 2007 Table 7.11 Number of Licensed Bus Operators by County, Number County Carlow Cavan Clare Cork Donegal Dublin Galway Kerry Kildare Kilkenny Laois Leitrim Limerick Longford Louth Mayo Meath Monaghan Offaly Roscommon Sligo Tipperary Waterford Westmeath Wexford Wicklow Total 1,882 1,888 Source - Dept of Transport
106 Transport Table 7.12 Average Daily flow of Luas Passengers by Time of Day and Line, 2007 Hour % of daily flow Green Line % of daily flow Red Line 05:00-05:59 0.1% 0.4% 0.26% 06:00-06:59 1.3% 2.4% 1.84% 07:00-07:59 7.1% 5.7% 6.36% 08:00-08: % 9.4% 11.39% 09:00-09:59 6.4% 6.3% 6.37% Rate Weighted Average 10:00-10:59 3.0% 5.5% 4.26% 11:00-11:59 3.2% 4.5% 3.85% 12:00-12:59 3.3% 5.9% 4.58% 13:00-13:59 4.4% 6.4% 5.42% 14:00-14:59 3.7% 5.8% 4.73% 0.0% 15:00-15:59 4.8% 6.6% 5.69% 16:00-16:59 7.3% 9.8% 8.58% 17:00-17: % 11.8% 12.18% 18:00-18: % 7.7% 8.90% 19:00-19:59 5.8% 3.5% 4.67% 20:00-20:59 4.4% 3.3% 3.83% 21:00-21:59 3.3% 2.4% 2.88% 22:00-22:59 3.0% 1.3% 2.16% 23:00-23:59 2.2% 0.7% 1.42% 00:00-00:59 0.8% 0.4% 0.63% Total 100.0% 100.0% % Source: Railway Procurement Agency
107 107 Transport 2007 Table 7.13 Average Weekly Flow of Luas Passengers by Day of Week and Line, 2007 Number Day of week Average Red Line Average Green Line Average Total Monday 42,277 33,195 75,472 Tuesday 45,644 37,229 82,873 Wednesday 46,650 39,042 85,692 Thursday 49,104 40,136 89,240 Friday 52,295 41,532 93,827 Saturday 32,735 27,661 60,396 Sunday 24,890 15,208 40,098 Total 293, , ,598 Source: Railway Procurement Agency
108 Transport Table 7.14 Luas Passenger Numbers by Month and Line, 2007 Number 2007 Month Red Line Green Line Total January 1,167,512 1,019,177 2,186,689 February 1,161, ,661 2,139,868 March 1,268,855 1,077,477 2,346,332 April 1,205,914 1,006,820 2,212,734 May 1,270,357 1,073,449 2,343,806 June 1,299, ,864 2,297,145 July 1,384, ,382 2,374,015 August 1,397, ,552 2,385,451 September 1,294, ,945 2,289,567 October 1,493,734 1,155,073 2,648,807 November 1,476,211 1,096,109 2,572,320 December 1,404,891 1,243,862 2,648,753 Total 15,825,116 12,620,371 28,445,487 Source: Railway Procurement Agency
109 109 Transport 2007 Table 7.15 Luas Driver Age Profile, 2007 Number and rate Age Female Male Total % Under % % % % % Total % % 3.8% 96.2% 100.0% Source: Railway Procurement Agency Table 7.16 Additional Luas Data, 2007 Red Line Green Line Length of line km 8.91 km Zone Zone Zone Zone Journey Time 48 minutes 22 minutes Number of Trams Length of Tram 40 meters 40 meters Capacity of Tram Passengers Carried ,825,116 12,620,371 Vehicle Kilometres 1,770, ,000 Passenger Kilometres 107,000,000 68,000,000 Average length of journey 6.8km 5.4km Average Number of stops per passenger 8 5 Timeliness (% services to timetable) 99.25% 99.58% Source: Railway Procurement Agency
110 Transport Table 7.17 Summary of Passenger and Freight Traffic by Rail, Thousands Passenger journeys Mainline and other services 10,438 10,406 10,511 11,068 8,917 10,537 Dublin suburban services 24,120 24,302 23,240 9,556 13,862 13,880 DART * * * 16,256 19,689 20,244 International Journeys Total 35,370 35,558 34,550 37,655 43,352 45,511 Passenger kilometres 1,628,000 1,601,000 1,581,698 1,781,000 1,872,067 2,007,065 Freight traffic tonnes 2,246 2,251 2,140 1,820 1, Freight traffic tonnes 426, , , , , ,908 kilometres Source: Iarnród Éireann * Prior to 2005, Passenger data for DART were included in category 'Dublin suburban services' Table 7.18 Principal commodities conveyed by Rail, Thousands of tonnes Ale, beer, stout Beet and beet pulp Cement Fertiliser Mineral ores Petrol and oil Wood and cork General freight Total 2,246 2,251 2,140 1,820 1, Source : Iarnród Éireann
111 111 Transport 2007 Table 7.19 Rail Infrastructure, CIE, Ireland Length of lines, total [line km] 1, , , , , ,834.0 Length of lines, passenger [line km] 1, , , , , ,680.0 Length of lines in single track [line km] 1, , , , , ,196.0 Length of maintrack [main track km] 2, , , , , ,289.0 Length of electrified maintrack [main track km] Number of passenger stations [passenger stations] Source: Iarnród Éireann
112
113 Chapter 8 Maritime Transport
114 Transport Table 8.1 Total Tonnage of Goods handled by Irish Ports, ' Total Goods Handled 45,795 44,919 46,165 47,720 52,146 53,318 54,139 Goods Received 32,634 32,182 33,234 34,703 37,654 38,555 38,907 Goods Forwarded 13,161 12,737 12,931 13,017 14,492 14,763 15,232 Source: CSO Total Tonnage of Goods handled by Irish Ports '000 tonnes 60,000 50,000 40,000 30,000 20,000 Total Goods Handled Goods Received Goods Forwarded 10, Year
115 115 Transport 2007 Table 8.2 Tonnage of Goods handled by Irish Ports classified by Region of Trade, '000 Total Goods Handled Foreign Trade Great Britain & Northern Ireland 17,576 18,803 18,900 19,344 20,499 19,882 20,351 Other E.U. 11,817 11,692 12,476 14,291 15,927 17,343 18,118 Non-E.U. 5,241 4,302 4,632 4,241 4,669 5,188 4,482 Other Ports 8,819 8,566 8,593 8,539 9,182 8,956 9,264 Coastal Trade 2,342 1,556 1,563 1,305 1,870 1,950 1,925 Total 45,795 44,919 46,165 47,720 52,146 53,318 54,139 Goods Received Foreign Trade Great Britain & Northern Ireland 11,287 12,697 13,285 13,537 14,105 13,695 13,432 Other E.U. 7,370 6,965 7,367 8,962 10,136 11,182 12,350 Non-E.U. 4,362 3,540 3,795 3,392 3,861 4,010 3,427 Other Ports 8,424 8,145 8,043 8,067 8,542 8,623 8,772 Coastal Trade 1, ,010 1, Total 32,634 32,182 33,234 34,703 37,654 38,555 38,907 Goods Forwarded Foreign Trade Great Britain & Northern Ireland 6,289 6,106 5,615 5,808 6,394 6,187 6,919 Other E.U. 4,447 4,726 5,109 5,329 5,790 6,160 5,767 Non E.U ,177 1,055 Other Ports Coastal Trade 1, Total 13,161 12,737 12,931 13,017 14,492 14,763 15,232 Source: CSO
116 Table 8.3 Number of Arrivals to Irish Ports and Gross Tonnage of Vessels by Type of Vessel, Year Source: CSO Liquid Bulk Dry Bulk Container Specialised Number Gross Tonnage '000 Number Gross Tonnage '000 Number Gross Tonnage '000 Number Gross Tonnage '000 Number General Passenger Total Gross Tonnage '000 Number Gross Tonnage '000 Number Gross Tonnage ' ,142 10,253 1,957 10,238 1,871 7, ,892 9, , , , ,022 9,784 1,477 9,624 2,570 9, ,927 10, , , , ,892 9,406 1,477 9,531 2,619 10, ,682 10, , , , ,944 9,535 1,322 8,536 2,480 11, ,158 9, , ,423 16, , ,978 10,466 1,333 9,262 2,618 12, ,997 9, , ,254 16, , ,949 11,756 1,265 9,269 2,658 13, ,524 9, , ,508 16, , ,713 12,448 1,212 9,156 2,795 14, ,623 9, , ,361 16, ,326 Transport
117 Table 8.4 Number of Arrivals to Irish Ports and Gross Tonnage of Vessels classified by Type of Vessel, 2007 Type of Vessel Liquid Bulk Dry Bulk Container Number Gross Tonnage '000 Number Gross Tonnage '000 Number Gross Tonnage '000 Number Specialised General Gross Tonnage '000 Number Gross Tonnage '000 Number Passenger Gross Tonnage '000 Number Total Gross Tonnage '000 Total 1,713 12,448 1,212 9,156 2,795 14, ,623 9, , ,361 16, ,326 Arklow Port Bantry Bay 34 1, ,080 Castletownbere Cork 535 5, , , , ,855 2,048 17,227 Drogheda ,235 Dublin 506 3, ,335 1,715 9, ,633 4, , ,272 7, ,984 Dundalk Dun Laoghaire , ,254 Galway Greenore Killybegs Kilrush Kinsale New Ross Rosslare ,010 45, ,010 45,007 Shannon Foynes Port 237 1, , , ,099 Sligo Tralee Fenit Waterford , ,654 Wicklow Youghal Source: CSO 1 Offshore support vessels included as follows: ******Cork 104 vessels (gross tonnage 239,735) 2 Offshore support vessels included as follows: ******Killybegs 78 vessels (gross tonnage 204,774) Transport 2007
118 Transport Table 8.5 Total Tonnage of Goods handled by Irish Ports classified by Port and Region of Trade, 2007 Port '000 Great Britain & Northern Ireland Other E.U. Non-E.U. Other Ports Coastal Trade Total Goods Received 13,432 12,350 3,427 8, ,907 Arklow Port Bantry Bay Castletownbere Cork 1,140 2,597 2, ,704 Drogheda Dublin 8,897 4, ,372 Dundalk Dun Laoghaire Galway Greenore Killybegs Kilrush Kinsale New Ross Rosslare 1, ,405 Shannon Foynes Port 1,043 1, , ,011 Sligo Tralee Fenit Waterford 68 1, ,653 Wicklow Youghal Goods Forwarded 6,919 5,767 1, ,232 Arklow Port Bantry Bay Castletownbere Cork 638 1, ,394 Drogheda Dublin 3,961 2, ,428 Dundalk Dun Laoghaire Galway Greenore Killybegs Kilrush Kinsale New Ross Rosslare 1, ,521 Shannon Foynes Port 482 1, ,060 Sligo Tralee Fenit Waterford Wicklow Youghal Source: CSO
119 119 Transport 2007 Table 8.6 Total Tonnage of Goods handled by Irish Ports classified by Port and Category of Traffic, 2007 '000 Port Category of Traffic Roll-on/Roll-off Lift-on/Lift-off Liquid Bulk Dry Bulk Break Bulk & all Other Goods Total Goods Received 7,369 5,716 11,517 12,367 1,938 38,907 Arklow Port Bantry Bay Castletownbere Cork ,138 1, ,704 Drogheda Dublin 5,814 3,768 4,066 1, ,372 Dundalk Dun Laoghaire Galway Greenore Killybegs Kilrush Kinsale New Ross Rosslare 1, ,405 Shannon Foynes Port ,519 7, ,011 Sligo Tralee Fenit Waterford ,653 Wicklow Youghal Goods Forwarded 5,178 3,160 2,831 3, ,232 Arklow Port Bantry Bay Castletownbere Cork , ,394 Drogheda Dublin 3,628 1, ,428 Dundalk Dun Laoghaire Galway Greenore Killybegs Kilrush Kinsale New Ross Rosslare 1, ,521 Shannon Foynes Port , ,060 Sligo Tralee Fenit Waterford Wicklow Youghal Source: CSO
120 Transport Table 8.7 Number of Cruise Ships and Passengers by Port, 2007 Ports Number of Cruise ships Number of Passengers Bantry Cork Dublin 40 40,996 Galway Killybegs 7 2,567 Shannon Foynes 63 55,000 Waterford 16 5,458 Total ,725 Source: CSO Table 8.8 Number of Cruise Ships by Month of Arrival and Passengers, 2007 Number of cruise ships Number of Passengers January February 0 0 March April 8 13,231 May 15 10,080 June 17 13,710 July 16 11,376 August 31 22,772 September 33 26,002 October 4 2,871 November December Total ,725 Source: CSO
121 121 Transport 2007 Table 8.9 Summary of Roll on / Roll off Traffic 's Route Passengers Cross Channel 3,879 3,918 3,799 3,667 3,374 3,223 3,301 Continental Total passengers 4,160 4,231 4,104 3,964 3,657 3,490 3,586 Cars Cross Channel Continental Total cars Source: IMDO 4,500 Summary of Roll on/roll off Traffic, ,000 3,500 3,000 (thousand) 2,500 2,000 1,500 1,000 Total Cars Total Passengers Year
122
123 Chapter 9 Public Service Vehicle Transport
124 Transport Table 9.1 Number of Public Service Vehicles by Type and Age, 2007 Number Age Hackney Limousine Taxi Wheelchair Accessible Taxi Total Under 3 years of age , ,820 3 to 4 years of age , ,273 5 to 6 years of age 1, , ,531 7 to 8 years of age 1, , ,105 9 to 10 years of age , , years of age and over , ,417 Total 4,868 1,331 17,992 1,504 25,695 % of vehicles 18.95% 5.18% 70.02% 5.85% % Total for ,135 1,146 15,100 1,329 21,700 % change year on year 17.73% 16.14% 19.15% 13.17% 18.41% Source: Taxi Regulator Table 9.2 Number of Public Service Vehicles by Type and County of Licensing, 2007 Number and Rate County Hackney Limousine Taxi Wheelchair Accessible Taxi Total % of national PSV fleet %of population Carlow % 1.19% Cavan % 1.51% Clare % 2.62% Cork , , % 11.35% Donegal % 3.47% Dublin , , % 28.00% Galway , % 5.46% Kerry % 3.30% Kildare , % 4.39% Kilkenny % 2.07% Laois % 1.58% Leitrim % 0.68% Limerick % 4.34% Longford % 0.81% Louth % 2.62% Mayo % 2.92% Meath , % 3.84% Monaghan % 1.32% Offaly % 1.67% Roscommon % 1.39% Sligo % 1.44% Tipperary % 3.52% Waterford % 2.55% Westmeath % 1.87% Wexford % 3.11% Wicklow % 2.98% Total 4,868 1,331 17,992 1,504 25, % % Source: Taxi Regulator
125 125 Transport 2007 Table 9.3 Number of Public Service Vehicles by Type and Main Make, 2007 Number Make Hackney Limousine Taxi Wheelchair Accessible Taxi Total Audi Bentley BMW Chevrolet Chrysler Citroen Daewoo Daimler Fiat Ford , ,031 Honda Hyundai Jaguar Kia Lexus Mazda Mercedes-Benz , ,086 Mitsubishi Nissan , ,957 Opel Peugeot Renault Rolls-Royce Rover Saab Seat Skoda ,647 1,870 Ssangyong Suzuki Toyota 1, , ,786 Vauxhall Volkswagen , ,475 Volvo Other Makes Total 4,868 1,331 17,992 1,504 25,695 Source: Taxi Regulator
126 Transport Table 9.4 Number of Public Service Vehicles by County and Age of Vehicle, 2007 Number County Under 3 years 3 to 4 years 5 to 6 years 7-8 years 9-10 years 11 + years Total Carlow Cavan Clare Cork ,238 Donegal Dublin 2,304 2,155 2,593 2,433 1,786 1,225 12,496 Galway ,190 Kerry Kildare ,186 Kilkenny Laois Leitrim Limerick Longford Louth Mayo Meath ,285 Monaghan Offaly Roscommon Sligo Tipperary Waterford Westmeath Wexford Wicklow Total 4,820 4,273 5,531 5,105 3,549 2,417 25,695 Source: Taxi Regulator
127 127 Transport 2007 Table 9.5 Age Profile of Public Service Vehicle Fleet by Type, 2007 Age Hackney Limousine Taxi Wheelchair Accessible Taxi Number Total < 1 year of age ,504 1 to < 2 years of age , ,522 2 to < 3 years of age , ,794 3 to < 4 years of age , ,005 4 to < 5 years of age , ,268 5 to < 6 years of age , ,722 6 to < 7 years of age , ,809 7 to < 8 years of age , ,760 8 to < 9 years of age , ,345 9 to < 10 years of age , , years of age , ,921 Total 4,868 1,331 17,992 1,504 25,695 Source: Taxi Regulator Number 3,000 Age Profile of Public Service Vehicle Fleet by Type ,500 2,000 1,500 1, Hackney Limousine Taxi WheelchairAccessible Taxi 0 < Age of Fleet in years
128 Transport Table 9.6 Top 10 Public Service Vehicles by Model, 2007 Number and rate Rank Model Number % of total fleet 1 Toyota Avensis 4, % 2 Skoda Octavia 1, % 3 Nissan Primera 1, % 4 Volkswagen Passat 1, % 5 Ford Mondeo 1, % 6 Toyota Carina % 7 Toyota Camry % 8 Toyota Corolla % 9 Nissan Almera % 10 Fiat Scudo % Source: Taxi Regulator Table 9.7 Top 10 Public Service Vehicles (Hackneys) by Model, 2007 Number and rate Rank Model Number % of hackney fleet 1 Toyota Avensis % 2 Volkswagen Passat % 3 Ford Mondeo % 4 Skoda Octavia % 5 Toyota Carina % 6 Nissan Primera % 7 Ford Galaxy % 8 Toyota Corolla % 9 Toyota Hiace % 10 Ford Transit % Source: Taxi Regulator Table 9.8 Top 10 Public Service Vehicles (Taxis) by Model, 2007 Number and rate Rank Model Number % of taxi fleet 1 Toyota Avensis 3, % 2 Nissan Primera 1, % 3 Skoda Octavia 1, % 4 Volkswagen Passat % 5 Toyota Carina % 6 Ford Mondeo % 7 Toyota Camry % 8 Nissan Almera % 9 Toyota Corolla % 10 Ford Focus % Source: Taxi Regulator
129 129 Transport 2007 Table 9.9 Average Annual Distance Travelled by Taxi/Hackney Kilometres Petrol 25,257 26,479 28,049 30,652 34,976 36,313 Diesel 39,316 39,580 40,454 44,971 52,828 56,013 Source: Sustainable Energy Ireland Average Annual Kilometers Average Annual Distance Travelled by Taxi/Hackney ,000 52,828 56,013 50,000 44,971 40,000 39,316 39,580 40,454 30,000 20,000 25,257 26,479 28,049 30,652 34,976 36,313 Petrol Diesel 10, Year
130
131 Chapter 10 Road Traffic Volumes

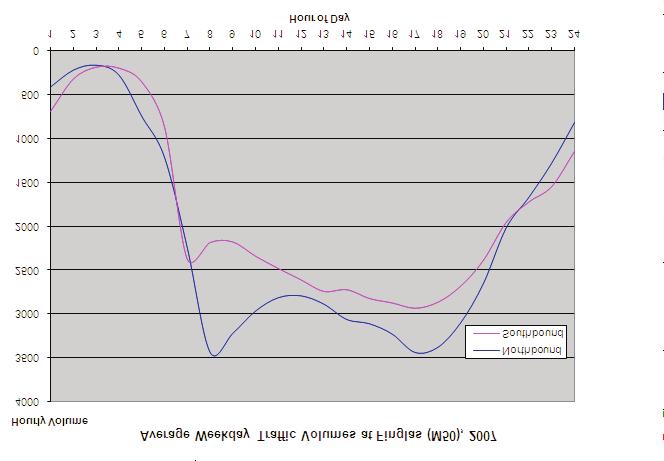
132 Transport

133 133 Transport 2007

134 Transport Hourly Volume 3500 Average Weekday Traffic Volumes at Balbriggan Sth (M01), Northbound Southbound Hour of Day
Provisional Review of Fatal Collisions. January to December 31 st 2017
 Provisional Review of Fatal Collisions January to December 31 st 17 2 nd January 18 Review of 17 fatal collision statistics as of 31st December 17 Overview This report summarises the main trends in road
Published by the Stationery Office, Dublin, Ireland. To be purchased from the: or through any bookseller. Prn 807. Price August 2003.
 Published by the Stationery Office, Dublin, Ireland. To be purchased from the: Central Statistics Office, Information Section, Skehard Road, Cork. Government Publications Sales Office, Sun Alliance House,
The DoneDeal.ie Motor Industry Review
 The DoneDeal.ie Motor Industry Review An analysis of trends in the Irish car sales market for 2018 H1. sponsored by The first half of 2018 has been a tale of two halves. On one side of the coin, used car
The DoneDeal Motor Industry Review
 The DoneDeal Motor Industry Review An analysis of trends in the Irish car sales market for 2018 sponsored by Petrol s High-Octane Year Diesel dips to lowest market share in a decade. 2018 was the year
Fatal Collisions Excessive speed as a factor
 Fatal Collisions 2008-2012 Excessive speed as a factor 28 April 2016 Table of Contents Executive Summary 4 Section 1 Introduction 9 Section 1.1 Background to Report 9 Section 1.2 Number of Fatal Collisions
Number of births in Ireland* and birth rates per 1,000 population in Ireland and neighbouring countries, 1941 to 2011
 Chapter 2 Live Births 2011 The number of births which occurred in 2011 was 74,033 comprising 37,898 males and 36,135 females. The corresponding total for 2010 was 75,174, 38,395 males and 36,779 females.
Use of Big Data for Vehicle Kilometres. Noreen Dorgan CSO Ireland April 2018
 Use of Big Data for Vehicle Kilometres Noreen Dorgan CSO Ireland April 2018 Using Administrative Data to estimate Vehicle kms for the national vehicle fleet Voluntary Data Collection agreed at 2007 EU
Butterfly Recording County Plans
 Butterfly Recording County Plans If you have a particular walk you enjoy, it s easy to access and you want to monitor butterflies along this route for a number of years, then please establish a transect
Using a credit or debit card you can apply for your driving test online at
 APPLICATION FORM PRACTICAL DRIVING TEST FOR OFFICIAL USE ONLY APPLICATION. Using a credit or debit card you can apply for your driving test online at www.drivingtest.ie When you have the application form
DRIVER NUMBER IS COMPULSORY YOUR APPLICATION FORM CANNOT BE PROCESSED WITHOUT THIS
 APPLICATION FORM PRACTICAL DRIVING TEST FOR OFFICIAL USE ONLY APPLICATION. Using a credit or debit card you can apply for your driving test online at www.rsa.ie When you have completed the application
Road Transport and Road Traffic Accident Statistics (Island of Mauritius)
") Road Transport and Road Traffic Accident Statistics (Island of Mauritius) Year 2017 1. Vehicles registered in 2017 At the end of December 2017, there were 531,797 vehicles registered at the National Transport
Road Transport and Road Traffic Accident Statistics (Island of Mauritius) Year 2017 1. Vehicles registered in 2017 At the end of December 2017, there were 531,797 vehicles registered at the National Transport
Pedestrians Road Safety
 Pedestrians Road Safety Overview Over the period 1996-2009, 5,323 people have been killed on Irish road. Out of this 22% (1162) were pedestrians. Additional 3863 pedestrians were seriously injured in the
Road Transport and Road Traffic Accident Statistics (Island of Mauritius)
") Road Transport and Road Traffic Accident Statistics (Island of Mauritius) Year 2014 1. Vehicles registered in 2014 At the end of December 2014, there were 465,052 vehicles registered at the National Transport
Road Transport and Road Traffic Accident Statistics (Island of Mauritius) Year 2014 1. Vehicles registered in 2014 At the end of December 2014, there were 465,052 vehicles registered at the National Transport
Waste Batteries and the Retailer
 Waste Batteries and the Retailer Your role in ensuring the Environmentally Sound Management of Waste Batteries in Ireland Contents Retailer Obligations 2 Local Authority Registration 2 Retailer Take-back
Max Speed Location Offence Date Vehicle Make & Model
 Max Speed Location Offence Date Vehicle Make & Model 102 M40 JUNCTION 16-15 01/04/2014 BMW 1 SERIES 102 M50 E/B JCT 3-2 04/04/2014 MERCEDES VITO VAN 110 A5 W/B 05/04/2014 YAMAHA R1 101 M6 TOLL, T6, 44/7
Business Magazines Cross Platform Profile Circulation Certificate January to December 2014
 Business Magazines Cross Platform Profile Certificate January to December 2014 Setting the standard Fleet News Key information Certificate type Cross Platform % of circulation Audit issue circulation analysis
Preface. Inquiries can be made to Statistics Denmark, Karina Moric, tel.: ,
 KEY FIGURES FOR TRANSPORT 27 Preface Statistics Denmark - in collaboration with the Danish Ministry of Transport hereby issues Key figures for transport 27. Correspondent publications have been published
Pedestrians Road Safety
 Pedestrians Road Safety Overview According to the World Health Organization, the World Bank, the FIA Foundation for the Automobile and Society and the Global Road Safety Partnership collaborative report
A9 Data Monitoring and Analysis Report. March Content. 1. Executive Summary and Key Findings. 2. Overview. 3. Purpose
 A9 Data Monitoring and Analysis Report March 2018 Content 1. Executive Summary and Key Findings 2. Overview 3. Purpose 4. Baseline Data Sources and Methodology 5. Casualty Analysis 6. Vehicle Speed Data
NEW PASSENGER CAR REGISTRATIONS EUROPEAN UNION 1
 PRESS EMBARGO: 8.00 AM (6.00 AM GMT), 14 September 2017 NEW PASSENGER CAR REGISTRATIONS EUROPEAN UNION 1 Passenger car registrations: +4.5% over eight months; +5.6% in August In August 2017, passenger
Motor Industry Review Q2 2018
 Motor Industry Review Q2 2018 05 Executive Summary 07 Economic Background to Motor Industry 17 The Motor Industry H1 2018 03 About the Organisation 29 Statistics 43 Motor Industry Review Highlights 3 ABOUT
Preface. Inquiries can be made to Statistics Denmark, Karina Moric Ingemann, tel.: ,
 KEY FIGURES FOR TRANSPORT 2008 Preface Statistics Denmark - in collaboration with the Danish Ministry of Transport hereby issues Key figures for transport 2008. Correspondent publications have been published
Iarnród Éireann Dublin Integrated Rail Plan Presentation to Institution of Engineers of Ireland. 17 th November
 Iarnród Éireann Dublin Integrated Rail Plan Presentation to Institution of Engineers of Ireland 17 th November 2004 www.irishrail.ie Contents Overview of current suburban rail network Projects underway
NEW PASSENGER CAR REGISTRATIONS EUROPEAN UNION 1
 PRESS EMBARGO: 8.00 AM (6.00 AM GMT), 16 June 2017 NEW PASSENGER CAR REGISTRATIONS EUROPEAN UNION 1 Passenger car registrations: +5.3% five months into 2017; +7.6% in In 2017, passenger car registrations
Post Opening Project Evaluation. M6 Toll
 M6 Toll Five Post Years Opening After Study: Project Summary Evaluation Report Post Opening Project Evaluation M6 Toll Five Years After Study Summary Report October 2009 Document History JOB NUMBER: 5081587/905
NEW PASSENGER CAR REGISTRATIONS EUROPEAN UNION 1
 PRESS EMBARGO: 8.00 AM (6.00 AM GMT), 19 April 2017 NEW PASSENGER CAR REGISTRATIONS EUROPEAN UNION 1 Passenger car registrations: +8.4% first three months of 2017; +11.2% in In 2017, EU passenger car registrations
New Zealand Transport Outlook. VKT/Vehicle Numbers Model. November 2017
 New Zealand Transport Outlook VKT/Vehicle Numbers Model November 2017 Short name VKT/Vehicle Numbers Model Purpose of the model The VKT/Vehicle Numbers Model projects New Zealand s vehicle-kilometres travelled
Road Safety Authority Seatbelt Observation Surveys NOVEMBER Prepared for the Road Safety Authority (RSA) by Nationwide Data Collection (NDC)
 by Nationwide Data Collection (NDC)") Road Safety Authority Seatbelt Observation Surveys NOVEMBER 2017 Prepared for the Road Safety Authority (RSA) by Nationwide Data Collection (NDC) Contents Introduction... 2 Methodology... 2 Adult Seatbelt
Road Safety Authority Seatbelt Observation Surveys NOVEMBER 2017 Prepared for the Road Safety Authority (RSA) by Nationwide Data Collection (NDC) Contents Introduction... 2 Methodology... 2 Adult Seatbelt
New Passenger Car Registrations European Union + EFTA Countries
 PRESS EMBARGO : 8.00am (7.00am GMT), 11 September 2003 New Passenger Car Registrations European Union + EFTA Countries 11 th September 2003 11.000 10.000 9.000 8.000 7.000 6.000 5.000 4.000 3.000 2.000
A9 Data Monitoring and Analysis Report. January Content. 1. Executive Summary. 2. Overview. 3. Purpose. 4. Baseline Data Sources
 A9 Data Monitoring and Analysis Report January 2016 Content 1. Executive Summary 2. Overview 3. Purpose 4. Baseline Data Sources 5. Casualty Analysis 6. Vehicle Speed Data 7. Incident Frequency & Impact
MOTOR VEHICLE STATISTICS OF JAPAN
 2010 MOTOR VEHICLE STATISTICS OF JAPAN 2010 JAPAN AUTOMOBILE MANUFACTURERS ASSOCIATION, INC. Jidosha Kaikan 1-30, Shiba Daimon 1-chome, Minato-ku, Tokyo, 105-0012, Japan Tel: (03) 5405-6120 Telefax: (03)
NEW PASSENGER CAR REGISTRATIONS EUROPEAN UNION 1
 PRESS EMBARGO: 8.00 AM (6.00 AM GMT), 17 October 2017 NEW PASSENGER CAR REGISTRATIONS EUROPEAN UNION 1 Passenger car registrations: +3.7% over nine months; 2.0% in In 2017, passenger car registrations
Project Appraisal Guidelines for National Roads Unit National Parameters Values Sheet
 Project Appraisal Guidelines for National Roads Unit 6.11 - National Parameters Values Sheet TRANSPORT INFRASTRUCTURE IRELAND (TII) PUBLICATIONS About TII Transport Infrastructure Ireland (TII) is responsible
NEW PASSENGER CAR REGISTRATIONS EUROPEAN UNION 1
 PRESS EMBARGO: 8.00 AM (7.00 AM GMT), 14 December 2017 NEW PASSENGER CAR REGISTRATIONS EUROPEAN UNION 1 Passenger car registrations: +4.1% over 11 months; +5.9% in In 2017, registrations of new passenger
NEW PASSENGER CAR REGISTRATIONS EUROPEAN UNION 1
 PRESS EMBARGO: 8.00 AM (7.00 AM GMT), 15 February 2019 NEW PASSENGER CAR REGISTRATIONS EUROPEAN UNION 1 Passenger car registrations: 4.6% in 2019 In 2019, the European passenger car market saw a slow start
The Irish Army
 The Irish Army 1939-45 The Irish Army - Part I 1939 The Army consisted of: 6000 regulars 6000 reservists 16,000 volunteers Outbreak of war on 2 September 1939 The army had a total of 19,783 men: 7494 Regular
TAXIMETER SURVEY May 2016
 TAXIMETER SURVEY 2015 May 2016 TABLE OF CONTENTS Content Introduction, Methodology and Analysis 3-9 Slide Nos. Summary Driver and Distribution Profiles 10-21 Dublin: Detailed Analysis 22-52 Cork: Detailed
Survey of Free Speed Urban and Rural. Údarás Um Shábháilteacht Ar Bhóithre Road Safety Authority
 Survey of Free Speed 2006 Urban and Rural Údarás Um Shábháilteacht Ar Bhóithre Road Safety Authority 2006 Survey of Free Speed (Urban and Rural) Published by The Road Safety Authority Moy Valley Business
NEW PASSENGER CAR REGISTRATIONS EUROPEAN UNION
 PRESS EMBARGO: 8.00 A.M. (6.00 A.M GMT), October 17, 2014 NEW PASSENGER CAR REGISTRATIONS EUROPEAN UNION PASSENGER CAR registrations: +6.1% over nine months; +6.4% in In, the EU* market for new passenger
Key Indicators on the competitiveness of the EU S automotive Industry 1
 MEMO/5/7 Brussels, 13 January 25 Key Indicators on the competitiveness of the EU S automotive Industry 1 Table of contents Part 1: Comparison EU, U.S. and Japan 1. Value added Page 2 2. Employment Page
CARZONE MOTORING REPORT
 CARZONE MOTORING REPORT Examining trends in the Irish Motoring Industry JULY 2018 INTRODUCTION Welcome to the latest edition of the Carzone Motoring Report, an established authority on current trends and
CLASS 1 CLASS 2 COUNTY FIRST NAME SURNAME TRACTOR PLOUGH Intermediate Conventional Plough Class Meath David Borland Ford Kverneland Intermediate
 Intermediate Conventional Plough Class Meath David Borland Ford Kverneland Intermediate Conventional Plough Class Galway Eamonn Burke International Kverneland Intermediate Conventional Plough Class Cork
NEW PASSENGER CAR REGISTRATIONS EUROPEAN UNION 1
 PRESS EMBARGO: 8.00 AM (6.00 AM GMT), 16 May 2017 NEW PASSENGER CAR REGISTRATIONS EUROPEAN UNION 1 Passenger car registrations: +4.7% four months into 2017; 6.6% in In 2017, the number of passenger cars
Automotive industry in Colombia
 Automotive industry in Colombia Table of Contents Automotive industry in Colombia TABLE OF CONTENTS Overview 07 Changes in worldwide vehicle production by region 2013-2017 08 South America: number of new
NEW PASSENGER CAR REGISTRATIONS EUROPEAN UNION *
 PRESS EMBARGO: 8.00 AM (7.00 AM GMT), 17 November 2015 NEW PASSENGER CAR REGISTRATIONS EUROPEAN UNION * Passenger car registrations: +8.2% over ten months; +2.9% in In 2015, the EU passenger car market
Assessing the Condition of the Irish Regional Road Network 2011/2012
 Assessing the Condition of the Irish Regional Road Network 2011/2012 AUTHORS: Dr. Kieran Feighan, BE, MSCE, Ph.D, CEng, MIEI, Managing Director, PMS Pavement Management Services Ltd. Brian Mulry, BE, MEngSc,
A9 Data Monitoring and Analysis Report. January Content. 1. Executive Summary. 2. Overview. 3. Purpose. 4. Baseline Data Sources
 A9 Data Monitoring and Analysis Report January 2018 Content 1. Executive Summary 2. Overview 3. Purpose 4. Baseline Data Sources 5. Casualty Analysis 6. Vehicle Speed Data 7. Incident Frequency & Impact
MotorFacts. statistics relating to the Australian retail motor trades. Motor Trades Association of Australia
 MotorFacts statistics relating to the Australian retail motor trades Motor Trades Association of Australia Welcome to MotorFacts 2008 MotorFacts is a collection of statistics about, and of relevance to,
ACEA Report. Vehicles in use Europe 2018
 ACEA Report Vehicles in use Europe 2018 TABLE OF CONTENTS Summary... 2 Vehicles in use in Europe... 3 Passenger cars... 3 Light commercial vehicles... 4 Medium and heavy commercial vehicles... 5 Buses...
New Passenger Car Registrations European Union
 PRESS EMBARGO : 8.00am (7.00am GMT), November 19, 2013 New Passenger Car Registrations European Union November 19, 2013 Units 1,700,000 1,500,000 New Passenger Car Registrations in the EU Last 12 months
NEW PASSENGER CAR REGISTRATIONS EUROPEAN UNION 1
 PRESS EMBARGO: 8.00 AM (6.00 AM GMT), 19 September 2018 NEW PASSENGER CAR REGISTRATIONS EUROPEAN UNION 1 Passenger car registrations: +6.1% eight months into 2018; +10.5% in July and +31.2% in August In
Honda Remains the Most Satisfying Brand to Own in France
 and L Automobile Magazine Report: Toyota, BMW, Honda and Peugeot Capture Top Model Awards in France Vehicle Customer Satisfaction Study Honda Remains the Most Satisfying Brand to Own in France PARIS: 22
Where are the Increases in Motorcycle Rider Fatalities?
 Where are the Increases in Motorcycle Rider Fatalities? Umesh Shankar Mathematical Analysis Division (NPO-121) Office of Traffic Records and Analysis National Center for Statistics and Analysis National
Alpen/Alpi/Alps 2018 E (EX) for TravelPilot + Major Roads of Europe
 for TravelPilot + Major Roads of Europe") 1) Road network coverage CD-ROM 1 CD-ROM 2 ~100 % detailed street network Major Roads of Europe Major Roads of Europe 2) Sales arguments CD-ROM 1 provides updated navigation data for the Alps region road
1) Road network coverage CD-ROM 1 CD-ROM 2 ~100 % detailed street network Major Roads of Europe Major Roads of Europe 2) Sales arguments CD-ROM 1 provides updated navigation data for the Alps region road
AutoBild Quality Report 2011
 Hyundai is Number One in AutoBild Quality Report 2011 for TWO CONSECUTIVE YEARS by AutoBild, Germany Hyundai repeats the triumph of previous year. The victory from 2010 was not a one-hit-wonder. Hyundai
NEW PASSENGER CAR REGISTRATIONS EUROPEAN UNION 1
 PRESS EMBARGO: 8.00 AM (7.00 AM GMT), 17 January 2018 NEW PASSENGER CAR REGISTRATIONS EUROPEAN UNION 1 Passenger car registrations: +3.4% in 2017; 4.9% in In 2017, new passenger car registrations in the
Urban Transport systems in major cities in China. Sun Kechao Senior Engineer China Academy of Transportation Sciences, Beijing, China
 Urban Transport systems in major cities in China Sun Kechao Senior Engineer China Academy of Transportation Sciences, Beijing, China Part 1 Part 2 Part 3 Part 4 Introduction Urban transport policies Urban
New Passenger Car Registrations European Union
 PRESS EMBARGO : 8.00am (7.00am GMT), March 16, 2010 New Passenger Car Registrations European Union March 16, 2010 1,700,000 Units New Passenger Car Registrations in the EU Last 12 months +26.9 Percentage
NEW PASSENGER CAR REGISTRATIONS EUROPEAN UNION 1
 PRESS EMBARGO: 8.00 A.M. (7.00 A.M GMT), November 18, 2014 NEW PASSENGER CAR REGISTRATIONS EUROPEAN UNION 1 PASSENGER CAR registrations: +6.1% over ten months; +6.5% in In, in the EU 1 passenger car registrations
NEW PASSENGER CAR REGISTRATIONS EUROPEAN UNION *
 PRESS EMBARGO: 8.00 AM (6.00 AM GMT), 16 April 2015 NEW PASSENGER CAR REGISTRATIONS EUROPEAN UNION * PASSENGER CAR registrations: +8.6% in first quarter; +10.6% in In 2015, demand for new passenger cars
Implementation of Directive (EU) 2015/719 concerning vehicle weights and dimensions in Ireland
 2015/719 concerning vehicle weights and dimensions in Ireland") Implementation of Directive (EU) 2015/719 concerning vehicle weights and dimensions in Ireland July 2017 Contents 1.0 Introduction... 3 2.0 Changes to Weight & Dimensional Limits... 4 2.1 Increase to the
Implementation of Directive (EU) 2015/719 concerning vehicle weights and dimensions in Ireland July 2017 Contents 1.0 Introduction... 3 2.0 Changes to Weight & Dimensional Limits... 4 2.1 Increase to the
TRAVEL DEMAND FORECASTS
 Jiangxi Ji an Sustainable Urban Transport Project (RRP PRC 45022) TRAVEL DEMAND FORECASTS A. Introduction 1. The purpose of the travel demand forecasts is to assess the impact of the project components
TRANSIT FEASIBILITY STUDY Town of Bradford West Gwillimbury
 TRANSIT FEASIBILITY STUDY Town of Bradford West Gwillimbury Open House Presentation January 19, 2012 Study Objectives Quantify the need for transit service in BWG Determine transit service priorities based
Toyota captures three top model awards, while Honda earns two model awards and BMW captures one.
 and auto motor und sport/autostrassenverkehr Report: For the First Time, Honda is the Most Satisfying Brand to Own in Germany Toyota s Green Prius Leads Customer Satisfaction Rankings FRANKFURT: 10 July
Italia 2018 E (EX) for TravelPilot + Major Roads of Europe
 for TravelPilot + Major Roads of Europe") 1) Road coverage CD-ROM 1 CD-ROM 2 ~100 % detailed street Major Roads of Europe 1) Sales arguments CD-ROM 1 provides updated navigation data with a superior coverage of ~100 % of all roads in Italy including
1) Road coverage CD-ROM 1 CD-ROM 2 ~100 % detailed street Major Roads of Europe 1) Sales arguments CD-ROM 1 provides updated navigation data with a superior coverage of ~100 % of all roads in Italy including
New Passenger Car Registrations European Union
 PRESS EMBARGO : 8.00am (7.00am GMT), December 14, 2012 New Passenger Car Registrations European Union December 14, 2012 Units 1,700,000 New Passenger Car Registrations in the EU Last 12 months 7.0% 1,500,000
Sustainable Urban Transport Index (SUTI)
") Sustainable Urban Transport Index (SUTI) City Comparisons & Way Forward PROF. H.M SHIVANAND SWAMY, CEPT UNIVERSITY DHAKA SEPTEMBER 12, 2018 Purpose Discussion of Results from 5 Cities Reflections on the
Sustainable Urban Transport Index (SUTI) City Comparisons & Way Forward PROF. H.M SHIVANAND SWAMY, CEPT UNIVERSITY DHAKA SEPTEMBER 12, 2018 Purpose Discussion of Results from 5 Cities Reflections on the
Changing your vehicle
 Information Guide G6 This Information Guide deals with the regulations and procedures involved in changing the vehicle associated with an SPSV licence. Changes of vehicle are permitted, provided the replacement
BOTSWANA TRANSPORT & INFRASTRUCTURE STATISTICS. No. 2013/23 QUARTER 3, 2013 STATS BRIEF STATISTICS BOTSWANA. Copyrights C Statistics Botswana 2014
 BOTSWANA TRANSPORT & INFRASTRUCTURE STATISTICS No. 2013/23 QUARTER 3, 2013 STATS BRIEF STATISTICS BOTSWANA Copyrights C Statistics Botswana 2014 February 2014 Statistics Botswana. Private Bag 0024 Botswana
United Kingdom, Ireland 2018 E (EX) for TravelPilot + Major Roads of Europe
 for TravelPilot + Major Roads of Europe") 1) Road coverage CD-ROM 1 CD-ROM 2 ~100 % detailed street Major Roads of Europe 1) Sales arguments CD-ROM 1 provides updated navigation data with a superior coverage of ~100 % of all roads in Ireland and
1) Road coverage CD-ROM 1 CD-ROM 2 ~100 % detailed street Major Roads of Europe 1) Sales arguments CD-ROM 1 provides updated navigation data with a superior coverage of ~100 % of all roads in Ireland and
NEW PASSENGER CAR REGISTRATIONS EUROPEAN UNION 1
 PRESS EMBARGO: 8.00 AM (7.00 AM GMT), 16 January 2019 NEW PASSENGER CAR REGISTRATIONS EUROPEAN UNION 1 Passenger car registrations: +0.1% in 2018; 8.4% in In 2018, the EU passenger car market declined
M6 TOLL TRAFFIC MONITORING STUDY
 ` M6 TOLL TRAFFIC MONITORING STUDY Traffic Impact Study Report POST OPENING PROJECT EVALUATION M6 TOLL TRAFFIC IMPACT STUDY REPORT JOB NUMBER: 4416515.1525.600 DOCUMENT REF: M6 Toll Traffic Impact Study
Analysis of Road Crash Statistics Western Australia 1990 to Report. December Project: Transport/21
 Analysis of Road Crash Statistics Western Australia 1990 to 1999 Report December 2000 Project: Transport/21 Analysis of Road Crash Statistics Western Australia 1990 to 1999 December 2000 Client: Transport
Department of Transport An Roinn Iompair. Sectoral Plan under the Disability Act 2005 TRANSPORT ACCESS FOR ALL
 Department of Transport An Roinn Iompair Sectoral Plan under the Disability Act 2005 TRANSPORT ACCESS FOR ALL Progress Report for the period January to June 2009 Part 3 smartertravel >>> National Disability
Number 10 of 2012 MOTOR VEHICLE (DUTIES AND LICENCES) ACT 2012 ARRANGEMENT OF SECTIONS. 3. Amendment of Part I of Schedule to Act of 1952.
 ACT 2012 ARRANGEMENT OF SECTIONS. 3. Amendment of Part I of Schedule to Act of 1952.") Number 10 of 2012 MOTOR VEHICLE (DUTIES AND LICENCES) ACT 2012 Section 1. Definitions. ARRANGEMENT OF SECTIONS 2. Application of sections 3 to 5. 3. Amendment of Part I of Schedule to Act of 1952. 4. Amendment
Number 10 of 2012 MOTOR VEHICLE (DUTIES AND LICENCES) ACT 2012 Section 1. Definitions. ARRANGEMENT OF SECTIONS 2. Application of sections 3 to 5. 3. Amendment of Part I of Schedule to Act of 1952. 4. Amendment
PROVISIONAL NEW PASSENGER CAR REGISTRATIONS BY MARKET
 Association des Constructeurs Européens d'automobiles Av. des Nerviens 85 B-14 Bruxelles Tel (32 2) 732 55 5 Fax (32 2) 738 73 1 NEW PASSENGER CAR REGISTRATIONS BY MARKET (32 2) 738 73 11 15/9/9 August
1) Road network coverage
 Road network coverage") 1) Road coverage CD-ROM 1 CD-ROM 2 ~100 % detailed street Major Roads of Europe 1) Sales arguments CD-ROM 1 provides updated navigation data for the East Europe road with a superior coverage of ~100 %
1) Road coverage CD-ROM 1 CD-ROM 2 ~100 % detailed street Major Roads of Europe 1) Sales arguments CD-ROM 1 provides updated navigation data for the East Europe road with a superior coverage of ~100 %
New Passenger Car Registrations European Union
 PRESS EMBARGO : 8.00am (7.00am GMT), January 16, 2013 New Passenger Car Registrations European Union January 16, 2013 Units 1,700,000 1,500,000 New Passenger Car Registrations in the EU Last 12 months
2018(181) Bmw 2 Series. 2017(171) Ford Ecosport. 2014(141) Ford Focus. 2015(151) Ford Focus. 2015(151) Ford Focus. 2016(162) Ford Kuga
 Bmw 2 Series. 2017(171) Ford Ecosport. 2014(141) Ford Focus. 2015(151) Ford Focus. 2015(151) Ford Focus. 2016(162) Ford Kuga") Kevin Egan Cars, Carraroe, Sligo P: 071 915 44 42 F: 071 91 54 443 www.kevinegancars.ie 2015(152) Audi A6 Price: 26450 2017(172) Bmw 5 Series Price: 40950 2014(141) Fiat Scudo Price: 10250 Price: 14450
Kevin Egan Cars, Carraroe, Sligo P: 071 915 44 42 F: 071 91 54 443 www.kevinegancars.ie 2015(152) Audi A6 Price: 26450 2017(172) Bmw 5 Series Price: 40950 2014(141) Fiat Scudo Price: 10250 Price: 14450
Skandinavien/Norden 2018 E (EX) for TravelPilot + Major Roads of Europe
 for TravelPilot + Major Roads of Europe") 1) Road network coverage CD-ROM 1 CD-ROM 2 ~100 % detailed street network Major Roads of Europe 2) Sales arguments CD-ROM 1 provides updated navigation data with a superior coverage of ~100 % of all roads
1) Road network coverage CD-ROM 1 CD-ROM 2 ~100 % detailed street network Major Roads of Europe 2) Sales arguments CD-ROM 1 provides updated navigation data with a superior coverage of ~100 % of all roads
2015 LRT PASSENGER COUNT. CAPITAL and METRO LINES
 2015 LRT PASSENGER COUNT CAPITAL and METRO LINES Project Team: ETS Transit Data Management Transportation Planning Strategic Monitoring and Analysis April, 2016 2015 LRT PASSENGER COUNT Edmonton Transit
BeNeLux 2018 E (EX) for TravelPilot + Major Roads of Europe
 for TravelPilot + Major Roads of Europe") 1) Road network coverage CD-ROM 1 CD-ROM 2 ~100 % detailed street network Major Roads of Europe 2) Sales arguments CD-ROM 1 provides updated navigation data with a superior coverage of ~100 % of all roads
1) Road network coverage CD-ROM 1 CD-ROM 2 ~100 % detailed street network Major Roads of Europe 2) Sales arguments CD-ROM 1 provides updated navigation data with a superior coverage of ~100 % of all roads
New Passenger Car Registrations European Union
 PRESS EMBARGO : 8.00am (7.00am GMT), April 17, 2013 New Passenger Car Registrations European Union April 17, 2013 Units 1,700,000 1,500,000 7.0% New Passenger Car Registrations in the EU Last 12 months
Hellas, East Adria + Important roads of Europe 2012 FX (GR, HR, SLO)
") 1 Road coverage CD-ROM 1 CD-ROM 2 ~100 % detailed street Important road of Europe Important road 2 Sales arguments CD-ROM 1 provides updated navigation data for the East Adria region road with a superior
1 Road coverage CD-ROM 1 CD-ROM 2 ~100 % detailed street Important road of Europe Important road 2 Sales arguments CD-ROM 1 provides updated navigation data for the East Adria region road with a superior
NEW PASSENGER CAR REGISTRATIONS EUROPEAN UNION 1
 PRESS EMBARGO: 8.00 AM (6.00 AM GMT), 17 July 2018 NEW PASSENGER CAR REGISTRATIONS EUROPEAN UNION 1 Passenger car registrations: +2.9% during first half of 2018; +5.2% in In 2018, passenger car registrations
Winners & Losers by Market - June 2017 vs June 2016
 Countries June 17/16 % Chg ROMANIA +47,0 1 CYPRUS +46,0 2 LITHUANIA +40,6 ESTONIA +33,7 BULGARIA +31,4 SLOVENIA +16,4 SLOVAKIA +14,5 GREECE +14,4 ITALY +12,9 HUNGARY +11,6 ICELAND +10,2 CROATIA +8,8 POLAND
France 2018 E (EX) for TravelPilot + Major Roads of Europe
 for TravelPilot + Major Roads of Europe") 1) Road coverage CD-ROM 1 CD-ROM 2 ~100 % detailed street Major Roads of Europe 1) Sales arguments CD-ROM 1 provides updated navigation data with a superior coverage of ~100 % of all roads in France and
1) Road coverage CD-ROM 1 CD-ROM 2 ~100 % detailed street Major Roads of Europe 1) Sales arguments CD-ROM 1 provides updated navigation data with a superior coverage of ~100 % of all roads in France and
TRAFFIC SURVEY REPORT HARVINGTON PT1 (CREST HILL)
") TRAFFIC SURVEY REPORT HARVINGTON PT1 ( HILL) October 20-24th 2014 Conducted voluntarily by the residents of Harvington Village. This report has been prepared in light of the planning application W14/01788/OU
TRAFFIC SURVEY REPORT HARVINGTON PT1 ( HILL) October 20-24th 2014 Conducted voluntarily by the residents of Harvington Village. This report has been prepared in light of the planning application W14/01788/OU
Mysuru PBS Presentation on Prepared by: Directorate of Urban Land Transport
 Mysuru PBS Presentation on 04.11.2017 Prepared by: Directorate of Urban Land Transport Introduction to Mysuru Public Bicycle Sharing System Mysuru Public Bicycle Sharing System Bicycle based transportation
transportation in Norway
 Norwegian Embassy Towards zero emission transportation in Norway Washington, DC. Karine Hertzberg, January 14, 2019 Photo - Guri Dahl/ Tinyagent Norway aims to become a low emission society 2020: Reduce
Toll Bye-Laws for the
 Toll Bye-Laws for the M1 Motorway (Gormanston to Monasterboice) made under the Roads Act, 1993 as amended NATIONAL ROADS AUTHORITY, St. Martin s House, Waterloo Road, Dublin 4, Ireland. May 2003 PART I
San Diego Auto Outlook
 Covering First Quarter 2014 Volume 14, Number 2 Comprehensive information on the San Diego County new vehicle market FORECAST County New Vehicle Market Up 6.7% in First Quarter of 2014 Registrations predicted
Energy in Transport Report
 Energy in Transport 2014 Report 1 Energy in Transport 2014 Report Report prepared by Dr Denis Dineen, Martin Howley and Mary Holland Energy Policy Statistical Support Unit October 2014 2 ENERGY POLICY
New Passenger Car Registrations European Union
 PRESS EMBARGO : 8.00am (6.00am GMT), September 17, 2013 New Passenger Car Registrations European Union September 17, 2013 Units 1,700,000 1,500,000 New Passenger Car Registrations in the EU Last 12 months
Edmonton Region Commodity Flow Study
 A Joint Alberta Transportation, City of Edmonton and Economic Development Edmonton Venture Supported by: Alberta Motor Transport Association (AMTA) Alberta Capital Region Alliance (ACRA) Page 1 27,748
Honda tops annual car reliability survey Eight out of top 10 reliable brands are Japanese Expensive premium cars break down more often
 Honda tops annual car reliability survey Eight out of top 10 reliable brands are Japanese Expensive premium cars break down more often What Car? and Warranty Direct research reveals that Honda is the most
Alberta Speeding Convictions and Collisions Involving Unsafe Speed
 Alberta Speeding Convictions and Collisions Involving Unsafe Speed 2004-2008 Overview This document was prepared under the Alberta Traffic Safety Plan, Strategic Research Plan for 2008-2010, with the objective
Innovation in London. Policy approaches to mobility management and sustainable travel. Transport for London
 Innovation in London Policy approaches to mobility management and sustainable travel Transport for London Introduction Nick Aldworth General Manager Barclays Cycle Hire Previously (2005 present): Project
New Passenger Car Registrations European Union
 PRESS EMBARGO : 8.00am (7.00am GMT), December 16, 2011 New Passenger Car Registrations European Union December 16, 2011 Units 1,700,000 New Passenger Car Registrations in the EU Last 12 months Percentage
New Passenger Car Registrations European Union
 PRESS EMBARGO : 8.00am (6.00am GMT), April 17, 2014 New Passenger Car Registrations European Union April 17, 2014 Units 1,700,000 New Passenger Car Registrations in the EU Last 12 months 1,500,000 10.2%