Review of VOC and NOx Emissions Inventory Trends
|
|
|
- Reynard Doyle
- 5 years ago
- Views:
Transcription
1 Review of VOC and NOx Emissions Inventory Trends Patrick Davis Mid-Atlantic Regional Air Management Association MARAMA WOE Workshop Cape May, NJ February 7, 2007
2 Main topics 1. Data sources 2. What source types are the largest contributors of NOx and VOC (point/area/mobile/nonroad) 3. What are the key source categories? 4. What is the geographic distribution of key source categories? 5. What are the trends over time? 6. How much of the inventory is subject to state control? 7. What are the Implications for Weight of Evidence?
3 Data sources MANE-VU Emissions Inventory Version 3 Developed by E.H. Pechan for: Point Area Onroad Nonroad Biogenic Summaries
4 Data Sources Future OTB/OTW 2009/12/18 MANE-VU Emissions Inventories Version 3.1 On the Books/On the Way (OTB/W) Developed by MACTEC for: Non-EGU Point Area Nonroad NESCAUM ran SMOKE for Mobile sources NYDEC summarized by county EGU emissions from VISTAS IPM model
5 Overview Future OTB/OTW OTB/W Emissions Inventories used the following growth factors: State supplied population, employment, and other emission projection data or (if no state supplied data) DOE s Annual Energy Outlook 2005 (AEO2005) or (if above not available) U.S. EPA s Economic Growth and Analysis System Version 5.0 (EGAS 5.0)
6 Data Sources Future Year BOTW 2009/12/18 MANE-VU Beyond on the Way (BOTW) Version Based on OTC Control Measures Matrix Emissions were developed by MACTEC for: Non-EGU Point Area Mobile and Non-road unchanged from OTB CAIR+ Estimate from IPM developed separately (not in BOTW inventory)
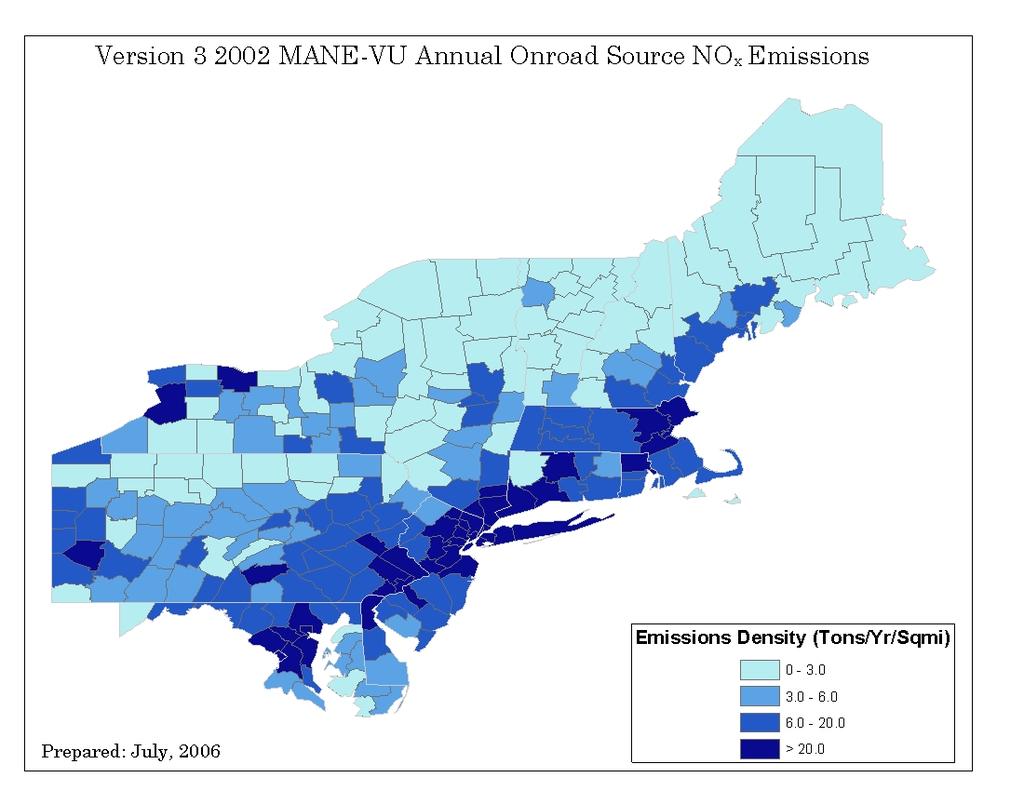
7 What source types are the largest contributors of NOx and VOC? NOx: Onroad & Point VOC: Biogenic, Area, Onroad
8 6,000, Version 3 MANE-VU Annual Source Comparison 5,000,000 4,000,000 Tons/Yr 3,000,000 BIOGENIC NONROAD ONROAD AREA POINT 2,000,000 1,000,000 0 NH3 NOx PM10-PRI PM2.5-PRI SO2 VOC
9 6,000, Version 3 MANE-VU Annual Source Comparison 5,000,000 4,000,000 Tons/Yr 3,000,000 BIOGENIC NONROAD ONROAD AREA POINT 2,000,000 1,000,000 0 NH3 NOx PM10-PRI PM2.5-PRI SO2 VOC
10 Version MANE-VU Annual Biogenic Source Emissions by State VOC West Virginia Delaware District of Columbia Maine Maryland Massachusetts New Hampshire New Jersey New York Pennsylvania Rhode Island Vermont North Carolina Virginia Connecticut million t/y
11 What are the key source categories of NOx (point & mobile) VOC (area)?
12 MANE-VU 2002 Version 3 Annual Emissions Inventory Top VOC Source Categories Highway Vehicles-Diesel (1%) Petroleum and Solvent Evaporation-Surface Coating Operations (1%) Off-highway Vehicle Diesel (1%) Auto Refinishing (1%) Petroleum and Petroleum Product Storage & Transport-Other (1%) Gas Marketing Stage I (1%) Graphic Arts (1%) Solvent Utilization-Miscellaneous Industrial (1%) Solvent Utilization-Miscellaneous Non-industrial: Commercial (1%) Gas Marketing Stage II (2%) Degreasing (2%) Portable Containers: Residential & Commercial (3%) Architectural Coatings (3%) Solvent Utilization-Miscellaneous Non-industrial: Consumer (4%) Solvent Utilization-Miscellaneous Non-industrial: Consumer and Commercial (4%) Off-highway Vehicle Gasoline, 4-Stroke (5%) Industrial Surface Coating (5%) Off-highway Vehicle Gasoline, 2-Stroke (6%) Pleasure Craft (7%) Stationary Source Fuel Combustion-Residential (19%) Highway Vehicles-Gasoline (26%) On-Road Non-Road Point Area 0 100, , , , , , , , ,000 Tons/Year
13 MANE-VU 2002 Version 3 Annual Emissions Inventory Top VOC Source Categories Highway Vehicles-Diesel (1%) Petroleum and Solvent Evaporation-Surface Coating Operations (1%) Off-highway Vehicle Diesel (1%) Auto Refinishing (1%) Petroleum and Petroleum Product Storage & Transport-Other (1%) Gas Marketing Stage I (1%) Graphic Arts (1%) Solvent Utilization-Miscellaneous Industrial (1%) Solvent Utilization-Miscellaneous Non-industrial: Commercial (1%) Gas Marketing Stage II (2%) Degreasing (2%) Portable Containers: Residential & Commercial (3%) Architectural Coatings (3%) Solvent Utilization-Miscellaneous Non-industrial: Consumer (4%) Solvent Utilization-Miscellaneous Non-industrial: Consumer and Commercial (4%) Off-highway Vehicle Gasoline, 4-Stroke (5%) Industrial Surface Coating (5%) Off-highway Vehicle Gasoline, 2-Stroke (6%) Pleasure Craft (7%) Stationary Source Fuel Combustion-Residential (19%) Highway Vehicles-Gasoline (26%) On-Road Non-Road Point Area 0 100, , , , , , , , ,000 Tons/Year
14 MANE-VU 2002 Version 3 Annual Emissions Inventory Top NOx Source Categories Stationary Source Fuel Combustion-Industrial (2%) LPG (2%) Marine Vessels, Commercial (2%) External Combustion Boilers-Industrial (2%) Industrial Processes-Mineral Products (2%) Railroad Equipment (2%) Stationary Source Fuel Combustion-Commercial/Institutional (3%) On-Road Non-Road Point Area Stationary Source Fuel Combustion-Residential (4%) Off-highway Vehicle Diesel (7%) External Combustion Boilers-Electric Generation (16%) Highway Vehicles-Diesel (19%) Highway Vehicles-Gasoline (30%) 0 100, , , , , , , , ,000 Tons/Year
15 MANE-VU 2002 Version 3 Annual Emissions Inventory Top NOx Source Categories Stationary Source Fuel Combustion-Industrial (2%) LPG (2%) Marine Vessels, Commercial (2%) External Combustion Boilers-Industrial (2%) Industrial Processes-Mineral Products (2%) Railroad Equipment (2%) Stationary Source Fuel Combustion-Commercial/Institutional (3%) On-Road Non-Road Point Area Stationary Source Fuel Combustion-Residential (4%) Off-highway Vehicle Diesel (7%) External Combustion Boilers-Electric Generation (16%) Highway Vehicles-Diesel (19%) Highway Vehicles-Gasoline (30%) 0 100, , , , , , , , ,000 Tons/Year
16 What is the geographic distribution of key source categories?

17
18
19
20
21 Emissions Inventory Trends Overall Key categories (Note: these charts are annual)
22 VOC Regional Trends and Source Analysis
23 3,500,000 3,000,000 2,500,000 Annual VOC Emissions Projections for the MANE-VU Region with OTC Measures Draft 01/19/07 EGU Point Non-EGU Point Area Nonroad Onroad Emissions (tpy) 2,000,000 1,500,000 1,000, , OTB/W 2009 OTC 2012 OTB/W 2012 OTC
24 600,000 Area Source Annual VOC Emissions Projections with OTC Measures Draft 9/29/06 Emissions (tpy) 500, , , , OTB/W 2009 OTC 2012 OTB/W 2012 OTC 2018 OTB/W 2018 OTC 100,000 0 CT DE DC ME MD MA NH NJ NY PA RI VT
25 MANE-VU 2002 Version 3 Annual Emissions Inventory Top VOC Source Categories Highway Vehicles-Diesel (1%) Petroleum and Solvent Evaporation-Surface Coating Operations (1%) Off-highway Vehicle Diesel (1%) Auto Refinishing (1%) Petroleum and Petroleum Product Storage & Transport-Other (1%) Gas Marketing Stage I (1%) Graphic Arts (1%) Solvent Utilization-Miscellaneous Industrial (1%) Solvent Utilization-Miscellaneous Non-industrial: Commercial (1%) Gas Marketing Stage II (2%) Degreasing (2%) Portable Containers: Residential & Commercial (3%) Architectural Coatings (3%) Solvent Utilization-Miscellaneous Non-industrial: Consumer (4%) Solvent Utilization-Miscellaneous Non-industrial: Consumer and Commercial (4%) Off-highway Vehicle Gasoline, 4-Stroke (5%) Industrial Surface Coating (5%) Off-highway Vehicle Gasoline, 2-Stroke (6%) Pleasure Craft (7%) Stationary Source Fuel Combustion-Residential (19%) Highway Vehicles-Gasoline (26%) On-Road Non-Road Point Area 0 100, , , , , , , , ,000 Tons/Year
26 350,000 Onroad Source Annual VOC Emissions Projections Draft 01/19/07 300, , Emissions (tpy) 200, , ,000 50,000 0 CT DE DC ME MD MA NH NJ NY PA RI VT
27 70,000 Top VOC Source Categories MANE-VU Emissions Inventory Trends Pleasure Craft 60,000 VOC Emissions (Tons/Yr) 50,000 40,000 30,000 20, ,000 0 CT DE DC ME MD MA NH NJ NY PA RI VT
28 60,000 Top VOC Source Categories MANE-VU Emissions Inventory Trends Off-Highway Vehicle Gasoline, 2-Stroke 50,000 VOC Emissions (Tons/Yr) 40,000 30,000 20, ,000 0 CT DE DC ME MD MA NH NJ NY PA RI VT
29 60,000 Top VOC Source Categories MANE-VU Emissions Inventory Trends Industrial Surface Coating VOC Emissions (Tons/Yr) 50,000 40,000 30,000 20, ,000 0 CT DE DC ME MD MA NH NJ NY PA RI VT
30 250,000 Top VOC Source Categories MANE-VU Emissions Inventory Trends Stationary Source Fuel Combustion - Residential VOC Emissions (Tons/Yr) 200, , , ,000 0 CT DE DC ME MD MA NH NJ NY PA RI VT
31 NOx Regional Trends and Source Analysis
32 3,000,000 2,500,000 Annual NOx Emissions Projections for the MANE-VU Region with OTC Measures Draft 01/19/07 EGU Point Non-EGU Point Area Nonroad Onroad 2,000,000 Emissions (tpy) 1,500,000 1,000, , OTB/W 2009 OTC 2012 OTB/W 2012 OTC
33 MANE-VU 2002 Version 3 Annual Emissions Inventory Top NOx Source Categories Stationary Source Fuel Combustion-Industrial (2%) LPG (2%) Marine Vessels, Commercial (2%) External Combustion Boilers-Industrial (2%) Industrial Processes-Mineral Products (2%) Railroad Equipment (2%) Stationary Source Fuel Combustion-Commercial/Institutional (3%) On-Road Non-Road Point Area Stationary Source Fuel Combustion-Residential (4%) Off-highway Vehicle Diesel (7%) External Combustion Boilers-Electric Generation (16%) Highway Vehicles-Diesel (19%) Highway Vehicles-Gasoline (30%) 0 100, , , , , , , , ,000 Tons/Year
34 400,000 Onroad Source Annual NOx Emissions Projections Draft 01/19/07 350, , Emissions (tpy) 250, , , ,000 50,000 0 CT DE DC ME MD MA NH NJ NY PA RI VT
35 MANE-VU State by State VMT Comparison 5.00E E E E+08 VMT (miles/day) 3.00E E E VMT 2009 VMT 2012 VMT 1.50E E E E+00 CT DE DC ME MD MA NH NJ NY PA RI VT
36 VISTAS PC_1f IPM Run Annual NOx Emissions Vermont Rhode Island Pennsylvania New York Maryland Massachusetts New Hampshire New Jersey Maine District of Columbia Delaware Connecticut Annual NOx (MTons)
37 60,000 Top NOx Source Categories MANE-VU Emissions Inventory Trends Off-Highway Vehicle Diesel 50,000 NOx Emissions (Tons/Yr) 40,000 30,000 20, ,000 0 CT DE DC ME MD MA NH NJ NY PA RI VT
38 45,000 Top NOx Source Categories MANE-VU Emissions Inventory Trends Stationary Source Fuel Combustion - Residential NOx Emissions (Tons/Yr) 40,000 35,000 30,000 25,000 20,000 15, ,000 5,000 0 CT DE DC ME MD MA NH NJ NY PA RI VT
39 How much of the inventory is subject to state control?
40 One definition Outside state control Onroad and offroad engines Motor vehicle fuels Locomotives/airplanes Offshore shipping Biogenic emissions Wildfire/prescribed Ammonia Emissions from Canada and other regions outside OTC Potential for emissions reductions Point sources Some area sources California car standards Limited fuel controls
41 Implications for Weight of Evidence?
42 Implications for Weight of Evidence? Priorities for state strategies Area source VOC reductions Point source NOx reductions Priorities for ongoing inventory improvements (from 2001 PES report)
43 Implications for Weight of Evidence? 2001 PES report identified highly uncertain data in existing emissions inventories: Residential wood combustion activity & factors Construction & agricultural offroad equipment activity Updated Vehicle Mix & Rural Areas VMT Open Burning (Residential waste, yard waste, agricultural field, prescribed, wildfires, slash burn) Agricultural Ammonia (Dairy cattle, poultry, hogs, beef cattle, other livestock, non-ag fertilizer, manure spreading) Fugitive Dust (Construction activities, unpaved roads, agricultural tilling) Natural Sources (Forest and crops, soils, windblown dust)
A Regional Look at the Inventories
 A Regional Look at the Inventories November 9-1, 9 25 MANE-VU Science and Policy Meeting Serpil Kayin, Megan Schuster, and Pat Davis Presentation Outline Basis for selection of candidate measures Emission
MARAMA 2007/2017/2020 Modeling Emissions Inventory Version 2 Preliminary Trends Analysis
 MARAMA 2007/2017/2020 Modeling Emissions Inventory Version 2 Preliminary Trends Analysis October 31, 2011 Prepared by: Abigail Vickers, Julie McDill and Pat Davis Mid-Atlantic Regional Air Management Association
MANE-VU Future Year Inventories. Megan Schuster MARAMA/ MANE-VU RPO Technical Meeting June 9-10, 2005
 MANE-VU Future Year Inventories Megan Schuster MARAMA/ MANE-VU RPO Technical Meeting June 9-10, 2005 MANE-VU Control Scenario Definitions On the Books OTB Controls that are on the books as of a specified
Air Quality Benefits from Tier 3 Low Sulfur Gasoline Program Arthur Marin, NESCAUM
 Air Quality Benefits from Tier 3 Low Sulfur Gasoline Program Arthur Marin, NESCAUM MWAQC Meeting Washington, DC December 14, 2011 Presentation Overview EPA s expected Tier 3 low sulfur gasoline proposal
Air Quality in Arizona
 REGION 9 Air Quality in Arizona NAAQS Attainment Designations 8-hr Ozone, 24-hr PM2.5 http://www.epa.gov/region9/air/maps/index.html NEI 2011 Data Analysis Arizona: Maricopa, Pima, Pinal & Santa Cruz Counties
Manufactured Home Shipments by Product Mix ( )
") Manufactured Home Shipments by Product Mix (1990-2014) Data Source: Institute for Building Technology and Safety (IBTS) * "Destination Pending" represents month-end finished home inventory at a plant.
Manufactured Home Shipments by Product Mix (1990-2014) Data Source: Institute for Building Technology and Safety (IBTS) * "Destination Pending" represents month-end finished home inventory at a plant.
Mobile Source Committee Update
 OTC Stakeholder Meeting September 24 th, 2014 Washington, DC OZONE TRANSPORT COMMISSION Mobile Source Committee Update 1 Committee Charge Goal: To identify potential strategies for consideration at the
THE EFFECTS OF RAISING SPEED LIMITS ON MOTOR VEHICLE EMISSIONS
 THE EFFECTS OF RAISING SPEED LIMITS ON MOTOR VEHICLE EMISSIONS Prepared for: Office of Policy Planning and Evaluation Energy and Transportation Sectors Division U.S. Environmental Protection Agency Washington,
NOx Emission Reduction Benefits of Future Potential U.S. Mobile Source Regulations
 NOx Emission Reduction Benefits of Future Potential U.S. Mobile Source Regulations June 2018 Manufacturers of Emission Controls Association 2200 Wilson Boulevard Suite 310 Arlington, VA 22201 (202) 296-4797
EPA REGULATORY UPDATE PEI Convention at the NACS Show October 8, 2018 Las Vegas, NV
 EPA REGULATORY UPDATE 2018 PEI Convention at the NACS Show October 8, 2018 Las Vegas, NV 1 Periodic Operations and Maintenance Walkthrough Inspections - beginning no later than October 13, 2018 (40 CFR
Report on Analysis of the 2014 National Emissions Inventory for the CAPCOG Region and Selected Updates
 PGA 582-16-60851-01, Amendment 2 Task 2.1, Deliverable 2.1.3 Report on Analysis of the 2014 National Emissions Inventory for the CAPCOG Region and Selected Updates Prepared by the Capital Area Council
TRAFFIC VOLUME TRENDS
 Page 1 U. S. Department Transportation Federal Highway Administration Office Highway Policy Information TRAFFIC VOLUME TRENDS September Travel on all roads and streets changed by +2.5 (5.8 billion vehicle
SPECIFICATION SHEET: CMV_C1C2 2016beta Platform
 March 7, 2019 SPECIFICATION SHEET: CMV_C1C2 2016beta Platform Description: Category 1 and 2 Commercial Marine Vessel (cmv_c1c2) emissions, for simulating 2016 air quality 1. Executive Summary 1 2. Introduction
TRAFFIC VOLUME TRENDS July 2002
 TRAFFIC VOLUME TRENDS July 2002 Travel on all roads and streets changed by +2.3 percent for July 2002 as compared to July 2001. Estimated Vehicle-Miles of Travel by Region - July 2002 - (in Billions) West
The Northeast / Mid-Atlantic Low-Carbon Fuels Initiative Matt Solomon
 The Northeast / Mid-Atlantic Low-Carbon Fuels Initiative Matt Solomon MIT-NESCAUM Endicott House Symposium Dedham, MA August 12, 2009 What s an LCFS again? Performance-based standard for fuels Does not
2013 Migration Patterns traffic flow by state/province
 Interstate and Cross-Border 2013 Migration Patterns traffic flow by state/province Based on 77,308 Interstate Household Goods Moves from January 1, 2013 through December 31, 2013 YUKON TERRITORY 0 0 BC
Alaska (AK) Passenger vehicles, motorcycles 1959 and newer require a title ATV s, boats and snowmobiles do not require a title
 Passenger vehicles, motorcycles 1959 and newer require a title ATV s, boats and snowmobiles do not require a title") Alabama (AL) Passenger vehicles 1975 and newer require a Motorcycles, mopeds and trailers 1975 and newer require a ATVs, snowmobiles and boats do not require a Alaska (AK) Passenger vehicles, motorcycles
Alabama (AL) Passenger vehicles 1975 and newer require a Motorcycles, mopeds and trailers 1975 and newer require a ATVs, snowmobiles and boats do not require a Alaska (AK) Passenger vehicles, motorcycles
RETURN ON INVESTMENT LIQUIFIED NATURAL GAS PIVOTAL LNG TRUCK MARKET LNG TO DIESEL COMPARISON
 RETURN ON INVESTMENT LIQUIFIED NATURAL GAS PIVOTAL LNG TRUCK MARKET LNG TO DIESEL COMPARISON Year 1 Year 2 Year 3 Year 4 Year 5 Year 6 Year 7 Year 8 Year 9 Year 10 RETAIL BREAK EVEN AND IRR EXAMPLE FOR
CHAPTER 3 EMISSION INVENTORY
 CHAPTER 3 EMISSION INVENTORY INTRODUCTION POLLUTANTS EMISSION INVENTORY HIERARCHY 2007 2002 ANNUAL EMISSION INVENTORY 2007 2002 PLANNING EMISSION INVENTORY COMBINED OCS AND SANTA BARBARA COUNTY INVENTORIES
2016 Migration Patterns traffic flow by state/province
 Interstate and Cross-Border 2016 Migration Patterns traffic flow by state/province Based on 75,427 Interstate Household Goods Moves from January 1, 2016 through December 15, 2016 NL 8 13 YUKON TERRITORY
Emission and Air Quality Trends Review
 Emission and Air Quality Trends Review Georgia March 2012 1 Summary 2 Project Objective To develop and present publicly available information on trends in emissions and ambient air quality over the past
CHAPTER 3 EMISSION INVENTORY
 CHAPTER 3 EMISSION INVENTORY Introduction Pollutants Emission Inventory Hierarchy 1999 Annual Emission Inventory 1999 Planning Emission Inventory Conclusion 3. EMISSION INVENTORY 3.1 INTRODUCTION This
Solar Power: State-level Issues and Perspectives
 Solar Power: State-level Issues and Perspectives Sean Gallagher Vice-President, State Affairs Solar Energy Industries Association National Conference of State Legislators Solar Boot Camp August 24, 2016
All Applicants - By HS GPA Run Date: Thursday, September 06, Applicants GPA Count % of Total
 All Freshmen: 3 Year Comparison of Fall Applications Received, Degree, Net s and Net s GPA All - By HS GPA Net s 3.900-4.000 1932 44.3 1840 55.8 441 57.0 24.0 35 1395 3.800-3.899 301 6.9 267 8.1 54 7.0
Monthly Biodiesel Production Report
 Monthly Biodiesel Production Report With data for June 2017 August 2017 Independent Statistics & Analysis www.eia.gov U.S. Department of Energy Washington, DC 20585 This report was prepared by the U.S.
ERC Project Assessment Documentation: Replacement of Lawn and Garden Equipmen with Electric Powered Equipment 11/26/2013 NOx
 ERC Assessment Documentation: Replacement of Lawn and Garden Equipmen with Electric Powered Equipment /26/203 NOx Name Replace Gasoline Electric Electric. Replace Gasoline Leaf Blower with ERC Cost Effectiveness
Selection of States for MANE-VU Regional Haze Consultation (2018)
") Selection of States for MANE-VU Regional Haze Consultation (2018) MANE-VU Technical Support Committee 5/4/2017 Introduction Under the Regional Haze Rule 1, States with Class I areas are to consult with
Selection of States for MANE-VU Regional Haze Consultation (2018) MANE-VU Technical Support Committee 5/4/2017 Introduction Under the Regional Haze Rule 1, States with Class I areas are to consult with
and Residual Oil Strategy
 Low Sulfur Distillate and Residual Oil Strategy MARAMA Workshop on Energy & Air Quality Issues September 23, 2008 Arthur Marin NESCAUM Regional Initiative for Low Sulfur Distillate/Residual Oil MANE-VU
Low-Sulfur Commercial Fuel Oil Regional Initiative and Pennsylvania Proposed Regulation. Agricultural Advisory Board April 21, 2010
 Low-Sulfur Commercial Fuel Oil Regional Initiative and Pennsylvania Proposed Regulation Agricultural Advisory Board April 21, 2010 Deborah Wehr Bureau of Air Quality Proposed Rulemaking on Low Sulfur Commercial
Final Draft Ozone Transport Commission Electric Generating Unit Emission Inventory Analysis September 18, 2014
 Final Draft Ozone Transport Commission Electric Generating Unit Emission Inventory Analysis September 18, 2014 Executive Summary OTC Largest Contributor EGU Subgroup Introduction The Ozone Transport Commission
MMWR 1 Expanded Table 1. Persons living with diagnosed. Persons living with undiagnosed HIV infection
 MMWR 1 Expanded Table 1 Expanded Table 1. Estimated* number of persons aged 13 years with (diagnosed and undiagnosed), and percentage of those with diagnosed, by jurisdiction and year United States, 2008
Livestock Operations Summary. April United States Department of Agriculture. National Agricultural Statistics Service.
 United s Department of Agriculture National Agricultural Statistics Service 3 Summary April 4 Mt An -2 (04) a Update Alert Page 2, Added Table, "Milk Cows: Number of Operations, Percent of Inventory and
Honda Accord theft losses an update
 Highway Loss Data Institute Bulletin Vol. 34, No. 20 : September 2017 Honda Accord theft losses an update Executive Summary Thefts of tires and rims have become a significant problem for some vehicles.
DEAL ER DATAVI EW. Digital Marketing Index August 2018
 DEAL ER DATAVI EW Digital Marketing Index August 2018 DATA DRIVES STRATEGY. The DataView is a monthly automotive digital marketing index, based on Dealer.com s proprietary data, research and analytics.
DEAL ER DATAVI EW. Digital Marketing Index October 2017
 DEAL ER DATAVI EW Digital Marketing Index October 2017 DATA DRIVES STRATEGY. Dealer DataView is a monthly automotive digital marketing index, based on Dealer.com s proprietary data, research and analytics.
Emissions Certification-Related Sales Restrictions; 2018 Model Year Passenger Cars and Trucks
 Emissions Certification-Related Sales Restrictions; 2018 Model Year Passenger Cars and Trucks Note: This letter is intended to provide general information to dealers about sales restrictions contained
WRAP Oil & Gas: 2002/2005 and 2018 Area Source Controls Evaluation
 WRAP Oil & Gas: 2002/2005 and 2018 Area Source Controls Evaluation WRAP SSJF Oil and Gas Work Group Members and Other Interested Parties May 30, 2007 1 WRAP Phase II Project Overview Project is focused
DEAL ER DATAVI EW. Digital Marketing Index. June 2017
 DEAL ER DATAVI EW Digital Marketing Index June 2017 DATA DRIVES STRATEGY. Dealer DataView is a monthly automotive digital marketing index, based on Dealer.com s leading proprietary data, research and analytics.
Addendum to TSAP report #13. Markus Amann, Jens Borken-Kleefeld, Janusz Cofala, Zig Klimont, June 13, 2014
 Addendum to report #13 Markus Amann, Jens Borken-Kleefeld, Janusz Cofala, Zig Klimont, June 13, Table 1: Comparison of 2005 total national emission inventories for SO2. submission of as of March 1, (kilotons)
What to Watch. on State Programs. E-Scrap 2018 Jason Linnell, National Center for Electronics Recycling
 What to Watch on State Programs E-Scrap 2018 Jason Linnell, National Center for Electronics Recycling About NCER National Center for Electronics Recycling: Non-profit 501c3, est. 2005, in Vienna, WV Involved
RELATIVE COSTS OF DRIVING ELECTRIC AND GASOLINE VEHICLES
 SWT-2018-1 JANUARY 2018 RELATIVE COSTS OF DRIVING ELECTRIC AND GASOLINE VEHICLES IN THE INDIVIDUAL U.S. STATES MICHAEL SIVAK BRANDON SCHOETTLE SUSTAINABLE WORLDWIDE TRANSPORTATION RELATIVE COSTS OF DRIVING
Performance Measure Summary - New York-Newark NY-NJ-CT. Performance Measures and Definition of Terms
 Performance Measure Summary - New York-Newark NY-NJ-CT There are several inventory and performance measures listed in the pages of this Urban Area Report for the years from 1982 to 2014. There is no single
Click to edit Master title style
 Click to edit Master title style Northeast Home Heating Oil Reserve (NEHHOR) June 16, 2011 Nancy Marland/Lindsay Partusch Operations and Readiness Office Petroleum Reserves 1 Northeast Click to edit Home
ANNUAL FINANCIAL PROFILE OF AMERICA S FRANCHISED NEW-TRUCK DEALERSHIPS
 217 ANNUAL FINANCIAL PROFILE OF AMERICA S FRANCHISED NEW-TRUCK DEALERSHIPS Overview For 217, ATD Data our annual financial profile of franchised new medium- and heavyduty truck dealerships shows the following:
BLACK KNIGHT HPI REPORT
 CONTENTS 1 OVERVIEW 2 NATIONAL OVERVIEW 3 LARGEST STATES AND METROS 4 MARCH S BIGGEST MOVERS 5 20 LARGEST STATES 6 40 LARGEST METROS 7 ADDITIONAL INFORMATION OVERVIEW Each month, the Data & Analytics division
DRAFT Electric Generating Unit Emissions Inventory Analyses Executive Summary
 March 2014 DRAFT Electric Generating Unit Emissions Inventory Analyses Executive Summary Introduction The Ozone Transport Commission (OTC) Stationary and Area Source Committee (SAS) was directed to identify
DEAL ER DATAVI EW. Digital Marketing Index. August 2017
 DEAL ER DATAVI EW Digital Marketing Index August 2017 DATA DRIVES STRATEGY. Dealer DataView is a monthly automotive digital marketing index, based on Dealer.com s leading proprietary data, research and
State Policy Trends in Biomass
 State Policy Trends in Biomass Biomass 2010 March 30, 2010 Glen Andersen National lconference of State Legislatures Overview of State Policies Renewable Fuel Standards Renewable Portfolio Standards Reducing/Eliminating
US Exports to China by State
 US Exports to China by State 2000 10 1818 N Street, NW, Suite 200, Washington, DC 20036 Tel: 202-429-0340 Fax: 202-775-2476 E-mail: info@uschina.org www.uschina.org Executive Summary Exports to China are
Chapter 3.0 National Emissions Trends, 1900 to 1996
 Chapter 3.0 National Emissions Trends, 1900 to 1996 Historical trends in criteria air pollutant emissions (CO, NO x, VOC, SO 2, PM-10, and Pb) are presented in this chapter for the period 1900 through
Technical Memorandum. Issue
 Technical Memorandum To: Julie McDill, P.E., Mid-Atlantic Air Management Association, Inc. From: John Barnes, P.E., Chief, Stationary Source Planning Section RE: NOx Reductions Low Sulfur Distillate Fuels
Quarterly Hogs and Pigs
 Quarterly Hogs and Pigs ISSN: 19-1921 Released December 28, 2012, by the National Agricultural Statistics Service (NASS), Agricultural Statistics Board, United s Department of Agriculture (USDA). United
Publisher's Sworn Statement
 Publisher's Sworn Statement FDMC is published monthly and is dedicated to providing the best practices in woodworking, technology and business to the people who manufacture furniture, cabinets, millwork
California s Success in Controlling Large Industrial Sources
 California s Success in Controlling Large Industrial Sources Endicott House 2006 Symposium Mike Scheible Deputy Executive Officer California Air Resources Board California Environmental Protection Agency
8,975 7,927 6,552 6,764
 y = 0.1493x 4-23842x 3 + 1E+09x 2-4E+13x + 4E+17 R 2 = 0.9977 27,717 21,449 17,855 13,222 11,054 10,053 6/28/2009 6/24/2009 6/22/2009 6/20/2009 6/18/2009 6/16/2009 6/14/2009 6/8/2009 6/6/2009 6/4/2009
The U.S. Solar Energy Industry: Powering America
 The U.S. Solar Energy Industry: Powering America Katherine Stainken Director, Government Affairs NASEO Energy Policy Outlook Conference February 4 th, 2015 About SEIA Founded in 1974 U.S. National Trade
Northeast Diesel Collaborative
 Northeast Diesel Collaborative Presented to Ozone Transport Commission November 2-3, 2005 Arthur Marin NESCAUM 1 Northeast Diesel Collaborative The Northeast s clean diesel campaign is nearly a decade
2013 Mobile Source Emissions Mecklenburg County, NC
 Tons Mobile Source Emissions Inventory CY2013 Mecklenburg County, NC Prepared by: Shelley H. Lanham, Senior Air Quality Specialist May 2015 The annual Mobile Source Emissions Inventory for Mecklenburg
Performance Measure Summary - Boston MA-NH-RI. Performance Measures and Definition of Terms
 Performance Measure Summary - Boston MA-NH-RI There are several inventory and performance measures listed in the pages of this Urban Area Report for the years from 1982 to 2014. There is no single performance
Quarterly Hogs and Pigs
 Quarterly Hogs and Pigs ISSN: 9-92 Released December 20, 208, by the National Agricultural Statistics Service (NASS), Agricultural Statistics Board, United s Department of Agriculture (USDA). United s
2008 Emissions Inventory for Orange, Seminole, and Osceola Counties A Final Report (Corrected)
") 2008 Emissions Inventory for Orange, Seminole, and Osceola Counties A Final Report (Corrected) By: Jessica Ross, EI, Graduate Research Assistant C. David Cooper, PhD, PE, QEP, Professor University of Central
2008 Emissions Inventory for Orange, Seminole, and Osceola Counties A Final Report (Corrected) By: Jessica Ross, EI, Graduate Research Assistant C. David Cooper, PhD, PE, QEP, Professor University of Central
Clean Fuels MARAMA
 Clean Fuels MARAMA 3.20.2019 Alleyn Harned Virginia Clean Cities 540-568-8896 aharned@vacleancities.org Clean Cities / 1 Clean Fuels and Mobile Sources Ask the questions: Why Energy Economic Security Environmental
2008 Periodic Emissions Inventory for Carbon Monoxide. for the Maricopa County, Arizona, Maintenance Area
 2008 Periodic Emissions Inventory for Carbon Monoxide for the Maricopa County, Arizona, Maintenance Area November 2012 This page intentionally blank. 2008 Periodic Emission Inventory for Carbon Monoxide
Failing the Grade: School Bus Pollution & Children s Health. Patricia Monahan Union of Concerned Scientists Clean Cities Conference May 13, 2002
 Failing the Grade: School Bus Pollution & Children s Health Patricia Monahan Union of Concerned Scientists Clean Cities Conference May 13, 2002 Outline School bus/diesel pollution and children s health
Commercial Motor Vehicle Marking. And Identification Regulations
 Commercial Motor Vehicle Marking And Identification Regulations Federal Regulation Part 390.21 requires the following marking rules for all **qualifying Interstate for hire and private commercial motor
2. OZONE REDUCTION PLAN FOR THE SOUTH COAST AIR BASIN
 -9-2. OZONE REDUCTION PLAN FOR THE SOUTH COAST AIR BASIN The ZEV program is one element of an aggressive plan to reduce ozone levels in the South Coast Air Basin. This plan involves substantial emission
TRAFFIC SAFETY FACTS Fatal Motor Vehicle Crashes: Overview. Research Note. DOT HS October 2017
 TRAFFIC SAFETY FACTS Research Note DOT HS 812 456 October 2017 2016 Fatal Motor Vehicle Crashes: Overview There were 37,461 people killed in crashes on U.S. roadways during 2016, an increase from 35,485
Air Quality Impacts of Advance Transit s Fixed Route Bus Service
 Air Quality Impacts of Advance Transit s Fixed Route Bus Service Final Report Prepared by: Upper Valley Lake Sunapee Regional Planning Commission 10 Water Street, Suite 225 Lebanon, NH 03766 Prepared for:
Revised Inventory Guidance For Locomotive Emissions
 Report No. SR2004-06-01 Revised Inventory Guidance For Locomotive Emissions prepared for: Southeastern States Air Resource Managers, Inc. June 2004 prepared by: Sierra Research, Inc. 1801 J Street Sacramento,
January * Kansas Stats/ Rankings. * Accident Stats
 KDOT Quick Facts January 2012 * Kansas Stats/ Rankings * CTP * Personnel * Revenue * Taxes * Accident Stats Table of Contents Kansas Public Road Miles and Vehicle Miles of Travel - Percent by Jurisdiction...
The Cost of the National Low-Emissions Vehicle Program: A Case Study. Lori D. Snyder John F. Kennedy School of Government
 The Cost of the National Low-Emissions Vehicle Program: A Case Study By Lori D. Snyder John F. Kennedy School of Government This case was prepared for teaching purposes. While the case is based on the
2009 Migration Patterns traffic flow by state/province
 Interstate and Cross-Border 2009 Migration Patterns traffic flow by state/province Based on 71,474 Interstate Household Goods Moves from January 1, 2009 through December 31, 2009 UNITED STATES ALABAMA
2010 Migration Patterns traffic flow by state/province
 Interstate and Cross-Border 2010 Migration Patterns traffic flow by state/province Based on 74,541 Interstate Household Goods Moves from January 1, 2010 through December 31, 2010 UNITED STATES ALABAMA
Regional Oil, Propane, Gasoline & BioFuel Overview. Connecticut Energy Marketers Association
 Regional Oil, Propane, Gasoline & BioFuel Overview Connecticut Energy Marketers Association Connecticut Energy Marketers Association Infrastructure Overview Terminals Pipelines Production Facilities Rail,
DOT HS July 2012
 TRAFFIC SAFETY FACTS 2010 Data DOT HS 811 639 July 2012 Motorcycles In 2010, 4,502 motorcyclists were killed a slight increase from the 4,469 motorcyclists killed in 2009. There were 82,000 motorcyclists
Traffic Safety Facts. Alcohol Data. Alcohol-Related Crashes and Fatalities
 Traffic Safety Facts 2005 Data Alcohol There were 16,885 alcohol-related fatalities in 2005 39 percent of the total traffic fatalities for the year. Alcohol-Related Crashes and Fatalities DOT HS 810 616
Executive Summary. Exports to China: A key driver of US economic growth. China: An important market for US goods
 Executive Summary Exports to China: A key driver of US economic growth China continues to be an important contributor to US economic growth. In 2014, US exports to China totaled $120 billion, making it
ISO on Background. Energy-efficiency forecast. Anne George. Stephen J. Rourke VICE PRESIDENT, SYSTEM PLANNING DECEMBER 12, 2012
 DECEMBER 12, 2012 ISO on Background Energy-efficiency forecast Anne George VICE PRESIDENT, EXTERNAL AFFAIRS &CORPORATE COMMUNICATIONS Stephen J. Rourke VICE PRESIDENT, SYSTEM PLANNING Agenda 11:00-11:05
05/17/2011
 RETAIL DIESEL FUEL OUTLOOK A Fundamental Petroleum Trends Weekly Report Lehi German Tel: 816.505.0980 www.fundamentalpetroleumtrends.com Tuesday, May 17, 2011 Diesel Fuel Price Trends U.S. retail diesel
CO 2 Emissions from Cars, Trucks & Buses in the Metropolitan Washington Region
 CO 2 Emissions from Cars, Trucks & Buses in the Metropolitan Washington Region Presentation to the COG Climate Change Steering Committee Ronald F. Kirby Director of Transportation Planning June 27, 2007
OZONE TRANSPORT COMMISSION Ali Mirzakhalili, P.E. Stationary and Area Sources Committee OZONE TRANSPORT COMMISSION
 OTC /MANE-VU Committees Meeting September 7, 2017 Hall of States, Washington DC. OZONE TRANSPORT COMMISSION Ali Mirzakhalili, P.E. Stationary and Area Sources Committee OZONE TRANSPORT COMMISSION 1 Stationary
Section Two STATE SUMMARY & OFFENSE ANALYSIS. State Summary & Offense Analysis 9
 Section Two STATE SUMMARY & OFFENSE ANALYSIS State Summary & Offense Analysis 9 24 HOUR CRIME CYCLE IN NEW JERSEY 2010 10 State Summary & Offense Analysis NEW JERSEY CRIME CLOCK 2010 CRIME INDEX OFFENSE
TAX CHANGES FOR 2019* DELAWARE FLORIDA
 TAX CHANGES FOR 2019* DELAWARE Effective January 1, 2019, the Delaware Hazardous Substance Tax will be subject to annual adjustment based upon the amount of money in the fund during the lookback period
Estimated PM2.5 Emissions from Port Operations in Philadelphia
 Estimated PM2.5 Emissions from Port Operations in Philadelphia Tom Weir City of Philadelphia, Department of Public Health, Air Management Services Contracted work by EC/R Incorporated for U.S. EPA, Region
DOT HS October 2011
 TRAFFIC SAFETY FACTS 2009 Data DOT HS 811 389 October 2011 Motorcycles Definitions often vary across publications with respect to individuals on motorcycles. For this document, the following terms will
Sacramento NOx Emissions
 Sacramento NOx Emissions Sacramento NOx Emissions Mobile Source NOx Emissions 209 Total Tons Per Day 255 Total Tons Per Day Equipment 6 3% Stationary 3 15% On-Road 4 33% Mobile Sources2 8 13% Trucks 5
Supporting Information
 Supporting Information Strauss et al. 10.1073/pnas.1511186112 7 Antarctic Contribution (BASELINE) 7 Antarctic Contribution (TRIGGERED) Sea Level Rise (m) 6 5 4 3 2 1 SLR sensitivity to warming held constant
E.H. Pechan & Associates, Inc.
 E.H. & Associates, Inc. National Emissions Inventory for Stephen M. Roe, Melissa D. Spivey, Holly C. Lindquist, Paula Hemmer E.H. & Associates, Inc. Roy Huntley U.S. Environmental Protection Agency, Emission
A Clean Diesel State of Mind Top States for Diesel Drivers
 A Clean Diesel State of Mind Top States for Diesel Drivers Growing Clean Diesel Cars, Trucks and SUVs: June 4, 2014 2:00 pm ET Press Conference #cleandiesel Today s Virtual Press Conference Welcome and
Tax Information. Federal Tax ID. Federal Tax ID: EPA Registration. EPA Registration #: California SG # California SG #:
 Tax Information Federal Tax ID NGL Crude Logistics LLC Debra Kelson 2900 N. Loop W., Suite 1250, Houston, TX 77092 Phone: 713-496-3900 Fax: 713-496-3902 Energytaxes@nglep.com Federal Tax ID: 47-0794813
Understanding and Estimating Greenhouse Gas Emissions
 Understanding and Estimating Greenhouse Gas Emissions American Association of Port Authorities Climate Change Workshop November 12, 2008 Port of Houston Houston, TX Overview What What Are Greenhouse Gases?
Mobile Source Air Toxics: Overview and Regulatory Background
 Mobile Source Air Toxics: Overview and Regulatory Background Melanie Zeman USEPA Region 2 Northern Transportation & Air Quality Summit August 14, 2008 About MSATs More than 1000 compounds have been identified
The Village at Playa Vista. Appendix E-6. Alternative Analysis
 The Village at Playa Vista Appendix E-6 Alternative Analysis E-6a Remaining Existing Specific Plan Operations Summary Electricity and Natural Gas Usage URBEMIS2002 Output Files Miscellaneous Sources Emissions
2016 REVISION OF THE REGIONAL AIR QUALITY STRATEGY FOR SAN DIEGO COUNTY FINAL - DECEMBER 2016
 2016 REVISION OF THE REGIONAL AIR QUALITY STRATEGY FOR SAN DIEGO COUNTY FINAL - DECEMBER 2016 SAN DIEGO COUNTY AIR POLLUTION CONTROL DISTRICT 10124 Old Grove Road San Diego, CA 92131 2016 RAQS Table of
Energy, Economic. Environmental Indicators
 Energy, Economic and AUGUST, 2018 All U.S. States & Select Extra Graphs Contents Purpose / Acknowledgements Context and Data Sources Graphs: USA RGGI States (Regional Greenhouse Gas Initiative participating
U.S. Heat Pump Water Heater Market Transformation: Where We ve Been and Where to Go Next
 U.S. Heat Pump Water Heater Market Transformation: Where We ve Been and Where to Go Next JOSH BUTZBAUGH LINDA SANDAHL MICHAEL BAECHLER SEPTEMBER 14, 2017 1 Agenda Agenda Background Technology Considerations
Performance Measure Summary - Allentown PA-NJ. Performance Measures and Definition of Terms
 Performance Measure Summary - Allentown PA-NJ There are several inventory and performance measures listed in the pages of this Urban Area Report for the years from 1982 to 2014. There is no single performance
Retail Electric Rates in Deregulated and Regulated States: 2010 Update
 Retail Electric Rates in Deregulated and Regulated States: 2010 Update Published March 2011 1875 Connecticut Avenue, NW Washington, D.C. 20009-5715 202/467-2900 www.appanet.org Retail Electric Rates in
ICI Boiler NOx & SO 2
 ICI Boiler NOx & SO 2 Control Cost Estimates Andrew M. Bodnarik NH Department of Environmental Services OTC Committee Meeting Modeling/Stationary & Area/Mobile Sources Niagara Falls, NY September 3, 2009
ESTIMATED NUMBER OF NEW CANCER CASES AND DEATHS BY STATE All Sites Brain and ONS Female Breast Uterine Cervix STATE Cases Deaths Cases Deaths
 All Sites Brain and ONS Female Breast Uterine Cervix Alabama 24,090 9,900 310 200 2,970 700 190 80 Alaska 2,530 830 * * 370 60 * * Arizona 27,600 10,260 470 280 3,470 740 210 80 Arkansas 14,800 6,230 200