A Regional Look at the Inventories
|
|
|
- Posy Price
- 5 years ago
- Views:
Transcription
1 A Regional Look at the Inventories November 9-1, 9 25 MANE-VU Science and Policy Meeting Serpil Kayin, Megan Schuster, and Pat Davis
2 Presentation Outline Basis for selection of candidate measures Emission contribution Source apportionment Potential for additional reductions in the near-future timeframe (cost effectiveness, geographic/seasonal applicability, time frame for implementation) Where we are 22 MANE-VU Modeling Inventory Status: Data availability and summaries by pollutant, major source categories, state and regional totals, important source categories (SCCs) by pollutant, state, and regional totals, density maps, and seasonality. Where are we going? Projected future trends: Summaries by pollutant, state, regional total and important source categories Potential non-egu controls for SO2, NOx, VOC? What do SA studies identify as the most important source categories for PM/RH?
3 MANE-VU 22 Modeling Inventory Version 1 of 22 MANE-VU Modeling Inventory and Summary click on Regional Haze, then 22 MANE-VU Inventory Summaries by state, region, pollutant, SCC, density maps, comparison with 1996 and 1999 inventories Version 2 of 22 MANE-VU Modeling Inventory available Based on updates from states (adding emissions for new SCCs, or updating old data) Projections are developed based on Version 2 Version 3 of 22 inventory will be available soon Documentation is available at the above site. TSD for SIPs will be devoped All data available: ftp.marama.org
4 NESCAUM Total Annual SO2 Emissions by State Point ONROAD NONROAD Area North Carolina** Virginia** West Virginia** District of Columbia Maine Maryland Massachusetts New Hampshire New Jersey New York Pennsylvania Rhode Island Vermont Delaware Connecticut Millions t/y
5
6 NESCAUM Total Annual NOx Emissions by State Point ONROAD NONROAD Area District of Columbia Maine Maryland Massachusetts New Hampshire New Jersey New York Pennsylvania Rhode Island Vermont North Carolina** Virginia** West Virginia** Delaware Connecticut Millions t/y
7 NESCAUM Total Annual PM2.5 Primary Emissions by State Point ONROAD NONROAD Area District of Columbia Maine Maryland Massachusetts New Hampshire New Jersey New York Pennsylvania Rhode Island Vermont North Carolina** Virginia** West Virginia** Delaware Connecticut Millions t/y
8 NESCAUM Total Annual VOC Emissions by State Point ONROAD NONROAD Area District of Columbia Maine Maryland Massachusetts New Hampshire New Jersey New York Pennsylvania Rhode Island Vermont North Carolina** Virginia** West Virginia** Delaware Connecticut Millions t/y

9
10 NESCAUM Total Annual NH3 Emissions by State Point ONROAD NONROAD Area District of Columbia Maine Maryland Massachusetts New Hampshire New Jersey New York Pennsylvania Rhode Island Vermont North Carolina** Virginia** West Virginia** Delaware Connecticut Millions t/y

11

12

13
14


15
16 MANE-VU Future Year Inventories (29, 212, 218) EGU sector: Worked with eastern RPOs, ran IPM with and without CAIR/CAMR Data for 29 and 218 CAIR case available for modeling 212 data will be available when requested Contract in place with ICF for further technical sensitivity and policy ( BOTW ) runs Non-EGU Point, Area, and Non-Road Growth and control packages and emission summaries available for OTB+OTW (includes CAIR/CAMR) available. Worked with states, used different methodologies for different sources (EGAS 5., NONROAD, EPA data, State data, DOE data) Contract in place with MACTEC for further work to develop inventories with BOTW controls.
17 MANE-VU Future Year Inventories (29, 212, 218) Mobile source inventories States submitted M6 input files and VMT data for 29, 212, and 218 NESCAUM and NY DEC QA d data and it is ready for SMOKE modeling TSD for SIPs will be developed
18 NESCAUM EGU Sector Emissions 22 MANE-VU 29 CAIR RPO 21 CAIR EPA 215 CAIR EPA 218 CAIR RPO 22 CAIR EPA 15 tons/yr 1 5 NOX SO2
19 Comparison of EGU Sector SO2 Emissions 1,, 9, 8, 7, 6, 22 MANE-VU 29 Base RPO 29 With CAIR RPO 218 Base RPO 218 With CAIR RPO tons/yr 5, 4, 3, 2, 1, Connecticut District of Columbia Maryland New Hampshire New York Pennslyvania Vermont West Virginia
20 Comparison of EGU Sector NOx Emissions 25, 22 MANE-VU 29 Base RPO 2, 29 With CAIR RPO 218 Base RPO 15, 218 With CAIR RPO tons/yr 1, 5, Connecticut District of Columbia Maryland New Hampshire New York Pennslyvania Vermont West Virginia
21 1,8, 1,6, 1,4, 1,2, Sector Summary for Sulfur Dioxide Total Emissions (tpy) 1,, 8, 6, 4, 2, EGUs non-egus Area NONROAD Other Nonroad on-road
22 Sector Summary for Oxides of Nitrogen 1,4, 1,2, 1,, Total Emissions (tpy) 8, 6, 4, 2, EGUs non-egus Area NONROAD Other Nonroad on-road NO x
23 2,, 1,8, 1,6, 1,4, Sector Summary for Volatile Organic Compounds Total Emissions (tpy) 1,2, 1,, 8, 6, 4, 2, EGUs non-egus Area NONROAD Other Nonroad on-road VOC
24 Total Emissions (tpy) 4, 35, 3, 25, 2, 15, Sector Summary for Ammonia , 5, EGUs non-egus Area NONROAD Other Nonroad on-road NH 3
25 5, 45, 4, 35, Sector Summary for PM Total Emissions (tpy 3, 25, 2, 15, 1, 5, EGUs non-egus Area NONROAD Other Nonroad on-road PM2.5
26 15, 125, 1, 75, 5, 25, Area Source SO2 Emissions Other ICI Oil HomeHeatOil HomeHeatOther ICI Coal Tons per Year
27 Other 14, 12, 1, 8, 6, 4, 2, Area Source NOx Emissions HomeHeatOil HomeHeatGas HomeHeatWood Open Burning ICI Fuel Tons per Year
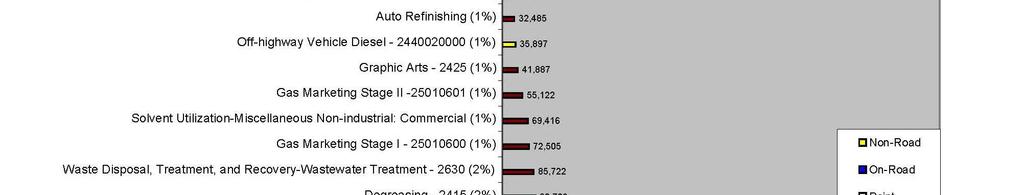
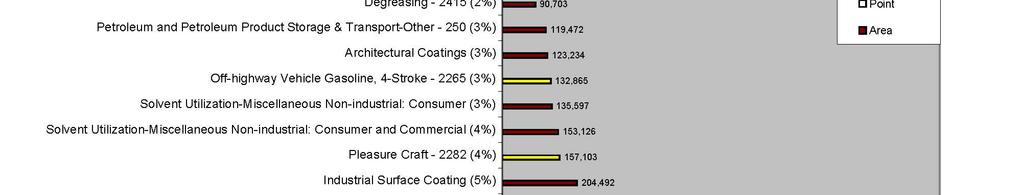
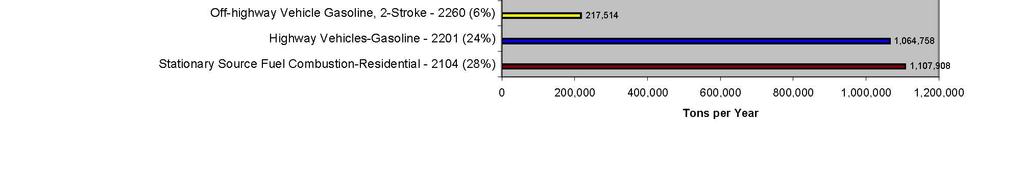
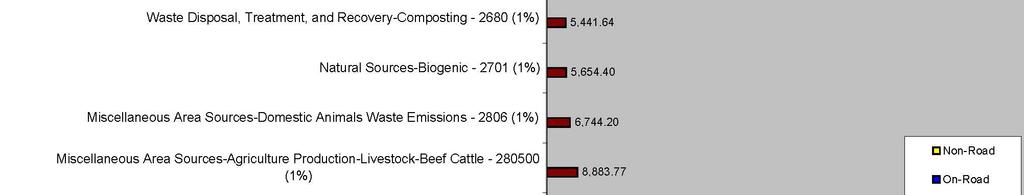
28 Other 1,, 8, 6, 4, 2, Area Source VOC Emissions HomeHeatWood Indust. Coating AIM Degreasing Consumer Prods. Fuel Transfer Waste Treatment Tons per Year
29 Area Source NOx Emissions by State 12, 1, , Tons per Year 6, 4, 2, CT DC DE MA MD ME NH NJ NY PA RI VT
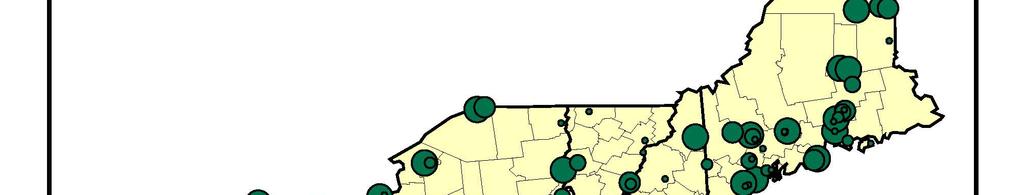
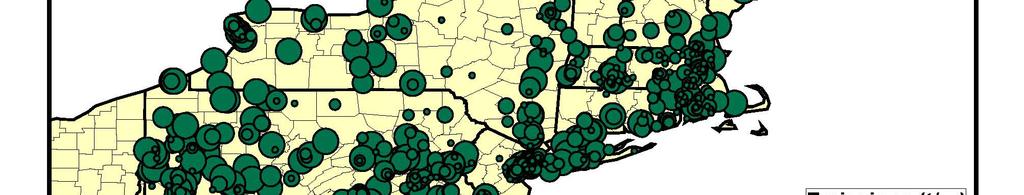
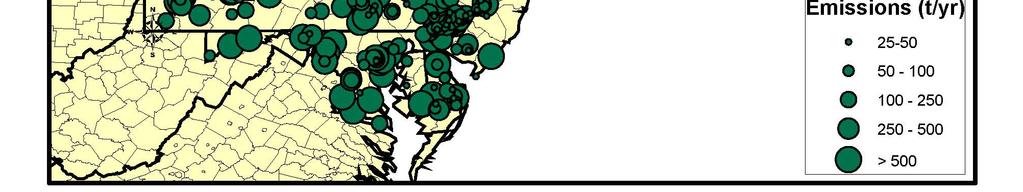
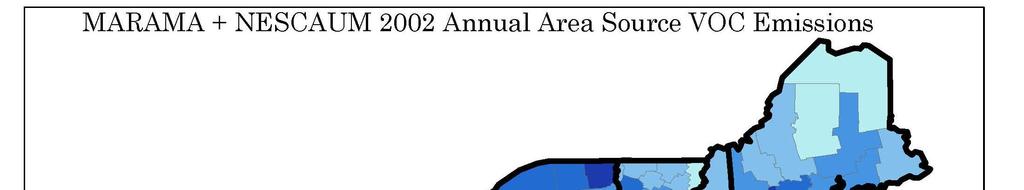
30 Area Source VOC Emissions by State 1,, 9, 8, , Tons per Year 6, 5, 4, 3, 2, 1, CT DC DE MA MD ME NH NJ NY PA RI VT
31 MANE-VU Vehicle Miles Traveled Vehicle Miles Travel growth Miles (1^6) 7, 6, 5, 4, 3, 2, 1, VMT (1^6) 513, , ,92 641,93 Year
32 6.E+2 5.E+2 4.E+2 3.E+2 2.E+2 1.E+2.E+ Mobile Sources (VMT) District of Columbia Maine Maryland Massachusetts New Hampshire New Jersey New York Pennsylvania Rhode Island Vermont VMT 2 VMT 9 VMT 12 VMT 18 Delaware Connecticut VMT Millions


33 On-Road NOx Emissions Distribution Aug 1 st, 12LST of year 22/29/212/218 Y22 Y29 Y218 Y212

34 Typical Summer Day Mobile Source NOx Emissions
35 1.2E+3 1.E+3 8.E+2 6.E+2 4.E+2 2.E+2.E+ Mobile Sources (NOx ( Typical Summer Day) Delaware District of Columbia Maine Maryland Massachusetts New Hampshire New Jersey New York Pennsylvania Rhode Island Vermont NOx 2 NOx 9 NOx 12 NOx 18 Connecticut TPD
36 14 ICI Boilers (NOx: ~ 6, t/y; SO2: ~ 13, t/y) 16 Home Heating (S2: ~ 13, t/y) Monthly % Fraction of Emissions Industrial--All Fuels and Commercial--LPG, Wood Kerosene Commercial--Coal, Oil, Natural Gas Monthly % Fraction of Emissions Residual Oil Distillate Oil 2 2 January February March April May June July August September October November December January February March April May June July August September October November December 25 AIM (VOC: ~ 143, t/y) 8.5 Consumer Products (VOC: ~ 26, t/y) Architectual Coatings and Industrial Maintenance 8.45 Traffic Markings Monthly % Fraction of Emissions 15 1 Monthly % Fraction of Emissions January February March April May June July August September October November December 8 January February March April May June July August September October November December
37 8.55 Cutback Asphalt and Emulsifield Sealer (VOC: ~ 2, t/y) MWC ( NOx: ~ 25, t/y; SO2: ~ 3,5 t/y) Monthly % Fraction of Emissions Monthly % Fraction of Emissions January February March April May June July August September October November December January February March April May June July August September October November December 1 Gasoline Distribution Facilities (VOC: ~ 15, t/y) RWC (VOC: ~ 3, t/y; PM2.5: ~ 13, t/y) 25 9 Indoor 8 Outdoor 2 Monthly % Fraction of Emissions Monthly % Fraction of Emissions January February March April May June July August September October November December January February March April May June July August September October November December
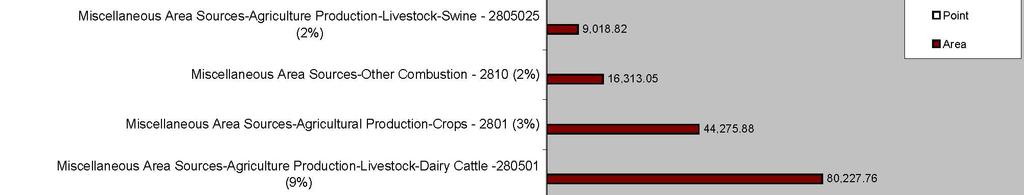
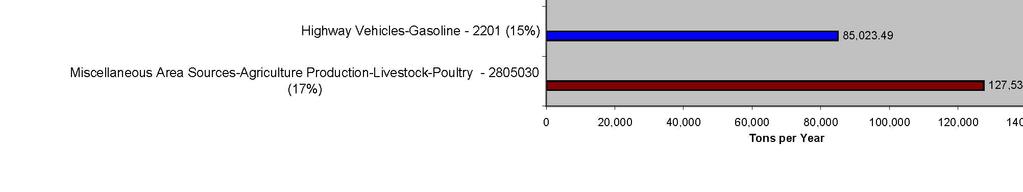
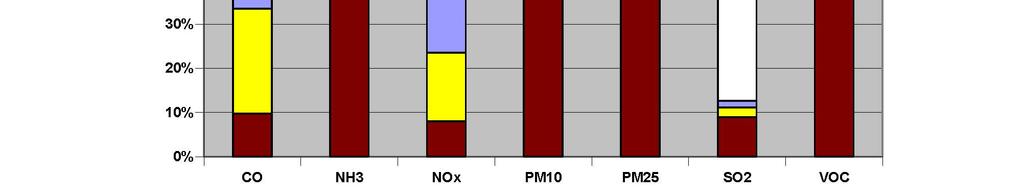
38 Major Contributors in the MANE-VU Region 22 through 29 and 218 w/ OTB+OTW NOx ~5% Mobile % contributions remains roughly same ~2% EGUs VOC ~3% Res. Fuel Comb. % contributions remains roughly same (of which 8% wood V3 will go down) ~25% Highway-gasoline SO2 substantial decrease in % EGU contribution ~7% EGUs ~35% ~1% Industrial ~3% ~1% Residential ~35% NH3 increase in % agricultural contribution ~15% Highway-gasoline, rest agricultural PM2.5 % contributions remains roughly same ~25% EGUs and Industrial ~15% Off-highway ~1% Highway
39 Findings from analysis of speciated aerosol data combined with ensemble trajectory evaluations in MANE-VU Common source categories with impacts on PMfine mass concs. & visibility impairment in NE sites Windblown dust: minor contributor to avg. fine mass, with highest short term impacts from Saharan transport Sea Salt: minor contributor to fine mass, identified at coastal and near coastal sites. Significant at best visibility days at Acadia & Brigantine. Oil burning: minor contributor to fine mass, identified at many sites, within and downwind of the NE urban corridor.
40 Findings from analysis of speciated aerosol data combined with ensemble trajectory evaluations in MANE-VU Common source categories with impacts on PMfine mass concs. & visibility impairment in NE sites Ammonium Nitrate: a small to moderate contributor to avg fine mass, with regional influences at rural sites from upwind agricultural ammonia-emitting areas, and significant local source contributions in urban areas. Wood Smoke: a small to moderate contributor to avg fine mass, with contributions higher in rural areas, winter peaks in northern areas from residential wood burning, occasional large summer impacts at all sites from wildfires.
41 Findings from analysis of speciated aerosol data combined with ensemble trajectory evaluations in MANE-VU Common source categories with impacts on PMfine mass concs. & visibility impairment in NE sites Motor Vehicles & Secondary Organics: a moderate to large contributor to avg fine mass, with influence from both gasoline & diesel vehicles in urban areas; at forested rural sites, biogenic organics are likely to be more important. Coal Burning (incl. pri. aerosol and sec. aerosol formation): largest mass contributing and visibilityimpairing category at most sites, contributions primarily from utility and industrial sources in western MANE-VU, northern VISTAS and the MRPO regions.
42 What is next? Updates of emission summaries will be available at under Regional Haze. What other emission summaries are needed? A non-egu projection contract is in place. OTB+OTW and BOTW emissions are upcoming. An EGU projection contract is in place. BOTW emissions are upcoming.
Review of VOC and NOx Emissions Inventory Trends
 Review of VOC and NOx Emissions Inventory Trends Patrick Davis Mid-Atlantic Regional Air Management Association MARAMA WOE Workshop Cape May, NJ February 7, 2007 Main topics 1. Data sources 2. What source
MARAMA 2007/2017/2020 Modeling Emissions Inventory Version 2 Preliminary Trends Analysis
 MARAMA 2007/2017/2020 Modeling Emissions Inventory Version 2 Preliminary Trends Analysis October 31, 2011 Prepared by: Abigail Vickers, Julie McDill and Pat Davis Mid-Atlantic Regional Air Management Association
MANE-VU Future Year Inventories. Megan Schuster MARAMA/ MANE-VU RPO Technical Meeting June 9-10, 2005
 MANE-VU Future Year Inventories Megan Schuster MARAMA/ MANE-VU RPO Technical Meeting June 9-10, 2005 MANE-VU Control Scenario Definitions On the Books OTB Controls that are on the books as of a specified
Air Quality Benefits from Tier 3 Low Sulfur Gasoline Program Arthur Marin, NESCAUM
 Air Quality Benefits from Tier 3 Low Sulfur Gasoline Program Arthur Marin, NESCAUM MWAQC Meeting Washington, DC December 14, 2011 Presentation Overview EPA s expected Tier 3 low sulfur gasoline proposal
TRAFFIC VOLUME TRENDS
 Page 1 U. S. Department Transportation Federal Highway Administration Office Highway Policy Information TRAFFIC VOLUME TRENDS September Travel on all roads and streets changed by +2.5 (5.8 billion vehicle
TRAFFIC VOLUME TRENDS July 2002
 TRAFFIC VOLUME TRENDS July 2002 Travel on all roads and streets changed by +2.3 percent for July 2002 as compared to July 2001. Estimated Vehicle-Miles of Travel by Region - July 2002 - (in Billions) West
Monthly Biodiesel Production Report
 Monthly Biodiesel Production Report With data for June 2017 August 2017 Independent Statistics & Analysis www.eia.gov U.S. Department of Energy Washington, DC 20585 This report was prepared by the U.S.
Selection of States for MANE-VU Regional Haze Consultation (2018)
") Selection of States for MANE-VU Regional Haze Consultation (2018) MANE-VU Technical Support Committee 5/4/2017 Introduction Under the Regional Haze Rule 1, States with Class I areas are to consult with
Selection of States for MANE-VU Regional Haze Consultation (2018) MANE-VU Technical Support Committee 5/4/2017 Introduction Under the Regional Haze Rule 1, States with Class I areas are to consult with
3. Atmospheric Supply of Nitrogen to the Baltic Sea in 2009
 3. Atmospheric Supply of Nitrogen to the Baltic Sea in 2009 Nitrogen emission data, as well as the model results presented here have been approved by the 35 th Session of the Steering Body of EMEP in Geneva
Low-Sulfur Commercial Fuel Oil Regional Initiative and Pennsylvania Proposed Regulation. Agricultural Advisory Board April 21, 2010
 Low-Sulfur Commercial Fuel Oil Regional Initiative and Pennsylvania Proposed Regulation Agricultural Advisory Board April 21, 2010 Deborah Wehr Bureau of Air Quality Proposed Rulemaking on Low Sulfur Commercial
ICI Boiler NOx & SO 2
 ICI Boiler NOx & SO 2 Control Cost Estimates Andrew M. Bodnarik NH Department of Environmental Services OTC Committee Meeting Modeling/Stationary & Area/Mobile Sources Niagara Falls, NY September 3, 2009
APPENDIX 6A. Air Quality Monitoring Results
 APPENDIX 6A Air Quality Results Introduction summarises the monitoring data that was used to determine the air quality baseline conditions for the SD2 Project. Air quality monitoring has been carried
Mobile Source Committee Update
 OTC/MANE VU Fall Meeting November 15th, 2012 Washington, DC OZONE TRANSPORT COMMISSION Mobile Source Committee Update 1 Overview 1. Mobile Sources Cause 40-60% of the Ozone in the Eastern US 2. State Authority:
SPECIFICATION SHEET: CMV_C1C2 2016beta Platform
 March 7, 2019 SPECIFICATION SHEET: CMV_C1C2 2016beta Platform Description: Category 1 and 2 Commercial Marine Vessel (cmv_c1c2) emissions, for simulating 2016 air quality 1. Executive Summary 1 2. Introduction
DRAFT Electric Generating Unit Emissions Inventory Analyses Executive Summary
 March 2014 DRAFT Electric Generating Unit Emissions Inventory Analyses Executive Summary Introduction The Ozone Transport Commission (OTC) Stationary and Area Source Committee (SAS) was directed to identify
RELATIVE COSTS OF DRIVING ELECTRIC AND GASOLINE VEHICLES
 SWT-2018-1 JANUARY 2018 RELATIVE COSTS OF DRIVING ELECTRIC AND GASOLINE VEHICLES IN THE INDIVIDUAL U.S. STATES MICHAEL SIVAK BRANDON SCHOETTLE SUSTAINABLE WORLDWIDE TRANSPORTATION RELATIVE COSTS OF DRIVING
Impact of Transportation Emissions on New Jersey s Air Quality
 Impact of Transportation Emissions on New Jersey s Air Quality Sum of Ozone Precursors: VOC and NO x Emissions Percentage of Volatile Organic Compounds (VOCs and Oxides of Nitrogen (NOx by Source Category
EPA REGULATORY UPDATE PEI Convention at the NACS Show October 8, 2018 Las Vegas, NV
 EPA REGULATORY UPDATE 2018 PEI Convention at the NACS Show October 8, 2018 Las Vegas, NV 1 Periodic Operations and Maintenance Walkthrough Inspections - beginning no later than October 13, 2018 (40 CFR
JOB CUT ANNOUNCEMENTS SURGE 45 PERCENT TO 76,835, HIGHEST MONTHLY TOTAL IN OVER THREE YEARS
 CONTACT Colleen Madden, Director of Public Relations Office: 312-422-5074 Mobile: 314-807-1568 colleenmadden@challengergray.com **EMBARGOED COPY** FOR RELEASE AT 7:30 A.M. ET, MARCH 7, 2019 JOB CUT ANNOUNCEMENTS
Air Quality Impacts of Advance Transit s Fixed Route Bus Service
 Air Quality Impacts of Advance Transit s Fixed Route Bus Service Final Report Prepared by: Upper Valley Lake Sunapee Regional Planning Commission 10 Water Street, Suite 225 Lebanon, NH 03766 Prepared for:
Department of the Environment. Moving Away From Stage II Vapor Recovery
 Department of the Environment Moving Away From Stage II Vapor Recovery 2013 Stage II Regulations Stakeholder Meeting November 12, 2013 Topics Covered Background The technical analyses What does it tell
Final Draft Ozone Transport Commission Electric Generating Unit Emission Inventory Analysis September 18, 2014
 Final Draft Ozone Transport Commission Electric Generating Unit Emission Inventory Analysis September 18, 2014 Executive Summary OTC Largest Contributor EGU Subgroup Introduction The Ozone Transport Commission
Emission and Air Quality Trends Review
 Emission and Air Quality Trends Review Georgia March 2012 1 Summary 2 Project Objective To develop and present publicly available information on trends in emissions and ambient air quality over the past
RETURN ON INVESTMENT LIQUIFIED NATURAL GAS PIVOTAL LNG TRUCK MARKET LNG TO DIESEL COMPARISON
 RETURN ON INVESTMENT LIQUIFIED NATURAL GAS PIVOTAL LNG TRUCK MARKET LNG TO DIESEL COMPARISON Year 1 Year 2 Year 3 Year 4 Year 5 Year 6 Year 7 Year 8 Year 9 Year 10 RETAIL BREAK EVEN AND IRR EXAMPLE FOR
Mobile Source Committee Update
 OTC Stakeholder Meeting September 24 th, 2014 Washington, DC OZONE TRANSPORT COMMISSION Mobile Source Committee Update 1 Committee Charge Goal: To identify potential strategies for consideration at the
NOx Emission Reduction Benefits of Future Potential U.S. Mobile Source Regulations
 NOx Emission Reduction Benefits of Future Potential U.S. Mobile Source Regulations June 2018 Manufacturers of Emission Controls Association 2200 Wilson Boulevard Suite 310 Arlington, VA 22201 (202) 296-4797
The Economic Downturn Lessons on the Correlation between Economic Growth and Energy
 The Economic Downturn Lessons on the Correlation between Economic Growth and Energy Demand presented to Indiana State Bar Association Utility Law Spring Seminar April 9, 2010 presented by Doug Gotham State
2013 Migration Patterns traffic flow by state/province
 Interstate and Cross-Border 2013 Migration Patterns traffic flow by state/province Based on 77,308 Interstate Household Goods Moves from January 1, 2013 through December 31, 2013 YUKON TERRITORY 0 0 BC
PM 2.5 Impacts From Ship Emissions in the Pacific Northwest. Robert Kotchenruther Ph.D. EPA Region 10 NW-AIRQUEST Meeting, June
 PM 2.5 Impacts From Ship Emissions in the Pacific Northwest Robert Kotchenruther Ph.D. EPA Region 10 NW-AIRQUEST Meeting, June 6-8 2012 Why look at ship emissions? Human Health & Ecosystem Concerns Health
The Northeast / Mid-Atlantic Low-Carbon Fuels Initiative Matt Solomon
 The Northeast / Mid-Atlantic Low-Carbon Fuels Initiative Matt Solomon MIT-NESCAUM Endicott House Symposium Dedham, MA August 12, 2009 What s an LCFS again? Performance-based standard for fuels Does not
2016 Migration Patterns traffic flow by state/province
 Interstate and Cross-Border 2016 Migration Patterns traffic flow by state/province Based on 75,427 Interstate Household Goods Moves from January 1, 2016 through December 15, 2016 NL 8 13 YUKON TERRITORY
Click to edit Master title style
 Click to edit Master title style Northeast Home Heating Oil Reserve (NEHHOR) June 16, 2011 Nancy Marland/Lindsay Partusch Operations and Readiness Office Petroleum Reserves 1 Northeast Click to edit Home
Inventory Levels - All Prices. Inventory Levels - By Price Range
 Inventory Levels - All Prices Idaho Falls Bonneville Total 3-Mar-17 152 108 260 2-Mar-18 109 78 187-28% Inventory Levels - By Price Range 3-Mar-17 2-Mar-18 0-100,000 41 6 100,001-125,000 19 8 125,001-150,000
Inventory Levels - All Prices. Inventory Levels - By Price Range
 Inventory Levels - All Prices Idaho Falls Bonneville Total 7-Apr-17 154 111 265 6-Apr-18 113 91 204-23% Inventory Levels - By Price Range 7-Apr-17 6-Apr-18 0-100,000 36 10 100,001-125,000 13 9 125,001-150,000
Honda Accord theft losses an update
 Highway Loss Data Institute Bulletin Vol. 34, No. 20 : September 2017 Honda Accord theft losses an update Executive Summary Thefts of tires and rims have become a significant problem for some vehicles.
Inventory Levels - All Prices. Inventory Levels - By Price Range
 Inventory Levels - All Prices Idaho Falls Bonneville Total 3-Nov-17 198 128 326 2-Nov-18 155 134 289-11% Inventory Levels - By Price Range 3-Nov-17 2-Nov-18 0-100,000 17 11 100,001-125,000 15 9 125,001-150,000
GoToBermuda.com. Q3 Arrivals and Statistics at September 30 th 2015
 Q3 Arrivals and Statistics at September 30 th 2015 1 Q3 Total Vacation Visitor Arrivals Q3 Arrivals 2014 2015 YTD 2014 YTD 2015 Air - Vacation 54,305 54,473 0.31% 168 117,639 116,700-0.80% (939) Cruise
Report on Analysis of the 2014 National Emissions Inventory for the CAPCOG Region and Selected Updates
 PGA 582-16-60851-01, Amendment 2 Task 2.1, Deliverable 2.1.3 Report on Analysis of the 2014 National Emissions Inventory for the CAPCOG Region and Selected Updates Prepared by the Capital Area Council
Regulatory and Permitting Requirements of Stationary Generators In Delaware
 Regulatory and Permitting Requirements of Stationary Generators In Delaware Delaware - DNREC Air Quality Management February 7, 2006 Mark A. Prettyman and Guadalupe J. Reynolds Outline Regulation No. 1144
THE EFFECTS OF RAISING SPEED LIMITS ON MOTOR VEHICLE EMISSIONS
 THE EFFECTS OF RAISING SPEED LIMITS ON MOTOR VEHICLE EMISSIONS Prepared for: Office of Policy Planning and Evaluation Energy and Transportation Sectors Division U.S. Environmental Protection Agency Washington,
DEAL ER DATAVI EW. Digital Marketing Index October 2017
 DEAL ER DATAVI EW Digital Marketing Index October 2017 DATA DRIVES STRATEGY. Dealer DataView is a monthly automotive digital marketing index, based on Dealer.com s proprietary data, research and analytics.
and Residual Oil Strategy
 Low Sulfur Distillate and Residual Oil Strategy MARAMA Workshop on Energy & Air Quality Issues September 23, 2008 Arthur Marin NESCAUM Regional Initiative for Low Sulfur Distillate/Residual Oil MANE-VU
FEB 2018 DEC 2017 JAN 2018 HOEP*
 Ontario Energy Report Q3 Electricity July September Electricity Prices Commodity Commodity cost comprises two components, the wholesale price (the Hourly Ontario Energy Price) and the Global Adjustment.
CO 2 Emissions from Cars, Trucks & Buses in the Metropolitan Washington Region
 CO 2 Emissions from Cars, Trucks & Buses in the Metropolitan Washington Region Presentation to the COG Climate Change Steering Committee Ronald F. Kirby Director of Transportation Planning June 27, 2007
Using PM 2.5 Monitoring Data to Track Pollution From Marine Vessels
 Using PM 2.5 Monitoring Data to Track Pollution From Marine Vessels How Effective have Fuel Sulfur Regulations Been at Reducing PM 2.5 from Ships? (an update to my 2015 NW-AIRQUEST talk) Robert Kotchenruther
MARAMA 2015 SCIENCE MEETING JULY 29-30, 2015 RICHMOND, VIRGINIA
 Air Permitting of Sources at Natural gas Production, Compression and Processing Facilities MARAMA 2015 SCIENCE MEETING JULY 29-30, 2015 RICHMOND, VIRGINIA Tom Wolf, Governor John Quigley, Secretary Overview
Technical Memorandum. Issue
 Technical Memorandum To: Julie McDill, P.E., Mid-Atlantic Air Management Association, Inc. From: John Barnes, P.E., Chief, Stationary Source Planning Section RE: NOx Reductions Low Sulfur Distillate Fuels
Solar Power: State-level Issues and Perspectives
 Solar Power: State-level Issues and Perspectives Sean Gallagher Vice-President, State Affairs Solar Energy Industries Association National Conference of State Legislators Solar Boot Camp August 24, 2016
ISO on Background. Energy-efficiency forecast. Anne George. Stephen J. Rourke VICE PRESIDENT, SYSTEM PLANNING DECEMBER 12, 2012
 DECEMBER 12, 2012 ISO on Background Energy-efficiency forecast Anne George VICE PRESIDENT, EXTERNAL AFFAIRS &CORPORATE COMMUNICATIONS Stephen J. Rourke VICE PRESIDENT, SYSTEM PLANNING Agenda 11:00-11:05
Impact of Distributed Energy Resources on Transmission System Reliability
 S E P T E M B E R 1 3, 2 0 1 8 W E B I N A R Impact of Distributed Energy Resources on Transmission System Reliability National Council on Electricity Policy (NCEP) Alan McBride D I R E C T O R, T R A
Alaska (AK) Passenger vehicles, motorcycles 1959 and newer require a title ATV s, boats and snowmobiles do not require a title
 Passenger vehicles, motorcycles 1959 and newer require a title ATV s, boats and snowmobiles do not require a title") Alabama (AL) Passenger vehicles 1975 and newer require a Motorcycles, mopeds and trailers 1975 and newer require a ATVs, snowmobiles and boats do not require a Alaska (AK) Passenger vehicles, motorcycles
Alabama (AL) Passenger vehicles 1975 and newer require a Motorcycles, mopeds and trailers 1975 and newer require a ATVs, snowmobiles and boats do not require a Alaska (AK) Passenger vehicles, motorcycles
Manufactured Home Shipments by Product Mix ( )
") Manufactured Home Shipments by Product Mix (1990-2014) Data Source: Institute for Building Technology and Safety (IBTS) * "Destination Pending" represents month-end finished home inventory at a plant.
Manufactured Home Shipments by Product Mix (1990-2014) Data Source: Institute for Building Technology and Safety (IBTS) * "Destination Pending" represents month-end finished home inventory at a plant.
SEP 2016 JUL 2016 JUN 2016 AUG 2016 HOEP*
 Ontario Energy Report Q1 Electricity January March Electricity Prices Commodity Commodity cost comprises of two components, the wholesale price (the Hourly Ontario Energy Price) and the Global Adjustment.
Evolution Of Tier 4 Regulations & Project Specific Diesel Engine Emissions Requirements
 Evolution Of Tier 4 Regulations & Project Specific Diesel Engine Emissions Requirements Association of Equipment Managers (AEM) CONEXPO / CON-AGG 2014 Las Vegas, NV March 5, 2014 1 1 Topics To Be Covered
DEAL ER DATAVI EW. Digital Marketing Index August 2018
 DEAL ER DATAVI EW Digital Marketing Index August 2018 DATA DRIVES STRATEGY. The DataView is a monthly automotive digital marketing index, based on Dealer.com s proprietary data, research and analytics.
Section 10. Renewable Energy
 Section 1. enewable Energy Sources. The Nation consumed 6.2 quadrillion Btu of renewable energy in 23, accounting for 6 percent 1 of total energy consumption during the year. At 2.8 quadrillion Btu, conventional
ALLEGHENY COUNTY HEALTH DEPARTMENT (ACHD) AIR QUALITY PROGRAM
 AIR QUALITY PROGRAM") ALLEGHENY COUNTY HEALTH DEPARTMENT (ACHD) AIR QUALITY PROGRAM March 7, 2018 SUBJECT: Coraopolis Terminals DE LLC 9 Thorn Street Moon Township, PA 15108-0191 Allegheny County Title V Operating Permit No.
ALLEGHENY COUNTY HEALTH DEPARTMENT (ACHD) AIR QUALITY PROGRAM March 7, 2018 SUBJECT: Coraopolis Terminals DE LLC 9 Thorn Street Moon Township, PA 15108-0191 Allegheny County Title V Operating Permit No.
State of the States NATIONAL BIODIESEL BOARD. Jacobsen Conference. Shelby Neal. May 24, 2018 Chicago, IL
 NATIONAL BIODIESEL BOARD State of the States Jacobsen Conference May 24, 2018 Chicago, IL Shelby Neal Director of State Governmental Affairs National Biodiesel Board 1 NATIONAL BIODIESEL BOARD Represent
Daily Trends and Source Apportionment of Ultrafine Particulate Mass (PM 0.1 ) Over an Annual Cycle in a Typical California City
 Over an Annual Cycle in a Typical California City") Daily Trends and Source Apportionment of Ultrafine Particulate Mass (PM 0.1 ) Over an Annual Cycle in a Typical California City Toshihiro Kuwayama, Chris R. Ruehl, and Michael J. Kleeman* Department of
Daily Trends and Source Apportionment of Ultrafine Particulate Mass (PM 0.1 ) Over an Annual Cycle in a Typical California City Toshihiro Kuwayama, Chris R. Ruehl, and Michael J. Kleeman* Department of
Pollution from ships in Copenhagen Port and the effect on city air quality
 June 4, 2014 Pollution from ships in Copenhagen Port and the effect on city air quality Helge Rørdam Olesen DCE Danish Centre for Environment and Energy Department of Environmental Science With input from
Performance Measure Summary - New York-Newark NY-NJ-CT. Performance Measures and Definition of Terms
 Performance Measure Summary - New York-Newark NY-NJ-CT There are several inventory and performance measures listed in the pages of this Urban Area Report for the years from 1982 to 2014. There is no single
PRISM. Performance and Registration Information Systems Management. IRP Annual Meeting 2016 Oklahoma City, OK May 2 4
 PRISM Performance and Registration Information Systems Management IRP Annual Meeting 2016 Oklahoma City, OK May 2 4 Dennis Piccolo, PRISM Project Manager (VOLPE) 1 What is PRISM? Cooperative Federal/State
Ambient PM 10 Monitoring Sechelt, B.C Update
 Ministry of Environment LOWER MAINLAND REGION Ambient PM 10 Monitoring Sechelt, B.C. 2004-2005 Update E N V I R O N M E N T A L Q U A L I T Y Library and Archives Canada Cataloguing in Publication Data
Streamlining Multiple Applicable Requirements
 Streamlining Multiple Applicable Requirements What is Streamlining? 1. Streamlining is the process of determining one set of requirements to be incorporated into the Title V permit from among multiple
APPENDIX D. REGULATIONS (excerpts) ON 24-HOUR EMISSION LIMITS: MARYLAND DEPARTMENT OF THE ENVIRONMENT
 ON 24-HOUR EMISSION LIMITS: MARYLAND DEPARTMENT OF THE ENVIRONMENT") APPENDIX D APPENDIX D REGULATIONS (excerpts) ON 24-HOUR EMISSION LIMITS: MARYLAND DEPARTMENT OF THE ENVIRONMENT DELAWARE DEPARTMENT OF NATURAL RESOURCES AND ENVIRONMENTAL CONTROL NEW JERSEY STATE DEPARTMENT
APPENDIX D APPENDIX D REGULATIONS (excerpts) ON 24-HOUR EMISSION LIMITS: MARYLAND DEPARTMENT OF THE ENVIRONMENT DELAWARE DEPARTMENT OF NATURAL RESOURCES AND ENVIRONMENTAL CONTROL NEW JERSEY STATE DEPARTMENT
Quarterly Hogs and Pigs
 Quarterly Hogs and Pigs ISSN: 19-1921 Released December 28, 2012, by the National Agricultural Statistics Service (NASS), Agricultural Statistics Board, United s Department of Agriculture (USDA). United
United States Army Corps of Engineers, New York District General Conformity Determination Notice
 United States Army Corps of Engineers, New York District General Conformity Determination Notice On October 30, 2012, New York State (DR-4085) and New Jersey State (DR-4086) declared Super Storm Sandy
Retail Electric Rates in Deregulated and Regulated States: 2016 Update
 Retail Electric Rates in Deregulated and Regulated States: 2016 Update Retail Electric Rates in Deregulated and Regulated States: 2016 Update The U.S. Department of Energy, Energy Information Administration
Retail Electric Rates in Deregulated and Regulated States: 2010 Update
 Retail Electric Rates in Deregulated and Regulated States: 2010 Update Published March 2011 1875 Connecticut Avenue, NW Washington, D.C. 20009-5715 202/467-2900 www.appanet.org Retail Electric Rates in
PRESENTATION ON STRATEGIC APPROACH TOWARDS WIND SOLAR HYBRID SYSTEMS (SWES) FOR REMOTE TELECOM SITES IN INDIA & CASE STUDY OF RAJASTHAN
 FOR REMOTE TELECOM SITES IN INDIA & CASE STUDY OF RAJASTHAN") PRESENTATION ON STRATEGIC APPROACH TOWARDS WIND SOLAR HYBRID SYSTEMS (SWES) FOR REMOTE TELECOM SITES IN INDIA & CASE STUDY OF RAJASTHAN WORKSHOP ON SMALL WIND ENERGY AND HYBRID SYSTEMS & ITS RELEVANCE
PRESENTATION ON STRATEGIC APPROACH TOWARDS WIND SOLAR HYBRID SYSTEMS (SWES) FOR REMOTE TELECOM SITES IN INDIA & CASE STUDY OF RAJASTHAN WORKSHOP ON SMALL WIND ENERGY AND HYBRID SYSTEMS & ITS RELEVANCE
ENERGY & AIR QUALITY ISSUES WORKSHOP
 ENERGY & AIR QUALITY ISSUES WORKSHOP BUILDING A SUSTAINABLE ENERGY FUTURE FOR A WARMING WORLD John Byrne University of Delaware September 23, 2008 Climbing Conventional Energy Prices: U.S. US Energy Price
RULE 4352 SOLID FUEL FIRED BOILERS, STEAM GENERATORS AND PROCESS HEATERS (Adopted September 14, 1994; Amended October 19, 1995; Amended May 18, 2006)
") RULE 4352 SOLID FUEL FIRED BOILERS, STEAM GENERATORS AND PROCESS HEATERS (Adopted September 14, 1994; Amended October 19, 1995; Amended May 18, 2006) 1.0 Purpose The purpose of this rule is to limit emissions
RULE 4352 SOLID FUEL FIRED BOILERS, STEAM GENERATORS AND PROCESS HEATERS (Adopted September 14, 1994; Amended October 19, 1995; Amended May 18, 2006) 1.0 Purpose The purpose of this rule is to limit emissions
DEAL ER DATAVI EW. Digital Marketing Index. June 2017
 DEAL ER DATAVI EW Digital Marketing Index June 2017 DATA DRIVES STRATEGY. Dealer DataView is a monthly automotive digital marketing index, based on Dealer.com s leading proprietary data, research and analytics.
What to Watch. on State Programs. E-Scrap 2018 Jason Linnell, National Center for Electronics Recycling
 What to Watch on State Programs E-Scrap 2018 Jason Linnell, National Center for Electronics Recycling About NCER National Center for Electronics Recycling: Non-profit 501c3, est. 2005, in Vienna, WV Involved
Failing the Grade: School Bus Pollution & Children s Health. Patricia Monahan Union of Concerned Scientists Clean Cities Conference May 13, 2002
 Failing the Grade: School Bus Pollution & Children s Health Patricia Monahan Union of Concerned Scientists Clean Cities Conference May 13, 2002 Outline School bus/diesel pollution and children s health
Price Category Breakdown - February 2010
 SINGLE FAMILY RESIDENTIAL BREAKDOWN ruary 21 ruary Sales and Average Price Increase Annually TORONTO - Wednesday, March 3, 21 7.3 % 24.6 % 1.8 % 7.3%.2%.1 % Greater Toronto REALTORS reported 7,291 sales
Performance Measure Summary - Boston MA-NH-RI. Performance Measures and Definition of Terms
 Performance Measure Summary - Boston MA-NH-RI There are several inventory and performance measures listed in the pages of this Urban Area Report for the years from 1982 to 2014. There is no single performance
EPA s National Clean Diesel Campaign and the North American ECA
 EPA s National Clean Diesel Campaign and the North American ECA AAPA-ESPO Meeting March 23, 2011 Office of Transportation & Air Quality Jim Blubaugh U.S. Environmental Protection Agency Overview Reducing
Clean Energy Policy & Procurement- Regional v. Go-It-Alone Approach
 Clean Energy Policy & Procurement- Regional v. Go-It-Alone Approach Dan Bosley Government Relations Executive Northeast Clean Energy Council November 17, 2016 Northeast Clean Energy Council NECEC s mission
ALLEGHENY COUNTY HEALTH DEPARTMENT AIR QUALITY PROGRAM
 ALLEGHENY COUNTY HEALTH DEPARTMENT AIR QUALITY PROGRAM June 17, 2004 SUBJECT: Review of Application Title V Operating Permit Bellefield Boiler Plant Boundary Street Pittsburgh, PA 15213 RE: Operating Permit
Monthly Market Detail - June 2018 Single Family Homes Miami-Dade County
 ly Market Detail - June 218 Summary Statistics June 218 June 217 Paid in Cash 1,335 1,346 -.8% 286 33-5.6% $355, $335, 6.% Average Sale Price Dollar Volume $598,494 $57,82 18.% $799. Million $682.5 Million
Monthly Market Detail - June 2018 Townhouses and Condos Miami-Dade County
 ly Market Detail - June 218 Summary Statistics June 218 June 217 Paid in Cash 1,257 1,323-5.% 657 682-3.7% $24, $235, 2.1% Average Sale Price Dollar Volume $439,546 $384,319 14.4% $552.5 Million $58.5
Summary Statistics. Closed Sales. Paid in Cash. Median Sale Price. Average Sale Price. Dollar Volume. Median Percent of Original List Price Received
 ly Market Detail - May 218 Summary Statistics May 218 May 217 Paid in Cash 1,667 1,647 1.2% 888 943-5.8% $168, $159, 5.7% Average Sale Price Dollar Volume $231,288 $21,944 9.6% $385.6 Million $347.4 Million
A Clean Diesel State of Mind Top States for Diesel Drivers
 A Clean Diesel State of Mind Top States for Diesel Drivers Growing Clean Diesel Cars, Trucks and SUVs: June 4, 2014 2:00 pm ET Press Conference #cleandiesel Today s Virtual Press Conference Welcome and
BLACK KNIGHT HPI REPORT
 CONTENTS 1 OVERVIEW 2 NATIONAL OVERVIEW 3 LARGEST STATES AND METROS 4 MARCH S BIGGEST MOVERS 5 20 LARGEST STATES 6 40 LARGEST METROS 7 ADDITIONAL INFORMATION OVERVIEW Each month, the Data & Analytics division
Mobile Source Air Toxics: Overview and Regulatory Background
 Mobile Source Air Toxics: Overview and Regulatory Background Melanie Zeman USEPA Region 2 Northern Transportation & Air Quality Summit August 14, 2008 About MSATs More than 1000 compounds have been identified
3.1 Air Pollution Control Officer (APCO): as defined in Rule 1020 (Definitions).
: as defined in Rule 1020 (Definitions).") RULE 4352 SOLID FUEL FIRED BOILERS, STEAM GENERATORS AND PROCESS HEATERS (Adopted September 14, 1994; Amended October 19, 1995; Amended May 18, 2006; Amended December 15, 2011) 1.0 Purpose The purpose
RULE 4352 SOLID FUEL FIRED BOILERS, STEAM GENERATORS AND PROCESS HEATERS (Adopted September 14, 1994; Amended October 19, 1995; Amended May 18, 2006; Amended December 15, 2011) 1.0 Purpose The purpose
All Applicants - By HS GPA Run Date: Thursday, September 06, Applicants GPA Count % of Total
 All Freshmen: 3 Year Comparison of Fall Applications Received, Degree, Net s and Net s GPA All - By HS GPA Net s 3.900-4.000 1932 44.3 1840 55.8 441 57.0 24.0 35 1395 3.800-3.899 301 6.9 267 8.1 54 7.0
increase of over four per cent compared to the average of $409,058 reported in January 2010.
 SINGLE FAMILY RESIDENTIAL BREAKDOWN uary 211 26.8 % 1.7 % 7.%.4%.1 % Good Start to 211 TORONTO - February 4, 211 Greater Toronto REALTORS reported 4,337 transactions through the TorontoMLS system in uary
MONTHLY NEW RESIDENTIAL SALES, APRIL 2017
 FOR RELEASE AT 10:00 AM EDT, TUESDAY, MAY 23, MONTHLY NEW RESIDENTIAL SALES, APRIL Release Number: CB17-80 May 23, - The U.S. Census Bureau and the U.S. Department of Housing and Urban Development jointly
The Voice of International Merchant Shipping
 The ARACON Bunker Conference 2007 The Voice of International Merchant Shipping 18-19 October 2007 Niels Bjørn Mortensen Head of Marine Department NBM@BIMCO.org BIMCO presentation What is BIMCO? What is
Regional Greenhouse Gas Initiative Experience Cost and Effectiveness
 Regional Greenhouse Gas Initiative Experience Cost and Effectiveness EPRI 19 th Annual Energy and Climate Change Seminar Washington, DC May 13 & 14, 2014 Mike Hachey, Power Comm/Ind Rates Top 12 States
H.1 Construction Emissions
 Appendix H. Air Quality Analysis The methods used to calculate emissions of carbon monoxide (CO), volatile organic compounds (VOCs), oxides of nitrogen (NO X ), sulfur oxides (SO X ), particulate matter
Chapter 3.0 National Emissions Trends, 1900 to 1996
 Chapter 3.0 National Emissions Trends, 1900 to 1996 Historical trends in criteria air pollutant emissions (CO, NO x, VOC, SO 2, PM-10, and Pb) are presented in this chapter for the period 1900 through
OZONE TRANSPORT COMMISSION Ali Mirzakhalili, P.E. Stationary and Area Sources Committee OZONE TRANSPORT COMMISSION
 OTC /MANE-VU Committees Meeting September 7, 2017 Hall of States, Washington DC. OZONE TRANSPORT COMMISSION Ali Mirzakhalili, P.E. Stationary and Area Sources Committee OZONE TRANSPORT COMMISSION 1 Stationary
Energy, Economic. Environmental Indicators
 Energy, Economic and AUGUST, 2018 All U.S. States & Select Extra Graphs Contents Purpose / Acknowledgements Context and Data Sources Graphs: USA RGGI States (Regional Greenhouse Gas Initiative participating
General Plan Approval and General Operating Permit BAQ-GPA/GP-5 and Proposed Exemption 38. Citizens Advisory Council Meeting March 19, 2013
 General Plan Approval and General Operating Permit BAQ-GPA/GP-5 and Proposed Exemption 38 Citizens Advisory Council Meeting March 19, 2013 Headings : White Text 40 pt. Calibri GP-5 General Information
Emissions Certification-Related Sales Restrictions; 2018 Model Year Passenger Cars and Trucks
 Emissions Certification-Related Sales Restrictions; 2018 Model Year Passenger Cars and Trucks Note: This letter is intended to provide general information to dealers about sales restrictions contained
CHAPTER 7: EMISSION FACTORS/MOVES MODEL
 CHAPTER 7: EMISSION FACTORS/MOVES MODEL 7.1 Overview This chapter discusses development of the regional motor vehicle emissions analysis for the North Central Texas nonattainment area, including all key
MONTHLY NEW RESIDENTIAL SALES, SEPTEMBER 2018
 FOR RELEASE AT 10:00 AM EDT, WEDNESDAY, OCTOBER 24, MONTHLY NEW RESIDENTIAL SALES, SEPTEMBER Release Number: CB18 160 October 24, The U.S. Census Bureau and the U.S. Department of Housing and Urban Development