Presented by: Mr. Priyo Iswanto Minister /Deputy Chief of Mission Embassy of the Republic of Indonesia Treviso, 20 March 2013
|
|
|
- Bonnie Price
- 5 years ago
- Views:
Transcription
1 Presented by: Mr. Priyo Iswanto Minister /Deputy Chief of Mission Embassy of the Republic of Indonesia Treviso, 20 March 2013
 Coastal Line: 54.")
 Multi-ethnic (More than 300 ethnic groups) Capital City :")
2 INDONESIA: THE LARGEST ARCHIPELAGIC STATE Total area : sq km (land: sq km; waters: sq km) Coastal Line: km (2nd in the world) 3 time zones (GMT +7 / +8 / +9) Population : 242 million people (4th in the world) Multi-ethnic (More than 300 ethnic groups) Capital City : Jakarta (Population >10 million) Unity in Diversity

3 POLITICAL SITUATION: STABLE Political parties in Indonesia: amount to 44 parties (2009 Election) Direct election Democracy Social Harmony Stability Women participation and representation is increasing Decision making at the regional or local level Decentralization Opportunities for the people Market
4 Economic Growth ,5% 6,2% 6,5% 6,3% GDP (PPP) USD 994,8 billion USD 1,056 trillion USD 1,209 trillion USD 1,212 trillion GDP per capita USD USD USD USD Public debt 29% of GDP 27,4% of GDP 25% of GDP 24,8% of GDP Budget deficit -1,8% -1,5% -1,6% -1,7% Total export USD 116,5 billion USD 157,7 billion Total import USD 96,8 billion USD 135,6 billion Total trade balance Total FDI ECONOMIC SITUATION: GROWING Surplus 19,6 billion Surplus USD 22,1 billion USD 203,4 billion USD 190 billion USD 177,4 billion USD 191,7 billion Surplus USD 26 billion Defisit USD -1,6 billion USD 10,7 billion USD 15,5 billion USD 19,3 billion USD 23 billion


5 Industrial production growth rate is 5,2 % Services include trade and investment Foreign trade accounts for around 30% of total GDP FDI accounts for around 70 percent of total investment


6 Indonesia is the largest market in Southeast Asia Over 50% of the population is under 29 years old, with the same percentage living in urban areas and adopting a modern lifestyle. Rising population of middle class (37,7% in ,9% in 2011) An increase of ±7 million every year Rising middle class in Indonesia help transform the country's consumer market
7 INDONESIA S LATEST SOVEREIGN RATINGS Source : Indonesia Investment Coordinating Board, 2013 RATING AGENCY RATINGS OUTLOOK Baa3 Stable BB+ Positive BBB - Positive
8 Political and Economic stability WHY INDONESIA? Competitive Labour Skillful; Productive age; Minimunwage : US$ 228/month Large Domestic Market Domestic market accounts 70% of total GDP Indonesians spend up to 50,6 % of their household income on food Huge Reserves of Energy and Natural Resources Natural gas; Coal; Geothermal; Palm Oil; Cocoa; Tin; Rubber; Nickel; Copper; Bauxite; Timber; Fisheries Legal Warranty Equal Treatment, No Minimum Capital Requirement, Free to Repatriate Investment & Profit, No nationalization, Dispute Settlement, Investment Services


9 Indonesia s potentials and natural resources
10 IMF: Indonesia s Economy will be the 6th Largest in the World by 2030
11 Indonesia Today and in th largest economy in the world 6 th largest economy in the world 45 million members of the consuming class 53% population in cities producing 74% of GDP 135 million members of the consuming class 71% population in cities producing 86% of GDP 55 million skilled workers 113 million skilled workers needed $ 0.5 trillion market opportunity in consumer services, agriculture and fisheries, resources and education $ 1.8 trillion market opportunity in consumer services, agriculture and fisheries, resources and education Source: McKinsey Global Institute(2012) 11
 economic corridors Main strategy of MP3EI: 1.")
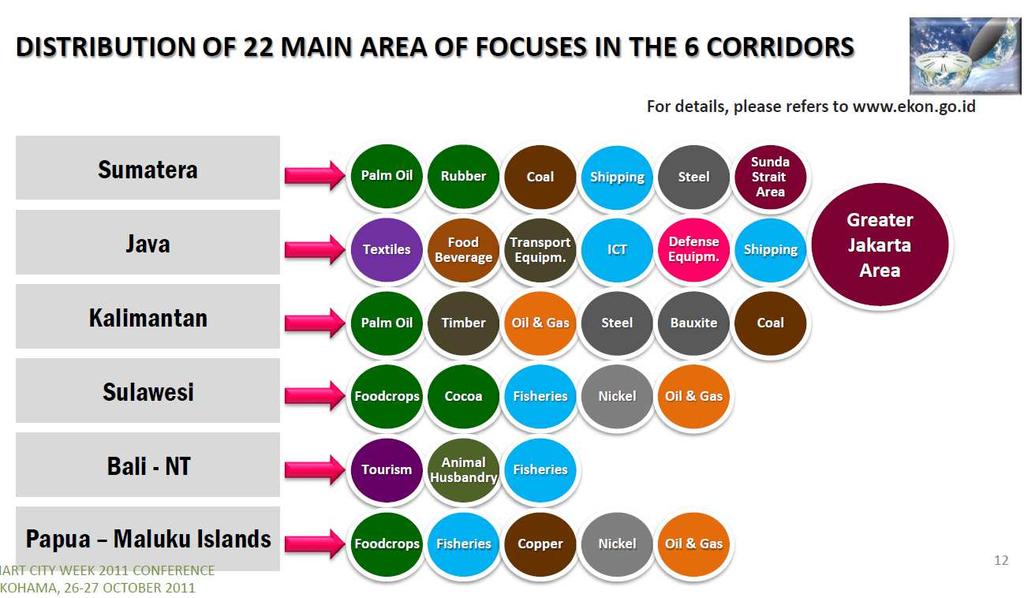
12 Indonesia Economic Corridors: Masterplan Basically MP3EI is based on these strategic initiatives: 1. Encourage a large scale investment realization in 22 main economic activities 2. Synchronization of national action plan to revitalize the real sector performance 3. The development of center of excellence in 6 (six) economic corridors Main strategy of MP3EI: 1. Economic potential development through economic corridor 2. Strengthening the national connectivity 3. Strengthening national human resources capability and science and technology 12


13 22 main economic activities in 8 main programs of MP3EI are identified in each economic corridor 13

14
15

16

17

18
19 MP3EI REALIZATION IN 2012 Total investment realization of MP3EI in 2012 reached Rp 623,91 trillion (USD 65,6 billion) with a total number of 184 projects Stakeholders Number of Projects Realization State-Owned Enterprises (BUMN) 57 Rp 121,89 trillion / USD 12,83 billion Private companies 70 Rp 275,24 trillion / USD 28,97 billion State Budget (APBN) 43 Rp 119,14 trillion / USD 12,54 billion Government and Private Cooperation Source: Ministry of Finance 14 Rp 107,53 trillion / USD 1,33 billion Rp 243 trillion (USD 25,57 billion) has been realized for infrastructure projects, which consist of roads, transportation, water and energy resources; with the largest investment allocation in transportation. Distribution of MP3EI projects: Sumatera (Rp127,8 trillion); Java (Rp 263,6 trillion); Kalimantan (Rp125.3 trillion); Sulawesi (Rp 74,4 trillion); Bali and NTT (Rp 44.4 trillion); Papua, Maluku, North Maluku, and West Papua (Rp 115,5 trillion)

20

21

22

23

24

25
")
26 (2x600MW) (1x600MW)

27
28


29 Automotive Industry Development Target MPV, Light Commercial Truck. 80% design of motor cycle. Area of Cooperation : 1. Green Car Industry 2. Base Production for certain Model of Vehicle 2010 Manufacture of engine, transmission for MPV and Light Commercial Truck. Supplier of component for MPV and Light Commercial Truck MPV, Commercial Truck s/d 24 ton, SUV and small economical sedan. 80% design of 4W motor vehicle for MPV and Light commercial truck. Manufacture of engine, transmission for Commercial Truck up to 24 ton, SUV and small economical sedan. Supplier of component for Commercial Truck up to 24 ton, SUV and small size sedan. MPV, SUV, Small economical sedan, Commercial truck > 24 ton, Medium size sedan, Hybrid car % design of 4W motor vehicle for sedan and SUV. Hybrid engine, ECU integration system. Commercial truck component > 24 ton, Medium size sedan, Hybrid car MPV, SUV, Small economical sedan, Commercial truck > 24 ton, Medium size sedan, Hybrid car and Luxury car. 80% design of 4W motor vehicle for medium size sedan. Manufacture of luxury car quality component. Supplier of luxury car quality component. 29
 up to 50,000 dwt National shipbuilding and Engineering Center (NasDEC) invesment on big size")
 up to 80,000 dwt Design and engineering")


 for the ship that built in Indonesia Join Operation")

30 Shipbuilding Industry Development Target 2010 Capable to build any kind of ships (commercial ships, passenger ship, working ships) up to 50,000 dwt National shipbuilding and Engineering Center (NasDEC) invesment on big size shipyards, ship equipment and ship component industry to supply domestic market as well as export 2015 Capable to build any kind of ships (commercial ships, passenger ship, working ships) up to 80,000 dwt Design and engineering capability increase 2020 Capable to build any kind of ships (commercial ships, passenger ship, working ships) up to 200,000 dwt Design and engineering capability increase KKIGK= Shipbuilding Industrial Zone 2025 Capable to build any kind of ships (commercial ships, passenger ship, working ships) up to 300,000 dwt Design and engineering capability increase Area of Cooperation : Exchange employees of shipbuilding companies between Indonesian and Korea to Improve the quality of human resources Join operation of ship design such as : basic design, contract design, and Detail Engineering Drawing (DED) for the ship that built in Indonesia Join Operation and/or Foreign Direct Investment for developing shipyard to produce a good quality of new shipbuilding in Indonesia Join Operation and/or Foreign Direct Investment in ship equipment and ship component industry to supply domestic market as well as export. 30


31 Electronic & ICT Industry Development Target 2010 Toward Digital/ICT based and environment friendly products. Financial and Management Software Application, Animation and Content Industry Computer industry 2015 Manufacturing Software Application, Animation and Content Industry Digital/ICT based and environment friendly products and component developed Computer component industry and its supporting industries Wireless communication products ( Mobile phone, 4G Application) 2020 Shopisticated Software Application, Animation and Content Industry already developed Electronic and ICT Products using nano technology Local Telecommunication Industry plays significat role in domestic as well as international market 2025 Domestic Software Application, Animation and Content Industry dominate domestic and regional markets. Domestic wireless telecommunication industry has high competitiveness in domestic market and global market Indonesia become production base for consumers electronics and control/measurement devices industry in ASEAN and Asia Area of Cooperation: 1. ICT system for road transportation (Electronic Toll card system,etc) 2. Digital base Electronic Industry 3. Mobile Phone Industry 31


.")

32 Machinery Industry Development Target 2010 Spread and improvement of agricultural machinery industries outside Java, one of the efforts is establishing center of agricultural machinery Reestablishment of national tooling machine industry, although still limited within certain specification product Establishment Medical Device Industries in Indonesia 2015 Realization of turbine manufacturing in power plant as well as industrial purposes Realization of some of the use of machine-made equipment in the country in a restructuring program sugar mill TURBINE 2025 Increase the human resource capacity to support industrial machinery equipment Increasing the ability of industrial machinery equipment to fulfill the needs of machinery equipment Increasing the new investment / business expansion and spread of common equipment machinery industries in Java and outside Java Increasing the ability of industrial machinery equipment to produce capital goods Power Plant AREA OF COOPERATION : Joint Investment of Textile and Sugar Machinery Industry to support restructuring program for Textile and Sugar Industry (Modernizing production Facility). Joint Investment and/or joint operation to build Power Plant to support MW second stage program. Joint Investment to develop supporting Industry (Machinery) for Energy Sector Joint Investment to develop Medical Device (Disposal product) 32

33 Steel Industry Development Target 2010 Mid Term Target ( ) 1. Optimalized installed capacity of crude steel industry (6.0 million tons / year) 2. Developed domestic supporting industries / workshops 3. Increasing steel consumption from 29 kg/capita in 2004 to 44 kg/capita in Established of information exchange to encourage synergies among the upstream and downstream national steel industry with associated institutions 2015 Long Term Target ( ) The growth of making coal-based iron industry (coal base), which used gas and iron ore local with capacity of 5 million tons / year 2. The growth of pelletizing and pig iron with a capacity of 2.5 million tons / year 3. The development of iron making industry from 1.5 million tons / year to 3.0 million tons / year 4. The development of crude steel industries from 6.0 million tons / year to 10 million tons / year 5. Integrated steel smelting industry with stainless steel industry (slabs, HRC and CRC) 6. The development of steel industry (HRC, Plate, CRC, and long product to 20 million / year 7. The increase in steel consumption to 100 kg/capita in 2025 Area of Cooperation : Slab and HRC Industry PT Krakatau POSCO, a joint venture between PT. Krakatau Steel and POSCO (Pohang Iron and Steel Corporation) located at Krakatau Industrial Estate Cilegon has been established to produce slab and HRC with capacity MT/year. Plant construction will be done in two phases, the first phase the factory will be built with a capacity of 3 million tons which will be completed in The second phase will be completed two years later. 33
34 LIST OF BUSINESS FIELDS CLOSED TO Agriculture - Marijuana Cultivation INVESTMENT Forestry -Capturing of Fish Species as Stated in Appendix I (CITES), The use (removal) of coral/atoll from nature for construction material Industry -Alcohol Beverage Industry, Mercury processed Chlorine Alkali Maker, Chemical Material Industry that can damage the environment, Chemical Material Industry Schedule 1 Chemical Weapon Convention Transportation -Providing and Implementation of Land Terminals, Implementation and Operation of Weight Stations, Implementation of Motor Vehicle Type Tests, Implementation of Motor Vehicle Periodic Tests, Telecommunication/Supporting Facility of Shipping Navigation, Vessel Traffic Information System (VTIS), Air Traffic Guiding Service Communication and Informatics -Management and Implementation of Radio Frequency and Satellite Orbit Spectrum Monitoring Stations Culture & Tourism - Public Museums, Historical and Ancient Heritage, Residential/Traditional Environment, Monuments, Gambling/Casinos
35 BILATERAL TRADE INDONESIA-ITALY TOTAL TRADE 2.047, , , , , ,8 EXPORT TO ITALY IMPORT FROM ITALY 1.380, , , , , ,0 667,5 999,2 726,2 909, , ,8 *In million USD Source: Ministry of Trade, Republic of Indonesia Main Indonesian exports to Italy: Coal, Palm Oil, Rubber, Footwear, Textile and textile products, Coffee, Tin, Pneumatic tyres, Coconut, Video recording equipments, Furniture, Chemical Woodpulp, Paper, Wood Main Indonesian imports from Italy: Machinery for cleaning; Taps, cocks, valves; Machines and mechanical appliances ; Tubes and pipes;parts and accessories of motor vehicles; Leather; Turbojets, turbo propellers and other gas turbines;motor cars and other motor vehicles; Telephone sets
36 ITALIAN FDI IN INDONESIA Year USD(million) , , , , , , ,9 (Source : Indonesia Investment Coordinating Board) In 2012, Pirelli pledged to invest in establishing a motorcycle tyre factory in Indonesia worth USD 130 million MAJOR ITALIAN COMPANIES IN INDONESIA: ENEL Il Ponte di Archimede ENI Saipem (gas) Perfetti OCRIM IVECO FIAT Piaggio Pirelli Coeclerici Fincantieri Finmeccanica Trevi (submarine) Mastrotto Top Italian Investments in Indonesia: 1. Hotel and Restaurant 2. Food Industry 3. Automotive 4. Health Equipment 5. Iron and Steel Industry 6. Leather Products and Footwear 7. Textile Industry 8. Chemical Industry and medicine 9. Transportation and Telecomunications
37 ITALY S RANK IN INDONESIA COMPARED TO OTHER EUROPEAN COUNTRIES IN 2012 Rank TRADE Rank INVESTMENT 1 Germany 7.263,5 1 Netherlands 966,5 2 Netherlands 5.544,5 2 UK 934,4 3 Italy 3.800,8 3 Switzerland 255,1 4 UK 3.063,0 4 France 158,7 5 France 3.055,1 5 Luxembourg 98,0 6 Spain 2.528,3 6 Germany 75,0 7 Belgium 1.925,8 7 Belgium 23,9 8 Sweden 1.465,0 8 Italy 22,9 9 Finland 646,5 9 Austria 6,8 10 Switzerland 600,1 10 Sweden 5,2 Source: Ministry of Trade (in million USD) Source: Indonesian Investment Board (in million USD)

38
TEXTILE INDUSTRY OF INDONESIA. By Indonesian Consul General in Mumbai
 TEXTILE INDUSTRY OF INDONESIA By Indonesian Consul General in Mumbai 1 Indonesian Textile Industry Overview The Ministry of Industry targets the textile industry and textile products (TPT) to grow by 6.3%
Press Release. Investment Realization from January to September 2015 Reaches Rp 400 T
 INDONESIA INVESTMENT COORDINATING BOARD Press Release Investment Realization from January to September 2015 Reaches Rp 400 T Jakarta, October 22, 2015 Indonesia Investment Coordinating Board (BKPM) today
INDONESIA INVESTMENT COORDINATING BOARD
 INDONESIA INVESTMENT COORDINATING BOARD Press Release Realization of Investment on Quarter II 2018 Hits Rp 176.3 T, Rose up 3.1 % Compared to Quarter II 2017 Jakarta, 14 August 2018 Indonesia Investment
Automotive Sector Investment
 Automotive Sector Investment In Indonesia Lely Sartika Deputy Director for Manufacturing Industries Promotion Prepared for EU-Indonesia Business Dialogue 2016 Jakarta 8 November 2016 2016 by Indonesia
Investment Opportunity in Indonesia Real Estate s Sector
 Investment Opportunity in Indonesia Real Estate s Sector Director, of Investment Planning for Services and Economic Zones Real Estate Investment Indonesia, Jakarta, 24 September 2018 1 Investment Target
Indonesia Steel Industry : Development & Opportunities
 Indonesia Steel Industry : Development & Opportunities Paris, 29th Sept 2017 THE INDONESIA IRON AND STEEL INDUSTRY ASSOCIATION TOPIC I OVERVIEW II STEEL INDUSTRY OPPORTUNITY III STEEL INDUSTRY DEVELOPMENT
Annual Report on National Accounts for 2015 (Benchmark Year Revision of 2011) Summary (Flow Accounts)
 Summary (Flow Accounts)") Annual Report on National Accounts for 2015 (Benchmark Year Revision of 2011) Summary (Flow Accounts) I. Overview of Benchmark Year Revision of 2011 P 2 II. Expenditure Series P 3 III. Income Series P
Annual Report on National Accounts for 2015 (Benchmark Year Revision of 2011) Summary (Flow Accounts) I. Overview of Benchmark Year Revision of 2011 P 2 II. Expenditure Series P 3 III. Income Series P
Gross Domestic Product 2014 Q4
 REPUBLIC OF RWANDA NATIONAL INSTITUTE OF STATISTICS OF RWANDA P.O.Box 6139 KIGALI - RWANDA Gross Domestic Product 2014 Q4 March 2015 I. Gross Domestic Product and its structure In the fourth quarter of
World Geographic Shares
 World Geographic Shares North America South America Europe Africa Asia Australia/ Oceania 18% 13% 7% 22% 33% 6% World Population Shares North America South America Europe Africa Asia Australia/ Oceania
Potency of Palm and Jatropha for Biofuel in Indonesia
 Potency of Palm and Jatropha for Biofuel in Indonesia Andi Novianto presented at: International Conference on the Commercialization of Bio-fuels Seoul, September 17, 2007 Energy Policy 2 Current Energy
Indian engineering TRANSFORMING TRANSMISSION
 Indian engineering TRANSFORMING TRANSMISSION A 2016 NASA photo of India s electrification. India to become the world s first country to use LEDs for all its lighting needs by 2019 (photograph courtesy
, 2012 ARUBA. Contents. Available. 1 Real sector A 1.2B 1.6A 1.6B 1.7A 1.7B. 1.9 Utilities Oil refining
 CENTRALE C BANK B VAN ARUBA STATISTICAL TABLES Third QUARTER 2011 Last updated January 13, 2012 Contents 1 Real sector 1.1 Gross Domestic Product 1.2A Business Perception Results 1.2B Business Perception
THE ADDAX & ORYX GROUP
 THE ADDAX & ORYX GROUP NOT AN OFFICIAL UNCTAD RECORD Using Gas for Africa s Energy Future Thierry Genthialon Chief Operating Officer of ORYX Oil & Gas 11th African Oil and Gas, Trade and Finance Conference
Contents of Paper. 06-Jan-17 SIGNIFICANCE OF COMMODITIES SECTOR TO MALAYSIAN ECONOMY, WITH EMPHASIS ON OIL PALM
 SIGNIFICANCE OF COMMODITIES SECTOR TO MALAYSIAN ECONOMY, WITH EMPHASIS ON OIL PALM Ahmad Fauzi, Puasa Deputy Director Malaysian Institute of Economic Research (MIER) 17 January 2017 Contents of Paper World
Investment Promotion Direction
 Investment Promotion Direction Metal Products, Machinery and Transport Equipment Industry, Mining, Ceramics and Basic Metals Industry By Chokedee Kaewsang Deputy Secretary General Thailand Board of Investment
Statistical tables S 0. Money and banking. Capital market. National financial account. Public finance
 Statistical tables Money and banking Page S South African Reserve Bank: Liabilities... 2 South African Reserve Bank: Assets... 3 Corporation for Public Deposits: Liabilities... 4 Corporation for Public
Table 1 ANTIGUA AND BARBUDA: MAIN ECONOMIC INDICATORS
 Antigua Tables 2006 1 Main Indicators 03/11/2006 08:05 AM Table 1 ANTIGUA AND BARBUDA: MAIN ECONOMIC INDICATORS 1996 1997 1998 1999 2000 2001 2002 2003 2004 2005 a/ Annual growth rates b/ Gross domestic
No.1-2. Key Economic Indicators. Bank Austria Economics and Market Analysis
 No.-2 2008 Key Economic Indicators Bank Austria Economics and Market Analysis Key Economic Indicators Issue -2/2008 Economic Forecasts for Austria Percentage change over previous year 2006 2007 2008 2
Country Report 9. Lao PDR Country Report. Leeber Leebouapao National Economic Research Institute. March 2008
 Country Report 9 Lao PDR Country Report Leeber Leebouapao National Economic Research Institute March 2008 This chapter should be cited as Leebouapao, L. (2008), Lao PDR Country Report, in Soesastro, H.
ELECTRICITY SUPPLY INDUSTRY OF BOTSWANA
 ELECTRICITY SUPPLY INDUSTRY OF BOTSWANA General Information for Potential Investors May 2008 This publication was produced for review by the United States Agency for International Development. It was prepared
Table 8. Gross Domestic Product by Industrial Origin at Current Market Prices, (Rp. Billion)
") Table 8. Gross Domestic Product by Industrial Origin at Current Market Prices, 1997-2003 1. Agriculture, Forestry & Fishery 101,009 172,828 215,687 217,898 246,298 281,325 76,693 74,437 77,305 a. Farm
Table 8. Gross Domestic Product by Industrial Origin at Current Market Prices, 1997-2003 1. Agriculture, Forestry & Fishery 101,009 172,828 215,687 217,898 246,298 281,325 76,693 74,437 77,305 a. Farm
1. INTERNATIONAL OVERVIEW. 1.0 Area and population. population (1,000) area
 area") 1.0 Area and population area population (1,000) km 2 2000 2010 2018 1 inhabitants per km 2 Belgium 30,530 10,251 10,920 11,443 375 Germany 357,380 82,212 81,777 82,952 232 Estonia 45,230 1,397 1,331 1,315
1.0 Area and population area population (1,000) km 2 2000 2010 2018 1 inhabitants per km 2 Belgium 30,530 10,251 10,920 11,443 375 Germany 357,380 82,212 81,777 82,952 232 Estonia 45,230 1,397 1,331 1,315
BRUNEI DARUSSALAM. Copies of this report are available to the public from
 IMF Country Report No. 16/310 September 2016 BRUNEI DARUSSALAM STATISTICAL APPENDIX This Statistical Appendix on Brunei Darussalam was prepared by a staff team of the International Monetary Fund. It is
Summary of Key Issues
 Summary of Key Issues The Manufacturing Production Index (MPI) in April 2017 shrank by 1.7 percent from last month, but shrank by 0.5 percent from the same period of last year. The major shrinking industries
Financial Results for First Half of FY2014 (April 1- September 30) Investor meeting. October 31, 2014
 Investor meeting. October 31, 2014") Financial Results for First Half of FY2014 (April 1- September 30) Investor meeting October 31, 2014 1 CONTENTS 1. Financial Results for First Half of FY2014 2. Forecast for FY2014 3. Cash Flow and Debt
Financial Results for First Half of FY2014 (April 1- September 30) Investor meeting October 31, 2014 1 CONTENTS 1. Financial Results for First Half of FY2014 2. Forecast for FY2014 3. Cash Flow and Debt
ASEAN became Korea s second largest trading partner under FTA
 11:00 AM KST, May. 31 ASEAN became Korea s second largest trading partner under FTA The Ministry of Trade, Industry and Energy announced on May 31 that in a decade since the Korea-Association of Southeast
Item
 332 Key Indicators of Developing Asian and Pacific Countries 333 001 POPULATION million; as of 1 July 47.72 48.71 49.68 50.64 51.58 52.51 53.43 54.33 55.21 55.84 56.57 57.29 58.01 58.71 59.40 60.00 60.60
Energy Security Challenges In Indonesia
 KEMENTERIAN BADAN USAHA MILIK NEGARA Energy Security Challenges In Indonesia Kementrian BUMN 6 Focus Areas to achieve Indonesia s growth trajectories The realization of 6 Focus Areas needs Massive Financial
Item
 Key Indicators for Asia and the Pacific 2010 POPULATION a Total population million; as of 1 July 18.17 18.55 18.93 19.33 19.73 20.14 20.56 20.99 21.42 21.87 22.32 22.79 23.30 23.82 24.36 24.91 25.47 26.04
The Struggle for Energy Democracy in the Philippines. Presentation to the PSI Asia Pacific Regional Forum on Quality Public Services
 The Struggle for Energy Democracy in the Philippines Presentation to the PSI Asia Pacific Regional Forum on Quality Public Services Imagine life without electricity Electricity is crucial to lighten up
Automotive Industry Profile
 Automotive Industry Profile No. Description 1. No. of car manufacturers 41 2. No. of Component 1.400 industries 3. Installed capacity/year 838.000 4. Labor forces 715.000 * Estimation 2012 Car Production
USDA Agricultural Outlook Forum 2007
 USDA Agricultural Outlook Forum 2007 EU BIOFUELS POLICY AND EFFECTS ON PRODUCTION, CONSUMPTION AND LAND USE FOR ENERGY CROPS Hilkka Summa Head of Unit for Bioenergy, Biomass, Forestry and Climate Change
THE CONSTRUCTION SECTOR OF INDONESIA *
 THE CONSTRUCTION SECTOR OF INDONESIA * Agita Widjajanto 1, Krishna S Pribadi 2, and Akhmad Suraji 3 1 Deputy Director for Investment Development, Center for Investment Resources Development, Ministry of
P anorama 12 Brazil automotive Guide 2008
 Panorama 12 Brazil Automotive Guide 2008 Although consolidated, and prominent amongst the largest global producers, the Brazilian automotive industry wants more: to be even better. The automotive industry
Money and banking. Flow of funds for the third quarter
 Statistical tables Money and banking Page S South African Reserve Bank: Liabilities... 2 South African Reserve Bank: Assets... 3 Corporation for Public Deposits: Liabilities... 4 Corporation for Public
National accounts and balance of payments
 1. Danish economy 1998 to 2008 Figure 1 Real growth in GDP 4 3 2 1 0-1 -2 Per cent 98 00 02 04 06 08 For further information visit www.statbank.dk/nat02. Economic downturn in 2008 The economic growth was
exports of goods annual change (%)
") 12.0 Austria s foreign trade 2015 by world region imports of goods 2015 exports of goods 2015 region 1 1 share (%) share (%) Europe 106,984 80.4 104,032 79.1 EU 93,686 70.4 90,841 69.1 EFTA 8,020 6.0 8,098
12.0 Austria s foreign trade 2015 by world region imports of goods 2015 exports of goods 2015 region 1 1 share (%) share (%) Europe 106,984 80.4 104,032 79.1 EU 93,686 70.4 90,841 69.1 EFTA 8,020 6.0 8,098
exports of goods annual change (%)
") 12.0 Austria s foreign trade 2016 by world region imports of goods 2016 exports of goods 2016 region 1 1 share (%) share (%) Europe 110,067 81.2 104,271 79.5 EU 96,801 71.4 91,112 69.4 EFTA 7,718 5.7 8,132
12.0 Austria s foreign trade 2016 by world region imports of goods 2016 exports of goods 2016 region 1 1 share (%) share (%) Europe 110,067 81.2 104,271 79.5 EU 96,801 71.4 91,112 69.4 EFTA 7,718 5.7 8,132
What s steering the UAE s automotive aftermarket?
 7 9 May 2017 Dubai World Trade Centre www.automechanikadubai.com What s steering the UAE s automotive aftermarket? The factors that matter As part of a series of reports provided by Automechanika Dubai
ECONOMIC SURVEY STATISTICAL APPENDIX
 ECONOMIC SURVEY 2017-18 STATISTICAL APPENDIX STATISTICAL APPENDIX : ECONOMIC SURVEY 2017-18 PAGE 1 National Income and Production 1.1 Gross National Income and Net National Income... A1-A2 1.2 Annual
Low Carbon Green Growth Roadmap for Asia and the Pacific FACT SHEET
 Smart grid Low Carbon Green Growth Roadmap for Asia and the Pacific FACT SHEET Key point The smart grid allows small- and medium-scale suppliers and individuals to generate and distribute power in addition
Steel Exporters Association is a professional body which represents iron and steel exporters in Turkey.
 Steel Exporters Association is a professional body which represents iron and steel exporters in Turkey. The association has more than 600 members as of September 2011. MAIN ACTIVITIES OF THE ASSOCIATION
No.1. Key Economic Indicators. Bank Austria Economics & Market Analysis
 No. 2009 Key Economic Indicators Bank Austria Economics & Market Analysis Key Economic Indicators Issue /2009 Economic Forecasts for Austria Percentage change over previous year 2007 2008 2 2009 2 200
Federated States of Micronesia
 IMF Country Report No. 13/17 Federated States of Micronesia 2012 ARTICLE IV CONSULTATION 2012 Statistical Appendix January 29, 2001 January 29, 2001 This Statistical Appendix paper for the Federated States
Labor Productivity, Compensation Costs, and U.S. International Competitiveness
 Cornell University ILR School DigitalCommons@ILR Federal Publications Key Workplace Documents June 1993 Labor Productivity, Compensation Costs, and U.S. International Competitiveness U.S. Bureau of Labor
As a result, the share of US in world industrial production should fall from 19.4% in 2012 to 18.5% by 2016 and decline to 17.6% by 2021.
 : Industry Overview GDP is expected to rise by 2.2% in 212 and expand by 2.1% in 213. Over the next 1 years to 221, GDP is predicted to grow on average by 2.8% a year. Manufacturing output growth is forecast
(1) Current State and Issues of the Electricity Sector in Indonesia
 Current State and Issues of the Electricity Sector in Indonesia") Japanese ODA Loan Ex-ante Evaluation 1. Name of the Project Country: The Republic of Indonesia Project: Java-Sumatra Interconnection Transmission Line Project (I) Loan Agreement: April 30, 2010 Loan Amount:
Japanese ODA Loan Ex-ante Evaluation 1. Name of the Project Country: The Republic of Indonesia Project: Java-Sumatra Interconnection Transmission Line Project (I) Loan Agreement: April 30, 2010 Loan Amount:
BREXIT AND THE AUTO INDUSTRY: FACTS AND FIGURES
 BREXIT AND THE AUTO INDUSTRY: FACTS AND FIGURES GLOBAL TRADE European Union EU vehicle imports: Total value: 45,693 million Quantity: 3,395,419 units EU vehicle exports: Total value: 135,398 million Quantity:
Midest is the world s largest show exclusively dedicated to industrial subcontracting and face to face meetings
 MIDEST 2000 1 Midest is the world s largest show exclusively dedicated to industrial subcontracting and face to face meetings Midest provides a pertinent response to the problems customers have in «sourcing
What are the Comparative Lessons? Ghana and Korea
 Panel Sponsored by What are the Comparative Lessons? Ghana and Korea Ghana Korea? 1970 GNP Per Capita $250 $260 4% 1995 GNP Per Capita $400 $9,700 24x 2002 GNP Per Capita $2,000 $16,480 8x 1970-1995 Growth
Baoshan Iron & Steel Co., Ltd. August 2010
 Baoshan Iron & Steel Co., Ltd. August 2010 1 Disclaimer: The following presentation distributed herewith includes forwardlooking statements. All statements, other than statements of historical facts, that
Statistical tables S 0. Money and banking. Capital market. National financial account. Public finance
 Statistical tables Money and banking Page S South African Reserve Bank: Liabilities... 2 South African Reserve Bank: Assets... 3 Corporation for Public Deposits: Liabilities... 4 Corporation for Public
Midwest Association of Rail Shippers
 January 13, 2016 Midwest Association of Rail Shippers Lance Fritz Chairman and CEO Union Pacific 1 2015 Economic Results Consumer-driven growth 1 Consumer Spending 2 Light Vehicle Sales 3.6% 3.0% 3.0%
STATISTICAL TABLES REAL SECTOR SECOND QUARTER 2018 Last updated August 17, 2018
 CENTRALE BANK VAN ARUBA STATISTICAL TABLES REAL SECTOR SECOND QUARTER 2018 Last updated August 17, 2018 Contents 1 Real sector 1.1 Gross Domestic Product 1.2A Business Perception Results 1.2B Business
Market Outlook for Malaysian Rubber Products in th February 2014
 Market Outlook for Malaysian Rubber Products in 2014 25 th February 2014 World Economic Scenario World Economic Outlook For 2014 World growth increase from 3% in 2013 to 3.7% in 2014 Advanced economies
Statistical tables S 0. Money and banking. Capital market. National financial account. Public finance
 Statistical tables Money and banking Page S : Liabilities... 2 : Assets... 3 Corporation for Public Deposits: Liabilities... 4 Corporation for Public Deposits: Assets... 5 Banks: Liabilities... 6 7 Banks:
INDONESIA EXPORT AND IMPORT, APRIL 2017
 No. 48/05/Th.XX, May, 15 th INDONESIA EXPORT AND IMPORT, APRIL Table 1. FOB Value of Indonesian Exports (Million US $) and Percentage of Change ( %) % Share Jan Apr March Jan Apr y-on-y m-on-m Jan Apr
PLANNING TO START OR EXPAND A BUSINESS?
 PLANNING TO START OR EXPAND A BUSINESS? LG&E and KU Energy s competitive energy rates, excellent reliability, and sustainability options provide a competitive advantage! OUR ENERGIES GO TO POWERING BUSINESSES
210 Index. diesel fuel Brazil, 73 Mexico, 99, 108 Thailand, 171, , 183n5 Turkey, 54 7 see also fuel prices
 Index AMIA (Mexican Association of the Automotive Industry), 90, 108 automobile demand ageing of population, 9 emerging economies, 206 7 financing, 8 post-recession, 1 2 role of income distribution and
Mazda Motor Corporation June 17, 2011
 FY ENDING MARCH 2012 FINANCIAL FORECAST New MAZDA Demio 13-SKYACTIV Mazda Motor Corporation June 17, 2011 1 PRESENTATION OUTLINE FY ending March 2012 Forecast Updates of Framework for Medium- and Long-term
The Malaysia Automotive Institute (MAI) is an agency under the Ministry of International Trade and Industry (MITI)
 is an agency under the Ministry of International Trade and Industry (MITI)") The Malaysia Automotive Institute (MAI) is an agency under the Ministry of International Trade and Industry (MITI) We are a think tank, tasked to strengthen the Malaysian automotive sector. An Intermediary
The Malaysia Automotive Institute (MAI) is an agency under the Ministry of International Trade and Industry (MITI) We are a think tank, tasked to strengthen the Malaysian automotive sector. An Intermediary
CETA prime sponsor management decisions and program goal achievement. rural oriented research and development projects: a review and synthesis
 Lawrence University Weeding List #475 Contact: Kimberly Knuppel at: kimberly.knuppel@lawrence.edu L 37.14: 45 L 37.14: 44 L 37.14: 43 L 37.14: 42 unlocking the second gate the implementation of CETA in
PUBLIC EXPOSE TAHUNAN PT INTAN BARUPRANA FINANCE TBK. Auditorium 5 th Floor, INTA HQ Building Jakarta, 27 Oktober 2015
 PUBLIC EXPOSE TAHUNAN PT INTAN BARUPRANA FINANCE TBK Auditorium 5 th Floor, INTA HQ Building Jakarta, 27 Oktober 2015 Key Company Highlights Vision, Mission, Strategy VISION To be Tier 1 Finance Company
BREXIT AND THE AUTO INDUSTRY: FACTS AND FIGURES
 BREXIT AND THE AUTO INDUSTRY: FACTS AND FIGURES GLOBAL TRADE European Union EU vehicle imports: Total value: 48,019 million Quantity: 3,640,975 units EU vehicle exports: Total value: 138,536 million Quantity:
ECONOMIC BULLETIN - No. 42, MARCH Statistical tables
 ECONOMIC BULLETIN - No. 42, MARCH 2006 APPENDIX Appendix Statistical tables The world economy Table a1 Gross domestic product a2 Industrial production a3 Consumer prices a4 External current account a5
Money and banking. Flow of funds for the first quarter
 Statistical tables Money and banking Page S South African Reserve Bank: Liabilities... 2 South African Reserve Bank: Assets... 3 Corporation for Public Deposits: Liabilities... 4 Corporation for Public
The Indian Infrastructure Industry
 n The Indian Infrastructure Industry DIBD OMII Own Man In India October 2010 Introduction to the Indian Infrastructure Industry Macro level Key drivers Government initiatives Future projects Danish infrastructural
BRUNEI DARUSSALAM STATISTICAL APPENDIX. International Monetary Fund Washington, D.C. IMF Country Report No. 15/146. June 2015
 June 2015 IMF Country Report No. 15/146 BRUNEI DARUSSALAM STATISTICAL APPENDIX This Statistical Appendix on Brunei Darussalam was prepared by a staff team of the International Monetary Fund. It is based
PV Off-Grid Market Trends and Business Opportunities in Southeast-Asia
 PV Off-Grid Market Trends and Business Opportunities in Southeast-Asia Project Development Programme (GIZ), Regine Dietz www.renewables-made-in-germany.com Brief Introduction to the Project Development
Total credit to the non-financial sector (core debt), % of GDP Table F1.1
, % of GDP Table F1.1") Total credit to the non-financial sector (core debt), % of GDP Table F1.1 2012 2013 2014 2015 2016 Q2 16 Q3 16 Q4 16 Q1 17 Q2 17 Argentina 62.6 66.4 64.6 75.5 75.3 81.7 80.1 75.3 71.6 72.7 Australia 208.0
Total credit to the non-financial sector (core debt), % of GDP Table F1.1 2012 2013 2014 2015 2016 Q2 16 Q3 16 Q4 16 Q1 17 Q2 17 Argentina 62.6 66.4 64.6 75.5 75.3 81.7 80.1 75.3 71.6 72.7 Australia 208.0
STATISTICAL TABLES RELATING TO INCOME, EMPLOYMENT, AND PRODUCTION
 A P P E N D I X B STATISTICAL TABLES RELATING TO INCOME, EMPLOYMENT, AND PRODUCTION C O N T E N T S NATIONAL INCOME OR EXPENDITURE Page B 1. Gross domestic product, 1960 2009... 328 B 2. Real gross domestic
STATE ECONOMIC IMPACT STUDY
 STATE ECONOMIC IMPACT STUDY Mercedes-Benz Subaru Honda Toyota INDIANA INTERNATIONAL AUTOMAKERS IN INDIANA MISHAWAKA AM GENERAL, LLC (MERCEDES-BENZ) OPENED in 2015 PRODUCES the R-class EXPORTS the R-class
 General Announcement::Astra's 2018 First Half Financial Statements http://infopub.sgx.com/apps?a=cow_corpannouncement_content&b=announcem... Page 1 of 1 26/7/2018 General Announcement::Astra's 2018 First
Review of Operations in FY2012
 Sales Segment Profit and Ratio Sales by Region for the Fiscal Year ended March 31, 2013 (To Outside Customers) 41 With respect to construction equipment, while demand increased in North America and Japan
Global Automotive Outlook
 Global Automotive Outlook The Race for Sales, Electric Cars, Profitability and Innovation Marco Hauschel Nathan Carlesimo Maxime Lemerle Economic Research September 2017 Update After a healthy recovery
Thermal Coal Market Presentation to UNECE Ad Hoc Group of Experts on Coal in Sustainable Development December 7, 2004
 Thermal Coal Market Presentation to UNECE Ad Hoc Group of Experts on Coal in Sustainable Development December 7, 2004 Barlow Jonker Pty Ltd Commercial in Confidence 1 Presentation Outline 1. Barlow Jonker
Export Oriented Enterprises (EOE) 1st Quarter Introduction This issue of Economic and Social Indicators (ESI) presents the results of the
 1st Quarter Introduction This issue of Economic and Social Indicators (ESI) presents the results of the") Export Oriented Enterprises (EOE) 1st Quarter 2018 1. Introduction This issue of Economic and Social Indicators (ESI) presents the results of the Quarterly Survey of Employment among Export Oriented Enterprises
Export Oriented Enterprises (EOE) 1st Quarter 2018 1. Introduction This issue of Economic and Social Indicators (ESI) presents the results of the Quarterly Survey of Employment among Export Oriented Enterprises
STATISTICAL ANNEX NOTE ON QUARTERLY PROJECTIONS
 OECD Economic Outlook, Volume 2017 Issue 1 OECD 2017 This annex contains data on key economic series which provide a background to the recent economic developments in the OECD area described in the main
SDT: KINGDOM OF TONGA NATIONAL ACCOUNTS STATISTICS
 SDT: 35-13 Statistics Department P.O. Box 149, Nuku alofa Government of Tonga Telephone: (676) 23-300 / 23-913 Email: dept@stats.gov.to Website: www.spc.int/prism/tonga/ Price: T$25.00 1 1 2 3 4 5 6 7
STATISTICAL TABLES RELATING TO INCOME, EMPLOYMENT, AND PRODUCTION
 A P P E N D I X B STATISTICAL TABLES RELATING TO INCOME, EMPLOYMENT, AND PRODUCTION C O N T E N T S GDP, INCOME, PRICES, AND SELECTED INDICATORS Page B 1. Percent changes in real gross domestic product,
PT Astra International Tbk 2017 Full Year Financial Statements
 To: Business Editor 27th February 2018 For immediate release PT Astra International Tbk 2017 Full Year Financial Statements The following announcement was issued today by the Company s 75%-owned subsidiary,
Modeling the impacts of Indonesia s REDD+ Initiatives to the Biodiesel Targets in the Green Economy Framework using System Dynamics
 Modeling for an Inclusive Green Economy Workshop Modeling the impacts of Indonesia s REDD+ Initiatives to the Biodiesel Targets in the Green Economy Framework using System Dynamics Akhmad Hidayatno akhmad.hidayatno@ui.ac.id
PT Astra International Tbk 2018 Third Quarter Financial Statements
 To: Business Editor 29th October 2018 For immediate release PT Astra International Tbk 2018 Third Quarter Financial Statements The following announcement was issued today by the Company s 75%-owned subsidiary,
JBIC-LPEM Workshop: Competitiveness in Indonesian Manufacturing: Issues and Prospects 3 November 2008, Shangri-La Hotel, Jakarta Indonesia
 JBIC-LPEM Workshop: Competitiveness in Indonesian Manufacturing: Issues and Prospects 3 November 2008, Shangri-La Hotel, Jakarta Indonesia Background tables for: Session 1: Trends in Indonesia s Manufacturing
Table 1. GDP per Capita, current prices, (US$)
") Table 1. GDP per Capita, current prices, -211 (US$) 21 22 23 24 25 26 27 28 29 211 Estimates Start After Brunei Darussalam 18,477 16,828 16,977 18,757 21,885 25,754 29,949 31,44 36,223 26,423 29,852 36,584
Table 1. GDP per Capita, current prices, -211 (US$) 21 22 23 24 25 26 27 28 29 211 Estimates Start After Brunei Darussalam 18,477 16,828 16,977 18,757 21,885 25,754 29,949 31,44 36,223 26,423 29,852 36,584
Global Metering Pump Market Research Report - Forecast to 2023
 Report Information More information from: https://www.marketresearchfuture.com/reports/2913 Global Metering Pump Market Research Report - Forecast to 2023 Report / Search Code: MRFR/E&P/2137-HCRR Publish
VIETNAM TRAFFIC SAFETY FOR 2 WHEELERS: CHALLENGES AND STRATEGIES. Trinh Thu Ha Deputy Chief Office National Traffic Safety Committee Vietnam
 VIETNAM TRAFFIC SAFETY FOR 2 WHEELERS: CHALLENGES AND STRATEGIES Trinh Thu Ha Deputy Chief Office National Traffic Safety Committee Vietnam 7 December 2017 12/7/2017 2 Content Vietnam Demographic-Society
PwC Autofacts. The Transformation of the Automotive Value Chain.
 www.pwc.de The Transformation of the Automotive Value Chain Research results on how the automotive transformation will impact value add October 18 DON T PANIC: The automotive transformation will bring
Investment Opportunities at POIC Lahad Datu
 Investment Opportunities at POIC Lahad Datu Bilson Kurus, Ph.D POIC Sabah Sdn Bhd International Joint Workshop on New Trends In Nano-Bio Technology 28 th November 2013, Hotel Le Meridien, Kota Kinabalu,
National Economic Estimating Conference Held July 12, 2018 FINAL Long-Run Tables
 TABLE OF CONTENTS SECTION PAGE Executive Summary 2 Real Expenditures 4 Components of Income 6 Employment and Output 7 Financial Markets 9 Prices 10 Nominal Expenditures 12 The National Economic Estimating
Mining and quarrying 13,503 19,062 26,170 35,190 38,511 53,515 74,386 85,792 99, ,422
 Table A1.1: Gross Domestic Product (GDP), at Factor Cost by kind of Economic Activity at Current Prices,Tanzania Mainland, 1992-2001 Millions of TZS Activity 1992 1993 1994 1995 1996 1997 1998 1999 2000
RKH Qitarat, the joint venture between Keolis, RATP Dev and Hamad Group, will operate the first Qatar public transport network
 RKH Qitarat, the joint venture between Keolis, RATP Dev and Hamad Group, will operate the first Qatar public transport network Doha, 7 December 2017 -- Qatar Rail, the national public transport operator,
Energy Efficiency: An engine for growth and development. Philippe Benoit Head, Energy Efficiency and Environment Division, IEA 8 June 2015
 Energy Efficiency: An engine for growth and development Philippe Benoit Head, Energy Efficiency and Environment Division, IEA 8 June 2015 EE: an important role? Energy efficiency can help drive economic
Indian Automotive Industry. An Opportunity
 Indian Automotive Industry An Opportunity PRESENTATION BY MR. DEEP KAPURIA CMD, HI-TECH GEARS LTD. TO VDA (Verband der Automobilindustrie), FRANKFURT ON JUNE 16, 2005 Agenda India : An Overview Accelerated
Cambodia. East Asia: Testing Times Ahead
 Key Indicators Cambodia 68 East Asia: Testing Times Ahead 2002 2003 2004 2005 2006 2007 /e 2008 /p 2009 /p Year Year Year Year Year Year Year Year Real GDP (% change, previous year) 6.5 8.5 10.0 13.5 10.8
Export Oriented Enterprises (EOE) 3 rd Quarter Introduction This issue of Economic and Social Indicators (ESI) presents the results of the
 3 rd Quarter Introduction This issue of Economic and Social Indicators (ESI) presents the results of the") Export Oriented Enterprises (EOE) 3 rd Quarter 2017 1. Introduction This issue of Economic and Social Indicators (ESI) presents the results of the Quarterly Survey of Employment among Export Oriented Enterprises
Export Oriented Enterprises (EOE) 3 rd Quarter 2017 1. Introduction This issue of Economic and Social Indicators (ESI) presents the results of the Quarterly Survey of Employment among Export Oriented Enterprises
Appendix B STATISTICAL TABLES RELATING TO INCOME, EMPLOYMENT, AND PRODUCTION
 Appendix B STATISTICAL TABLES RELATING TO INCOME, EMPLOYMENT, AND PRODUCTION C O N T E N T S Page NATIONAL INCOME OR EXPENDITURE: B. Gross domestic product, 959 005... 80 B. Real gross domestic product,
The Group is expected to continue benefiting from stable coal prices, but in the car market, competitive pressures are likely to intensify.
 PRESS RELEASE 24th April 2018 PT ASTRA INTERNATIONAL TBK 2018 FIRST QUARTER FINANCIAL STATEMENTS Highlights Net earnings per share down 2 at 123 Lower market share for cars and motorcycles Higher coal
DOWNSTREAM PETROLEUM 2017 DOWNSTREAM PETROLEUM
 DOWNSTREAM PETROLEUM Economic Contribution of the Industry KEY MESSAGES Australian refineries have been very long standing participants in the local market as the major transport fuel suppliers, with all