TEXTILE INDUSTRY OF INDONESIA. By Indonesian Consul General in Mumbai
|
|
|
- May Cain
- 6 years ago
- Views:
Transcription


1 TEXTILE INDUSTRY OF INDONESIA By Indonesian Consul General in Mumbai 1
National. In year 2015 Indonesian Textile sector contributed 1.22% to the national GDP Textile industry ranks third national exports and provide employment to 2.")
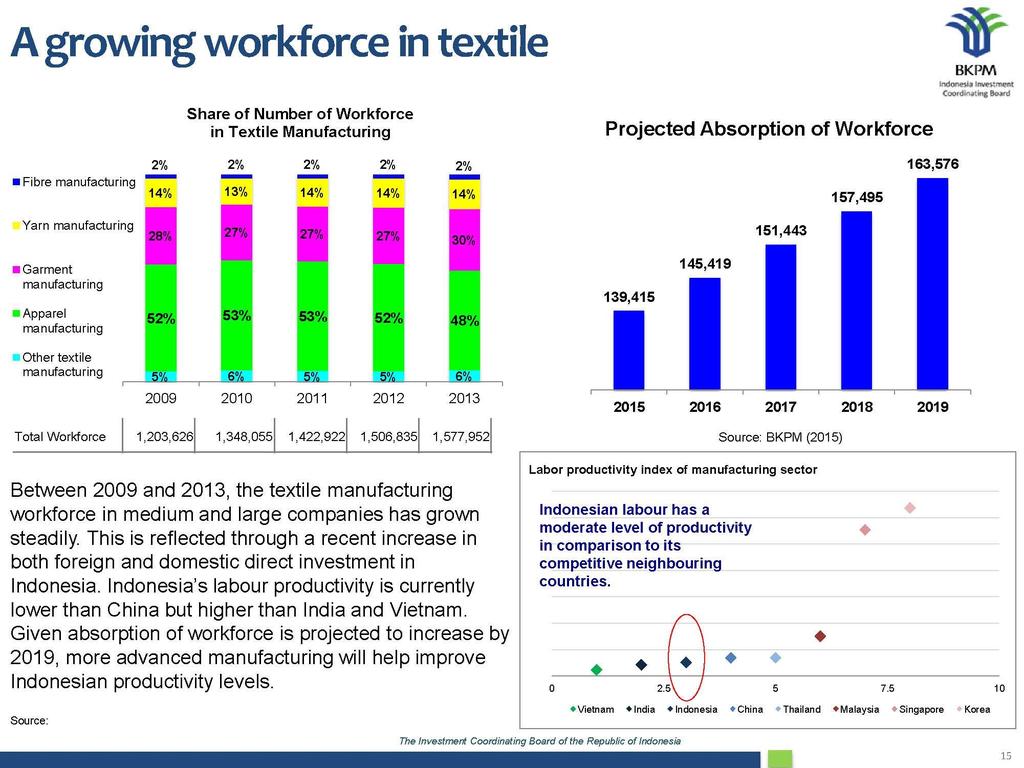
2 Indonesian Textile Industry Overview The Ministry of Industry targets the textile industry and textile products (TPT) to grow by 6.3% this year, and contributed 2.43% to gross domestic product (GDP)National. In year 2015 Indonesian Textile sector contributed 1.22% to the national GDP Textile industry ranks third national exports and provide employment to 2.79 million people or 23.15% of the total workforce of the manufacturing industry The production of textile industry meet 70% of domestic clothing needs. Value of textile exports reached US $ billion, contributing 8.17% to the total value of national exports by In the first quarter of 2016, the textile and apparel industry had contributed 1.21% of the nominal GDP, an increase compared to the fourth quarter/ 2015 amounted to 1.18%.
 region.")
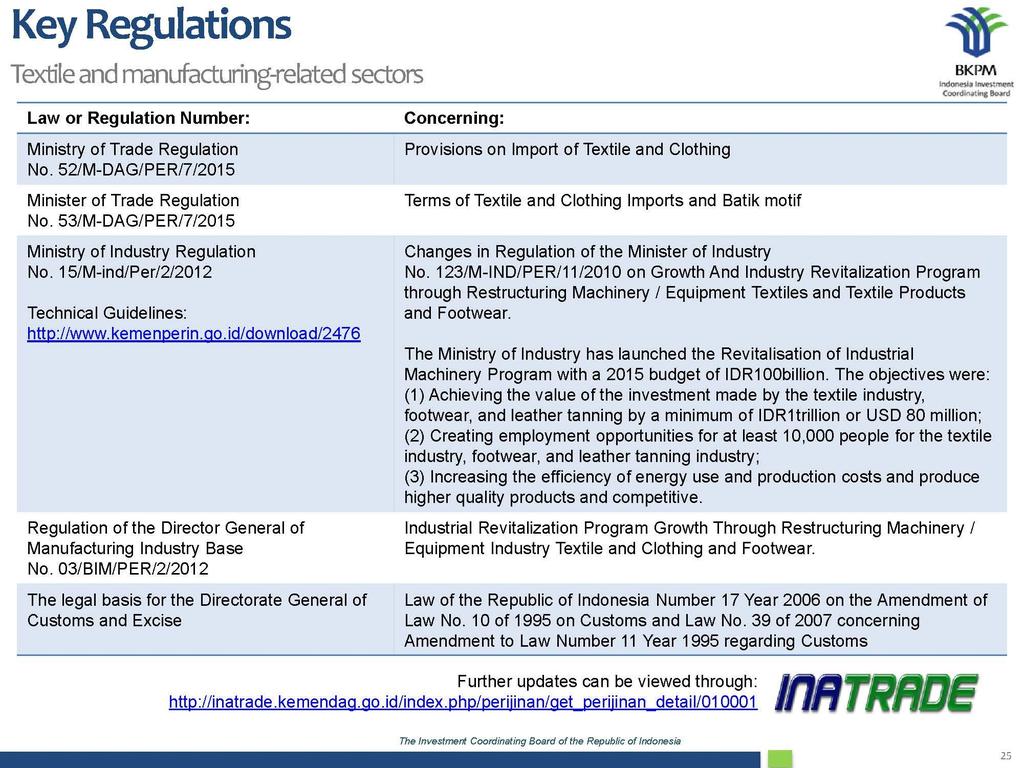
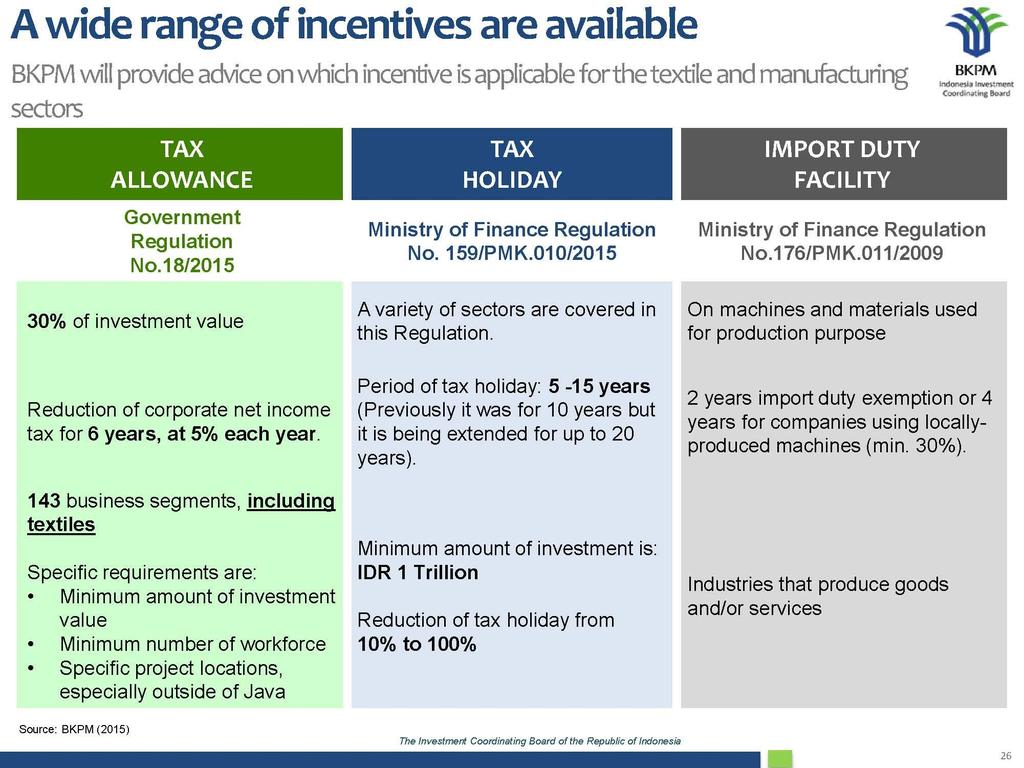
3 Indonesian Textile Industry Overview The Indonesian Ministry of Industry has committed to keeping up its support of the Indonesian textile industry through fiscal incentives to help the industry stay competitive on the global market. Indonesia continues to be a leading textile and apparel producer in the Association of Southeast Asian Nations (ASEAN) region. However, in contrast to several other ASEAN countries, Indonesia has not signed any trade agreements that allow for its textile exports to enter the U.S. or EU at special tariff rates, a circumstance that has affected the industry's competitiveness globally. Indonesia is pushing for a Comprehensive Economic Partnership Agreement (CEPA) with the EU that would reduce or eliminate trade barriers such as import tariffs. CEPA negotiations have not yet commenced.

4 Trade Partners in Textile Industry Indonesia stands 10th in the global textile and clothing trade. Its exports are majorly into clothing and man-made fibres and filament yarn while the imports consist of raw cotton, manmade filament yarn. Indonesia has an export market of about 12 bln US$ and is expected to emerge as one of the largest textile and clothing manufacturing hubs in the near future. Indonesia s is a recent entrant into the textile and clothing trade and its T&C industry has grown at a CAGR of 4.15% for the period Its major export markets are United States, Japan, Turkey, Germany and Korea, Rep. with a CAGR of -0.37%, 23.72%, 9.91%, 0.94% and 10.72% respectively. It majorly imports from China, Korea, Rep., Hong Kong, Taiwan and United States with a CAGR of 14.63%, 11.67%, 8.47%, 6.58% and 7.07% respectively.
 Sector Growth : 4.")
 Highest Minimum Wage by Province : US $260/month (DKI Jakarta)")


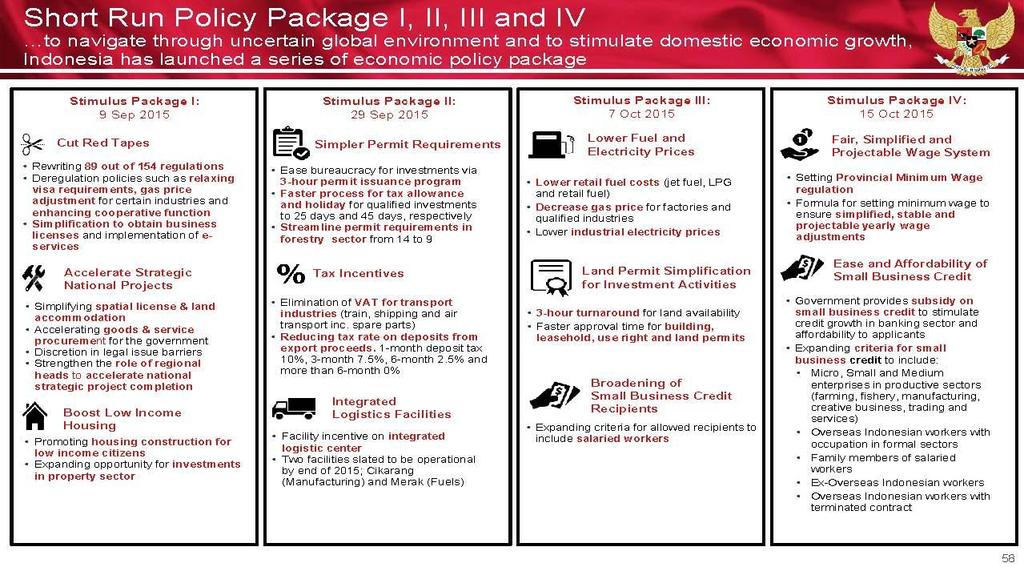
5 INDONESIAN MANUFACTURING SECTOR Indonesia Manufacturing Industry (Snapshot) Contribution to GDP : 18.5% (2015) Sector Growth : 4.33% (y/y, Q3 2015) Number Employed in the Sector : million (February 2015) Highest Minimum Wage by Province : US $260/month (DKI Jakarta) Lowest Minimum Wage by Province Main Areas Main Export Markets : US $120/month : Food & Beverages, Metal Products and Electronics, Automotive, Chemicals, Textile & Garment, Footwear etc : USA, Japan, China, Turkey, South Korea, Germany, Singapore, Thailand, Philippines, Saudi Arabia, Malaysia Indonesian Industry Ministry expects the manufacturing sector to achieve a +6 percent (y/y) growth pace in 2016 (from 5.04 percent y/y in the preceding year)
, up from 17.8 percent of GDP in the preceding year.")
6 Manufacturing Industry Indonesia Contributes 18.1% to GDP Indonesia's manufacturing industry was worth approx. USD $156 billion in 2015, contributing 18.1 percent to the country's gross domestic product (GDP), up from 17.8 percent of GDP in the preceding year. By 2035 the manufacturing industry s contribution share is targeted to have increase to 30 percent of GDP. Within Indonesia's (non-oil & gas) manufacturing industry the most important sector is the food and beverage industry. This industry accounts for 30.8 percent of the total non-oil & gas manufacturing industry of Indonesia and therefore constitutes a key engine for the overall economy.

7 INDONESIA MANUFACTURING SECTOR Sector Contribution to Manufacturing Industry An attractive sector for foreign direct investment. The country s manufacturin g sector is boosted by the large availability of cheap labour and rising consumption from the growing middle-class. Food & Beverage 30.84% Metal Goods, Electronics & Electrical Equipment 10.81% Transport Equipment 10.50% Chemicals, Pharmaceuticals & Traditional Medicines 9.98% Textiles & Apparel 6.65% Tobacco Processing 5.19% Primary Metals 4.31% Paper Products, Printing & Reproduction of Recorded Media 4.19% Rubber, Rubber Products & Plastics 4.10% Excavation goods (non-metals) 3.98% Wood, Wood Products 3.71% Machinery & Equipment 1.78% Leather, Leather Products & Footwear 1.50% Furniture 1.49% Others 0.99%
8
9
10
11
12
13
14
15

16 Shukriya.. Terima Kasih. Thank You. धन यव द


17 Shukriya.. Terima Kasih. Thank You. धन यव द

18 to Jakarta, Indonesia
19
20


21
22
23
24
25
26
27
28
29
30

31 SMES IN INDONESIAN ECONOMY In accordance with the Indonesia SMEs Law, micro enterprises are defined as enterprises with net assets less than IDR 50 million (land and buildings excluded) or enterprises which have less than IDR 300 million total annual sales. Small enterprises are enterprises with net assets from IDR 50 million to IDR 500 million (land and buildings excluded) or with total annual sales from IDR 300 million to IDR 2.5 billion. Medium-sized enterprises are those with net assets from IDR 500 million to IDR 10 billion (land and buildings excluded) or with total annual sales from IDR 2.5 to 50 billion. Besides governs the criteria of SMEs, Indonesia SMEs Law also governs about business environment, business development (production and processing, marketing, human resources, and design and technology), funding and collateral, partnership, and administrative and criminal sanction with regard to the violence of Indonesia SMEs Law.
32 Business Sectors and Number of Enterprises In Indonesia, SMEs represent approximately 57% of the country s gross domestic product (GDP) and employ more than 96% of its workforce. Women own about 23% of SMEs in Indonesia, and this figure is growing by 8% annually In terms of SME contribution to GDP within APEC, Indonesia and China had the two highest at 59% each. In Indonesia, SMEs also provided 92% of total employment. According to Indonesia s Ministry of Cooperatives and SMEs, the country has million SME business units, or approximately 99.99% of the total number of businesses. Business sectors of Indonesian SMEs: Agriculture, Animal Husbandry, Forestry and Aquaculture, Mining, Processing industries, Electricity, gas and water, Construction, Trading, hotel and restaurant, Trading, hotel and restaurant Transportation and communication Transportation and communication Finance and leasing Finance and leasing Services. Number of SMEs: Small Enterprises : about 99,80% of all enterprises, Medium Enterprises : about 0,14% of all enterprises About 56% of all SMEs have businesses in Agriculture, Animal Husbandry, Forestry and Aquaculture sectors To promote SMEs, the Ministry of Co-operative and SMEs established in March 2007 (SMESCO (Small and Medium Enterprises and Cooperatives) Indonesia Company). SMESCO s main goal is to promote Indonesian SMESCO sector internationally. Indonesian government initiative to support the financial access to SMEs is called Kredit Usaha Rakyat (KUR). The KUR program has created a positive impact on SMEs by supporting them with a source of finance that can be accessed easily.

 The Ministry of Trade of the Republic of Indonesia Total : US$ 4870000")
33 33 INDIAN BUSINESS DELEGATION AT TRADE EXPO INDONESIA 2015 Total Indian Visitors : 140 nos Indian business delegation : 50 nos Lead by Indonesian Embassy, New Delhi Indonesian Consulate General, Mumbai & Indonesian Trade Promotion Centre (ITPC), Chennai Total : US$ (Trade) The Ministry of Trade of the Republic of Indonesia Total : US$ (Investment)


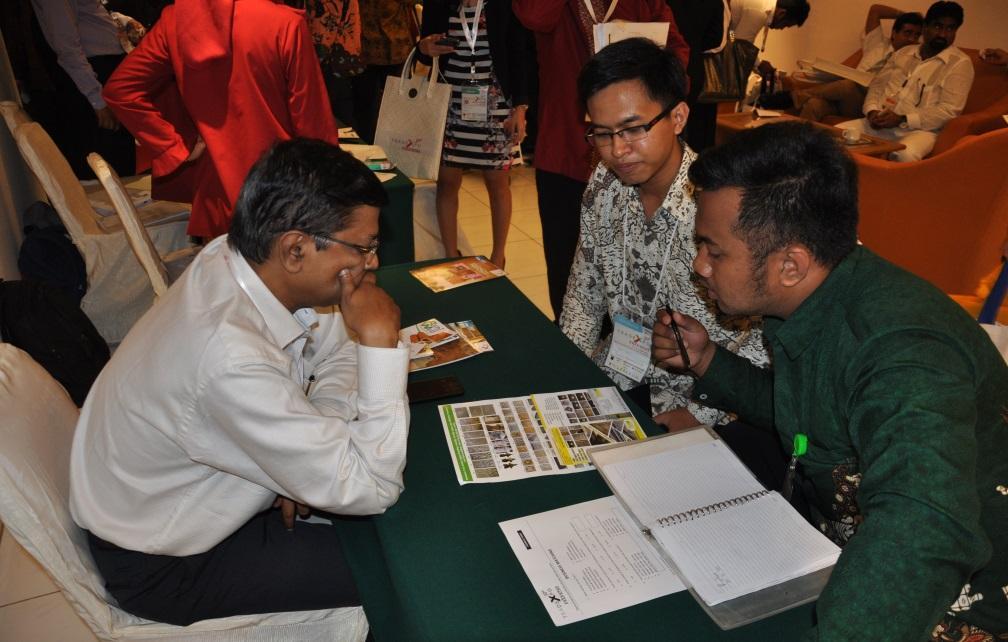
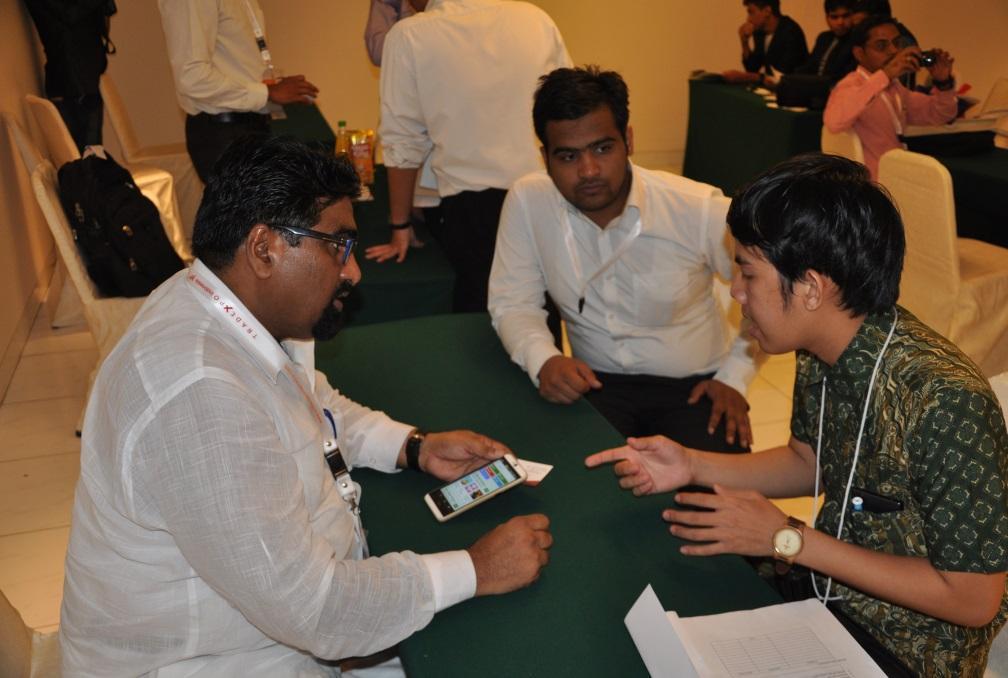
34 34 TRADE EXPO INDONESIA 2015 B2B MEETINGS


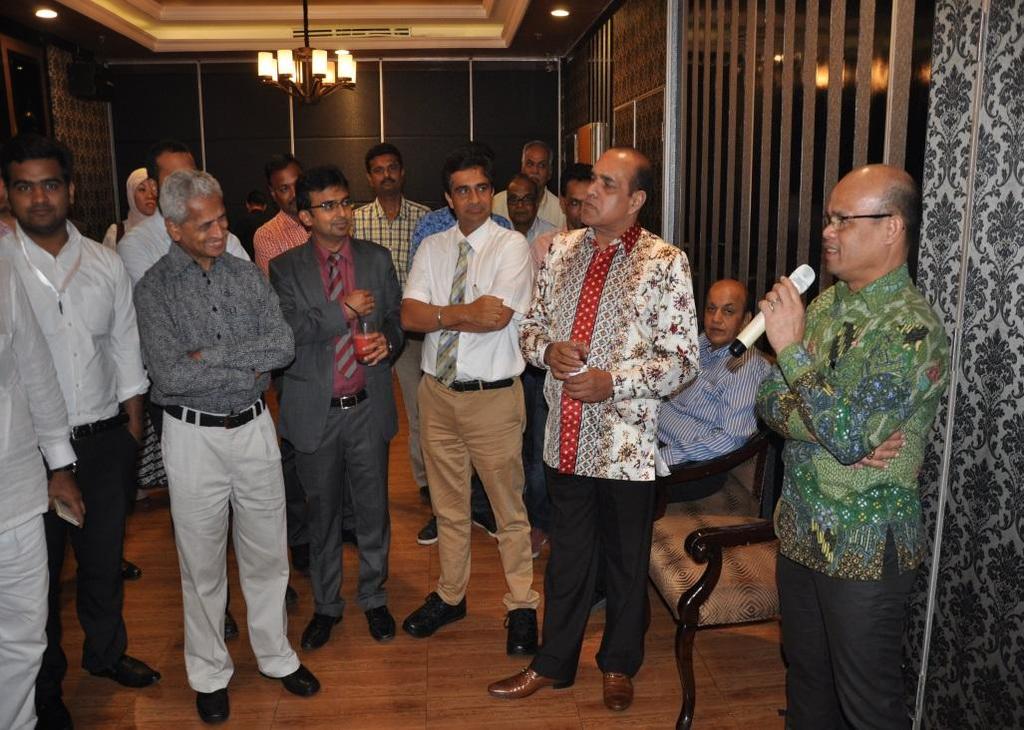
35 35 TRADE EXPO INDONESIA 2015 VARIOUS MEETINGS
ASEAN became Korea s second largest trading partner under FTA
 11:00 AM KST, May. 31 ASEAN became Korea s second largest trading partner under FTA The Ministry of Trade, Industry and Energy announced on May 31 that in a decade since the Korea-Association of Southeast
Indian engineering TRANSFORMING TRANSMISSION
 Indian engineering TRANSFORMING TRANSMISSION A 2016 NASA photo of India s electrification. India to become the world s first country to use LEDs for all its lighting needs by 2019 (photograph courtesy
Gross Domestic Product 2014 Q4
 REPUBLIC OF RWANDA NATIONAL INSTITUTE OF STATISTICS OF RWANDA P.O.Box 6139 KIGALI - RWANDA Gross Domestic Product 2014 Q4 March 2015 I. Gross Domestic Product and its structure In the fourth quarter of
BRUNEI DARUSSALAM. Copies of this report are available to the public from
 IMF Country Report No. 16/310 September 2016 BRUNEI DARUSSALAM STATISTICAL APPENDIX This Statistical Appendix on Brunei Darussalam was prepared by a staff team of the International Monetary Fund. It is
Export Oriented Enterprises (EOE) 1st Quarter Introduction This issue of Economic and Social Indicators (ESI) presents the results of the
 1st Quarter Introduction This issue of Economic and Social Indicators (ESI) presents the results of the") Export Oriented Enterprises (EOE) 1st Quarter 2018 1. Introduction This issue of Economic and Social Indicators (ESI) presents the results of the Quarterly Survey of Employment among Export Oriented Enterprises
Export Oriented Enterprises (EOE) 1st Quarter 2018 1. Introduction This issue of Economic and Social Indicators (ESI) presents the results of the Quarterly Survey of Employment among Export Oriented Enterprises
I. World trade in Overview
 I. World trade in - Overview Table I.1 Growth in the volume of world merchandise exports and production, 2-5 (Annual percentage change) 2-5 23 24 World merchandise exports 4.5 5. 9.5 6. Agricultural products
Summary of Key Issues
 Summary of Key Issues The Manufacturing Production Index (MPI) in April 2017 shrank by 1.7 percent from last month, but shrank by 0.5 percent from the same period of last year. The major shrinking industries
BRUNEI DARUSSALAM STATISTICAL APPENDIX. International Monetary Fund Washington, D.C. IMF Country Report No. 15/146. June 2015
 June 2015 IMF Country Report No. 15/146 BRUNEI DARUSSALAM STATISTICAL APPENDIX This Statistical Appendix on Brunei Darussalam was prepared by a staff team of the International Monetary Fund. It is based
JBIC-LPEM Workshop: Competitiveness in Indonesian Manufacturing: Issues and Prospects 3 November 2008, Shangri-La Hotel, Jakarta Indonesia
 JBIC-LPEM Workshop: Competitiveness in Indonesian Manufacturing: Issues and Prospects 3 November 2008, Shangri-La Hotel, Jakarta Indonesia Background tables for: Session 1: Trends in Indonesia s Manufacturing
Automotive Sector Investment
 Automotive Sector Investment In Indonesia Lely Sartika Deputy Director for Manufacturing Industries Promotion Prepared for EU-Indonesia Business Dialogue 2016 Jakarta 8 November 2016 2016 by Indonesia
Export Oriented Enterprises (EOE) 2nd Quarter 2018
 2nd Quarter 2018") Export Oriented Enterprises (EOE) 2nd Quarter 2018 1. Introduction This issue of Economic and Social Indicators (ESI) presents the results of the Quarterly Survey of Employment among Export Oriented Enterprises
Export Oriented Enterprises (EOE) 2nd Quarter 2018 1. Introduction This issue of Economic and Social Indicators (ESI) presents the results of the Quarterly Survey of Employment among Export Oriented Enterprises
Item
 Key Indicators for Asia and the Pacific 2010 POPULATION a Total population million; as of 1 July 18.17 18.55 18.93 19.33 19.73 20.14 20.56 20.99 21.42 21.87 22.32 22.79 23.30 23.82 24.36 24.91 25.47 26.04
Export Oriented Enterprises (EOE) 3 rd Quarter Introduction This issue of Economic and Social Indicators (ESI) presents the results of the
 3 rd Quarter Introduction This issue of Economic and Social Indicators (ESI) presents the results of the") Export Oriented Enterprises (EOE) 3 rd Quarter 2017 1. Introduction This issue of Economic and Social Indicators (ESI) presents the results of the Quarterly Survey of Employment among Export Oriented Enterprises
Export Oriented Enterprises (EOE) 3 rd Quarter 2017 1. Introduction This issue of Economic and Social Indicators (ESI) presents the results of the Quarterly Survey of Employment among Export Oriented Enterprises
Annual Report on National Accounts for 2015 (Benchmark Year Revision of 2011) Summary (Flow Accounts)
 Summary (Flow Accounts)") Annual Report on National Accounts for 2015 (Benchmark Year Revision of 2011) Summary (Flow Accounts) I. Overview of Benchmark Year Revision of 2011 P 2 II. Expenditure Series P 3 III. Income Series P
Annual Report on National Accounts for 2015 (Benchmark Year Revision of 2011) Summary (Flow Accounts) I. Overview of Benchmark Year Revision of 2011 P 2 II. Expenditure Series P 3 III. Income Series P
Item
 Key Indicators for Asia and the Pacific 2009 POPULATION Total population a thousand; as of 1 July 295 305 316 328 340 353 366 380 394 409 420 432 444 457 470 483 496 510 524 Population density persons
Promoting Continued Growth
 Promoting Continued Growth of the Automobile Industry in the ASEAN Region Fujio Cho Chairman, Japan Automobile Manufacturers Association Contents Intro: The World Automobile Market 1. The Automobile Market
As a result, the share of US in world industrial production should fall from 19.4% in 2012 to 18.5% by 2016 and decline to 17.6% by 2021.
 : Industry Overview GDP is expected to rise by 2.2% in 212 and expand by 2.1% in 213. Over the next 1 years to 221, GDP is predicted to grow on average by 2.8% a year. Manufacturing output growth is forecast
Conference on Regional Integration in Asia and the Emerging Trade Regime
 ITC Geneva, ICRIER, CII Conference on Regional Integration in Asia and the Emerging Trade Regime Supply Chain Linkages across borders in Asia : Automobile Industry Dilip Chenoy Director General SIAM New
Table 8. Gross Domestic Product by Industrial Origin at Current Market Prices, (Rp. Billion)
") Table 8. Gross Domestic Product by Industrial Origin at Current Market Prices, 1997-2003 1. Agriculture, Forestry & Fishery 101,009 172,828 215,687 217,898 246,298 281,325 76,693 74,437 77,305 a. Farm
Table 8. Gross Domestic Product by Industrial Origin at Current Market Prices, 1997-2003 1. Agriculture, Forestry & Fishery 101,009 172,828 215,687 217,898 246,298 281,325 76,693 74,437 77,305 a. Farm
Textile Per Capita Consumption
 November 2017 Textile Per Capita Consumption 2005-2022 Part 1: Lower middle income countries CHF300.- Table of Contents Preface... 4 Sources... 5 Definitions... 6 Charts... 7 Executive Summary... 9 Country
Indonesia Steel Industry : Development & Opportunities
 Indonesia Steel Industry : Development & Opportunities Paris, 29th Sept 2017 THE INDONESIA IRON AND STEEL INDUSTRY ASSOCIATION TOPIC I OVERVIEW II STEEL INDUSTRY OPPORTUNITY III STEEL INDUSTRY DEVELOPMENT
Item
 332 Key Indicators of Developing Asian and Pacific Countries 333 001 POPULATION million; as of 1 July 47.72 48.71 49.68 50.64 51.58 52.51 53.43 54.33 55.21 55.84 56.57 57.29 58.01 58.71 59.40 60.00 60.60
Making GVCs Inclusive for ASEAN. Cassey Lee, Dionisius Narjoko and Sothea Oum June 2016
 Making GVCs Inclusive for ASEAN Cassey Lee, Dionisius Narjoko and Sothea Oum June 2016 Project Description ERIA-ISEAS Project: Small Medium Enterprises (SME) in ASEAN and East Asia Regional Economic Integration
Discover Asia Pacific s business opportunities through CACCI. - Taiwan Perspective. KPMG Deal Advisory 18 September 2017
 Discover Asia Pacific s business opportunities through CACCI - Taiwan Perspective KPMG Deal Advisory 18 September 2017 Contents 1 KPMG s Successful Platform within ASEAN 2 Taiwan's Historical Investments
Market Outlook for Malaysian Rubber Products in th February 2014
 Market Outlook for Malaysian Rubber Products in 2014 25 th February 2014 World Economic Scenario World Economic Outlook For 2014 World growth increase from 3% in 2013 to 3.7% in 2014 Advanced economies
*SECTION C. Trade of ASEAN and Korea
 *SECTION C Trade of ASEAN and Korea 034 C1. ASEAN and Korea's Exports (Million US $ %) Country/Region 1980 1990 2000 2008 2009 Annual Growth Rate 1) Value Share Value Share Value Share Value Share Value
exports of goods annual change (%)
") 12.0 Austria s foreign trade 2015 by world region imports of goods 2015 exports of goods 2015 region 1 1 share (%) share (%) Europe 106,984 80.4 104,032 79.1 EU 93,686 70.4 90,841 69.1 EFTA 8,020 6.0 8,098
12.0 Austria s foreign trade 2015 by world region imports of goods 2015 exports of goods 2015 region 1 1 share (%) share (%) Europe 106,984 80.4 104,032 79.1 EU 93,686 70.4 90,841 69.1 EFTA 8,020 6.0 8,098
exports of goods annual change (%)
") 12.0 Austria s foreign trade 2016 by world region imports of goods 2016 exports of goods 2016 region 1 1 share (%) share (%) Europe 110,067 81.2 104,271 79.5 EU 96,801 71.4 91,112 69.4 EFTA 7,718 5.7 8,132
12.0 Austria s foreign trade 2016 by world region imports of goods 2016 exports of goods 2016 region 1 1 share (%) share (%) Europe 110,067 81.2 104,271 79.5 EU 96,801 71.4 91,112 69.4 EFTA 7,718 5.7 8,132
210 Index. diesel fuel Brazil, 73 Mexico, 99, 108 Thailand, 171, , 183n5 Turkey, 54 7 see also fuel prices
 Index AMIA (Mexican Association of the Automotive Industry), 90, 108 automobile demand ageing of population, 9 emerging economies, 206 7 financing, 8 post-recession, 1 2 role of income distribution and
Table B1. Advanced Economies: Unemployment, Employment, and Real per Capita GDP (Percent)
") Statistical Appendix Table B1. Advanced Economies: Unemployment, Employment, and Real per Capita GDP (Percent) Unemployment Rate 2 Averages 1 1993 2002 2003 12 Advanced Economies 6.8 6.9 6.7 6.5 6.3 5.8
Statistical Appendix Table B1. Advanced Economies: Unemployment, Employment, and Real per Capita GDP (Percent) Unemployment Rate 2 Averages 1 1993 2002 2003 12 Advanced Economies 6.8 6.9 6.7 6.5 6.3 5.8
BMW Group posts record earnings for 2010
 10.03.2011 BMW Group posts record earnings for 2010 Profit before tax rises to euro 4,836 million Profit before financial result climbs to euro 5,094 million Automobiles segment reports EBIT of euro 4,355
EXPORT-IMPORT BANK OF INDIA WORKING PAPER NO. 33
 EXPORT-IMPORT BANK OF INDIA WORKING PAPER NO. 33 Potential for Enhancing Trade with Korea Republic: A Brief Analysis EXIM Bank s Working Paper Series is an attempt to disseminate the findings of research
STATISTICAL ANNEX NOTE ON QUARTERLY PROJECTIONS
 OECD Economic Outlook, Volume 2017 Issue 1 OECD 2017 This annex contains data on key economic series which provide a background to the recent economic developments in the OECD area described in the main
Cambodia. East Asia: Testing Times Ahead
 Key Indicators Cambodia 68 East Asia: Testing Times Ahead 2002 2003 2004 2005 2006 2007 /e 2008 /p 2009 /p Year Year Year Year Year Year Year Year Real GDP (% change, previous year) 6.5 8.5 10.0 13.5 10.8
The trends driving Saudi Arabia s Commercial Vehicles market
 7 9 May 2017 Dubai World Trade Centre www.automechanikadubai.com The trends driving Saudi Arabia s Commercial Vehicles market Get to know the market This overview of Saudi Arabia s commercial vehicles
Business activities and opportunities by Japanese companies in Malaysia
 Business activities and opportunities by Japanese companies in Malaysia The Japanese Chamber of Trade & Industry, Malaysia Masakuni Nakayama, Vice-Chairman of trade and investment committee 1 June, 2016
Corporate Communications. Media Information 15 March 2011
 15 March 2011 BMW Group aims to further increase earnings in 2011 EBIT margin of over 8% expected in Automobiles segment Sales volume of well in excess of 1.5 million vehicles targeted Margin of 8% to
(1) Current State and Issues of the Electricity Sector in Indonesia
 Current State and Issues of the Electricity Sector in Indonesia") Japanese ODA Loan Ex-ante Evaluation 1. Name of the Project Country: The Republic of Indonesia Project: Java-Sumatra Interconnection Transmission Line Project (I) Loan Agreement: April 30, 2010 Loan Amount:
Japanese ODA Loan Ex-ante Evaluation 1. Name of the Project Country: The Republic of Indonesia Project: Java-Sumatra Interconnection Transmission Line Project (I) Loan Agreement: April 30, 2010 Loan Amount:
Table 1. GDP per Capita, current prices, (US$)
") Table 1. GDP per Capita, current prices, -211 (US$) 21 22 23 24 25 26 27 28 29 211 Estimates Start After Brunei Darussalam 18,477 16,828 16,977 18,757 21,885 25,754 29,949 31,44 36,223 26,423 29,852 36,584
Table 1. GDP per Capita, current prices, -211 (US$) 21 22 23 24 25 26 27 28 29 211 Estimates Start After Brunei Darussalam 18,477 16,828 16,977 18,757 21,885 25,754 29,949 31,44 36,223 26,423 29,852 36,584
European Union, Trade in goods with Malaysia
 European Union, Trade in goods with Malaysia Table of Contents pg - Key Figures 2 - / 2017 2 - - AMA/NAMA product Groups 2 - - SITC product Groups 2 - - Top 5 - HS sections 2 - - Top 5 - SITC sections
FAPRI Food and Agricultural Policy Research Institute
 26 WORLD OUTLOOK Presentation Food and Agricultural Policy Research Institute Global Macroeconomic Overview Sustained and widespread real economic growth for the decade averaging 3.1%. Industrialized countries
, 2012 ARUBA. Contents. Available. 1 Real sector A 1.2B 1.6A 1.6B 1.7A 1.7B. 1.9 Utilities Oil refining
 CENTRALE C BANK B VAN ARUBA STATISTICAL TABLES Third QUARTER 2011 Last updated January 13, 2012 Contents 1 Real sector 1.1 Gross Domestic Product 1.2A Business Perception Results 1.2B Business Perception
Industria Nacional De Autopartes, A.C.
 VISION: Being the most important Organization representing companies in the automotive parts sector with manufacturing interests in Mexico. MISSION: Supporting growth and sustainable development of its
US Exports to China by State
 US Exports to China by State 2000 10 1818 N Street, NW, Suite 200, Washington, DC 20036 Tel: 202-429-0340 Fax: 202-775-2476 E-mail: info@uschina.org www.uschina.org Executive Summary Exports to China are
Economy Presentation - Malaysia
 2014/AD1/053 Agenda Item: 3 Economy Presentation - Malaysia Purpose: Information Submitted by: Malaysia 20 th Automotive Dialogue Beijing, China 22-25 April 2014 ECONOMY: MALAYSIA APEC APEC AUTO AUTO DIALOGUE
Contents of Paper. 06-Jan-17 SIGNIFICANCE OF COMMODITIES SECTOR TO MALAYSIAN ECONOMY, WITH EMPHASIS ON OIL PALM
 SIGNIFICANCE OF COMMODITIES SECTOR TO MALAYSIAN ECONOMY, WITH EMPHASIS ON OIL PALM Ahmad Fauzi, Puasa Deputy Director Malaysian Institute of Economic Research (MIER) 17 January 2017 Contents of Paper World
Citrus: World Markets and Trade
 United States Department of Agriculture Foreign Agricultural Service uary 2015 Citrus: World Markets and Trade Oranges Global orange production for is forecast to decline 4 percent from the previous year
US$82,814m. Total assets. US$3,403m. Net debt. By Sector # US$411m Property. US$157m Insurance broking & financial services.
 Jardine Matheson Group Profile 2018 Jardine Matheson Holdings Limited 2017 Financial Highlights * US$83,808m Gross revenue US$4,378m Underlying profit before tax + US$82,814m Total assets 444,000 People
European Union, Trade in goods with New Zealand
 Union, Trade in goods with New Zealand Table of Contents pg Union, Trade with New Zealand - Key Figures 2 - / 2018 2 - - AMA/NAMA product Groups 2 - - SITC product Groups 2 - - Top 5 - HS sections 2 -
Following are the growth rates of each sub segment of the auto sector over the last 5 years:
 Sector Auto Components Industry Project Title Tyres Manufacturing Plant Project Description The Auto sector contributes 4.2% to India s GDP. The Indian automobile industry stood at 11 million vehicles
Investment Opportunity in Indonesia Real Estate s Sector
 Investment Opportunity in Indonesia Real Estate s Sector Director, of Investment Planning for Services and Economic Zones Real Estate Investment Indonesia, Jakarta, 24 September 2018 1 Investment Target
World Geographic Shares
 World Geographic Shares North America South America Europe Africa Asia Australia/ Oceania 18% 13% 7% 22% 33% 6% World Population Shares North America South America Europe Africa Asia Australia/ Oceania
Andi Isra Mahyuddin, Tatacipta Dirgantara, Sigit Puji Santosa. Faculty of Mechanical and Aerospace Engineering Institut Teknologi Bandung, INDONESIA
 ASEAN as a Global Automotive Hub: Challenges for Industry and Higher Education Institution Indonesia Perspective Green Drive Project Conference, Antwerpen, 22-23 Sept 2016 Andi Isra Mahyuddin, Tatacipta
Table 1 ANTIGUA AND BARBUDA: MAIN ECONOMIC INDICATORS
 Antigua Tables 2006 1 Main Indicators 03/11/2006 08:05 AM Table 1 ANTIGUA AND BARBUDA: MAIN ECONOMIC INDICATORS 1996 1997 1998 1999 2000 2001 2002 2003 2004 2005 a/ Annual growth rates b/ Gross domestic
Citrus: World Markets and Trade
 United States Department of Agriculture Foreign Agricultural Service July 2015 Citrus: World Markets and Trade Oranges Global orange production for is estimated to decline 7 percent from the previous year
ECONOMIC BULLETIN - No. 42, MARCH Statistical tables
 ECONOMIC BULLETIN - No. 42, MARCH 2006 APPENDIX Appendix Statistical tables The world economy Table a1 Gross domestic product a2 Industrial production a3 Consumer prices a4 External current account a5
INDONESIA EXPORT AND IMPORT, APRIL 2017
 No. 48/05/Th.XX, May, 15 th INDONESIA EXPORT AND IMPORT, APRIL Table 1. FOB Value of Indonesian Exports (Million US $) and Percentage of Change ( %) % Share Jan Apr March Jan Apr y-on-y m-on-m Jan Apr
World Economic Overview. M. Fouquin, H. Guimbard, C. Herzog & D. Unal. December 2012
 1 Contents Presentation P Part one : Countries weight Part two : International Trade Trade in goods and services Trade in goods Trade in services Part three : Specialization Appendix Appendix 1 : Geographical
STATISTICAL TABLES REAL SECTOR SECOND QUARTER 2018 Last updated August 17, 2018
 CENTRALE BANK VAN ARUBA STATISTICAL TABLES REAL SECTOR SECOND QUARTER 2018 Last updated August 17, 2018 Contents 1 Real sector 1.1 Gross Domestic Product 1.2A Business Perception Results 1.2B Business
Chemical and Petrochemical Opportunities in Iran
 Chemical and Petrochemical Opportunities in Iran by Mohammad Reza Ghasemian Managing Director of Chemicalways LLC. Greece Oct 2015 In cooperation with Best Land to produce Petrochemicals in ME Natural
THE CONSTRUCTION SECTOR OF INDONESIA *
 THE CONSTRUCTION SECTOR OF INDONESIA * Agita Widjajanto 1, Krishna S Pribadi 2, and Akhmad Suraji 3 1 Deputy Director for Investment Development, Center for Investment Resources Development, Ministry of
Labor Productivity, Compensation Costs, and U.S. International Competitiveness
 Cornell University ILR School DigitalCommons@ILR Federal Publications Key Workplace Documents June 1993 Labor Productivity, Compensation Costs, and U.S. International Competitiveness U.S. Bureau of Labor
Executive Summary. Exports to China: A key driver of US economic growth. China: An important market for US goods
 Executive Summary Exports to China: A key driver of US economic growth China continues to be an important contributor to US economic growth. In 2014, US exports to China totaled $120 billion, making it
Press Release. Investment Realization from January to September 2015 Reaches Rp 400 T
 INDONESIA INVESTMENT COORDINATING BOARD Press Release Investment Realization from January to September 2015 Reaches Rp 400 T Jakarta, October 22, 2015 Indonesia Investment Coordinating Board (BKPM) today
Global Monthly March 2019
 Global Monthly March 19 Percent of world bonds outstanding 3 5 15 5 Jan-1 Jun-1 Nov-1 Apr-15 Sep-15 Feb-1 Jul-1 Dec-1 May-17 Oct-17 Mar-1 Aug-1 Dec-1 Mar-19 March 19 Percent, year-on-year 7 5 3 1 1Q1 1Q
National accounts and balance of payments
 1. Danish economy 1998 to 2008 Figure 1 Real growth in GDP 4 3 2 1 0-1 -2 Per cent 98 00 02 04 06 08 For further information visit www.statbank.dk/nat02. Economic downturn in 2008 The economic growth was
Eastern Europe: The Untapped and Potential Growth Markets for Malaysian Palm Oil
 Palm Oil Economic Review and Outlook Seminar 2017 Pullman Kuala Lumpur City Centre, Kuala Lumpur 17 January 2017 Eastern Europe: The Untapped and Potential Growth Markets for Malaysian Palm Oil Puah Chiew
CHARTS AND PRICE PROJECTIONS
 CHARTS AND PRICE PROJECTIONS 18 / Charts and Price Projections: FAPRI 27 Agricultural Outlook Average Annual GDP Growth Percent Change 9 8 7 6 4 3 2 1 26-216 Canada China EU NMS EU- India Japan Latin America
northeast group, llc Southeast Asia Smart Grid: Market Forecast ( ) Volume III March 2016
 Volume III March 2016") northeast group, llc Southeast Asia Smart Grid: Market Forecast (2016 2026) Volume III March 2016 www.northeast-group.com Southeast Asia Smart Grid: Market Forecast (2016 2026) Southeast Asia is a growing
northeast group, llc Southeast Asia Smart Grid: Market Forecast (2016 2026) Volume III March 2016 www.northeast-group.com Southeast Asia Smart Grid: Market Forecast (2016 2026) Southeast Asia is a growing
Total credit to the non-financial sector (core debt), % of GDP Table F1.1
, % of GDP Table F1.1") Total credit to the non-financial sector (core debt), % of GDP Table F1.1 2012 2013 2014 2015 2016 Q2 16 Q3 16 Q4 16 Q1 17 Q2 17 Argentina 62.6 66.4 64.6 75.5 75.3 81.7 80.1 75.3 71.6 72.7 Australia 208.0
Total credit to the non-financial sector (core debt), % of GDP Table F1.1 2012 2013 2014 2015 2016 Q2 16 Q3 16 Q4 16 Q1 17 Q2 17 Argentina 62.6 66.4 64.6 75.5 75.3 81.7 80.1 75.3 71.6 72.7 Australia 208.0
International Flows REGIONAL TABLES. Introduction. Key Trends. Key Indicators for Asia and the Pacific 2008
 183 International Flows The People s Republic of China has the biggest share of merchandise exports in the region. The destination of exports of major exporters tends to be other Asian economies. A similar
Global Polybutadiene Rubber (BR) Market Study ( )
 Market Study ( )") Global Polybutadiene Rubber (BR) Market Study (2014 2025) Table of Contents 1. INTRODUCTION 1.1. Introduction to Polybutadiene Rubber Market Product Description Properties Industry Structure Value Chain
Global Polybutadiene Rubber (BR) Market Study (2014 2025) Table of Contents 1. INTRODUCTION 1.1. Introduction to Polybutadiene Rubber Market Product Description Properties Industry Structure Value Chain
Automotive Market in ASEAN Prepared by: Reciprocus International Date: January 2017
 RECIPROCUS RESEARCH BRIEF Automotive Market in ASEAN Prepared by: Reciprocus International Date: January 2017 Table of Contents Executive Summary 2 Macroeconomic Outlook of the Industry 3 Industry Outlook
We deliver world-class advice for owners and occupiers of office, industrial, hospitality, retail and residential real estate
 CONTENTS We deliver world-class advice for owners and occupiers of office, industrial, hospitality, retail and residential real estate 02 ECONOMIC OUTLOOK 04 ASEAN INTEGRATION AND FTAS 06 BUSINESS EXPANSION
China Toy Industry Report, 2008
 China Toy Industry Report, 2008 According to China Customs, the accumulative toy export value of China toy (including game stations) was totaled at US $12.26 billion during Jan-Jul 2008, up 29.58% compared
Steel Exporters Association is a professional body which represents iron and steel exporters in Turkey.
 Steel Exporters Association is a professional body which represents iron and steel exporters in Turkey. The association has more than 600 members as of September 2011. MAIN ACTIVITIES OF THE ASSOCIATION
CHARTS AND PRICE PROJECTIONS
 CHARTS AND PRICE PROJECTIONS 18 / Charts and Price Projections: FAPRI 28 Agricultural Outlook Average Annual GDP Growth, 27-217 Percent Change 1 8 8.4 7.92 6 4 4.44 3.67 4.6 4.34 2 2.37 2.17 1.38 2.44
Dr Ahmad Fauzi Puasa Deputy Director, Malaysia Institute Economic Research Kuala Lumpur Maritime Park & Spa Resort, Krabi, Thailand 29 August, 2013
 ASIA PALM OIL CONFERENCE (APOC) 2013: INNOVATING THAILAND S PALM OIL INDUSTRY World Economic Uncertainty Affect the World Palm Oil Industry Dr Ahmad Fauzi Puasa Deputy Director, Malaysia Institute Economic
No.1-2. Key Economic Indicators. Bank Austria Economics and Market Analysis
 No.-2 2008 Key Economic Indicators Bank Austria Economics and Market Analysis Key Economic Indicators Issue -2/2008 Economic Forecasts for Austria Percentage change over previous year 2006 2007 2008 2
ASEAN Fuel Economy Roadmap Fine-Tuning of the Vision
 2nd Forum of the ASEAN Fuel Economy Platform 27 March 2017 Bangkok, Thailand ASEAN Fuel Economy Roadmap Fine-Tuning of the Vision Alex Körner alex_koerner@gmx.de ASEAN-German Technical Cooperation Project
Southeast Asia: A Bright Future for Solar
 SOL AR POWER Southeast Asia: A Bright Future for Solar Southeast Asia Imminent solar power boom The demand for solar is on the rise, creating plenty of outstanding opportunities for solar installers and
Linu Mathew Philip. Centre for Trade and Development (Centad), New Delhi, India
, New Delhi, India") Linu Mathew Philip Centre for Trade and Development (Centad), New Delhi, India Regional Dialogue in Biofuels in Asia 9-10 November 2009 Relevance of Biofuel in the new context Trends Production Consumption
Linu Mathew Philip Centre for Trade and Development (Centad), New Delhi, India Regional Dialogue in Biofuels in Asia 9-10 November 2009 Relevance of Biofuel in the new context Trends Production Consumption
European Union, Trade in goods with Kuwait
 European Union, Trade in goods with Kuwait Table of Contents pg - Key Figures 2 - / 2017 2 - - AMA/NAMA product Groups 2 - - SITC product Groups 2 - - Top 5 - HS sections 2 - - Top 5 - SITC sections 2
Development of Thailand Automotive Industry Opportunity & Challenges. By Tasana Piriyaprut Vice President Thailand Automotive Institute
 Development of Thailand Automotive Industry Opportunity & Challenges By Tasana Piriyaprut Vice President Thailand Automotive Institute 1 Outline I. Motor vehicle: world industry & Thailand positioning
Dr Koh Poh Koon, Senior Minister of State, Ministry of Trade and Industry. Council Members of ASEAN Business Advisory Council.
 Welcome Remarks by Dr Robert Yap, Chairman ASEAN Business Advisory Council Singapore ASEAN Outlook Conference 2018 17th January 2018, 2:40 pm Supply Chain City, Ballroom Dr Koh Poh Koon, Senior Minister
northeast group, llc Southeast Asia Smart Grid: Market Forecast ( ) Volume II October group.com
 Volume II October group.com") northeast group, llc Southeast Asia Smart Grid: Market Forecast (2014 2024) Volume II October 2014 www.northeast- group.com Southeast Asia Smart Grid: Market Forecast (2014-2024) Southeast Asia is a growing
northeast group, llc Southeast Asia Smart Grid: Market Forecast (2014 2024) Volume II October 2014 www.northeast- group.com Southeast Asia Smart Grid: Market Forecast (2014-2024) Southeast Asia is a growing
Federated States of Micronesia
 IMF Country Report No. 13/17 Federated States of Micronesia 2012 ARTICLE IV CONSULTATION 2012 Statistical Appendix January 29, 2001 January 29, 2001 This Statistical Appendix paper for the Federated States
Submission to the Department of Foreign Affairs and Trade s Asian century country strategies
 Submission to the Department of Foreign Affairs and Trade s Asian century country strategies Federal Chamber of Automotive Industries Level 1, 59 Wentworth Avenue Canberra ACT 2604 Phone: +61 2 6247 3811
Money and banking. Flow of funds for the first quarter
 Statistical tables Money and banking Page S South African Reserve Bank: Liabilities... 2 South African Reserve Bank: Assets... 3 Corporation for Public Deposits: Liabilities... 4 Corporation for Public
Statistical tables S 0. Money and banking. Capital market. National financial account. Public finance
 Statistical tables Money and banking Page S South African Reserve Bank: Liabilities... 2 South African Reserve Bank: Assets... 3 Corporation for Public Deposits: Liabilities... 4 Corporation for Public
Figure 4.1 Shares in total world exports, regions of the world and major exporters in the Asia and Pacific region, Asia and the Pacific 32.
 255 Globalization Snapshots The Asia and Pacific region accounted for about one-third of the world s merchandise exports. Subdued demand from major markets dampened export growth in 2012. Intraregional
Thailand s Automotive Manufacturing Corridor
 1 Thailand s Automotive Manufacturing Corridor Peter Warr Australian National University, Canberra and Archanun Kohpaiboon Thammasat University, Bangkok Workshop on Economic Corridor Development, Asian
Country Report 9. Lao PDR Country Report. Leeber Leebouapao National Economic Research Institute. March 2008
 Country Report 9 Lao PDR Country Report Leeber Leebouapao National Economic Research Institute March 2008 This chapter should be cited as Leebouapao, L. (2008), Lao PDR Country Report, in Soesastro, H.
HCM will expand the production capacity and sales support, such as dealer empowerment, etc. in Chinese market.
 1 2 For the market environment in FY 2010, the growth rate of GDP(yearon-year)and fixed asset investment are both doing well. Construction machinery market has been rapidly increasing. In FY2010, demand
Manitoba Economic Highlights
 Economic Overview Real Gross Domestic Product The Manitoba Bureau of Statistics estimates that Manitoba s real GDP grew 1.9% in 2016, above the national average of 1.4%. Manitoba s real GDP is expected
EMBARGOED UNTIL RELEASE AT 8:30 A.M. EST, WEDNESDAY, JANUARY 30, 2013 GROSS DOMESTIC PRODUCT: FOURTH QUARTER AND ANNUAL 2012 (ADVANCE ESTIMATE)
") NEWS RELEASE EMBARGOED UNTIL RELEASE AT 8:30 A.M. EST, WEDNESDAY, JANUARY 30, 2013 Lisa Mataloni: (202) 606-5304 (GDP) gdpniwd@bea.gov Recorded message: (202) 606-5306 BEA 13-02 GROSS DOMESTIC PRODUCT:
NEWS RELEASE EMBARGOED UNTIL RELEASE AT 8:30 A.M. EST, WEDNESDAY, JANUARY 30, 2013 Lisa Mataloni: (202) 606-5304 (GDP) gdpniwd@bea.gov Recorded message: (202) 606-5306 BEA 13-02 GROSS DOMESTIC PRODUCT:
Early-Season U.S. Soybean Meal Sales Surge
 United States Department of Agriculture Foreign Agricultural Service November 2014 Early-Season U.S. Soybean Meal Sales Surge U.S. soybean meal export commitments (accumulated exports plus outstanding
Japan-Canada EPA: Free Trade Drives Growth & Prosperity
 Japan-Canada EPA: Free Trade Drives Growth & Prosperity 2013 Canada-Japan Trade Symposium Toronto, 25 April 2013 Toshihiro IWATAKE Executive Director and Secretary General Japan Automobile Manufacturers
INCREASING SALES FOR MINING RELATED BUSINESS
 Investor Relations of PT UNITED TRACTORS Tbk INCREASING SALES FOR MINING RELATED BUSINESS In the first half 2001, the Company managed to record increase in net revenue from IDR 2.32 trillion to IDR 3.54
Statistical tables S 0. Money and banking. Capital market. National financial account. Public finance
 Statistical tables Money and banking Page S : Liabilities... 2 : Assets... 3 Corporation for Public Deposits: Liabilities... 4 Corporation for Public Deposits: Assets... 5 Banks: Liabilities... 6 7 Banks: