Petroleum Planning & Analysis Cell
|
|
|
- Norah Adams
- 5 years ago
- Views:
Transcription

1
2
3

4 Petroleum Planning & Analysis Cell (Ministry of Petroleum & Natural Gas) Vision & Mission & Vision Vision To be the most authentic official source for data and policy analysis on the hydrocarbon sector in the country. Mission 1. To strengthen the existing data system in PPAC by adopting the latest techniques and best practices. 2. To render effective assistance to the Ministry of Petroleum & Natural Gas in the discharge of its responsibilities, particularly pricing of petroleum products and administration of subsidy schemes. 3. To monitor and analyze developments in the domestic oil and gas sector. 4. To undertake analysis of domestic and international energy markets. 5. To develop a cooperative framework for exchange of information and conduct of studies with other countries and international organizations in the energy sector. Objectives 1. To ensure effective administration of the subsidy schemes notified by the Government 2. To monitor and analyze trends in prices of crude oil, petroleum products and natural gas and their impact on the oil companies and consumers, and prepare appropriate technical inputs for policy making. 3. To monitor developments in the domestic market and analyze options for policy changes in pricing, transportation and distribution of petroleum products. 4. To collect, compile and disseminate data on the domestic oil and gas sector in a continuous manner and maintain the data bank. 5. To ensure quality of data in terms of prescribed parameters such as accuracy, completeness and timeliness. 6. To prepare periodic reports on various aspects of oil and gas sector.

5 CONTENTS CHAPTER NO. TITLE PAGE NO. 1 GENERAL Selected indicators of the Indian economy 2 Global energy consumption 3 2 EXPLORATION & CRUDE OIL PRODUCTION Crude oil proved reserves 5 Crude oil production 6 Crude oil consumption 7 Crude oil: Refinery capacities 8 Indigenous crude oil production 9 Self sufficiency in petroleum products 9 Status of blocks under NELP 10 Hydrocarbon reserves in India 10 Domestic oil & gas production vis a vis overseas production 10 Coal Bed Methane (CBM) Gas development in India 11 Status of shale gas and oil development in India 11 3 NATURAL GAS World top 30 natural gas reserve countries 13 World top 30 natural gas producing countries 14 World top 30 natural gas consuming countries 15 Natural gas at a glance 16 PNG data 16 CNG activities in India 17 CNG stations and vehicles 17 LNG terminals (Operational) 18 Domestic natural gas price and gas price ceiling 18 4 REFINING & PRODUCTION Map of refineries in India 20 Simplified block flow diagram of a typical refinery 21 Refineries: Installed capacity and crude oil processing 22 High Sulphur (HS) & Low Sulphur (LS) crude oil processing 22 Imported crude & indigenous crude oil processing 22 Production of petroleum products 23 Production of petroleum products: All sources 24 Production vs consumption of petroleum products 24 Gross Refining Margins (GRM) of refineries 25 GRM of North East refineries excluding excise duty benefit 26 Distillate yield of PSU refineries 26 Fuel and Loss 27 Specific energy consumption (MBN number) of PSU refineries 27 Import / export of crude oil and petroleum products 28 Exchange rates of Indian rupee (`) 29
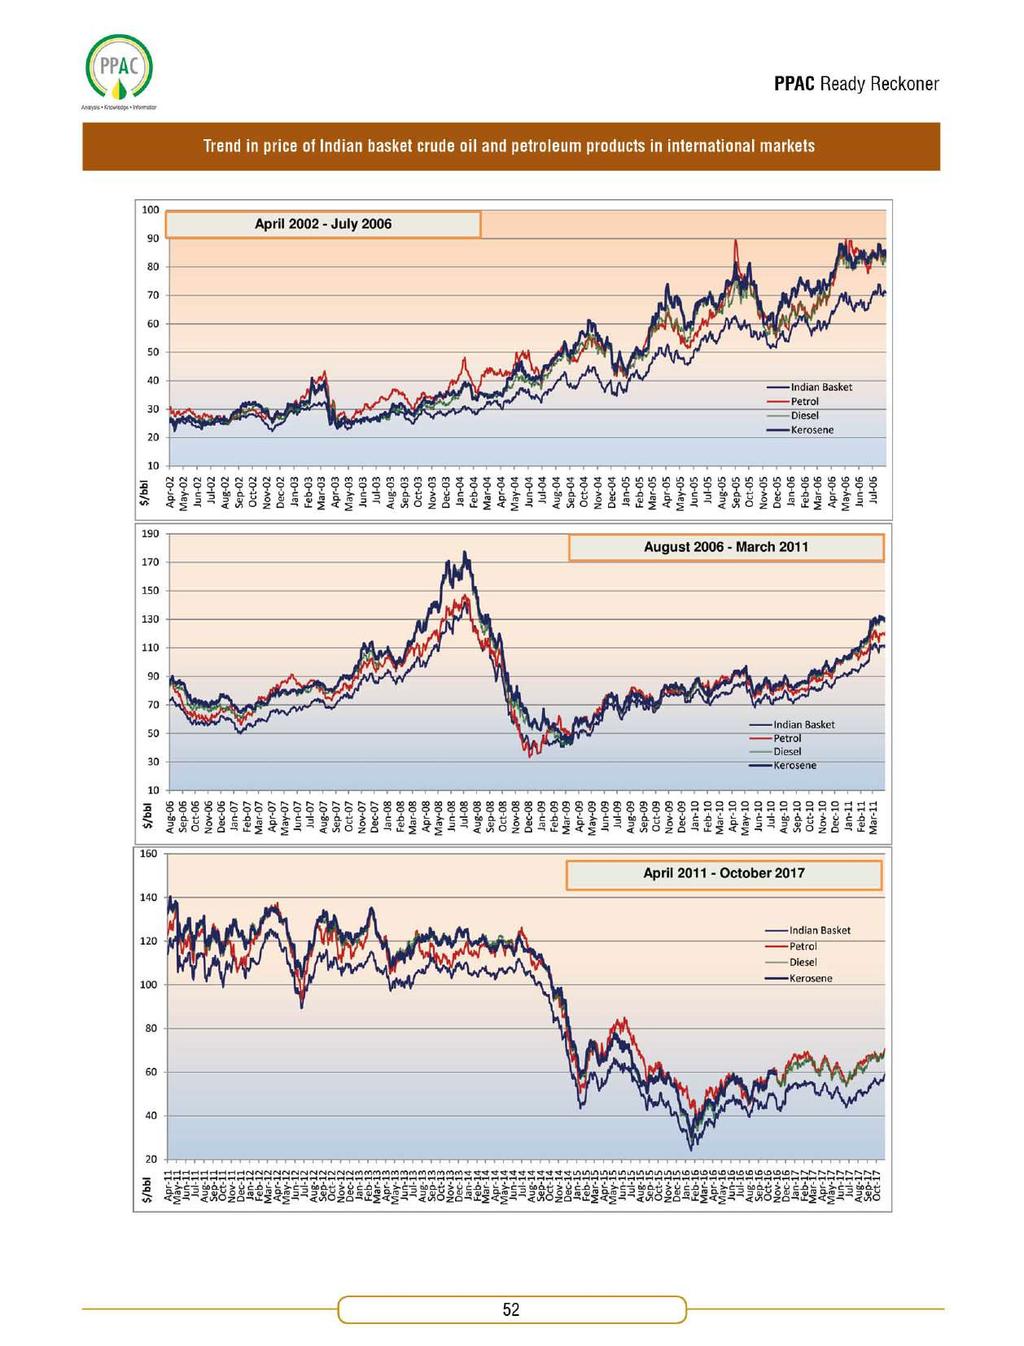
6 CHAPTER NO. TITLE PAGE NO. 5 MAJOR PIPELINES IN INDIA 6 SALES 7 LPG Map of pipeline network in India 31 Gas pipeline network 32 Gas pipeline under execution/construction 33 Major crude oil pipelines in India 34 Major petroleum products pipelines in India 35 Consumption of petroleum products 37 Petroleum products demand & Gross Domestic Product (GDP) during Plan periods End use analysis of HSD sales & diesel consumption by sectors State-wise sales of selected petroleum products 38 PDS SKO allocation 39 Oil industry Retail Outlets & SKO / LDO agencies 40 Category wise retail outlets and SKO / LDO agencies 41 Industry marketing infrastructure 42 Break-up of petroleum products consumption data (PSU and Private) 42 LPG marketing at a glance 44 Number of LPG distributors 45 LPG domestic customer population (registered) of PSU OMCs 46 LPG coverage (estimated) 47 LPG domestic customers enrolment (14.2 kg/5 kg) by PSU OMCs 48 8 PRICES AND TAXES Price of crude oil in India 50 Chart: Trend in prices of international benchmark crude oils 51 Chart: Trend in price of Indian basket crude oil and petroleum products in international markets 52 Price build-up of PDS kerosene at Mumbai 53 Element wise explanation of price build up of PDS kerosene 54 Price build-up of domestic LPG at Delhi 55 Element wise explanation of price build up of domestic LPG 56 Summarised buildup of Retail Selling Price (RSP) of petrol at Delhi 57 Summarised buildup of Retail Selling Price (RSP) of diesel at Delhi 57 Summarised buildup of Retail Selling Price (RSP) of PDS kerosene at Mumbai 58 Summarised buildup of Retail Selling Price (RSP) of domestic LPG at Delhi 58 Share of taxes in Retail Selling Price (RSP) of petroleum products: Petrol 59 Share of taxes in Retail Selling Price (RSP) of petroleum products: Diesel 59 Break up of current excise duty on petrol & diesel 59 Share of taxes in RSP of PDS kerosene 60 Share of taxes in RSP of domestic LPG 60 Weightage of petroleum products in Wholesale Price Index (WPI) 61 Estimated impact of increase in Retail Selling Price (RSP) of major petroleum products on inflation (WPI index) Important terms in pricing of petroleum products 62 Dealer's /distributor s commission on petrol & diesel
7 CHAPTER NO. TITLE PAGE NO. Wholesale dealer's commission on PDS kerosene 63 Distributor's commission on domestic LPG 63 Revisions in RSP of petroleum products at Delhi since Selling price of diesel for bulk consumers in major cities 70 Retail Selling Price (RSP) of major products in India & neighbouring countries 71 Retail Selling Price (RSP) & % of taxes in RSP in developed countries vis-a-vis India: Price & tax in Indian rupees (`)/litre Retail Selling Price (RSP) & % of taxes in RSP in developed countries vis-a-vis India: Price & tax in US dollars ($)/litre Retail Selling Price (RSP) of petroleum products at state/ut capitals 72 Retail Selling Price (RSP) of PDS kerosene at major cities 72 Customs, excise duty and GST rates on petroleum products 73 Effective rates of sales tax / VAT / GST levied by various States/UTs 74 Actual rate of sales tax / VAT / GST and other taxes levied by State/UT Governments on Major Petroleum Products Contribution of petroleum sector to exchequer 76 Contribution of taxes and duties on petroleum products to central exchequer vis-a-vis payout by Government State wise collection of sales tax / VAT / GST by petroleum sector 77 Profit After Tax (PAT) of oil companies 78 Financial details of oil companies 79 Total subsidy on petroleum products & natural gas 80 Under-recoveries and burden sharing 81 9 MISCELLANEOUS Average international calorific values of different fuels 83 Weight to volume conversion 83 Volume conversion 83 Contents of LPG & Natural Gas 83 Natural gas conversions 84 Major end use of petroleum products 84 Information about key officers of MoP&NG and PPAC

8 1
9 General Sl. no. Particulars Source Unit/ Base Apr-Sep Apr-Sep 2017 (P) 1 Population (as on 1st March 2011) Census of India Billion GDP at factor cost (constant prices) MOC&I (GR.%) (PE) Million tonne (4 th AE) 3 Agricultural production (foodgrains) MoA (GR.%) Index of Industrial Production* MOSPI (GR.%) =100 5 Imports MOC&I $ Billion Exports MOC&I $ Billion Trade balance MOC&I $ Billion Wholesale Price Index (all commodities) (average) MOC&I = All India Consumer Price Index (average): i) Industrial workers 2001= ii) Agricultural labourers Labour Bureau, Govt. of India = iii) Rural labourers = Foreign exchange reserves- Total# RBI $ Billion Outstanding external liabilities (as of end of financial year) 12 Outstanding internal debt (as of end of financial year) MOF ` Crore 1,84,581 1,97,514 2,10,262 2,25,135 (RE) MOF ` Crore 54,84,548 60,44,707 66,91,409 72,15,439 (RE) 13 Central plan outlay MOF ` Crore 6,03,573 (Actual) 4,20,882 (Actual) 14 Centrally Sponsored Schemes & other transfers MOF ` Crore 3,41,630 (Actual) 7.9 (Q1) (1 st AE) 5.7 (Q1) (E) (1 st AE) - 2,40,924 (BE) - 77,21,782 (BE) ,97,696 (RE) 15 Gross fiscal deficit MOF % (RE) 4,23,328 (BE) (BE) Petroleum Sl. no. Particulars Source Unit/ Base Apr-Sep 2016 Apr-Sep 2017 (P) 1 Crude oil production in India ONGC/OIL/DGH MMT Consumption of petroleum products in India OMCs/PPAC MMT Petroleum products production in India Oil Cos MMT Imports & exports Crude oil imports Oil Cos $ Billion Petroleum products imports Oil Cos & DGCIS $ Billion Total petroleum imports Oil Cos & DGCIS $ Billion (crude oil + petroleum products) Petroleum products exports Oil Cos $ Billion Gross petroleum imports as % of India's gross MOC&I/PPAC % imports in value terms 6 Gross petroleum exports as % of India's gross MOC&I/PPAC % exports in value terms 7 Import dependency (based on consumption) PPAC % Note : OMCs: Oil Marketing Companies, PPAC: Petroleum Planning & Analysis Cell Natural gas Table 1.1 : Selected indicators of the Indian economy Note : (P): Provisional, *Revision in base year of all India index of Industrial Production from to , #as of March 28, 2014, March 27, 2015, March 25, 2016, March 31, 2017, Sep 30, 2016 & Sep 29, 2017, RBI: Reserve Bank of India, MoF: Ministry of Finance, MOC&I: Ministry of Commerce & Industry, MoA: Ministry of Agriculture, E: Estimates, PE: Provisional Estimates, BE: Budget Estimate; AE: Advance Estimates, RE: Revised Estimates, MOSPI- Ministry of Statistics and Programme Implementation Sl. no. Particulars Source Unit/ Base (P) Apr-Sep 2016 Apr-Sep Gross Production ONGC/OIL/DGH MMSCMD Net Production (net of flare and loss) ONGC/OIL/DGH MMSCMD *LNG Import LNG importing Cos MMSCMD Total Consumption including internal use MMSCMD (Net Production+ LNG import) 5 Import dependency (based on consumption) PPAC % Note : *LNG imports include both term and spot cargo, MMSCMD : Million Standard Cubic Meter per Day
10 Sl.no. Country Table 1.2 : Global energy consumption, 2016 Oil Natural Gas Coal Nuclear Energy Hydro Electricity Renewables Total Energy (Mtoe) (Mtoe) (Mtoe) (Mtoe) (Mtoe) (Mtoe) (Mtoe) World % Share Per Capita Consumption (Toe) China % Share Per Capita Consumption (Toe) USA % Share Per Capita Consumption (Toe) India % Share Per Capita Consumption(Toe) Russian Federation % Share Per Capita Consumption (Toe) Japan % Share Per Capita Consumption (Toe) Canada % Share Per Capita Consumption (Toe) Germany % Share Per Capita Consumption (Toe) Brazil % Share Per Capita Consumption (Toe) South Korea % Share Per Capita Consumption (Toe) Iran % Share Per Capita Consumption(Toe) Saudi Arabia % Share Per Capita Consumption(Toe) France % Share Per Capita Consumption(Toe) Mexico % Share Per Capita Consumption(Toe) United Kingdom % Share Per Capita Consumption(Toe) Indonesia % Share Per Capita Consumption(Toe) Source: BP Statistical Review of World Energy, June 2017 Note: Oil consumption is measured in million tonnes; other fuels in million tonnes of oil equivalent. For calculation of per capita consumption population figures have been taken from World Bank International Data Base for Mtoe: Million tonnes oil equavalent, Toe: Tonne oil equivalent 3
11 4
12 Table 2.1 : Crude oil proved reserves Sl.no. Country At the end 2016 Thousand million tonnes Thousand million barrels Reserves /Production ratio 1 Venezuela Saudi Arabia Canada Iran Iraq Russian Federation Kuwait United Arab Emirates US Libya Nigeria Kazakhstan Qatar China Brazil Angola Algeria Mexico Ecuador Norway Azerbaijan India Oman Vietnam Indonesia South Sudan Malaysia Egypt Australia Yemen Sub total Others Total World of which: OECD Non-OECD OPEC Non-OPEC European Union Commonwealth of Independent States (CIS) Canadian oil sands: Total of which: Under active development Venezuela: Orinoco Belt Source: BP Statistical review of World Energy, June 2017 which includs data from ICIS. Note: Total proved reserves of oil - Generally taken to be those quantities that geological and engineering information indicates with reasonable certainty can be recovered in the future from known reservoirs under existing economic and operating conditions. The data series for total proved oil does not necessarily meet the definitions, guidelines and practices used for determining proved reserves at company level, for instance as published by the US Securities and Exchange Commission, nor does it necessarily represent BP s view of proved reserves by country. Reserves-to-production (R/P) ratio - If the reserves remaining at the end of any year are divided by the production in that year, the result is the length of time that those remaining reserves would last if production were to continue at that rate. Reserves include gas condensate and natural gas liquids (NGLs) as well as crude oil. 5
13 Sl.no. Country Table 2.2 : Crude oil production, 2016 Production* Million tonnes Million barrels daily 1 Saudi Arabia Russian Federation US Iraq Canada Iran China United Arab Emirates Kuwait Brazil Venezuela Mexico Nigeria Norway Angola Qatar Kazakhstan Algeria Oman Colombia United Kingdom Indonesia Azerbaijan India Egypt Malaysia Ecuador Argentina Libya Thailand Sub total Others Total World of which: OECD Non-OECD OPEC Non-OPEC European Union Commonwealth of Independent States (CIS) Source: Note: BP Statistical Review of World Energy, June 2017 which includes data from ICIS. * Includes crude oil, shale oil, oil sands and NGLs (natural gas liquids-the liquid content of natural gas where this is recovered separately). Excludes liquid fuels from other sources such as biomass and derivatives of coal and natural gas. 6
14 Table 2.3 : Crude oil consumption, 2016 Sl. no. Country Million tonnes Consumption * Thousand barrels daily 1 US China India Japan Saudi Arabia Russian Federation Brazil South Korea Germany Canada Iran Mexico France United Kingdom Indonesia Singapore Spain Thailand Italy Australia Taiwan United Arab Emirates Turkey Egypt Netherlands Malaysia Argentina Belgium Venezuela Pakistan Sub total Others Total World of which: OECD Non-OECD European Union CIS countries * Inland demand plus international aviation and marine bunkers and refinery fuel and loss. Consumption of biogasoline (such as ethanol), biodiesel and derivatives of coal and natural gas are also included. Source: BP Statistical Review of World Energy, June 2017 Note: Differences between these world consumption figures and world production statistics are accounted for by stock changes, consumption of non-petroleum additives and substitute fuels, and unavoidable disparities in the definition, measurement or conversion of oil supply and demand data. 7
15 Table 2.4 : Crude Oil: Refinery capacities* (Thousand barrels daily) Sl.no. Country Addition % Change Source: Note: 1 US China Russian Federation India Japan South Korea Saudi Arabia Brazil Germany Iran Canada Italy Spain Mexico Singapore Venezuela Netherlands Thailand United Kingdom France Indonesia United Arab Emirates Taiwan Kuwait Iraq Egypt Belgium Argentina Algeria Turkey Sub total Others Total World of which: OECD Non-OECD European Union Commonwealth of independent states (CIS) BP Statistical Review of World Energy, June 2017 which includes data from ICIS. * Atmospheric distillation capacity at year end on a calender-day basis
16 Table 2.5 : Indigenous crude oil production (Million metric tonne) Particulars Apr-Sep 2016 Apr-Sep 2017 (P) PSU companies ONGC OIL PSU total PSU total (crore barrels) Under PSC contracts PSC total PSC total (crore barrels) Total crude oil Condensate Total (crude oil + condensate) Total (crude oil + condensate) (crore barrels) Source: Oil Companies and DGH Table 2.6 : Self sufficiency in petroleum products (Million metric tonne) Particulars Apr-Sep 2016 Apr-Sep 2017 (P) i) Indigenous crude oil processing a) Products from indigeneous crude b) Products from fractionators (including LPG and Gas) ii) Total production from indigenous crude, condensate (a+b) iii) Total domestic consumption Percentage of self sufficiency (ii/iii) Source: Oil companies Note: 1. Production of petroleum products from indigenous crude considered at 93.3% of indigenous crude oil processing. 2. The balance demand of petroleum products is met through import of crude oil and POL products. 9
17 Round Offered Deep water Table 2.7 : Status of blocks under NELP ( ) Awarded Relinquished Operational Shallow water Onland Total Deep water Shallow water Onland Total Deep water Shallow water Onland NELP-I NELP-II NELP-III NELP-IV NELP-V NELP-VI NELP-VII NELP-VIII NELP-IX TOTAL Total Source: (DGH) Table 2.8 : Hydrocarbon reserves in India Details of reserves in India as of (Million metric tonne) Initial in place Ultimate reserves Oil Gas O+OEG Oil Gas O+OEG ONGC OIL Pvt./JV Total Accretion of initial in place Accretion ultimate reserves ONGC OIL Pvt./JV Total Source: DGH Note: O+OEG: Oil and Oil Equivalent of Gas Table 2.9 : Domestic oil & gas production vis a vis overseas production Year Apr-Sep 2016 Apr-Sep 2017 (P) Total domestic production (MMTOE) Overseas production (MMTOE) Overseas production as percentage of domestic production Source: ONGC Videsh Ltd., OIL, GAIL, IOCL and HPCL
18 Table 2.10 : Coal Bed Methane (CBM) Gas development in India Prognosticated CBM resources 92 TCF Established CBM resources 9.9 TCF Total available coal bearing area Sq.KM Blocks awarded* 33 Nos. Commercial production of CBM Gas (April - September 2017) 1.82 MMSCMD Source : DGH *CBM blocks have been awarded in the states of Andhra Pradesh, Assam, Chhattisgarh, Gujarat, Jharkhand, Madhya Pradesh, Maharashtra, Odisha, Rajasthan, Tamil Nadu and West Bengal. Table 2.11 : Status of Shale Gas and oil development in India a) Policy Guidelines for Exploration and exploitation of Shale gas and oil b) OIL : Activities during c) ONGC: Activities during Shale gas policy was announced in October ONGC and Oil India Limited (OIL) have been allotted 50 and 6 blocks respectively for carrying out Phase-I shale gas assessment studies. OIL has drilled one well in Jaisalmer basin. Four runs of conventional coring were completed within Baisakhi-Bedeshir Shale Section. Canister Core gas desorption, Residual/ Crush Gas, Gas composition, Spectral Gamma Ray, CT scanning, Rock Eval Pyrolysis, Vitrinite Relectance, organic richness and source rock (VRo) analysis, Cluster Analysis have been completed till March OIL has released three locations in Assam - DIBK Dibrugarh, DHS Dumdum and CAC Chabua PMLs (petroleum mining lease). Two more locations were released by OIL in Arunachal Pradesh - DML-2 Demoali and Jairampur Extn. PELs (petroleum exploration licenses ). ONGC has released three pilot shale gas/ oil locations and completed drilling of four dual objective wells in north Cambay basin. Total 20 conventional cores in Cambay Shale section were collected for shale specific studies. Hydro-fracturing is in progress in three hydro-fracturing objects and activities are in different stages of progress. The drilled wells have given information about various properties of the shale formations. Most of the blocks in the four basins (Cambay, KG, Cauvery, Assam & Assam Arakan) are prospective mainly for shale oil. Area prospective for shale gas in most of the blocks is likely to be limited. ONGC drilled first shale gas well in Jambusar field. Another shale gas well was drilled in Gandhar Ext-II in Gandhar area. Hydro-fracturing was carried out in one of the identified intervals (Object-II) of well in Jambusar field. The well produced 191 m 3 of liquid which included 19 m 3 of oil and 172 m 3 of water during different stages of extended testing. It established unconventional Shale Oil reservoir for the first time in an Indian Basin. Oil indication is encouraging and prevalence of unconventional petroleum system in the Broach sub-basin seems to be an attractive proposition for shale oil exploration. A proper quantitative estimation of oil-in-place will require the results from other wells which have been drilled in the same area of Cambay basin and which are identified for hydrofracturing. Source: DGH 11

19 12
20 Table 3.1 : World top 30 natural gas reserve countries (Billion cubic metre) Sl. no. Country Iran Russian Federation Qatar Turkmenistan US Saudi Arabia United Arab Emirates Venezuela China Nigeria Algeria Iraq Australia Indonesia Canada Egypt Kuwait Norway Libya India Myanmar Malaysia Azerbaijan Uzbekistan Kazakhstan Oman Netherlands Vietnam Ukraine Pakistan Sub total Others Total World of which: OECD Non-OECD European Union CIS Source: BP Statistical Review of World Energy, June
21 Table 3.2 : World top 30 natural gas producing countries (Billion cubic metre) SL. no. Country US Russian Federation Iran Qatar Canada China Norway Saudi Arabia Algeria Australia Malaysia Indonesia Turkmenistan Uzbekistan United Arab Emirates Mexico Nigeria Egypt Pakistan United Kingdom Netherlands Thailand Argentina Oman Trinidad & Tobago Venezuela India Bangladesh Brazil Kazakhstan Sub total Others Total World of which: OECD Non-OECD European Union CIS Source: BP Statistical Review of World Energy, June
22 Table 3.3 : World top 30 natural gas consuming countries (Billion cubic metre) Sl. no. Country US Russian Federation China Iran Japan Saudi Arabia Canada Mexico Germany United Kingdom United Arab Emirates Italy Other Middle East Uzbekistan Egypt India Argentina Thailand Pakistan South Korea Malaysia France Turkey Qatar Australia Algeria Indonesia Brazil Venezuela Netherlands Sub total Others Total World of which: OECD Non-OECD European Union Former Soviet Union Source: BP Statistical Review of World Energy, June
23 Table 3.4 : Natural gas at a glance (MMSCMD) Particulars Apr-Sep 2016 Apr-Sep 2017 (P) Gross Production Net Availability (net of flare and loss) *LNG Import Total Consumption including internal use (Net Availability + LNG import) Total Consumption (in BCM) Total Consumption (in MMSCM) Table 3.5 : PNG data as on State Geographical area covered Entity Delhi / NCR Maharashtra Gujarat Uttar Pradesh National Capital Territory of Delhi (Including Noida and Ghaziabad) Mumbai, Thane, Mira-Bhayender, Navi Mumbai, Pune, Kalyan, Ambernath, Panvel, Bhiwandi Gandhinagar, Mehsana, Sabakantha,Nadiad, Halol, Hazira, Rajkot, Khambhat, Palej, Valsad, Navsari, Surendra Nagar, Ahmedabad, Vadodara, Surat, Ankeleswar, Bhavnara, Anand. Merrut, Mathura, Agra, Firozabad,Kanpur, Bareilly, Lucknow, Moradabad, Khurja, Allahabad. PNG connections Domestic Industrial Commercial Indraprastha Gas Ltd Mahanagar Gas Ltd., Maharashtra Natural Gas Ltd., Gujarat Gas Ltd. Sabarmati Gas Ltd., Gujarat Gas Ltd., Hindustan Petroelum Corporation Ltd., Vadodara Gas Ltd, Adani Gas Ltd., Charotar Gas Sahkari Mandali Ltd. Green Gas Ltd. (Lucknow), Central UP Gas Limited (Kanpur), GAIL Gas Ltd.,Sanwariya Gas Ltd., Siti Energy Ltd.,Adani Gas Ltd., Indian Oil-Adani Gas Pvt. Ltd Tripura Agartala Tripura Natural Gas Company Ltd Madhya Pradesh Dewas, Indore, Ujjain, Gwalior GAIL Gas Ltd., Aavantika Gas Ltd Rajasthan Kota GAIL Gas Ltd Assam Tinsukia, Dibrugarh, Sibsagar,Jorhat Assam Gas Co. Ltd Andhra Pradesh/ Telangana Kakinada, Hyderabad,Vijayawada, Kovvur Bhagyanagar Gas Ltd., Godavari Gas Pvt. Ltd Haryana Sonepat, Gurgaon, Faridabad GAIL Gas Ltd, Adani Gas Ltd., Haryan City Gas Distribution Ltd Karnataka Bengaluru GAIL Gas Ltd Chandigarh Chandigarh Indian Oil-Adani Gas Pvt. Ltd Kerala Ernakulam Indian Oil-Adani Gas Pvt. Ltd Dadra & Nagar Haveli Dadra & Nagar Haveli Gujarat Gas Ltd Daman and Diu Daman and Diu Indian Oil-Adani Gas Pvt. Ltd Total Source : CGD companies 16
24 Table 3.6: CNG activities in India as on State Gujarat Company name Adani Energy Ltd., Gujarat Gas Ltd., (An amalgamated entity of Gujarat State Petroleum Corporation Gas Company Ltd. and Gujarat Gas Company Ltd.), Sabarmati Gas Ltd. (SGL), Hindustan Petroleum Corporation Ltd. (HPCL), Vadodara Gas Ltd. (JV of GAIL Gas Ltd. and Vadodara Mahanagar Seva Sadan), Charotar Gas Sahkari Mandali Ltd. No. of companies Apr-Sep 2016 (Sales in TMT) Apr-Sep 2017 (P) Delhi Indraprastha Gas Ltd. (IGL), New Delhi Rajasthan (Kota) Rajasthan State Gas Limited Maharashtra Andhra Pradesh / Telangana Mahanagar Gas Ltd. (MGL) Mumbai and Maharashtra Natural Gas Ltd.(MNGL), Pune Bhagyanagar Gas Ltd. (BGL) and Hyderabad Godavari Gas Pvt. Ltd., Hyderabad Uttar Pradesh Green Gas Ltd., Lucknow, Central UP Gas Ltd., Kanpur, Siti Energy Ltd., GAIL Gas Ltd., Sanwaria Gas Ltd., Indraprastha Gas Ltd., Adani Gas Ltd., Indian Oil-Adani Gas Pvt. Ltd. Tripura Tripura Natural Gas Co. Ltd. (TNGCL), Agartala Madhya Pradesh Aavantika Gas Ltd. (Indore) and GAIL Gas Ltd Haryana Haryana City Gas Ltd., GAIL Gas Ltd. and Adani Gas Ltd West Bengal Great Eastern Energy Corporation Ltd Karnataka GAIL Gas Ltd Chandigarh Indian Oil-Adani Gas Pvt. Ltd Total 21* Source : CGD companies Note : *GAIL Gas Ltd. is operating in five States, Adani Gas in three States, Bhagyanagar Gas Ltd, Indraprastha Gas Ltd. and Indian Oil-Adani Gas Pvt. Ltd. are operating in two States. Hence, their number is taken once only. Table 3.7: CNG stations and vehicles as on State Company name No. of CNG stations No. of CNG vehicles Gujarat Adani Energy Ltd., Gujarat Gas Ltd., (An amalgamated entity of Gujarat State Petroleum Corporation Gas Company Ltd. and Gujarat Gas Company Ltd.), Sabarmati Gas Ltd., Hindustan Petroleum Corporation Ltd., Vadodara Gas Ltd. (JV of GAIL Gas Ltd. and Vadodara Mahanagar Seva Sadan), Charotar Gas Sahkari Mandali Ltd. Delhi / NCR Indraprastha Gas Ltd. (IGL), New Delhi Maharashtra Mahanagar Gas Ltd. (MGL), Mumbai, Maharashtra Natural Gas Ltd. (MNGL), Pune Andhra Pradesh / Telangana Bhagyanagar Gas Ltd.( BGL), Hyderabad, Godavari Gas Pvt. Ltd.Hyderabad Rajasthan Rajasthan State Gas Limited Uttar Pradesh Green Gas Ltd., Lucknow, Central UP Gas Ltd.,cKanpur, Siti Energy Ltd., Adani Energy Ltd., GAIL Gas Ltd., Sanwaria Gas Ltd., Indian Oil-Adani Gas Pvt. Ltd Tripura Tripura Natural Gas Co. Ltd., Agartala Madhya Pradesh Aavantika Gas Ltd. Indore, GAIL Gas Ltd Haryana Haryana City Gas Ltd, GAIL Gas Ltd., Adani Gas Ltd West Bengal Great Eastern Energy Corporation Ltd Karnataka Gail Gas Ltd Chandigarh Indian Oil-Adani Gas Pvt. Ltd Daman Indian Oil-Adani Gas Pvt. Ltd All India Source : CGD companies, RTO 17
25 Table 3.8 : LNG terminals (Operational) Sl. no. Name of terminal Promoters Capacity (MMTPA) Capacity Utilization (%) (Apr-Sep 2017) 1 Dahej (Gujarat) Petronet LNG Ltd. (PLL) 15 MMTPA Hazira (Gujarat) Hazira LNG Pvt. Ltd. (HLPL) 5 MMTPA Dabhol (Maharashtra) Ratnagiri Gas and Power Pvt. Ltd. (RGPPL- JV of GAIL & NTPC) 1.69 MMTPA presently without breakwater to be increased to 5 MMTPA Kochi (Kerala) Petronet LNG Ltd. (PLL) 5 MMTPA 13.8 Source: LNG operating companies Period Table 3.9 : Domestic natural gas price and gas price ceiling Domestic natural gas price in US$/MMBTU (GCV basis)* Gas price ceiling in US$/MMBTU (GCV basis)** November March April September October March April September October March April 2017-September October March Note: * As per the New Domestic Natural Gas Pricing Guidelines, 2014 issued by Ministry of Petroleum & Natural Gas dated October 25, 2014 ** As per the notification issed by Ministry of Petroleum and Natural Gas dated on marketing including pricing freedom for the gas to be produced from discoveries in Deepwater, Ultra Deepwater and High Pressure-High Temperature areas. 18

26 19

27

28
29 Sl. no. Refinery Table 4.1 : Refineries: Installed capacity and crude oil processing Installed capacity (MMTPA) 22 Crude oil processing (MMT) Apr-Sep 2016 Apr-Sep 2017 (P) 1 Barauni Koyali Haldia Mathura Panipat Guwahati Digboi Bongaigaon Paradip IOCL total Mumbai Visakh HMEL-Bathinda HPCL total Mumbai Kochi BORL-Bina BPCL total Manali CBR CPCL total Numaligarh Tatipaka MRPL-Mangalore ONGC total RIL-Jamnagar (DTA) RIL-Jamnagar (SEZ) EOL-Vadinar All India Source: Oil companies MMTPA: Million Metric Tonne per Annum, MMT: Million Metric Tonne Table 4.2 : High Sulphur (HS) & Low Sulphur (LS) crude oil processing (Million metric tonne) Sl. no. Type of crude Apr-Sep 2016 Apr-Sep 2017 (P) 1 HS crude LS crude Total crude Share of HS crude in total crude processing 72.0% 72.3% 71.3% 72.3% 72.0% 73.8% Source: Oil companies Table 4.3 : Imported crude & indigenous crude oil processing (Million metric tonne) Sl. no. Indigenous/ Imported crude Apr-Sep 2016 Apr-Sep 2017 (P) 1 Imported crude Indigenous crude Total crude Share of imported crude in total crude processing 84.8% 84.7% 85.3% 86.3% 86.3% 86.7% Source: Oil companies
30 Table 4.4 : Production of petroleum products Apr-Sep 2016 (Million metric tonne) Apr-Sep 2017 (P) A) From crude oil/ refineries Light ends of which: LPG MS Naphtha Others Middle distillates of which: SKO ATF HSD LDO Others Heavy ends of which: Furnace Oil LSHS Lube Oil Bitumen RPC/Petcoke Others Sub total (A) B) From natural gas/ fractionators Sub total (B) of which: LPG Naphtha SKO HSD Others Total indigenous production (A +B) Source: Oil companies 23
31 Table 4.5 : Production of petroleum products : All sources (Million metric tonne) Major products Apr-Sep 2016 Apr-Sep 2017 (P) HSD MS Naphtha FO ATF LPG SKO Bitumen LSHS Lubes LDO RPC/Petcoke Others# Total Source: Oil companies Note : # Others include products like Propylene, Solvents (Hexane, Benzene, Toluene, Xylene and Specialty solvents), Reformate, Mineral Turpentine Oil, Carbon Black Feed Stock, Waxes, Sulphur etc. Table 4.6 : Production vs consumption of petroleum products (Million metric tonne) Year Consumption $ Production from refineries & Surplus (+ ) / Deficit (-) other sources* (A) (B) (B)-(A) Apr-Sep Apr-Sep 2017 (P) Note: $ includes direct imports by private parties *Fractionators and gas processing plants 24
32 Table 4.7 : Gross Refining Margins (GRM) of Refineries ($/bbl) Company Refinery H1, H1, PSU refineries Barauni 6.68 (1.20) Koyali Haldia 2.84 (1.51) Mathura 2.10 (2.19) IOCL Panipat 3.62 (1.97) Guwahati Digboi Bongaigaon 6.71 (0.26) Paradip NA NA (0.65) Average Kochi BPCL Mumbai Average Mumbai HPCL Visakh Average CPCL Chennai MRPL Mangalore 2.67 (0.64) NRL Numaligarh JV refineries BORL Bina Private refineries RIL Jamnagar Essar Vadinar * * Singapore Source: Indian refineries - published results/ information provided by oil companies Singapore - Reuters * Not available 25
33 Table 4.8 : GRM of North East refineries excluding excise duty benefit ($/bbl) Company Refinery H1, H1, Guwahati IOCL Digboi Bongaigaon 2.34 (6.51) NRL Numaligarh Source: Information provided by oil companies Table 4.9 : Distillate yield of PSU refineries (Distillate %) Company Refinery Barauni Koyali Haldia Mathura IOCL Panipat Guwahati Digboi Bongaigaon Paradip CPCL HPCL BPCL Manali CBR Mumbai Visakh Mumbai Kochi NRL Numaligarh MRPL Mangalore PSU oil cos. average Source : CHT 26
34 Sl. no. 1 Company Refinery Crude T put + other inputs 27 (Million metric tonne) Apr-Sep 2016 Apr-Sep 2017 (P) Fuel & Loss Crude T put + Fuel & Loss Crude T put + Fuel & Loss Crude T put + Fuel & Loss Crude T'put + Fuel & Loss Crude T'put + Fuel & Loss Qty % other Qty % other Qty % other Qty % other Qty % other inputs inputs inputs inputs inputs Qty % Barauni Koyali Haldia Mathura Panipat IOCL 6 Guwahati Digboi Bongaigaon Paradip IOCL Total Mumbai Visakh HPCL 12 HMEL-Bathinda HPCL Total Mumbai Kochi BPCL BORL-Bina Numaligarh BPCL Total Manali CPCL CBR CPCL Total Tatipaka ONGC MRPL-Mangalore ONGC Total Jamnagar (DTA) RIL 22 Jamnagar (SEZ) EOL Vadinar Source: Oil companies Source: CHT Table 4.10 : Fuel & Loss Total (MBTU/Bbl/NRGF) Company Refinery (New MBN) (New MBN) IOCL CPCL HPCL BPCL Table 4.11 : Specific energy consumption (MBN number) of PSU refineries Barauni Koyali Haldia Mathura Panipat Guwahati Digboi Bongaigaon Paradip Manali CBR Mumbai Visakh Mumbai Kochi NRL Numaligarh MRPL Mangalore PSU oil cos. average /78.5 * Source: CHT *excluding Paradip
35 Table 4.12 : Import / export of crude oil and petroleum products Import / export Crude oil & petroleum products Apr-Sep 2016 Apr-Sep 2017 (P) Quantity Value Quantity Value Quantity Value Quantity Value Quantity Value Quantity Value Million tonne US$ (Billion) ` (Crores) Million tonne US$ (Billion) ` (Crores) Million tonne US$ (Billion) ` (Crores) Million tonne US$ (Billion) ` (Crores) Million tonne US$ (Billion) ` (Crores) Million tonne US$ (Billion) ` (Crores) Crude oil Products LPG Petrol Naphtha I M P O R T* Aviation Turbine Fuel Kerosene Diesel Lubes Fuel Oil/ LSHS Bitumen Petcoke Others** Total product import Total import (crude oil + product) Products LPG Petrol Naphtha E X P O R T Aviation Turbine Fuel Kerosene Diesel LDO Lubes Fuel Oil/ LSHS Bitumen Petcoke / CBFS Others*** Total product export Net import Net product export Source: Oil companies & DGCIS Note: 1. *Import does not include LNG imports 2. **Other imports include Paraffin Wax, Petroleum Jelly, LSWR, Aviation Gas, MTBE & Reformate etc. 3.***Other exports include VGO, Benzene, Hexane, MTO, Sulphur etc. 4. Others in exports include RIL-SEZ exports of Others with unspecified heavy ends 28
36 Table 4.13 : Exchange rates of Indian Rupee (`) Year US dollar ($) British pound ( ) Euro ( ) Indian rupee (`) / foreign currency Japanese yen ( ) (up to ) : Month wise Jan Feb Mar Apr May Jun Jul Aug Sep Oct Source: Reserve Bank of India (RBI) website. Note : The rates are average for the period. 29

37 30

38
39 Table 5.1 : Gas pipeline network as on Network/Region Entity Length (Kms) Design capacity (mmscmd) Pipeline size Average flow Apr-Sep 2017(P) (mmscmd) % Capacity utilisation Apr-Sep 2017 Hazira-Vijaipur-Jagdishpur Pipeline/Gas rehabilitation and expansion project pipeline/ Dahej-Vijaipur Pipeline & spur/ Vijaipur-Dadri Pipeline GAIL " DVPL-GREP upgradation (DVPL-2 & VDPL) GAIL " *Chhainsa-Jhajjar-Hissar Pipeline (CJPL) (Including spur lines) commisioned up to Sultanpur, Jhajjar-Hissar under hold (111 Km) Dahej-Uran-Panvel Pipeline (DUPL/ DPPL) including spur lines GAIL " /16" GAIL "/18" *Dadri- Bawana-Nangal Pipeline (DBPL), Dadri-Bawana: 106 Km, Bawana-Nangal: 501 KM, spur line of BNPL: 196 Km GAIL "/30"/ 24"/18" Dabhol-Bengaluru Pipeline (Including spur) Phase km, Phase km Kochi-Koottanad-Bengaluru-Mangalore (Phase-1) GAIL "/4" GAIL "/4" Assam (Lakwa) GAIL " Tripura (Agartala) GAIL " Ahmedabad GAIL " Rajasthan (Focus Energy) GAIL " Bharuch, Vadodara (Undera) including RLNG+RIL GAIL "/16" Mumbai GAIL " KG Basin (including RLNG+RIL) GAIL " Cauvery Basin GAIL " East- West Pipeline (RGTIL) Reliance " Shahdol-Phulpur Pipeline (RGPL) Reliance " GSPL network including spur lines GSPL Assorted Assam Regional Network AGCL, DNPL " and others Dadri-Panipat IOCL "/10" Uran-Trombay ONGC " Total Source : Pipeline operating companies Note : *CJPL and DBPL pipelines are the extension of DVPL-2 / VDPL 32
40 Table 5.2 : Gas pipeline under execution / construction (as on ) Sl. no. Network/Region Entity Length in Kms Design capacity (mmscmd) Pipeline size Status of pipeline laid (Km) 1 2 Kochi - Kottanad - Bengaluru - Mangalore Dabhol -Bengaluru (DBPL) Spur Lines, Phase-2 GAIL(India) Ltd /18 / GAIL(India) Ltd "/30"/24"/18" 0 3 Surat - Paradip* GAIL(India) Ltd "/24"/18" 0 4 Jagdishpur- Haldia- Bokaro-Dhamra (JHBDPL) (Phase-I, 755 Km, 7.44 MMSCMD Capacity) GAIL(India) Ltd /24"/18"/ 12 /8 / Mallavaram - Bhilwada* GSPC India Transco Ltd /36"/30"/ 24"/18"/ Mehsana - Bathinda * GSPC India Gasnet Ltd /24 /18 / Bathinda -Jammu- Srinagar* GSPC India Gasnet Ltd /18 /16 / 12 /8 /6 0 8 Kakinada - Vizag- Srikakulam * AP Gas Distribution Corporation / Ennore- Nellore* Gas Transmission India Pvt. Ltd / Ennore-Thiruvallur- Bengaluru-Puducherry- Nagapattinam-Madurai- Tuticorin* Indian Oil Corporation Ltd "/24 /16 / 12"/10" 0 11 Jaigarh-Mangalore* H-Energy Pvt. Ltd " 0 Total Source : PNGRB, GAIL (India) Ltd, Pipeline authorized companies *Competitive bidding. 33
41 Table 5.3 : Major crude oil pipelines in India Onshore / Offshore Oil Pipelines Existing pipelines Oil company Length in Kms Annual capacity (MMT) Actual utilisation upto September 2017 (P) Utilisation % CTF (Central Tank Farm) Kalol to CTF Nawagam - New (New line commissioned in Aug'2010) Nawagam-Koyali (18" line) Nawagam-Koyali (14" line) (1) (MMT) MHN-NGM (Mehsana-Nawagam) trunk line - New (New crude oil trunk line commissioned. Under operation since Dec'2010) CTF (Central Tank Farm), Ankleshwar to Koyali oil pipeline (AKCL- Ankleshwar Koyali Crude Line) excluding Cambay(2) CTF (Central Tank Farm), Ankleshwar to CPF (Central Processing Facility), Gandhar (3) CPF (Central Processing Facility), Gandhar to Saraswani T point (4) Akholjuni- Koyali oil pipe line (Commissioned in July 2010). Akholjuni to Laxmipura T' point ONGC Lakwa-Moran oil line (New) (5) Lakwa-Moran oil line (Old) Geleki-Jorhat oil line Borholla- Jorhat oil line NRM (Narimanam) to CPCL (Chennai Petroleum Corporation Limited) KSP-WGGS to TPK Refinery (Kesnapalli-West-Group Gathering Station to Tatipaka) GMAA EPT (Gopavaram Early Production Terminal) to S. Yanam Unloading Terminal (3.5 Km long and 4"). New line commissioned on Mumbai High - Uran - Trunk (MUT) 30 pipeline Heera - Uran - Trunk (HUT) 24 pipeline Bombay-Uran Trunk (BUT) 30 pipeline Salaya-Mathura pipeline (SMPL) (1) Paradip-Haldia-Barauni pipeline (PHBPL) (2) IOCL Mundra-Panipat pipeline Duliajan-Digboi-Bongaigaon-Barauni pipeline OIL Mangla-Bhogat pipeline CAIRN Mundra- Bathinda pipeline HMPL Vadinar-Bina pipeline BPCL / BORL Total: Source: Oil companies Note: ONGC: 1. ONGC: 78 km X 14 Nawagam-Koyali line was given on lease to IOC in 2000 and was handed back to ONGC on 1 st April The line was restored and re-commissioned in October CTF Ankleshwar to Makan T point section i.e. HOEC Junction (about km) of CTF Ankleshwar-Koyali Refinery trunk pipeline was not in use up to August After damage / rupture of 8 CTF to CPF line on , CTF to Koyali Trunk pipeline is in use from for dispatch of Ankleshwar crude oil including PSC & JV. CTF Ankleshwar to Koyali Crude Line (AKCL) actual quantity includes Ankleshwar, PSC, JV and Cambay crude oil also. 3. Crude oil from CTF Ankleshwar was being dispatched to CPF, Gandhar through 8 X km pipeline up to Crude oil dispatched includes crude oil of PSC and JV also. After damage / rupture of 8 CTF to CPF line on , this line is not in use. 4. Length and capacity includes length capacity of branch lines from GNAQ (well) and Dabka meeting at Magnad T point and Mobha T point respectively. 5. New 12 Lakwa-Moran Oil Line commissioned on IOCL: km added in SMPL since 1 st April 2016 by commissioning of SMPL- Surendranagar Viramgam loopline on , Viramgam - Sidhpur section on , Abu road - Rajola section on and Sidhpur Abu road section on along with capacity augmention from 21 MMTPA to 25 MMTPA on Capacity augmented from 11 MMTPA to 15.2 MMTPA with commissioning of Balasore pump station on
42 Pipeline Petroleum products pipelines Barauni - Kanpur pipeline Oil company Length in KMs Annual capacity (MMT) Actual utilisation upto September 2017 (P) (MMT) % Utilisation Guwahati -Siliguri pipeline Haldia-Barauni pipeline Haldia-Mourigram-Rajbandh pipeline Koyali-Ahmedabad pipeline Koyali-Sanganer pipeline KSPL (1) Koyali-Ratlam pipeline Koyali-Dahej pipeline Mathura-Tundla pipeline Mathura-Bharatpur pipeline Mathura-Delhi pipeline IOCL Panipat-Amabala-Jalandhar (Including Kurukshetra-Roorkee-Najibabad branch line) Panipat-Delhi (Including Sonepat-Meerut branch line) pipeline 189 Panipat Bijwasan ATF pipeline (2) Panipat-Bathinda pipeline Panipat-Rewari pipeline Chennai-Trichy-Madurai pipeline Chennai - Meenambakkam ATF pipeline Chennai-Bengaluru pipeline Digboi - Tinsukia pipeline Devangonthi - Devanhalli pipeline Paradip Raipur Ranchi pipeline(prrpl) (3) Mumbai-Manmad-Bijwasan pipeline (MMBPL) Bina-Kota pipeline (BKPL) ATF P/L Mumbai Refinery (MR)-Santacruz BPCL ATF P/L Kochi Refinery (KR)-Kochi Airport Kota - Jobner branch pipeline(1) Cochin-Coimbatore-Karur (CCK) pipeline Petronet CCK Mumbai-Pune-Solapur pipeline Table 5.4 : Major petroleum products pipelines in India Vizag-Vijaywada-Secunderabad pipeline Mundra-Delhi pipeline Ramanmandi-Bahadurgarh pipeline Ramanmandi-Bathinda pipeline HPCL Awa-Salawas pipeline (1) Bahadurgarh-Tikrikalan pipeline Rewari- Kanpur Pipeline(1) ATF piepline from Mumbai Refinery to Mumbai Airport Mangalore-Hassan-Bengaluru (MHB) pipeline Petronet MHB Numaligarh-Siliguri pipeline OIL LPG pipelines Panipat-Jalandhar pipeline IOCL Mumbai-Uran pipeline BPCL Jamnagar-Loni pipeline GAIL Vizag-Secunderabad pipeline HPCL Mangalore-Hassan-Mysore-Solur LPG (2) Source: Oil companies Note: IOCL 1) Koyali-Sanganer pipeline (KSPL) length of 11.3 Km added after Koyali Viramgam section replacement on ) Bijwasan Panipat Naphtha pipeline has been converted into ATF service in June 2016 and renamed as Panipat Bijwasan ATF pipeline 3) 752 Km added in PRRPL since 1st April 2016 by commissioning of PRRPL - Jatni Sambalpur section on , Sambalpur Jharsuguda on , Sambalpur Saraipalli on , Saraipalli Raipur on , Saraipalli Korba section on and Jharsuguda Khunti section on BPCL 1) Kota-Jobner Pipeline is a branch pipeline of Mumbai Manmad Bijwasan pipeline with annual capacity of 1.7 MMTPA.Throughput of this pipeline is included in MMBPL & BKPL pipelines HPCL (1) Awa Salawas Pipeline & Rewari Kanpur Pipeline are branchlines. Throughput of the same are included in Mundra Delhi Pipeline/Ramanmandi Bahadurgarh Pipeline. (2) Mangalore Hassan Mysore Solur LPG Pipeline was commissioned on

43 36

44
45 Table 6.3 : State-wise sales of selected petroleum products : Apr-Sep 2017 (P) State/UT Sales (Sales figures in thousand metric tonnes) LPG MS SKO HSD Total (All products)* Per capita sales (Kg) Sales Per capita sales (Kg) Source: Oil companies Note: * Total (all product) sales include other petroleum products such as Naphtha, FO, ATF, Lubricants, Bitumen etc. - Per capita sales figures are based on provisional sales figures for the period April 2017-September Population figures have been taken from Census of India, 2011 Highest per capita 38 Sales Per capita sales (Kg) Sales Per capita sales (Kg) Total sales Per capita sales (Kg) Chandigarh Delhi Haryana Himachal Pradesh Jammu and Kashmir Punjab Rajasthan Uttar Pradesh Uttarakhand SUB TOTAL NORTH Andaman & Nicobar Islands Bihar Jharkhand Odisha West Bengal SUB TOTAL EAST Arunachal Pradesh Assam Manipur Meghalaya Mizoram Nagaland Sikkim Tripura SUB TOTAL NORTH EAST Chhattisgarh Dadra & Nagar Haveli Daman & Diu Goa Gujarat Madhya Pradesh Maharashtra SUB TOTAL WEST Andhra Pradesh Karnataka Kerala Lakshadweep Puducherry Tamil Nadu Telangana SUB TOTAL SOUTH All India
46 Table 6.4 : PDS SKO allocation State/UT Apr-Sep 2016 Apr-Sep 2017 Chandigarh Delhi Haryana Himachal Pradesh Jammu & Kashmir Punjab Rajasthan Uttar Pradesh Uttarakhand SUB TOTAL NORTH Andaman & Nicobar Islands Bihar Jharkhand Odisha West Bengal SUB TOTAL EAST Arunachal Pradesh Assam Manipur Meghalaya Mizoram Nagaland Sikkim Tripura SUB TOTAL NORTH EAST Chhattisgarh Dadra & Nagar Haveli Daman & Diu Goa Gujarat Madhya Pradesh Maharashtra SUB TOTAL WEST Andhra Pradesh Karnataka Kerala Lakshadweep Puducherry Tamil Nadu Telengana SUB TOTAL SOUTH All India (Kilo litre) Source: MoP&NG Note: Delhi and Chandigarh have been declared Kerosene free from Q3, and Q1, respectively. Panjab and Haryana have been declared Kerosene free from Q1, SKO allocation of Puducherry and Andhra Pradesh has been reduced to Zero w.e.f and respectively. 39
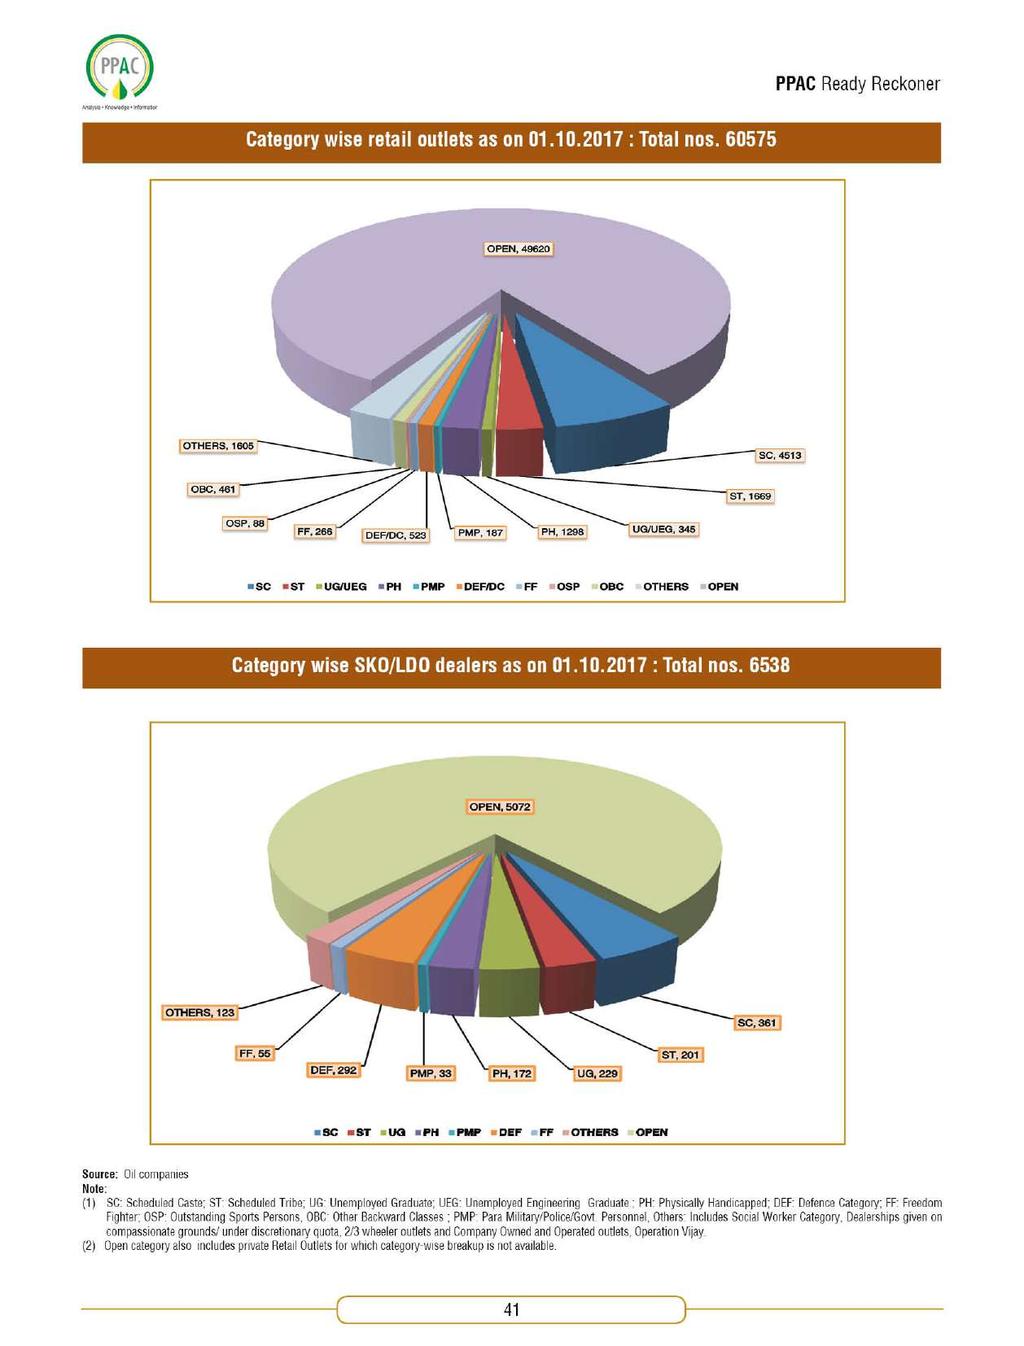
47 Table 6.5 : Oil industry Retail Outlets & SKO / LDO agencies No. of Retail Outlets (as on) No. of SKO/LDO agencies (as on) State/UT (P) (P) Chandigarh Delhi Haryana Himachal Pradesh Jammu and Kashmir Punjab Rajasthan Uttar Pradesh Uttarakhand SUB TOTAL NORTH Andaman & Nicobar Islands Bihar Jharkhand Odisha West Bengal SUB TOTAL EAST Arunachal Pradesh Assam Manipur Meghalaya Mizoram Nagaland Sikkim Tripura SUB TOTAL NORTH EAST Chhattisgarh Dadra & Nagar Haveli Daman & Diu Goa Gujarat Madhya Pradesh Maharashtra SUB TOTAL WEST Andhra Pradesh Karnataka Kerala Lakshadweep Puducherry Tamil Nadu Telangana SUB TOTAL SOUTH All India Source: Oil companies (Includes dealers of private oil companies) 40
48
49 Table 6.6 : Industry marketing infrastructure as on (P) Particulars IOCL BPCL HPCL RIL ESSAR Shell Others Total POL terminal/depots (Nos.) $ 2 6* 319 Aviation fuel stations (Nos.) @ 222 Retail Outlets (total) (Nos.) Out of which, Rural ROs (Nos) ^ SKO/LDO agencies (Nos.) LPG distributors (total) (Nos.) (PSUs only) Out of which, Durgam Kshetriya Vitrak (Nos.) LPG bottling plants (Nos.) (PSUs only) # 189 LPG bottling capacity (TMTPA) (PSUs only) ~ LPG registered domestic consumers (Nos. crore) (PSUs only) Source: Oil companies Note: $ RIL- 5 Terminals and 13 mini Depots * MRPL-4 and Shell MRPL-1; ^ MRPL-4 # NRL-1; ~ NRL-24 Table 6.7 : Break-up of consumption data (PSU and Pvt.) (Thousand metric tonne) Product Apr-Sep 2016 Apr-Sep 2017 (P) PSU Private Total PSU Private Total PSU Private Total PSU Private Total PSU Private Total LPG MS Naphtha ATF SKO HSD LDO Lubes FO/LSHS Bitumen PetCoke Others Total Source: Oil companies Note : Private consumption also include private imports 42

50 43
51 Table 7.1 : LPG marketing at a glance (Thousand metric tonne ) Particulars Apr-Sep 2016 Apr-Sep 2017 (P) LPG Production LPG Consumption PSU Sales Imports Domestic Non-Domestic Bulk Auto LPG PSU Imports Private Imports (Number in lakhs) Enrolment (domestic) As on LPG Customers (registered) of which Domestic customers Non-domestic customers LPG Active domestic customers DBC Customers (registered) LPG Distributors of which (Nos.) Shehri Vitrak Rurban Vitrak Gramin & Durgam Kshetriya Vitrak Auto LPG dispensing stations (ALDS) LPG Markets (excluding RGGLVY) (Thousand metric tonne per annum) Bottling capacity (rated) (Thousand metric tonne) Gross tankage Source: Oil companies & Directorate General of Commercial Intelligence and Statistics (DGCIS) Note: 1. Data in respect of enrolment, customers, distributors, ALDS and rated bottling capacity pertains to PSU OMCs only. 2. Gross tankage includes LPG tankage at all refineries and fractionators, PSU OMCs bottling plants and LPG tankage available to PSU OMCs at import locations. 3. MOPNG vide letter no. P-20019/2/2016-LPG dated 23 June 2016 had issued unified guidelines for selection of LPG distributors. In the said guidelines, LPG distributor categories have been redefined. The historical data on LPG distributors has been rearranged in line with the new classification for comparison. 44
52 Table 7.2 : Number of LPG distributors as on (P) State/UT Sheheri Vitrak Rurban Vitrak Gramin Vitrak Durgam Kshetriya Vitrak Figures in Numbers Chandigarh Delhi Haryana Himachal Pradesh Jammu & Kashmir Punjab Rajasthan Uttar Pradesh Uttarakhand Sub Total North Arunachal Pradesh Assam Manipur Meghalaya Mizoram Nagaland Sikkim Tripura Sub Total North-East Andaman & Nicobar Islands Bihar Jharkhand Odisha West Bengal Sub Total East Chhattisgarh Dadra & Nagar Haveli Daman & Diu Goa Gujarat Madhya Pradesh Maharashtra Sub Total West Andhra Pradesh Karnataka Kerala Lakshadweep Puducherry Tamil Nadu Telangana Sub Total South All India Source: PSU OMCs (IOCL,BPCL and HPCL) Note: MOPNG vide letter no. P-20019/2/2016-LPG dated 23 June 2016 has issued unified guidelines for selection of LPG distributors. In the said guidelines, LPG distributor categories have been redefined as above. Total 45
53 Table 7.3 : LPG domestic customer population (registered) of PSU OMCs as on (P) (Number in lakhs) State/UT Total Double bottle connection (DBC) Chandigarh Delhi Haryana Himachal Pradesh Jammu & Kashmir Punjab Rajasthan Uttar Pradesh Uttarakhand Sub Total North Arunachal Pradesh Assam Manipur Meghalaya Mizoram Nagaland Sikkim Tripura Sub Total North East Andaman & Nicobar Islands Bihar Jharkhand Odisha West Bengal Sub Total East Chhattisgarh Dadra & Nagar Haveli Daman & Diu Goa Gujarat Madhya Pradesh Maharashtra Sub Total West Andhra Pradesh Karnataka Kerala Lakshadweep Puducherry Tamil Nadu Telangana Sub Total South All India Source: PSU OMCs (IOCL,BPCL and HPCL) 46
54 Table 7.4: LPG coverage (estimated) as on (P) State/UT No. of households Census 2011 Estimated households as on Active connections as on (Number in lakhs) LPG coverage (%) Chandigarh Delhi Haryana Himachal Pradesh Jammu & Kashmir Punjab Rajasthan Uttar Pradesh Uttarakhand Sub Total North Arunachal Pradesh Assam Manipur Meghalaya Mizoram Nagaland Sikkim Tripura Sub Total North East Andaman & Nicobar Islands Bihar Jharkhand Odisha West Bengal Sub Total East Chhattisgarh Dadra & Nagar Haveli Daman & Diu Goa Gujarat Madhya Pradesh Maharashtra Sub Total West Andhra Pradesh Karnataka Kerala Lakshadweep Puducherry Tamil Nadu Telangana Sub Total South All India Source: PSU OMCs (IOCL, BPCL and HPCL) 47
55 Table 7.5 : LPG domestic customers enrolment (14.2 kg/5 kg) by PSU OMCs (Number in lakhs) State/UT Apr-Sep Kg 5 Kg Total 14.2 Kg 5 Kg Total Chandigarh Delhi Haryana Himachal Pradesh Jammu & Kashmir Punjab Rajasthan Uttar Pradesh Uttarakhand Sub Total North Arunachal Pradesh Assam Manipur Meghalaya Mizoram Nagaland Sikkim Tripura Sub Total North East Andaman & Nicobar Islands Bihar Jharkhand Odisha West Bengal Sub Total East Chhattisgarh Dadra & Nagar Haveli Daman & Diu Goa Gujarat Madhya Pradesh Maharashtra Sub Total West Andhra Pradesh Karnataka Kerala Lakshadweep Puducherry Tamil Nadu Telangana Sub Total South All India Source: PSU OMCs (IOCL, BPCL and HPCL) 48
56
57 Table 8.1 : Price of crude oil in India Year Indian basket crude oil ($/bbl) (up to ) : Month wise Jan Feb Mar Apr May Jun Jul Aug Sep Oct Note : The Indian basket of Crude Oil (for ) represents a derived basket comprising of Sour grade (Oman & Dubai average) and Sweet grade (Brent Dated) of Crude oil processed in Indian refineries in the ratio of 72.38:27.62 during

58
59
60 Table 8.2 : Price build-up of PDS SKO at Mumbai Sl. no. Elements Unit Effective * FOB Price at Arab Gulf of jet / kero (kerosene) $/bbl * Add: Ocean freight from AG to Indian ports $/bbl C&F (cost & freight) price $/bbl or `/litre * Import charges (insurance/ocean loss/ LC charge/port dues) `/litre * Customs duty `/litre NIL 6* Import Parity Price (IPP) (at 29.5º C) (sum of 3 to 5) `/litre * Refinery Transfer Price (RTP) for PDS Kerosene** (price paid by the oil marketing companies to refineries) `/litre * Add : Inland freight and delivery charges `/litre * Add : Marketing cost of OMCs `/litre * Add : Marketing margin of OMCs `/litre Total cost price (sum of 7 to 10) (Before GST and wholesale & retail dealer commission) `/litre * Less: Under-recovery to OMCs `/litre * Price charged to dealers (depot price) (11-12) (Excluding GST) Add : Wholesale & retail dealer commission and other charges fixed by state Government `/litre `/litre * Add : GST (including GST on wholesale & retail dealer `/litre Retail Selling Price (RSP) at Mumbai *** (sum of 13 to 15) `/litre * The explanatory notes are given in Table 8.3. **Monthly RTP is weighted average of all Indian pricing ports. *** The price revision is subject to notification from the state Govt. 53
61 Table 8.3 : Element wise explanation of price build up of PDS kerosene Sl. no. Elements Description 1 FOB price FOB (free on board) daily quotes of jet/kerosene at Arab Gulf including premium / discount published by Platts and Argus publications are averaged for the previous month. 2 Ocean freight Ocean freight from Arab Gulf to destination Indian ports as per World Scale freight rates adjusted for AFRA. 4 Import charges Import charges comprises of insurance, ocean loss, LC charges & port dues applicable on import of product. 5 Customs duty Customs duty on PDS kerosene is nil. 6 Import Parity Price (IPP) IPP represents the price that importers would pay in case of actual import of kerosene at the respective Indian ports. 7 Refinery Transfer Price (RTP) RTP based on Import Parity Price is the price paid by OMCs to refineries. 8 Inland freight & delivery charges It comprises of average freight from ports to inland locations and delivery charges. 9 & 10 Marketing cost & margin Marketing cost & margin are as fixed in the 'PDS Kerosene and LPG (Domestic) Subsidy Scheme, 2002'. 12 Under recovery to OMCs Difference between desired price (based on import parity) and actual selling price (excluding GST, wholesale & retail dealer commission and other charges) represents under-recoveries to OMCs. 14 Wholesale & retail dealer commission and other charges fixed by state Government Commission fixed for wholesale & retail dealer and other charges like delivery charges by district authorities / state Government. 15 GST GST Rate as applicable on PDS SKO is 5%. 54
62 Table 8.4 : Price build-up of domestic LPG at Delhi Sl. no. Elements Unit Effective * FOB Price at Arab Gulf (AG) of LPG $/MT * Add: Ocean freight from AG to Jamnagar $/MT C&F (Cost & Freight) price $/MT or `/cylinder * Import charges (insurance/ocean loss/ LC charge/port dues) `/cylinder * Customs Duty `/cylinder NIL 6* Import Parity Price (IPP) (sum of 3 to 5) `/cylinder * Refinery Transfer Price (RTP) for domestic LPG (price paid by the oil marketing companies to refineries) `/cylinder * Add: Storage / distribution cost & return on investment `/cylinder * Add: Bottling charges `/cylinder * Add: Charges for cylinder cost `/cylinder * Add: Inland freight `/cylinder Bottling plant cost before stock loss and working capital (sum of 7 to 11) `/cylinder * Add: Cost of working capital `/cylinder Cost price at LPG bottling plant (sum of 12 to 13) `/cylinder * Add: Delivery charges `/cylinder * Add : Uncompensated Costs `/cylinder Market determined price (sum of 14 to 16) `/cylinder * Add : GST(including GST on Distributor `/cylinder * Add : Distributor commission `/cylinder Retail Selling Price (RSP) (sum of 17 to 19) `/cylinder RSP at Delhi (Rounded) `/cylinder * Less: Cash compensation on LPG by Government to consumers under DBTL `/cylinder * Less: Cash compensation on LPG by OMCs, towards 'Uncompensated Costs' charged in the current RSP, to consumers `/cylinder Effective cost to consumer after subsidy ( ) `/cylinder * The explanatory notes are given in table
63 Table 8.5 : Element wise explanation of price build up of domestic LPG Sl. no. Elements Description 1 FOB price 2 Ocean freight 4 Import charges FOB (free on board) of LPG is weighted average of Saudi Aramco contract price (CP) for butane (60%) & propane (40%) for previous month and also includes daily quotes of premium / discount (published by Platts Gaswire) averaged for the previous month. Ocean freight from Arab Gulf to destination Indian port (i.e. Jamnagar) based on charter hire rates obtained from Clarkson Shipping Intelligence weekly. Import charges comprises of insurance, ocean loss, LC charges & port dues applicable on import of LPG. 5 Customs duty Customs duty on domestic LPG is nil. 6 Import Parity Price (IPP) 7 Refinery Transfer Price (RTP) IPP represents the price that importers would pay in case of actual import of product at the respective Indian ports. Import parity principle is as envisaged in the 'PAHAL (DBTL) Scheme, 2014'. RTP is based on import parity price. This is the price paid by the oil marketing companies to domestic refineries for purchase of finished petroleum products at refinery gate. 8 Storage/distribution cost & return on investment Storage/distribution cost & return on investment as fixed under notified 'PAHAL (DBTL) Scheme, 2014'. 9 Bottling charges 10 Charges for cylinder cost The cost incurred towards filling LPG in 14.2 Kg. cylinders as per notified PAHAL (DBTL) Scheme, 2014'. 11 Inland freight It comprises of freight from port to inland locations i.e. bottling plant. 13 Cost of working capital Interest on working capital for 18 days stock holding at SBI prime lending rate (PLR) as fixed under notified PAHAL (DBTL) Scheme, 2014'. 15 Delivery charges It comprises of freight from bottling plant to distributor. 16 Uncompensated costs (import costs, recovery for non-revision, rounding-off & delivery charges) In the price buildup, oil marketing companies are charging the consumers on account of import costs, rounding-off & differential delivery charges. All these costs are not compensated to OMCs as per the PAHAL (DBTL) scheme. 18 GST GST rate as applicable on Domestic LPG is 5% 19 Distributor commission LPG distributor commission ` 49.25/Cylinder (including additional distributor commission) is as approved by MoP&NG. 22 & 23 Cash compensation to consumer under DBTL (including impact of uncompensated cost to OMCs) Under DBTL Scheme, the difference between the price of domestic subsidized & nonsubsidized LPG is being transferred to the bank account of consumers by OMCs. This also includes the uncompensated amount (as per S.No.16 above) which is borne by the OMCs. 56
64 Table 8.6 : Summarised buildup of Retail Selling Price (RSP) of petrol at Delhi w.e.f. 1 st November 2017 Particulars Refinery Transfer Price (RTP) on landed cost basis for BS IV petrol (price paid by the Oil Marketing Companies (OMCs) to refineries) `/Litre* Price charged to dealers (excluding excise duty and VAT) Add : Excise duty Add : Dealer's commission 3.57 Add : VAT (including VAT on dealer's commission) applicable for 27% RSP at Delhi (rounded) *As per IOCL. Table 8.7 : Summarised buildup of Retail Selling Price (RSP) of diesel at Delhi w.e.f. 1 st November 2017 Particulars `/Litre* Refinery Transfer Price (RTP) on landed cost basis for BS IV diesel (price paid by the Oil Marketing Companies (OMCs) to refineries) Price charged to dealers (excluding excise duty and VAT) Add : Excise duty Add : Dealer's commission 2.51 Add : VAT (including VAT on dealer's commission) applicable for 16.75% & Air ambience charges (pollution cess) ` 250/KL 8.53 RSP at Delhi (rounded) *As per IOCL. 57
65 Table 8.8 : Summarised buildup of Retail Selling Price (RSP) of PDS kerosene at Mumbai w.e.f. 15 th November 2017 Particulars Refinery Transfer Price (RTP) for PDS kerosene (price paid by the Oil Marketing Companies (OMCs) to refineries) Total cost price -before GST and dealer's commission ` / litre Less: Under-recovery to OMCs Price charged to dealers (depot price) - excluding GST and dealer's commission Add : Wholesaler & retailer commission and other charges fixed by state Government Add : GST (including GST on Wholesale & Retailer 1.04 RSP at Mumbai (rounded) Table 8.9 : Summarised buildup of Retail Selling Price (RSP) of domestic LPG at Delhi w.e.f. 1 st November 2017 Particulars Refinery Transfer Price (RTP) for domestic LPG (price paid by the Oil Marketing Companies (OMCs) to refineries) `/14.2 KG Cylinder Price charged to distributor (market determined price) Add : Distributors' commission Add : GST(including GST on Distributor RSP at Delhi (rounded) Less: Cash compensation by Government to consumers under DBTL Less: Cash compensation by OMCs towards 'Uncompensated Costs' charged in the current RSP to consumers Effective cost to consumer after subsidy
66 Share of taxes in Retail Selling Price (RSP) of petroleum products Table 8.10 : Share of taxes in RSP of petrol effective 1 st November 2017 at Delhi Particulars `/Litre Share in RSP Price excluding taxes and dealers' commission % Customs duty 0.58 Excise duty Total central taxes % Price charged to dealers - depot price VAT (Including VAT on dealer's commission) Total state taxes % Total taxes % Dealer's commission % RSP per litre (rounded) % Table 8.11 : Share of taxes in RSP of diesel effective 1 st November 2017 at Delhi Particulars `/Litre Share in RSP Price excluding taxes and dealer's commission % Customs duty 0.59 Excise duty Total central taxes % Price charged to dealers - depot price VAT (Including VAT on dealer's commission) 8.53 Total state taxes % Total taxes % Dealer's commission % RSP per litre (rounded) % Table 8.12 : Break up of current excise duty on petrol & diesel (effective 4 th October 2017) Particular Petrol Diesel Basic duty Additional excise duty (road cess) Special additional excise duty Total excise duty Note : 1. The prices of petrol and diesel are as per IOCL at Delhi. 2. Customs duty on petrol and diesel as per RTP for 1 st November (`/Litre) 59
67 Share of taxes in Retail Selling Price (RSP) of petroleum products Table 8.13 : Share of taxes in RSP of PDS kerosene effective 15 th November 2017 at Mumbai Particulars `/Litre Share in RSP Total price before Government levies Less : Under-recovery to OMCs Price excluding taxes and dealers' commission % Customs duty - GST (Including GST on wholesaler and retailer commission) 1.04 Total taxes % Wholesaler and retailer commission % RSP per litre (rounded) % Table 8.14 : Share of taxes in RSP of domestic LPG effective 1 st November 2017 at Delhi Particulars `/Cylinder Share in RSP Price excluding taxes and distributors' commission % Customs duty - GST (including GST on distributors' commission) Total taxes % Distributor's commission % RSP per cylinder (rounded) % Less: Cash compensation by Government to consumers under DBTL Less: Cash compensation by OMCs towards 'Uncompensated Costs' charged in the current RSP to consumer Effective cost to consumer after DBTL subsidy
68 Table 8.15 : Weightage of petroleum products in Wholesale Price Index (WPI) Product Weight in % High Speed Diesel (HSD) 3.10 Petrol 1.60 Naphtha 0.87 Furnace Oil (FO) 0.67 LPG 0.64 Aviation Turbine Fuel (ATF) 0.32 Lube Oils 0.29 Bitumen 0.23 Kerosene 0.19 Petroleum Coke 0.05 Total 7.96 Source: Website of Office of the Economic Adviser, Ministry of Commerce & Industry Table 8.16 : Estimated impact of increase in Retail Selling Price (RSP) of major petroleum products on inflation (WPI index) Product Increase in RSP Increase in inflation (WPI index) Petrol ` 1/ litre 0.03% Diesel ` 1/ litre 0.06% PDS kerosene ` 1/ litre 0.01% Domestic LPG ` 10/ cylinder 0.02% Note: Based on September 2017 WPI index ( Series). 61
69 Important terms in pricing of petroleum products 1. Import Parity Price (IPP) IPP represents the price that importers would pay in case of actual import of product at the respective Indian ports. This includes the following elements: i. FOB Price, ii. Ocean freight, iii. Insurance, iv. Customs duty, v. Port dues etc. 2. Export Parity Price (EPP) - EPP represents the price which oil companies would realize on export of petroleum products. This includes the following elements: i. FOB Price ii. Advance licence benefit for duty free import of crude oil pursuant to export of refined products (currently nil) 3. Refinery Gate Price (RGP): This is the price paid by the Oil Marketing Companies to refineries for purchase of finished petroleum products at refinery gate. 4. Retail Selling Price (RSP): This is the final price, inclusive of all duties and taxes, charged to the consumer. Dealer s / distributor s commission on petroleum products Table 8.17 : Dealer s commission on petrol & diesel (Figures in ` /KL) Effective date Petrol Diesel As on 1-Apr Jun Aug Mar May May Oct Sep Jul Oct Dec-13 ` /KL % of product billable price Oct-14 ` /KL % of product billable price ` /KL % of product billable price 01-Aug-15 ` /KL % of product billable price ` /KL % of product billable price 16-Nov-15 ` /KL % of product billable price ` /KL % of product billable price 01-Jun-16 ` /KL % of product billable price ` /KL % of product billable price 05-Oct-16 ` /KL % of Product Billable Price ` /KL % of Product Billable Price 16-Nov-16 ` /KL % of Product Billable Price ` /KL % of Product Billable Price 01-Apr-17 ` /KL % of Product Billable Price ` /KL % of Product Billable Price 01-Jul-17 ` /KL % of Product Billable Price ` /KL % of Product Billable Price 01-Aug-17 ` /KL % of Product Billable Price ` /KL % of Product Billable Price Note: In addition, effective 1 st August 2017 slab based incentives is also given to eligible dealers through credit notes. 62
70 Table 8.18 : Wholesale dealer s commission on PDS kerosene Effective date With Form XV Other than Form XV (`/KL) As on 01-April Mar May Jul Sep Dec Oct Feb Oct Sep Effective date Table 8.19: Distributor s commission on domestic LPG 14.2 KG cyl. 63 Additional commission for sale at market determined price (`/14.2 KG cyl.) 5 KG cyl. As on 01-April NA Mar NA Jun NA Jun NA Jul NA Oct Dec Oct Dec Jan Feb Mar May Jun Jul Aug Sep Oct Oct Nov Dec Feb Mar Apr May Jun Jul Aug Sep Sep Oct Nov Source: MoP&NG circulars & OMCs (`/ Cylinder)
71 Table 8.20 : Revisions in RSP of petroleum products at Delhi since Petrol Diesel PDS Domestic LPG Date kerosene (`/litre) (`/14.2 Kg cyl.) Prices as on Reason Increase in prices Increase in siding - shunting charges VAT reduction in Delhi Revision in dealer's commission Increase in price Increase in price Increase in siding - shunting charges Increase in price Increase in price Increase in price Increase in transportation charges Increase in price Increase in prices Increase in siding & shunting charges/ dealer's commission Increase in price Rebate of ` per litre in VAT on Diesel at Delhi Increase in price Reduction in price Reduction in price Increase in price Reduction in price Rebate on petrol / Removal of rebate on diesel in Delhi Reduction in price Increase in price Revision in siding - shunting charges 64
72 Table 8.20: Continued Date Petrol Diesel PDS kerosene (`/litre) Subsidized Domestic LPG (`/14.2 Kg cyl.) Non-subsidized Increase in price Reason Price notified for non-subsidized domestic LPG Increase in price Revision in siding - shunting charges Increase in domestic LPG distributor's commission Reduction in price Increase in dealer's commission Increase in price Reduction in price Reduction in price Removal of rebate in VAT at Delhi Increase (diesel & non-subsidized domestic LPG)/ reduction (petrol) in prices Increase in dealer's commission Increase in prices Reduction in price Increase in price Reduction in price Increase in price Revision in siding - shunting charges / reduction in price of nonsubsidized domestic LPG Reduction in price Reduction in petrol price/ Increase in delivery charges of diesel Reduction in prices Increase in price Increase (petrol and diesel) / reduction (non-subsidized domestic LPG) in prices Increase in price Increase in price & delivery charges of petrol Increase in delivery charges of diesel/ increase in price of nonsubsidized domestic LPG Increase in price Increase in price Increase in prices Increase in prices Increase in price Increase (diesel & non-subsidized domestic LPG)/ reduction (petrol) in price 65
73 Table 8.20: Continued Date Petrol Diesel PDS kerosene (`/litre) Subsidized Domestic LPG (`/14.2 Kg cyl.) Non-subsidized Reason Increase (diesel)/ reduction (petrol & non-subsidized domestic LPG) in price Increase in prices Increase in distributor's commission on domestic LPG Increase in price of petrol & Increase in dealer's commission on petrol and diesel Increase in prices Increase (diesel)/ reduction (non-subsidized domestic LPG) in price Increase (petrol & diesel)/ reduction (non-subsidized domestic LPG) in Price Reduction in prices (petrol & non-subsidized domestic LPG)/ increase in delivery charges of diesel Reduction in price Reduction in price Increase in price Increase (diesel)/ reduction (non-subsidized domestic LPG) in price Increase in price Increase in rail freight Increase in prices Increase (diesel)/ reduction (petrol & non-subsidized domestic LPG) in price Reduction in price Increase (diesel)/ reduction (petrol) in price Reduction in price Reduction in price Reduction in price Reduction in price Increase in domestic LPG distributor s commission * Reduction in price/ price of PDS kerosene at Mumbai Reduction in prices Reduction in prices Reduction in price Reduction in prices Reduction in price Reduction in prices Increase in dealer's commission Increase in prices 66
74 Table 8.20 : Continued Date Petrol Diesel PDS kerosene (`/litre) RSP Domestic LPG Effective cost after DBTL subsidy# (`/14.2 Kg cyl.) Reason Increase (non-subsidized domestic LPG)/ reduction (petrol and diesel) in prices Reduction in prices Increase (petrol and diesel) / reduction (domestic LPG) in prices Increase in prices Increase in price Increase (petrol) / reduction (diesel) in price Reduction in prices Reduction in price & increase in VAT rates at Delhi Reduction in prices Reduction in prices Reduction in prices Increase (diesel)/ reduction (domestic LPG) in price Increase in prices Decrease (petrol) / Increase (domestic LPG) in price / Increase in delivery charges of petrol & diesel Increase in prices Increase (domestic LPG)/ reduction (petrol and diesel) in price Increase in distributor's commission on domestic LPG Reduction in prices Increase (domestic LPG)/ reduction (petrol and diesel) in price / increase in additional distributor's commission on LPG Increase in excise duty on petrol and diesel without increase in RSPs Reduction in price along with increase in excise duty Increase in VAT rates at Delhi Increase in excise duty on petrol and diesel without increase in RSP Reduction in delivery charges of petrol and diesel/ reduction in price and additional distributor's commission of domestic LPG Reduction in price of petrol and increase in price of diesel Reduction in price of petrol/ increase in price of diesel/ reduction in additional distributor's commission of domestic LPG Increase in dealer's commission Increase in prices Reduction in price Increase in prices Reduction in prices Reduction in SSC on PDS kerosene in Mumbai 67
75 Table 8.20 : Continued Date Petrol Diesel PDS kerosene (`/litre) RSP Domestic LPG Effective cost after DBTL subsidy# (`/14.2 Kg cyl.) Reason Increase in prices of petrol, diesel & non-subsidized domestic LPG/ increase in additional distributor's commission on domestic LPG Increase in prices Increase in prices of petrol, diesel & non-subsidized domestic LPG/ increase in additional distributors' commission on domestic LPG Reduction in SSC on PDS kerosene in Mumbai Increase in prices Reduction in prices of petrol, diesel & non subsidized domestic LPG/ increase in price of subsidized domestic LPG / reduction in additional distributors' commission of domestic LPG Increase in price of PDS SKO Reduction in prices Reduction in prices of petrol, diesel & non sub. domestic LPG/ increase in price of subsidized domestic LPG / reduction in addl. distributor commission of domestic LPG Reduction in prices of petrol and diesel/ Increase in SSC on PDS SKO at Mumbai Increase in prices of petrol, diesel, PDS kerosene & subsidized domestic LPG / Reduction in price of non sub. domestic LPG/ reduction in LPG additional distributor commission Increase (petrol & PDS SKO)/ reduction (diesel) in price Increase in SKO retailers' commission at Mumbai Increase in prices of Petrol, Non Sub. Domestic LPG, Subsidized domestic LPG and PDS Kerosene/ Reduction in price of Diesel/ Increase in LPG Addl. distributor commission Increase in dealers' commission on petrol and diesel Increase in prices of petrol, diesel and PDS kerosene Increase in distributos' commission Increase in prices of non subsidized domestic LPG, subsidized domestic LPG and PDS kerosene/ Increase in LPG additional distributors' commission Increase in prices of Petrol and Diesel Decrease in prices of Petrol & Diesel (including dealers commission) / Increase in price of PDS Kerosene Increase in price of Petrol & decrease in price of Diesel (including dealers commission) / Increase in prices of Non Sub. Domestic LPG, Subsidized domestic LPG and PDS Kerosene/ Increase in LPG Addl. Distributor comm Increase in price of PDS kerosene Increase in prices of petrol and diesel Increase in price of PDS Kerosene / Non Sub. Domestic LPG, Subsidized domestic LPG Increase in prices of petrol and diesel 68
76 Table 8.20 : Continued Date Petrol Diesel PDS kerosene (`/litre) RSP Domestic LPG Effective cost after DBTL subsidy# (`/14.2 Kg cyl.) Reason Increase in prices of petrol, diesel and PDS Kerosene Increase in price of PDS Kerosene / Non Sub. Domestic LPG, Subsidized domestic LPG Increase in price of Non Sub. Domestic LPG/ Additional Distributors commission on Subsidized domestic LPG Decrease in price of Petrol, Diesel & Non Sub. Domestic LPG / Increase in prices of Subsidized domestic LPG and / Decrease in LPG Addl. Distributor comm Increase in prices of PDS Kerosene Increase in price of Petrol, Diesel & PDS Kerosene Increase in price of Petrol, Diesel, PDS SKO & Sub. Domestic LPG / Decrease in prices of Non-Subsidized domestic LPG and Decrease in LPG Addl. Distributor comm Decrease in price of Petrol and Diesel & Increase in prices of PDS SKO Increase in price of Petrol, Diesel, PDS SKO & Sub. Domestic LPG / Decrease in prices of Non-Subsidized domestic LPG and Decrease in LPG Addl. Distributor comm Decrease in price of Petrol and Diesel & Increase in prices of PDS SKO Decrease in price of Petrol, Diesel & Increase in prices of PDS SKO & Sub. Domestic LPG / Non-Subsidized domestic LPG and Decrease in LPG Addl. Distributor comm Increase in Price of Petrol and diesel and Revision in SSC on PDS SKO in Mumbai Increase in prices of Petrol, Diesel & PDS SKO Increase in price of Petrol, Diesel, PDS SKO & Sub. Domestic LPG, Dealer Commission on Petrol & Diesel / Decrease in price of Non-Subsidized domestic LPG and LPG Addl. Distributor comm Increase in price of Petrol, Diesel & PDS SKO Increase in price of Petrol, PDS SKO, Sub. Domestic LPG, Non-Subsidized domestic LPG and LPG Addl. Distributor comm. & Decrease in price of Diesel Increase in price of Petrol, Diesel & PDS SKO Increase in price of Petrol, diesel, Sub. Domestic LPG, Non-Subsidized domestic LPG and LPG Addl. Distributor comm Decrease in price of Petrol & diesel and Increase in price of Sub. Domestic LPG, Non-Subsidized domestic LPG and LPG Addl. Distributor comm Increase in Price of Petrol and diesel and Removal in SSC on PDS SKO in Mumbai * # RSP as on 15 th November 2017 Note : 1. Prices of petrol since , non subsidized domestic LPG since and diesel since are as per IOCL. 2. * Since there is Nil allocation of PDS kerosene in Delhi currently, RSP of PDS kerosene from onwards is at Mumbai. 3. # effective 1st January 2015, Modified DBTL scheme has been implemented in the entire country. The effective cost to consumer is after DBTL subsidy. 4. Effective , the MS/HSD pricing is revised on daily basis, therefore the changes in MS/HSD pricing is shown only on the dates when SKO / LPG Pricing is changing. 69
77 Table 8.21 : Selling price of diesel for bulk consumers in major cities Date Delhi Kolkata Mumbai Chennai 18-Jan Feb Feb Mar Mar Apr Apr May May May Jun Jun Jul Jul Jul Aug Aug Sep Sep Oct Oct Nov Nov Dec Jan Jan Feb Feb Mar Mar Apr Apr May May Jun Jun Jul Jul Aug Aug Sep Sep Oct Nov Dec Dec Jan Feb Feb Mar Apr Apr May May Jun Source : HPCL (`/Litre) Date Delhi Kolkata Mumbai Chennai 01-Jul Jul Aug Aug Sep Oct Oct Nov Nov Dec Dec Jan Jan Jan Feb Feb Mar Mar Apr Apr May May May Jun Jun Jul Jul Aug Aug Sep Sep Oct Oct Nov Nov Dec Dec Jan Jan Apr Apr May May Jun Jun Jul Jul Aug Aug Sep Sep Oct Oct Oct Nov
78 Table 8.22 : Retail Selling Price (RSP) of major products in India & neighbouring countries Indian rupees (`)/ litre/ cyl. Country Petrol Diesel Kerosene Domestic LPG India 69.14^ 57.73^ 21.89# * Pakistan Bangladesh Sri Lanka Nepal *Effective cost after DBTL subsidy effective # at Mumbai effective ^ as per IOCL as on Note: Prices for neighboring countries as on Source: Website of following companies: Pakistan- Pakistan State Oil ( Bangladesh- Bangladesh Petroleum Corporation ( Nepal- Nepal Oil Corporation ( Sri Lanka- Petrol; Diesel & Kerosene- Ceylon Petroleum Corporation ( LPG- Litro Gas Lanka ( Exchange rate - Retail Selling Price (RSP) & % of taxes in RSP of petrol and diesel in developed countries vis-a-vis India Table 8.23 : Price and tax in Indian rupees (`) / litre Country Petrol Diesel RSP Ex-tax price Taxes % of taxes RSP Ex-tax price Taxes % of taxes India % % France % % Germany % % Italy % % Spain % % UK % % Japan % % Canada % % USA % % Table 8.24 : Price and tax in US dollars ($) / Litre Country Petrol Diesel RSP Ex-tax price Taxes % of taxes RSP Ex-tax price Taxes % of taxes India % % France % % Germany % % Italy % % Spain % % UK % % Japan % % Canada % % USA % % Note : 1. Prices of petrol and diesel in France, Germany, Italy, Spain, UK, Japan, Canada & USA as per the IEA report for September 2017 and average exchange rate of September 2017 considered for conversion: ` 64.44/USD. (VAT excluded from prices for automotive diesel for France, Italy, Spain and UK as it is refunded to industry.) 2. Prices in India as of as per IOCL. Average exchange rate of October 2017 considered for conversion ` 65.08/$. 71
79 Table 8.25 : Retail Selling Price (RSP) of petroleum products at State/UT capitals as on State/Union Territory City Petrol Diesel Domestic LPG (`/litre) (`/14.2 KG cylinder) States Andhra Pradesh Vizag* Arunachal Pradesh Itanagar Assam Guwahati Bihar Patna Chhattisgarh Raipur Goa Panjim Gujarat Gandhinagar Haryana Ambala Himachal Pradesh Shimla Jammu & Kashmir Srinagar Jharkhand Ranchi Karnataka Bengaluru Kerala Thiruvananthapuram Madhya Pradesh Bhopal Maharashtra Mumbai Manipur Imphal Meghalaya Shillong Mizoram Aizawl Nagaland Kohima Odisha Bhubaneswar Punjab Jullunder Rajasthan Jaipur Sikkim Gangtok Tamil Nadu Chennai Telangana Hyderabad Tripura Agartala Uttarakhand Dehradun Uttar Pradesh Lucknow West Bengal Kolkata Union territory Andaman & Nicobar Islands Port Blair Chandigarh Chandigarh Daman & Diu Daman* Dadra & Nagar Haveli Silvasa* Delhi New Delhi Puducherry Puducherry Source: IOCL (* as per HPCL) Highest Lowest Table 8.26 : Retail Selling Price (RSP) of PDS kerosene at major cities as on State City (`/litre) Maharashtra Mumbai* Tamil Nadu Chennai * West Bengal Kolkata * Source: OMCs Note: The allocation of PDS kerosene in Delhi is nil presently. *Subject to confirmation by local authorities 72
80 Particulars Crude oil Petrol Table 8.27 : Customs, excise duty and GST rates on petroleum products as on Customs Duty and Excise Duty as on 1 st November 2017 on Non GST Products Basic customs duty NIL + ` 50/MT as NCCD Customs duty Additional customs duty (CVD) 2.5% ` 6.48/ltr. + ` 7.00/ ltr SAD Additional customs duty * 8% for supply to schedule commuter airlines(sca) from the regional connectivity scheme (RCS)airports. # Education cess of 2% and Secondary and Higher Education Cess of 1% is also applicable on Customs duty. Basic cenvat duty Nil NA Nil+ 20% + ` 50/ MT as NCCD Central excise duty Special additional excise duty NA Additional excise duty ` 6.00/ltr. ` 6.48/ltr ` 7.00/ltr ` 6.00/ltr. Petrol (branded) 2.5% ` 7.66/ltr. + ` 6.00/ltr. ` 7.66/ltr ` 7.00/ltr ` 6.00/ltr. ` 7.00/ ltr SAD High speed diesel 2.5% ` 8.33/ltr+ ` 6.00/ltr. ` 8.33/ltr ` 1.00/ltr ` 6.00/ltr. ` 1.00/ ltr High speed diesel (branded) 2.5% ` 10.69/ltr+ ` 6.00/ltr. ` 10.69/Ltr ` 1.00/ltr ` 6.00/ltr. ` 1.00/ ltr Aviation Turbine Fuel (ATF) Nil 14%* Nil 14%* Nil Nil Liquefied Natural Gas (LNG) 2.5% Nil Nil Nil Nil Nil Natural gas [gaseous state] 5.0% Nil Nil Nil Nil Nil Natural gas [compressed] 5.0% 14.0% Nil 14.0% Nil Nil Custom Duty and GST Rates as on 1 st November 2017 on GST Products Particulars Customs duty Basic IGST/ CVD LPG Domestic Nil 5.00% Non - Domestic 5.00% 18.00% Kerosene PDS Nil 5.00% Non PDS 5.00% 18.00% Naphtha Non- Fertilizer 5.00% 18.00% Fertilizer Nil 18.00% Butane / Propane Non - Domestic 2.50% 18.00% Domestic Nil 5.00% Bitumen & Asphalt 5.00% 18.00% Furnace Oil Fertilizer Nil 18.00% Non- Fertilizer 5.00% 18.00% Light Diesel Oil 5.00% 18.00% Low Sulphur Heavy Stock/ HPS & Fertilizer 5.00% 18.00% other Res. Non- Fertilizer 5.00% 18.00% Lube oil/greases 5.00% 18.00% Petroleum Coke 2.50% 18.00% Petroleum Jelly 5.00% 18.00% Transformer Oil 5.00% 18.00% Waxes all types 5.00% 18.00% NA 73
81 Sl. no. States Table 8.28 : Effective rates of Sales tax/vat/gst levied by various states/uts as on State/Union Territory Petrol Diesel PDS kerosene Domestic LPG % of capital city rate before VAT 1 Andhra Pradesh Arunachal Pradesh Assam Bihar Chhattisgarh Goa Gujarat Haryana Himachal Pradesh Jammu & Kashmir Jharkhand Karnataka Kerala Madhya Pradesh Mumbai, Thane & 15 Maharashtra Navi Mumbai (Rest of State) Manipur Meghalaya Mizoram Nagaland Odisha Punjab Rajasthan Sikkim Tamil Nadu Telangana Tripura Uttarakhand Uttar Pradesh West Bengal Union territories 30 Andaman & Nicobar Islands Chandigarh Dadra & Nagar Haveli Daman & Diu Delhi Lakshadweep NIL NIL Puducherry (As per details provided by HPCL/IOCL) Note: 1. For Petrol & Diesel, effective rate Includes VAT/Sales Tax, cess, entry tax, additional tax & surcharge recoverable in price. 2. For Petrol & Diesel, VAT/ Sales Tax at applicable rates is also levied on Dealer s commission in Arunachal Pradesh, Delhi, Gujarat, Haryana, Madhya Pradesh, Punjab, Chandigarh, Puducherry, Andaman & Nikobar, and Meghalaya.. 3. For domestic LPG, GST at applicable rates is also levied on distributor s commission by all states and UTs. 74
82 Table 8.29 : Actual Rate of Sales Tax/ VAT/GST and Other Taxes Levied by State/UT Governments on Major Petroleum Products as on Sl. no. State/ Union Territory Petrol Diesel PDS kerosene Domestic LPG State Sales Tax /VAT GST 1 Andhra Pradesh 31% VAT + ` 4/litre VAT 22.25% VAT + ` 4/litre VAT 5% 5% 2 Arunachal Pradesh 20% VAT 12.50% VAT 5% 5% 3 Assam 32.66% VAT or ` 14 per litre, whichever is higher 23.66% VAT or ` 8.75 per litre, whichever is higher 5% 5% 4 Bihar 26% VAT 19% VAT 5% 5% 5 Chhattisgarh 25% VAT + ` 2/litre VAT 25% VAT + ` 1/litre VAT 5% 5% 6 Gujarat 20% VAT+ 4% Cess on Town Rate & VAT 20% VAT + 4 % Cess on Town Rate & VAT 5% 5% 7 Goa 17% VAT + 0.5% Green cess 19% VAT + 0.5% Green cess 5% 5% 8 Himachal Pradesh 27% VAT 16% VAT 5% 5% 9 Haryana 25% VAT+5% additional tax on VAT 16.40% VAT+5% additional tax on VAT 5% 5% 10 Jharkhand 11 Jammu & Kashmir 12 Kerala Source : OMCs 22% or ` 15/litre whichever is higher VAT + ` 1000/KL cess 24% MST+ ` 3000/KL employment cess 31.80% sales tax+ ` 1/litre additional sales tax + 1% cess 22% or ` 8.37/litre whichever is higher VAT + ` 1000/KL cess 5% 5% 16% MST+ ` 1000/KL employment cess 5% 5% 24.52% sales tax+ ` 1/litre additional sales tax + 1% cess 5% 5% 13 Karnataka 30% sales tax 19% sales tax 5% 5% 14 Madhya Pradesh 28 % VAT + ` 4/litre VAT 22% VAT 5% 5% Mumbai, Thane 15 Maharashtra & Navi Mumbai 26% VAT+ ` 9/Litre additional tax 24% VAT + ` 1/KL additional tax 5% 5% (Rest of State) 25% VAT+ ` 9/Litre additional tax 21% VAT + ` 1/KL additional tax 5% 5% 16 Manipur 25% VAT 14.50% VAT 5% 5% 17 Meghalaya 22% VAT + 2% surcharge 13.5% VAT +2% surcharge 5% 5% 18 Mizoram 20% VAT 12% VAT 5% 5% 19 Nagaland 23.5% VAT +5% surcharge 13.5% VAT+ 5% surcharge 5% 5% 20 Odisha 26% VAT 26% VAT 5% 5% 21 Punjab 22 Rajasthan 23 Sikkim ` 2050/KL (cess) +28% VAT+10% additional tax on VAT 30% VAT+Rs 1500/KL road development cess 25% VAT+ ` 3000/KL cess + ` 100/KL sikkim consumer welfare fund ` 1050/KL (cess) 13.40% VAT+10% additional tax on VAT 5% 5% 22% VAT+ ` 1750/KL road development cess 5% 5% 17.5% VAT + ` 2500/KL cess + ` 100/KL sikkim consumer welfare Fund 5% 5% 24 Tamil Nadu 34% VAT 25% VAT 5% 5% 25 Telangana 35.20% VAT 27% VAT 5% 5% 26 Tripura 20% VAT 13.50% VAT 5% 5% 27 West Bengal 28 Uttar Pradesh 29 Uttarakhand 25% or ` 13.12/litre whichever is higher as sales tax+ ` 1000/KL cess 26.80% or ` per litre whichever in higher as VAT 25% or ` 17/litre whichever is higher as VAT 17% or ` 7.70/litre whichever is higher as sales tax + ` 1000/KL cess ` 290/KL sales tax rebate 17.48% or ` 9.41 per litre whichever in higher as VAT 17.48% VAT or ` 9.41/litre whichever is higher as VAT 5% 5% 5% 5% 5% 5% Union territories 30 Andaman & Nicobar Islands 6% 6% 5% 5% 31 Chandigarh ` 10/KL cess % VAT ` 10/KL cess % VAT 5% 5% 32 Dadra & Nagar Haveli 20% VAT 15% VAT 5% 5% 33 Daman & Diu 20% VAT 15% VAT 5% 5% 34 Delhi 27% VAT ` 250/KL air ambience charges % VAT 5% 5% 35 Lakshadweep Nil Nil 5% 5% 36 Puducherry 21.15% VAT 17.15% VAT 5% 5% 75
83 Table 8.30 : Contribution of petroleum sector to exchequer (` crore) Particulars H1, H1, (P) 1. Contribution to Central exchequer A. Tax/ duties on crude oil & petroleum products Cess on crude oil Royalty on crude oil / natural gas Customs duty Excise duty Service tax IGST 4378 CGST 1601 Others Sub total (A) B. Dividend to Government/ income tax etc. Corporate/ income tax Dividend income to Central Government Dividend distribution tax Profit petroleum on exploration of oil/ gas* Sub total (B) Total contribution to Central exchequer (A+B) Contribution to State exchequer C. Tax/ duties on crude oil & petroleum products Royalty on crude oil / natural gas Sales tax/ VAT SGST/UTGST 1783 Octroi/ duties (incl. electricity duty) Entry tax / others Sub total (C) D. Dividend to Government/ direct tax etc. Dividend income to State Government Sub total (D) Total contribution to State exchequer (C+D) Total contribution of petroleum sector to exchequer (1+2) * Profit petroleum on exploration of oil/ gas as provided by MOP&NG, (P) Provisional Source: Oil companies ^ Cash payout under the subsidy schemes is on payment basis (` crore) Particulars H1, H1, Tax/ duties on petroleum products to Central exchequer (a) Payout by Government Table 8.31 : Contribution of taxes and duties on petroleum products to Central exchequer vis-a-vis payout by Government Cash assistance by Government towards OMCs under recoveries Subsidy on PDS kerosene and domestic LPG^ Freight subsidy on PDS kerosne and domestic LPG^ Gas subsidy for North East^ Total DBTL subsidy claims (including permanent advance and project management expenditure) Total PMUY Claims(including PME & IEC) Total DBTK Subsidy Claims Total payout by Government (b) Net contribution to central exchequer (a-b)
84 Sl. no. States State/Union territory/others (` Crore) Sales tax/vat SGST/UTGST H1, H1, (P) H1, (P) 1 Andhra Pradesh Arunachal Pradesh Assam Bihar Chhattisgarh Goa Gujarat Haryana Himachal Pradesh Jammu & Kashmir Jharkhand Karnataka Kerala Madhya Pradesh Maharashtra Manipur Meghalaya Mizoram Nagaland Odisha Punjab Rajasthan Sikkim Tamil Nadu Telangana Tripura Uttar Pradesh Uttarakhand West Bengal Union territories 30 Andaman & Nicobar Islands Chandigarh / 33 Dadra and Nagar Haveli/ Daman & Diu Delhi Lakshadweep Puducherry Others 1 Offshore 5 TOTAL Source: Oil companies Table 8.32 : State wise collection of Sales tax/ VAT/GST by petroleum sector 77
85 Table 8.33 : Profit After Tax (PAT) of oil companies (` Crore) Companies H1, H1, PSU upstream/midstream companies ONGC OIL GAIL Total PSU downstream Oil Marketing Companies (OMCs) IOCL BPCL HPCL Total PSU stand alone refineries MRPL 601 (1712) CPCL (304) (39) NRL Total 668 (1033) PSU consultancy company EIL Total Private sector companies RIL EOL (1121) * * Total Source: Published results/ information provided by oil companies. * Not available 78
86 Table 8.34 : Financial details of oil companies Particulars IOCL BPCL HPCL ONGC OIL GAIL MRPL CPCL NRL (` Crore) Net sales / income from operations Profit Before Interest and Tax (PBIT) Interest Tax Profit After Tax (PAT) Net worth Borrowings (loan fund) Ratios PAT as % of turnover (net sales) 4.36% 3.32% 2.91% 23.10% 16.86% 7.18% 6.13% 2.54% 15.06% Debt (loan fund) to equity ratio Earnings Per Share (EPS) H1, Particulars IOCL BPCL HPCL ONGC OIL GAIL MRPL CPCL NRL (` Crore) Net sales / income from operations Profit Before Interest and Tax (PBIT) Interest Tax Profit After Tax (PAT) Net worth Borrowings (loan fund) Ratios PAT as % of turnover (net sales) 5.58% 3.51% 2.82% 25.61% 24.57% 9.89% 4.43% 2.77% 14.22% Debt (loan fund) to equity ratio Earnings Per Share (EPS)
87 H1, Particulars IOCL BPCL HPCL ONGC OIL GAIL MRPL CPCL NRL (` Crore) Net sales / income from operations Profit Before Interest and Tax (PBIT) Interest Tax Profit After Tax (PAT) Net worth Borrowings (loan fund) Ratios PAT as % of turnover (net sales) 3.53% 2.37% 2.33% 23.86% 23.10% 9.83% 3.68% 1.73% 14.24% Debt (loan fund) to equity ratio Earnings Per Share (EPS) Source : Published results/ Information provided by oil companies Table 8.35 : Total subsidy on petroleum products & natural gas (` Crore) Particulars H1, H1, Petrol Diesel PDS kerosene Domestic LPG Total under-recoveries (A) Total DBTL subsidy (claims) Permanent Advance (PA) / one time incentive* Project Management Expenditure (PME)* Total DBTL related subsidies (B) PMUY (claims) PME & IEC under PMUY* Total PMUY related subsidy (C) DBTK subsidy (claims) (D) PDS Kerosene and Domestic LPG subsidy scheme, 2002* ^ 0 Freight subsidy (For Far-Flung Areas) Scheme, 2002* Natural gas subsidy for North East* Other subsidies (E) Total subsidy/ under-recovery on petroleum products & natural gas (A+B+C+D+E) *on payment basis. ^ The payment relates to the year , however received in the year
88 Table 8.36 : Under-recoveries and burden sharing (` Crore) Sl. no. Particulars H1, H1, * A Under-recovery - product wise MS HSD Domestic LPG PDS Kerosene B Under-recovery - company wise IOCL BPCL HPCL C D Government - cash assisstance -company wise ( % of under-recovery) 50.6% 37.8% 89.0% 100.0% 100.0% 61.9% IOCL BPCL HPCL Upstream / midstream oil companies-discount on crude oil & product (% of under-recovery) 47.9% 59.2% 10.9% 0.0% 0.0% 0.0% ONGC (56384) (36300) (1096) OIL (8737) (5523) (155) GAIL (1900) (1000) Total - discount given (67021) (42822) (1251) IOCL BPCL HPCL Total - discount received E Borne by OMCs (% of under-recovery) 1.5% 3.0% 0.2% 0.0% 0.0% 0.0% IOCL BPCL HPCL * Under recovery claims Q2, of ` 786 crores are pending sanction by the Government 81

89 82
90 Table 9.1 : Average international Calorific Values of different fuels A. Oil products M Cals/tonne or K Cal/Kg NGL Kerosene Motor Gasoline Fuel Oil B. Natural gas production (average) - India K cal/scm C. India M Cals/tonne or K Cal/Kg Charcoal 6900 Hard coal 5000 Firewood 4750 Lignite-Brown coal 2310 Source : Indian Petroleum & Natural Gas Statistics, MOP&NG Conversion factor : 1 K Cal = 4.19 K Joules Conversion factors Table 9.2 : Weight to volume conversion Product Weight (MT) Volume (KL) BBL To convert volume at 29.5 C to volume at 15 C multiply by Petrol Diesel Kerosene ATF Light Diesel Oil Furnace Oil Crude Oil Source: Indian Petroleum & Natural Gas Statistics / Petrol and Diesel are as per BS-IV norms Table 9.3 : Volume conversion 1 US Bbl. 159 Litres 1 US Gallon 3.78 Litres 1 Kilo Litre (KL) 6.29 Bbl. 1 US Bbl. 42 Gallons 1 MBD (million barrels per day) 50 MMTPA Table 9.4 : Contents of LPG & Natural Gas Natural Gas Contains % Methane LPG Contains Propane (40%) & Butane (60%) 83
91 Table 9.5 : Natural gas conversions 1 SCM (Standard Cubic Meter) = 1 cubic 1 atmosphere pressure and o C 1 Cubic Metre = Cubic feet 1 BCM(Billion Cubic Metre) / Year = 2.74 MMSCMD 365 Days a Year of gas (consumption or production) 1 TCF (Trillion Cubic Feet) of Gas = 3.88 MMSCMD 100% Recoverable for days / Annum) Reserve 1 MMTPA of LNG = 3.60 MMSCMD Molecular Weight of 365 days/annum) 1 MT of LNG = 1314 SCM Molecular Weight of 18 Gross Calorific Value (GCV) = Kcal/ SCM Net Calorific Value (NCV) = 90% of GCV 1 Million BTU (MMBTU) = 25.2 Kcal/SCM; 1 MMBTU= 252,000 Kcal) Specific Gravity of Gas = 0.62 Molecular Weight of Dry Air= gm/mole) Density of Gas = 0.76 Kg/SCM Molecular Weight of Gas 18 gm/mol Gas required for 1 MW of Power generation Power Generation from 1 MMSCMD Gas Source : GAIL (India) Ltd. = 4541 SCM per Day Station Heat Rate (SHR);~1720 Kcal/Kwh-NCV (50% Thermal Efficiency); Natural Gas GCV-@10000Kcal/SCM = 220 MWH Station Heat Rate (SHR);~1720 Kcal/Kwh-NCV (50% Thermal Efficiency); Natural Gas GCV-@10000Kcal/SCM Table 9.6 : Major end use of petroleum products Product LPG Naphtha MS ATF SKO HSD LDO FO/LSHS Bitumen Lubes Other products (Benzene, Toluene, MTO, LABFS, CBFS, Paraffin wax etc.) Major end use Domestic and auto fuel. Also for industrial application where technically essential. Feedstock/fuel for fertiliser units, feedstock for petrochemical sector and fuel for power plants. Fuel for passenger cars, taxies, two & three wheelers. Fuel for aircrafts. Fuel for cooking & lighting. Fuel for transport sector (railways/road), agriculture (tractors, pumpsets, threshers, etc.) and captive power generation. Fuel for agricultural pumpsets, small industrial units, start up fuel for power generation. Secondary fuel for thermal power plants, fuel/feedstock for fertiliser plants, industrial units. Surfacing of roads. Lubrication for automotive and industrial applications. Feedstock for value added products. 84
92 Information about key officers of MoP&NG Department Name (S/Shri) Designation Telephone No. Fax No. Secretary Kapil Dev Tripathi Secretary Manish Makhija PS to Secretary / Additional Secretary Additional Secretary Narender S Negi PPS to Additional Secretary Finance Rajiv Bansal Additional Secretary & FA Ms Suman Mahi PPS to AS & FA Sukh Ram Meena DDG (IFD) Ms Perin Devi Dir (IFD) Economic & Statistics Ms Urvashi Sadhwani Sr. Adviser K S N Rao PPS to Sr. Adviser Ms Indrani Kaushal Economic Advisor B. Vijaya PS to EA Exploration Amar Nath Jt. Secretary (E) V.K. Suman PPS to JS (E) Sanjay Kumar Jain Dir (Exploration - II) Exploration-I & III Diwakar Nath Misra Jt. Secretary (Exploration-I & III) Yogesh Virmani PS to JS (Exploration-I & III) Refinery Sandeep Poundrik Joint Secretary (Refineries) & CVO Anil Kumar PS to JS (R ) Vijay Sharma Director (S & CC/Vig/FP) Ajit Kumar DS (R) Marketing and Administration Ashutosh Jindal Joint Secretary (M) Sampooran Singh PPS to JS(M) K M Mahesh Dir (LPG, D & MC & Parliament) Administration Ms Anuradha S. Chagti Jt. Secretary (Admin) K. Madhavi PS to JS (Exploration-I & III) Gas Projects Ashish Chatterjee Joint Secretary (GP) Ms Shikha Khurana PS to JS (GP) Ms Kiran Vasudeva DS (GP) International Cooperation Sunjay Sudhir Joint Secretary (IC) Ms Savita Sen PPS to JS (IC) Praphullachandra Sharma DS (I/C) General Ms Sushma Rath Joint Secretary (General) Madhu Kumar PA to JS (G) Vijay Gopal Mangal DS (Gen) Information about key officers of PPAC Department Name (S/Shri) Designation Telephone No. Fax No. Director General's office Ms. Atreyee Das Director General / P R Nair PS to Director General / Finance Vikram Gulati Director (Finance) Ms. Satbir Hira PS to Director (F) Demand & Economic Studies Rohit Dawar Addl. Director I/C (D & ES) Supply Ms. B M Sujatha Addl. Director I/C (S) / Administration Sunil Kumar Addl. Director (HR & C) / IT Ms. Maninder Kaur Narula Addl. Director (IT) Marketing Rajesh Kumar Gupta Addl. Director (Mktg.) / Gas Jitender Kumar Sharma Jt. Director I/C (Gas) EPABX NOs / , Reception

93
Ready Reckoner Snapshot of India s Oil & Gas data March, 2014 Petroleum Planning & Analysis Cell
 Ready Reckoner Snapshot of India s Oil & Gas data March, 2014 Petroleum Planning & Analysis Cell (Ministry of Petroleum & Natural Gas) 0 Index of Tables Table Description Page 1. Selected Indicators of
Petroleum Planning & Analysis Cell
 Petroleum Planning & Analysis Cell (Ministry of Petroleum & Natural Gas) Vision To be the most authentic official source for data and policy analysis on the hydrocarbon sector in the country. Mission 1.
Ready Reckoner Snapshot of India s Oil & Gas data July, 2014 Petroleum Planning & Analysis Cell
 Ready Reckoner Snapshot of India s Oil & Gas data July, 2014 Petroleum Planning & Analysis Cell (Ministry of Petroleum & Natural Gas) 0 Index of Tables Table Description Page Highlights 2 1. Selected Indicators
Petroleum Planning & Analysis Cell
 Petroleum Planning & Analysis Cell (Ministry of Petroleum & Natural Gas) Vision To be the most authentic official source for data and policy analysis on the hydrocarbon sector in the country. Mission 1.
Petroleum Planning & Analysis Cell
 MONTHLY REPORT ON INDIGENOUS CRUDE OIL PRODUCTION, IMPORT AND PROCESSING & PRODUCTION, IMPORT AND EXPORT OF PETROLEUM PRODUCTS November 2017 Petroleum Planning & Analysis Cell (Ministry of Petroleum &
Petroleum Planning & Analysis Cell
 MONTHLY REPORT ON INDIGENOUS CRUDE OIL PRODUCTION, IMPORT AND PROCESSING & PRODUCTION, IMPORT AND EXPORT OF PETROLEUM PRODUCTS May 2018 Petroleum Planning & Analysis Cell (Ministry of Petroleum & Natural
Target October (Month) April-October (Cumulative) (Apr- Mar)
 April-October (Cumulative) (Apr- Mar)") Government of India Ministry of Petroleum and Natural Gas Economic & Statistics Division ****** New Delhi Dated the 21 st November, 2017 Monthly Production Report October, 2017 Crude Oil 1. Crude oil 1
Government of India Ministry of Petroleum and Natural Gas Economic & Statistics Division ****** New Delhi Dated the 21 st November, 2017 Monthly Production Report October, 2017 Crude Oil 1. Crude oil 1
Vision To be the most authentic official source for data and policy analysis on the hydrocarbon sector in the country.
 Petroleum Planning & Analysis Cell (Ministry of Petroleum & Natural Gas) Vision To be the most authentic official source for data and policy analysis on the hydrocarbon sector in the country. Mission 1.
Petroleum Planning & Analysis Cell
 MONTHLY REPORT ON INDIGENOUS CRUDE OIL PRODUCTION, IMPORT AND PROCESSING & PRODUCTION, IMPORT AND EXPORT OF PETROLEUM PRODUCTS February 2018 Petroleum Planning & Analysis Cell (Ministry of Petroleum &
Petroleum Planning & Analysis Cell
 MONTHLY REPORT ON INDIGENOUS CRUDE OIL PRODUCTION, IMPORT AND PROCESSING & PRODUCTION, IMPORT AND EXPORT OF PETROLEUM PRODUCTS September 2018 Petroleum Planning & Analysis Cell (Ministry of Petroleum &
Target December (Month) April-December (Cumulative) (Apr- Mar)
 April-December (Cumulative) (Apr- Mar)") Government of India Ministry of Petroleum and Natural Gas Economic & Statistics Division ****** New Delhi Dated the 19 th January, 2018 Monthly Production Report December, 2017 Crude Oil 1. Crude oil 1
Government of India Ministry of Petroleum and Natural Gas Economic & Statistics Division ****** New Delhi Dated the 19 th January, 2018 Monthly Production Report December, 2017 Crude Oil 1. Crude oil 1
Ready Reckoner Snapshot of India s Oil & Gas data March, 2015 Petroleum Planning & Analysis Cell
 Ready Reckoner Snapshot of India s Oil & Gas data March, 2015 Petroleum Planning & Analysis Cell (Ministry of Petroleum & Natural Gas) 0 Index of Tables Table Description Page Highlights 2 1. Selected
Unit-wise production details with reasons for shortfall have been given in following subsections:
 Government of India Ministry of Petroleum and Natural Gas Economic & Statistics Division ****** New Delhi Dated the May, 2017 Monthly Production Report April 2017 Crude Oil 1. Crude oil production 1 during
Ready Reckoner Snapshot of India s Oil & Gas data January, 2016 Petroleum Planning & Analysis Cell
 Ready Reckoner Snapshot of India s Oil & Gas data January, 2016 Petroleum Planning & Analysis Cell (Ministry of Petroleum & Natural Gas) 0 Index of Tables Table Description Page Highlights 2-3 1. Selected
Natural gas. 26 Reserves 28 Production and consumption 33 Prices 34 Trade movements. 67 th edition
 Natural gas 26 Reserves 28 Production and consumption 33 Prices 34 Trade movements 67 th edition Natural gas Total proved reserves At end 1997 At end 2007 At end 2016 At end Trillion Trillion Trillion
Ready Reckoner Snapshot of India s Oil & Gas data January, 2017 Petroleum Planning & Analysis Cell
 Ready Reckoner Snapshot of India s Oil & Gas data January, 2017 Petroleum Planning & Analysis Cell (Ministry of Petroleum & Natural Gas) Index of Tables Description Table Page Highlights for the month
Ready Reckoner Snapshot of India s Oil & Gas data July, 2017 Petroleum Planning & Analysis Cell
 Ready Reckoner Snapshot of India s Oil & Gas data July, 2017 Petroleum Planning & Analysis Cell (Ministry of Petroleum & Natural Gas) Index of Tables Description Table Page Highlights for the month 2-3
Ready Reckoner Snapshot of India s Oil & Gas data April, 2017 Petroleum Planning & Analysis Cell
 Ready Reckoner Snapshot of India s Oil & Gas data April, 2017 Petroleum Planning & Analysis Cell (Ministry of Petroleum & Natural Gas) Index of Tables Description Table Page Highlights for the month 2
Ready Reckoner Snapshot of India s Oil & Gas data March, 2017 Petroleum Planning & Analysis Cell
 Ready Reckoner Snapshot of India s Oil & Gas data March, 2017 Petroleum Planning & Analysis Cell (Ministry of Petroleum & Natural Gas) Index of Tables Description Table Page Highlights for the month 2
Snapshot of India s Oil & Gas data. November, Petroleum Planning & Analysis Cell. (Ministry of Petroleum & Natural Gas)
") Ready Reckoner Snapshot of India s Oil & Gas data November, 2017 Petroleum Planning & Analysis Cell (Ministry of Petroleum & Natural Gas) Index of Tables Description Table Page Highlights for the month
Ready Reckoner Snapshot of India s Oil & Gas data November, 2017 Petroleum Planning & Analysis Cell (Ministry of Petroleum & Natural Gas) Index of Tables Description Table Page Highlights for the month
Coal. 36 Reserves and prices 38 Production and consumption. 67 th edition
 Coal 36 Reserves and prices 38 Production and consumption 67 th edition Total proved reserves at end 217 Million tonnes Anthracite and bituminous Subbituminous and lignite US 228 3116 25916 24.2% 357 Canada
Snapshot of India s Oil & Gas data. January, Petroleum Planning & Analysis Cell. (Ministry of Petroleum & Natural Gas)
") Ready Reckoner Snapshot of India s Oil & Gas data January, 2018 Petroleum Planning & Analysis Cell (Ministry of Petroleum & Natural Gas) Index of Tables Description Table Page Highlights for the month
Ready Reckoner Snapshot of India s Oil & Gas data January, 2018 Petroleum Planning & Analysis Cell (Ministry of Petroleum & Natural Gas) Index of Tables Description Table Page Highlights for the month
Snapshot of India s Oil & Gas data. February, Petroleum Planning & Analysis Cell. (Ministry of Petroleum & Natural Gas)
") Ready Reckoner Snapshot of India s Oil & Gas data February, 2018 Petroleum Planning & Analysis Cell (Ministry of Petroleum & Natural Gas) Index of Tables Description Table Page Highlights for the month
Ready Reckoner Snapshot of India s Oil & Gas data February, 2018 Petroleum Planning & Analysis Cell (Ministry of Petroleum & Natural Gas) Index of Tables Description Table Page Highlights for the month
Oil. 12 Reserves 14 Production and consumption 20 Prices 22 Refining 24 Trade movements. 67 th edition
 Oil 12 Reserves 14 Production and consumption 20 Prices 22 Refining 24 Trade movements 67 th edition Oil Total proved reserves At end 1997 At end 2007 At end 2016 At end Thousand million barrels Thousand
Primary energy. 8 Consumption 9 Consumption by fuel. 67 th edition
 Primary energy 8 Consumption 9 Consumption by fuel 67 th edition Primary energy Consumption* Growth rate per annum Million tonnes oil equivalent 27 28 29 2 211 212 213 214 215 216 217 217 26-16 Share 217
Ready Reckoner. June, Snapshot of India s Oil & Gas data. Petroleum Planning & Analysis Cell (Ministry of Petroleum & Natural Gas)
") Ready Reckoner Snapshot of India s Oil & Gas data June, 2018 Petroleum Planning & Analysis Cell (Ministry of Petroleum & Natural Gas) As on 30.07.2018 Index of Tables Description Table Page Highlights
Ready Reckoner Snapshot of India s Oil & Gas data June, 2018 Petroleum Planning & Analysis Cell (Ministry of Petroleum & Natural Gas) As on 30.07.2018 Index of Tables Description Table Page Highlights
BP Statistical Review of World Energy June 2017
 BP Statistical Review of World Energy June 217 Primary energy 8 Consumption 8 Consumption by fuel 9 66 th edition Primary energy Consumption* Growth rate per annum Million tonnes oil equivalent 26 27 28
Ready Reckoner. July, Snapshot of India s Oil & Gas data. Petroleum Planning & Analysis Cell (Ministry of Petroleum & Natural Gas)
") Ready Reckoner Snapshot of India s Oil & Gas data July, 2018 Petroleum Planning & Analysis Cell (Ministry of Petroleum & Natural Gas) As on 20.08.2018 Index of Tables Description Table Page Highlights
Ready Reckoner Snapshot of India s Oil & Gas data July, 2018 Petroleum Planning & Analysis Cell (Ministry of Petroleum & Natural Gas) As on 20.08.2018 Index of Tables Description Table Page Highlights
67 th edition. Renewable energy. Appendices. 44 Other renewables consumption 45 Biofuels production
 Renewable energy 44 Other renewables consumption 45 Biofuels production Appendices A1 Solar Generation A2 Wind Generation A3 Geothermal, biomass and other Generation A4 Geothermal Cumulative installed
Operational flexibility for Indian Refiners
 The Growing Prominence of Asian Refining Plenary Session Operational flexibility for Indian Refiners 7 th December, 2016 PetroTech, New Delhi Sanjiv Singh Director (Refineries), Indian Oil Corporation
UK Continental Shelf (UKCS) Oil and Gas Production and the UK Economy. Mike Earp
 Oil and Gas Production and the UK Economy. Mike Earp") UK Continental Shelf (UKCS) Oil and Gas Production and the UK Economy Mike Earp 15 June 215 Outline Production and Reserves Expenditure, Income and Taxation Gross Value Added Trade Recent Production History
UK Continental Shelf (UKCS) Oil and Gas Production and the UK Economy Mike Earp 15 June 215 Outline Production and Reserves Expenditure, Income and Taxation Gross Value Added Trade Recent Production History
I. World trade in Overview
 I. World trade in - Overview Table I.1 Growth in the volume of world merchandise exports and production, 2-5 (Annual percentage change) 2-5 23 24 World merchandise exports 4.5 5. 9.5 6. Agricultural products
STATISTICAL ANNEX NOTE ON QUARTERLY PROJECTIONS
 OECD Economic Outlook, Volume 2017 Issue 1 OECD 2017 This annex contains data on key economic series which provide a background to the recent economic developments in the OECD area described in the main
Enhancing Regional Cooperation in Energy Infrastructure Development
 Enhancing Regional Cooperation in Energy Infrastructure Development Davood Manzoor, Ph.D. High-Level Policy Dialogue on Regional Cooperation and Inclusive Development in South and South West Asia 18-19
IEA Analysis of Fossil-Fuel Subsidies for APEC
 211/SOM3/DIA/3 Session 2 IEA Analysis of Fossil-Fuel Subsidies for APEC Submitted by: IEA Policy Dialogue on Fossil Fuel Subsidy Reform San Francisco, United States 23 September 211 IEA analysis of fossil
ECONOMIC SURVEY STATISTICAL APPENDIX
 ECONOMIC SURVEY 2011-12 STATISTICAL APPENDIX STATISTICAL APPENDIX : ECONOMIC SURVEY 2011-2012 PAGE 0.1 Select Indicators: 1950-51 to 2010-11... A1-A2 1. National Income and Production 1.1 Gross National
OPEC PRIMARY ENERGY CONSUMPTION IN 2005 (1)
") CHAPTER 4 I n 1384, political tensions in the Middle East and some oil-producing countries, sabotage in Iraq s oil industry and speculation in the market raised oil prices incrementally. As of the beginning
CHAPTER 4 I n 1384, political tensions in the Middle East and some oil-producing countries, sabotage in Iraq s oil industry and speculation in the market raised oil prices incrementally. As of the beginning
Production (bbl/day)
") 1 of 5 14/09/2011 22:15 From Wikipedia, the free encyclopedia This is a list of countries by oil production mostly based on CIA World Factbook data. [1] Note that oil production refers to the sum of barrels
1 of 5 14/09/2011 22:15 From Wikipedia, the free encyclopedia This is a list of countries by oil production mostly based on CIA World Factbook data. [1] Note that oil production refers to the sum of barrels
Refineries Table of Contents
 Refineries Dec 18 Refineries Table of Contents Refineries Table of Contents Contents: Page # National Fuel Consumption Product Wise 3 Demand and Supply POL Products 4 Local Refineries POL Volume Sales
Table 23 Production of minor oil products from refineries - by type Thousand metric tons
 Table 23 Production of minor oil from refineries - by type Table Notes Data refer to production from refineries of refinery, ethane, naphtha, lubricants, bitumen, paraffin, petroleum, white spirit, and
BP Statistical Review of World Energy June 2013
 BP Statistical Review of World Energy June 2013 bp.com/statisticalreview 1 Introduction 6 Oil 1 Group chief executive s introduction 2 2012 in review 6 Reserves 8 Production and consumption 15 Prices 16
Production of minor oil products from refineries - by type Thousand metric tons
 Production of minor oil from refineries - by type Table 23 Table Notes Data refer to production from refineries of refinery, ethane, naphtha, lubricants, bitumen, paraffin, petroleum, white spirit, and
Table 16 Refinery distillation capacity, throughput and output Thousand metric tons
 Table 16 Refinery distillation capacity, throughput and output Table Notes Output is equal to the sum of production from refineries for aviation gasoline, bitumen, gas/diesel oil, ethane, feedstocks, gasoline-type
Table 16 Refinery distillation capacity, throughput and output Thousand metric tons
 Million metric tons Table 16 Refinery distillation capacity, throughput and output Table Notes Output is equal to the sum of production from refineries for aviation gasoline, bitumen, gas/diesel oil, ethane,
Integration Opportunities in Refineries - Petrochemicals
 Topic Integration Opportunities in Refineries - Petrochemicals Presented by : VINAY GUPTA Engineers India Limited AGENDA Complexity of Indian refineries Gross Refinery Margin Stand Alone Integrated Complex
14.Storage Infrastructure
 Infrastructure 393 394 14. STORAGE 14.1 There is no specific data source for this item, which compiles data for all types of storages in one place. Data has been individually obtained from Central Warehousing
Table 13 Production, trade and supply of conventional crude oil Thousand metric tons; kilograms per capita; reserves production ratio (R/P) in years
 in years") , trade and supply of conventional crude oil Thousand metric tons; kilograms per capita; reserves production ratio (R/P) in years Table Notes The Reserves / ratio refers to crude oil and natural gas liquids.
, trade and supply of conventional crude oil Thousand metric tons; kilograms per capita; reserves production ratio (R/P) in years Table Notes The Reserves / ratio refers to crude oil and natural gas liquids.
Indraprastha Gas Limited
 Indraprastha Gas Limited Corporate Presentation August 2005 CNG for Clean & Green Environment 1 Agenda Overview of Indian Oil & Gas Sector CNG and PNG Business in India Indraprastha Gas Critical Success
ANNUAL STATISTICAL SUPPLEMENT
 ANNUAL STATISTICAL SUPPLEMENT with 2016 data 2017 Edition This Statistical Supplement has been prepared to provide a longer historical perspective for the oil demand, supply, trade, stocks, prices and
Table 13 Production, trade and supply of conventional crude oil Thousand metric tons; kilograms per capita; reserves production ratio (R/P) in years
 in years") Million metric tons Million metric tons Table 13, trade and supply of conventional crude oil Thousand metric tons; kilograms per capita; reserves production ratio (R/P) in years Table Notes The Reserves
Million metric tons Million metric tons Table 13, trade and supply of conventional crude oil Thousand metric tons; kilograms per capita; reserves production ratio (R/P) in years Table Notes The Reserves
4 th April, 2018 I Industry Research
 April'17 May'17 June'17 July'17 August'17 September'17 October'17 November'17 December'17 January'18 February'18 March'18 A case for including Petrol and Diesel under GST? Contact: Madan Sabnavis Chief
Table 13 Production, trade and supply of conventional crude oil Thousand metric tons; kilograms per capita; reserves production ratio (R/P) in years
 in years") Table 13, trade and supply of conventional crude oil Thousand metric tons; kilograms per capita; reserves production ratio (R/P) in years Table Notes The Reserves / ratio refers to crude oil and natural
Table 13, trade and supply of conventional crude oil Thousand metric tons; kilograms per capita; reserves production ratio (R/P) in years Table Notes The Reserves / ratio refers to crude oil and natural
Statistical Appendix
 Statistical Appendix Middle East and Central Asia Department REO Update, May 2013 The IMF s Middle East and Central Asia Department (MCD) countries and territories comprise Afghanistan, Algeria, Armenia,
MINISTRY OF PETROLEUM AND NATURAL GAS DEMAND NO. 72 Ministry of Petroleum and Natural Gas
 Notes on Demands for Grants, 2017-2018 231 MINISTRY OF PETROLEUM AND NATURAL GAS DEMAND NO. 72 Ministry of Petroleum and Natural Gas (In ` crores) Actual 2015-2016 2016-2017 Revised 2016-2017 2017-2018
To meet the growing demand of petroleum products, the refining capacity in the country has gradually
 1. REFINERIES IN INDIA To meet the growing demand of petroleum products, the refining capacity in the country has gradually increased over the years by setting up of new refineries in the country as well
64 th edition. BP Statistical Review of World Energy June Nuclear energy. Oil. Hydroelectricity. Natural gas. Renewable energy.
 BP Statistical Review of World Energy June 2015 bp.com/statisticalreview #BPstats Introduction 1 Group chief executive s introduction 2 2014 in review Oil 6 Reserves 8 Production and consumption 15 Prices
Table 1: World Oil Supply And Demand
 INTERNATIONAL ENERGY AGENCY - OIL MARKET REPORT TABLES Table 1 WORLD OIL SUPPLY AND DEMAND Table 1: World Oil Supply And Demand (million barrels per day) TABLES 2012 2013 1Q14 2Q14 3Q14 4Q14 2014 1Q15
Corn & Bean Producers-1
 Largest Corn Producing Countries - 2016 est. Largest Corn Importing Countries - 2016 est. (Marketing year - thousands of hectares, tons per hectare, and thousands of metric tons) (Marketing year - thousands
World real merchandise trade grows faster than output
 I. I. world trade developments 8 Merchandise trade and GDP World real merchandise trade grows faster than output In 2006, the volume of world merchandise trade grew by 8 per cent while world gross domestic
A summary of national and global energy indicators. FEDERAL RESERVE BANK of KANSAS CITY
 THE U.S. Energy DATABOOK A summary of national and global energy indicators JULY 1, 17 FEDERAL RESERVE BANK of KANSAS CITY SUMMARY OF CURRENT ENERGY CONDITIONS The number of total active drilling rigs
World Geographic Shares
 World Geographic Shares North America South America Europe Africa Asia Australia/ Oceania 18% 13% 7% 22% 33% 6% World Population Shares North America South America Europe Africa Asia Australia/ Oceania
Item
 Key Indicators for Asia and the Pacific 2010 POPULATION a Total population million; as of 1 July 18.17 18.55 18.93 19.33 19.73 20.14 20.56 20.99 21.42 21.87 22.32 22.79 23.30 23.82 24.36 24.91 25.47 26.04
Fossil Fuel Subsidies in India: The Case for Rationalizing Petroleum Product Prices*
 Fossil Fuel Subsidies in India: The Case for Rationalizing Petroleum Product Prices* 8 th March 2011 Anmol Soni TERI * This presentation is a summary of a larger policy paper being prepared by the Centre
The Great Transition: Shifting from Fossil Fuels to Solar and Wind Energy Supporting Data - Coal
 The Great Transition: Shifting from Fossil Fuels to Solar and Wind Energy Supporting Data - Coal Proved Coal Reserves, 213 GRAPH: Proved Coal Reserves in Top Countries, 213 Coal Production in Top Ten Countries
Consumption per capita 43 Appendices Conversion factors 44 Definitions 44 Further information 45
 Quantifying energy BP Statistical Review of World Energy June 2006 Introduction Group chief executive s introduction 1 2005 in review 2 Oil Reserves 6 Production 8 Consumption 11 Regional consumption by
Bitumen Market & Outlook in India. Subroto Das Head : Bitumen & Fuels Hindustan Petroleum Corporation Limited India
 Bitumen Market & Outlook in India Subroto Das Head : Bitumen & Fuels Hindustan Petroleum Corporation Limited India Oil & Gas Industry Landscape Oil Sector in India: Salient aspects in 2016 India is the
ANNUAL STATISTICAL SUPPLEMENT
 ANNUAL STATISTICAL SUPPLEMENT with 2008 data 2009 Edition This Statistical Supplement has been prepared to provide a longer historical perspective for the oil demand, supply, trade, stocks, prices and
The Supply of Oil. Projections to Oil and the Macroeconomy in a Changing World Federal Reserve Bank of Boston June 9, 2010 Boston, MA
 The Supply of Oil Projections to 2035 Oil and the Macroeconomy in a Changing World Federal Reserve Bank of Boston June 9, 2010 Boston, MA Howard Gruenspecht, Deputy Administrator Near-term oil price uncertainty
Pakistan Refining Industry An Overview
 Pakistan Refining Industry An Overview October 2016 Oil World Crude Oil Reserves Largely sustained level of reserves Largest Region Contributes 47% (2014: 47.2%) Global proven oil reserves in 2015 fell
KEROSENE JET FUEL. Morten Simonsen. Vestlandsforsking,
 KEROSENE JET FUEL Morten Simonsen Vestlandsforsking, 19 October 2009 1 Content Introduction... 3 Crude oil extraction methods... 3 Production of kerosene... 5 Consumption of kerosene in China... 11 Raffinerie\Öl-Produkte-CN...
Table 1 WORLD OIL SUPPLY AND DEMAND (million barrels per day)
") INTERNATIONAL ENERGY AGENCY - OIL MARKET REPORT TABLES TABLES Table 1 WORLD OIL SUPPLY AND DEMAND (million barrels per day) 2011 2012 1Q13 2Q13 3Q13 4Q13 2013 1Q14 2Q14 3Q14 4Q14 2014 1Q15 2Q15 3Q15 4Q15
INTERNATIONAL ENERGY AGENCY - OIL MARKET REPORT TABLES TABLES Table 1 WORLD OIL SUPPLY AND DEMAND (million barrels per day) 2011 2012 1Q13 2Q13 3Q13 4Q13 2013 1Q14 2Q14 3Q14 4Q14 2014 1Q15 2Q15 3Q15 4Q15
MINISTRY OF PETROLEUM AND NATURAL GAS DEMAND NO. 72 Ministry of Petroleum and Natural Gas
 Notes on Demands for Grants, 2018-2019 241 MINISTRY OF PETROLEUM AND NATURAL GAS DEMAND NO. 72 Ministry of Petroleum and Natural Gas (In ` crores) Actual 2016-2017 2017-2018 Revised 2017-2018 2018-2019
World Air Conditioner Demand by Region
 World Air Conditioner Demand by Region April 2015 The Japan Refrigeration and Air Conditioning Industry Association 1 World Air Conditioner Demand by Region April 2015 The Japan Refrigeration and Air Conditioning
Market Report Series: Oil 2018 Analysis & Forecasts to Energy Community 10 th Oil Forum, Belgrade, 25 September 2018
 Market Report Series: Oil 218 Analysis & Forecasts to 223 Energy Community 1 th Oil Forum, Belgrade, 25 September 218 Short term update: crude prices (excl. WTI) up strongly Aug/Sep $/bbl 8 Benchmark Crude
OIL & GAS For updated information, please visit October 2018
 OIL & GAS October 2018 Table of Content Executive Summary...3 Advantage India......4 Market Overview and Trends....6 Notable Trends and Strategies.......23 Growth Drivers....... 27 Opportunities......34
Title of the Presentation
 Trends in Emissions from Energy Sector Title of the Presentation Date: September 28, 2017 Venue: New Delhi Date Venue Sectoral Break-up & Approach Fuel Combustion National GHG Inventory Fugitive Emissions
A) Particulars of organization
 Particulars of organization") CHAPTER-I PARTICULARS OF ORGANISATION, ITS FUNCTIONS AND DUTIES A) Particulars of organization a) MRPL A Profile Mangalore Refinery and Petrochemicals Limited (MRPL) operates a grass root refinery with
CHAPTER-I PARTICULARS OF ORGANISATION, ITS FUNCTIONS AND DUTIES A) Particulars of organization a) MRPL A Profile Mangalore Refinery and Petrochemicals Limited (MRPL) operates a grass root refinery with
INDUSTRY SALES REVIEW. October 2017
 INDUSTRY SALES REVIEW October 2017 1 P a g e This report analyses the trend of consumption of petroleum products in the country during the month of October, 2017. Data on product-wise monthly consumption
Table 1 TABLES INTERNATIONAL ENERGY AGENCY OIL MARKET REPORT 15 MAY
 INTERNATIONAL ENERGY AGENCY OIL MARKET REPORT TABLES Table 1 Table WORLD 1 - World OIL SUPPLY Oil Supply AND DEMAND and Demand (million barrels per day) 2010 2011 1Q12 2Q12 3Q12 4Q12 2012 1Q13 2Q13 3Q13
2007 atmospheric distillation capacity, top petroleum companies top petroleum companies by natural gas production
 International comparisons 28 proved crude oil reserves, selected countries 28 proved natural gas reserves, selected countries 28 crude oil production, selected countries 28 natural gas production, selected
CONTENTS. Table Subject. I Area under Rubber and Average Yield per hectare
 CONTENTS Table Subject Page I Area under Rubber and Average Yield per hectare 1 Area Newplanted and Replanted with Rubber 5 2 State-wise Area under Rubber at the end of each year 6 3 District/State-wise
Industry Consumption Review. July Industry Performance Review Report of PPAC: July18
 Industry Consumption Review July 2018 1 P a g e HIGHLIGHTS OF THE REPORT 1. Total petroleum products consumption witnessed a growth of 7.4% during July, 2018 and a cumulative growth of 4.8% for the period
Industry Sales Review March 2018
 Industry Sales Review ch 2018 I, 1 P a g e Apr-16 Jan-17 Apr-17 Jan-18 This report analyses the trend of consumption of petroleum products in the country during the month of ch, 2018. Data on product-wise
WORLD OIL SUPPLY AND DEMAND (million barrels per day)
") INTERNATIONAL ENERGY AGENCY OIL MARKET REPORT TABLES TABLES Table 1 WORLD OIL SUPPLY AND DEMAND (million barrels per day) 2005 2006 1Q07 2Q07 3Q07 4Q07 2007 1Q08 2Q08 3Q08 4Q08 2008 1Q09 2Q09 3Q09 4Q09
INTERNATIONAL ENERGY AGENCY OIL MARKET REPORT TABLES TABLES Table 1 WORLD OIL SUPPLY AND DEMAND (million barrels per day) 2005 2006 1Q07 2Q07 3Q07 4Q07 2007 1Q08 2Q08 3Q08 4Q08 2008 1Q09 2Q09 3Q09 4Q09
proved natural gas reserves, selected countries oil production, selected countries
 [66] 07 7.1 2010 proved oil reserves, selected countries 7.2 2010 proved natural gas reserves, selected countries 7.3 2010 oil production, selected countries 7.4 7.5 2010 natural 2009 gas production, atmospheric
INDUSTRY SALES REVIEW. August 2017
 INDUSTRY SALES REVIEW August 2017 1 P a g e This report analyses the trend of consumption of petroleum products in the country during the month of August, 2017. Data on product-wise monthly consumption
Fresh Connections: Netherlands
 Fresh Connections: Netherlands SHIFTING TRADE WINDS: GEOPOLITICS, GLOBAL TRADE & YOU JULIEN MARCILLY CHIEF ECONOMIST APRIL 29, 215 Oil prices: Lower for longer 14 Oil price (Brent, source: OPEC) 12 Oil
04-Jun-08 FILE NAME : GSDPCRNS STATE SERIES
 04-Jun-08 FILE NAME : GSDPCRNS STATE SERIES STATEMENT : GROSS STATE DOMESTIC PRODUCT AT CURRENT PRICES (1980-81 TO 1993-94) As on 26.11.1999 (Crore Rupees) Sl. State/U.T. 1980-81 1981-82 1982-83 1983-84
ECONOMIC SURVEY STATISTICAL APPENDIX
 ECONOMIC SURVEY 2017-18 STATISTICAL APPENDIX STATISTICAL APPENDIX : ECONOMIC SURVEY 2017-18 PAGE 1 National Income and Production 1.1 Gross National Income and Net National Income... A1-A2 1.2 Annual
Industry Performance Review Report of PPAC: May18
 1 P a g e This report analyses the trend of consumption of petroleum products in the country during the month of May, 2018. Data on product-wise monthly consumption of petroleum products for May, 2018
Next Release: 16 May Next Release: 16 May January
 43101 Next Release: 16 May 2018 Next Release: 16 May 2018 January Date of publication: 13 April 2018 TABLE OF CONTENTS Charts 1 Gross consumption of natural gas by OECD region 3 2 Indigenous production
Total credit to the non-financial sector (core debt), % of GDP Table F1.1
, % of GDP Table F1.1") Total credit to the non-financial sector (core debt), % of GDP Table F1.1 2012 2013 2014 2015 2016 Q2 16 Q3 16 Q4 16 Q1 17 Q2 17 Argentina 62.6 66.4 64.6 75.5 75.3 81.7 80.1 75.3 71.6 72.7 Australia 208.0
Total credit to the non-financial sector (core debt), % of GDP Table F1.1 2012 2013 2014 2015 2016 Q2 16 Q3 16 Q4 16 Q1 17 Q2 17 Argentina 62.6 66.4 64.6 75.5 75.3 81.7 80.1 75.3 71.6 72.7 Australia 208.0
POPULATION. Chapter 1
 Chapter 1 POPULATION Coverage Rural urban Distribution of Sex Ratio and Population Growth Rate in Post-Independence India State-wise percent share of Female population in Total Population Year-wise State-wise
Table 1 WORLD OIL SUPPLY AND DEMAND (million barrels per day)
") INTERNATIONAL ENERGY AGENCY - OIL MARKET REPORT TABLES Table 1 WORLD OIL SUPPLY AND DEMAND (million barrels per day) 2004 2005 1Q06 2Q06 3Q06 4Q06 2006 1Q07 2Q07 3Q07 4Q07 2007 1Q08 2Q08 3Q08 4Q08 2008
INTERNATIONAL ENERGY AGENCY - OIL MARKET REPORT TABLES Table 1 WORLD OIL SUPPLY AND DEMAND (million barrels per day) 2004 2005 1Q06 2Q06 3Q06 4Q06 2006 1Q07 2Q07 3Q07 4Q07 2007 1Q08 2Q08 3Q08 4Q08 2008
FEDERAL RESERVE statistical release
 FEDERAL RESERVE statistical release FOR IMMEDIATE RELEASE MARCH 16, 1992 E.U C1Z1, GEOGRAPHICAL r DISTRIBUTION n OF e ASSETS AND^LIABILITIES (IN MILLIONS OF DOLLARS) ASSETS COUNTRY OF CUSTOMER 12/31/90
Next Release: 14 November Next Release: 14 November July
 43282 Next Release: 14 November 2018 Next Release: 14 November 2018 July Date of publication: 12 October 2018 TABLE OF CONTENTS Charts 1 Gross consumption of natural gas by OECD region 3 2 Indigenous production
Hindustan Petroleum Corporation Limited (HPCL) Global Fortune 500
 Global Fortune 500") Hindustan Petroleum Corporation Limited (HPCL) is a Global Fortune 500 company, ranked at 260 and engaged in business of refining & marketing of petroleum products in India. During the year ended 31 st
Hindustan Petroleum Corporation Limited (HPCL) is a Global Fortune 500 company, ranked at 260 and engaged in business of refining & marketing of petroleum products in India. During the year ended 31 st
Refineries, Product Market and Capacity Expansion Opportunities and Outlook in India- 2018
 Refineries, Product Market and Capacity Expansion Opportunities and Outlook in India- 2018 Examining the market expansion trends for petrochemical industry in India and the scope of business E-REP Market
US Crude Oil Reshaping International Crude Oil Flows. Olivier Jakob,
 US Crude Oil Reshaping International Crude Oil Flows Olivier Jakob, ojakob@petromatrix.com www.petromatrix.com Claimer Petromatrix publishes since 2006 a daily market note on the oil markets Our reports
UXC.COM A PUBLICATION OF. NPO Overview 1501 MACY DRIVE ROSWELL, GA PH FX
 2019 A PUBLICATION OF UXC.COM NPO Overview 1501 MACY DRIVE ROSWELL, GA 30076 PH +1 770 642-7745 FX +1 770 643-2954 NOTICE UxC, LLC ( UxC ) shall have title to, ownership of, and all proprietary rights