WIM #40 is located on US 52 near South St. Paul in Dakota county.
|
|
|
- Bridget Lawson
- 5 years ago
- Views:
Transcription
1
2 WIM Site Location WIM #40 is located on US 52 near South St. Paul in Dakota county. System Operation WIM #40 was operational for the entire month of November Volume was computed using all monthly data. System Calibration WIM #40 was most recently calibrated on Table 1 summarizes the front axle weights of class 9s by lane 1. Table 1 indicates that the class 9 front axle weights were all within +/- 9% of baseline calibration values for all lanes. Figure 1 shows the distribution of gross vehicle weights (GVW) in Class 9 vehicles at this site for the last 12 months of operation 2. Figure 2 depicts the average front axle weight as a percent difference from the first full month following calibration. Summary of Volume Statistics Total Monthly Volume: Passenger : Heavy Commercial : Monthly Average Daily Traffic (MADT): Monthly Heavy Commercial Average Daily Traffic (MHCADT): 4052 See Table 2 for vehicle class breakdown Passenger (PVs) and Heavy Commercial (HCVs) Volume trends. NB vehicles typically reached highest volume levels on Tuesdays, with lowest volumes reported on Sundays. SB vehicles typically reached highest volume levels on Tuesdays, with lowest volumes reported on Sundays (see Figure 3 and 4). Passenger (PVs) Volume trends. On an average 24-hour day (see Figure 5), NB PVs generally reached peak volume levels between 07 AM and 05 PM. Similarly, SB PVs peaked in volume between 03 PM and 05 PM Heavy Commercial (HCVs) Volume trends. On an average 24-hour day, HCVs traveling NB typically reached peak volume levels between 07 AM and 05 PM, while volume going SB peaked between 03 PM and 05 PM. See Figure 6. Out of all HCVs, the two highest traffic volumes were generated by Class 5's and Class 9's.
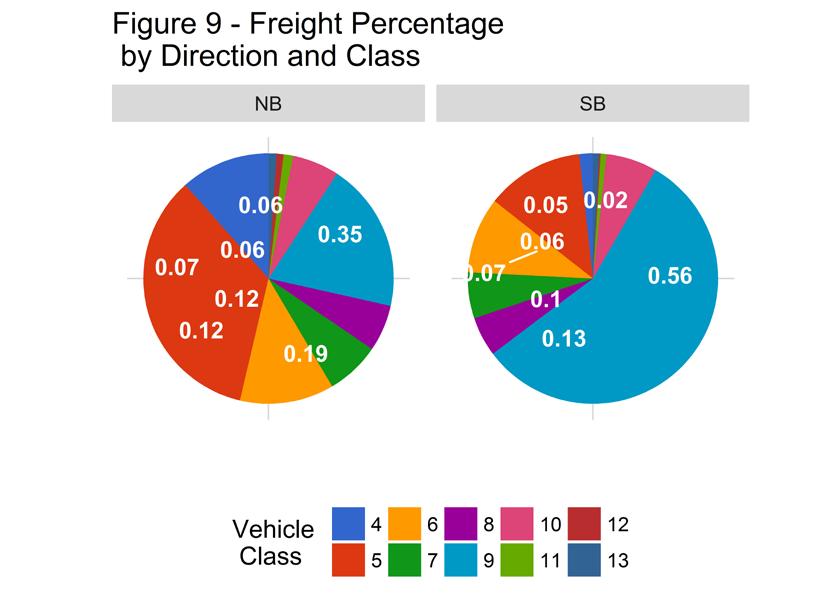
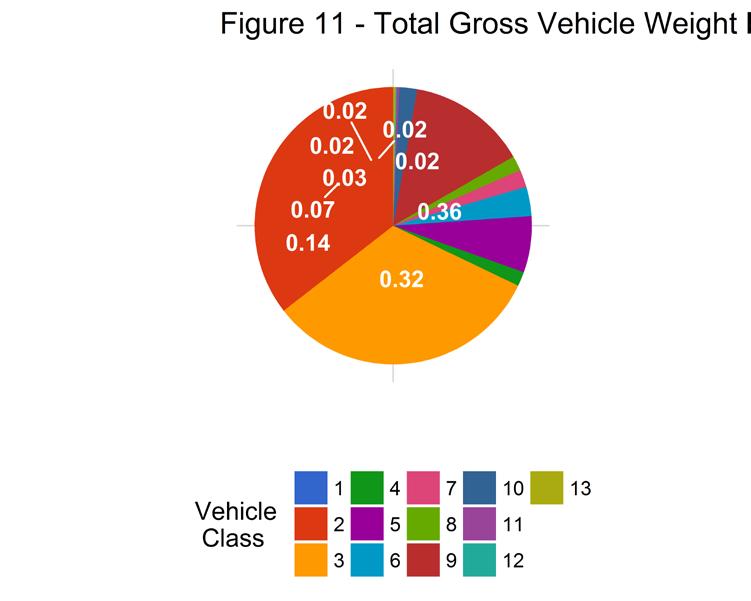
3 Overweight HCVs Volume trends. Of a total of HCVs, 4435 of them were overweight 3. These overweight HCVs contributed to 0.3% of total monthly volume, and 3.9% of total monthly HCV volume. NB overweight vehicles typically reached highest numbers on Mondays, with lowest volumes reported on Sundays. SB overweight vehicles tended to reach highest volumes on Tuesdays, with lowest volumes reported on Sundays. See Figure 3. The top two overweight violators by class were the class 14 and class 9 vehicles. Overall, overweight vehicles tended to reach peak volume concentrations during typical business hours, with 85.5% of all overweight vehicles traveling SB this month (see Figure 7 & 8). Figure 9 shows the number of vehicles exceeding 88,000 pounds that crossed the WIM over the last 12 months. The highest number of 88,000+ vehicles within the last 12 months occurred in November. WIMs are currently used as a screening tool for weight enforcement, and it is estimated that the WIM scales can measure gross vehicle weights (GVW) within 90-95% of static weight scale measurements. Due to the possibility of measurement error, vehicles exceeding 10% of their legal weight limits (or 1.1 times their legal weight limits) are considered overweight in this report 4. Using normal load limits,64 NB vehicles exceeded 88,000 pounds (24 vehicles were Class 13's; 18 vehicles were Class 10's). Of vehicles traveling SB, 1922 NB vehicles exceeded 88,000 pounds (1777 vehicles were Class 14's; 57 vehicles were Class 10's). Refer to Table 3 for the Top 10 highest recorded GVWs from Classes 9 and 10 from November Loaded vs. Unloaded HCVs. Figure 10 shows the GVW distributions of Class 9s and 10s in November Data suggests that there were greater numbers of fully_loaded Class 9's than empty Class 9's traveling NB, while there were more fully_loaded Class 9's than empty traveling SB. Data also suggests that there were more fully_loaded Class 10's than empty traveling in the NB direction. In the SB direction, there were more fully_loaded class 10 vehicles. Freight Totals. A total of tons of freight was recorded to have crossed the WIM. More freight was shipped SB (68%) than NB (32%). See Table 4 and Figure 11 for more freight information. Infrastructure Considerations Bridge. Bridge No (Lafayette Bridge) is approximately 3.9 miles north of WIM #40. A pair of bridges also exists 0.7 miles south of WIM #40 Bridge No on the NB side, and Bridge No on the SB side. WIM #40 recorded a total of vehicles with a combined GVW of kips (1 kip = 1,000 pounds = 0.5 tons) in November See Table 5 and Figures for GVW information by vehicle class and lane. Pavement Design. A total of equivalent single axle loads (ESALs) passed over the pavement at this site. Approximately 99.2% of all ESALs were recorded SB while 0.8% was observed NB. In particular, 97% of all ESALs were generated by the Class 14's (Class 14's were also responsible for generating % of total GVW observed this month). See Table 6 and
4 Figures for more information on ESALs (Table 6 also provides flexible ESAL factors for each vehicle class using a terminal serviceability of 2.5 and a structural number of 5). WIM monthly reports can be found at: MnDOT's vehicle classification scheme and vehicle class groupings for traffic forecasting can be found at: 1 Front axle weights of Class 9s are monitored on a monthly basis to assure performance between calibrations. The current goal of the WIM scale calibration is to have each individual axle weight stay within a range of?9% of baseline calibration values 2 Previous WIM research indicates that unloaded Class 9s typically weigh kips, while loaded Class 9s generally fall in the kip range. More recent data from several WIM sites suggests that the unloaded Class 9 range may have moved a little higher over time (due to increased presence of sleeper cabs, etc.), although these ranges are also thought to be site-specific. 3 An HCV is considered overweight during normal load limits in this report if they satisfy any of the following 1) exceed a gross vehicle weight (GVW) of 80,000 pounds, 2) exceed any of the legal weight maximums on any axle configurations (legal maximums are: single axle = 20,000 pounds; tandem axles spaced 8' or less = 34,000 pounds; tridem axles spaced 9' or less = 43,000 pounds; quad axles spaced 13' or less = 51,000 pounds). Monthly reports use this standard regardless of the time of year however, the Winter Load Increase (WLI) allows a 10% across the board increase in axle and gross vehicle weights without a permit on US, state routes, and county roads. An HCV is considered overweight during Winter Load Increase(WLI) if they satisfy any of the following 1) exceed a gross vehicle weight (GVW) of 88,000 pounds, 2) exceed any of the legal weight maximums on any axle configurations (legal maximums are: single axle = 22,000 pounds; tandem axles spaced 8' or less = 37,400 pounds; tridem axles spaced 9' or less = 47,300 pounds; quad axles spaced 13' or less = 56,100 pounds). An overweight HCV is only included once in the overweight volume calculations regardless of how many of the aforementioned conditions are violated. For information on MN weight limit dates and statutes: 4 For example, Class 9s and 10s can legally have gross vehicle weights up to 80,000 lbs (with the exception of permitted loads) during normal load limits. To account for measurement error on the WIM scales, those exceeding 10% of the legal GVW maximum (or 1.1 times the legal GVW) should be screened (e.g., 80,000 lbs + 8,000 lbs = 88,000 lbs). Similarly during WLI vehicles weighing 96,800 lbs should be screened. To request this document in an alternative format, please call or , or your request to ADArequest.dot@state.mn.us. Please request at least one week in advance.
5
6
7
8
9
10

11 Vehicle Dec 2016 Jun 2017 Jul 2017 Aug 2017 Sep 2017 Oct 2017 Nov 2017 Weights (Kips) > Total

12 Vehicle Dec 2016 Jun 2017 Jul 2017 Aug 2017 Sep 2017 Oct 2017 Nov 2017 Weights (Kips) > Total
13
14
15
16 Table 1 Class 9 Front Axle Weight by Month 1 (Kips) Front Axle +/- 9% 2 (Kips) Front Axle +/- 9% 3 (Kips) Front Axle +/- 9% 4 (kips) Front Axle +/- 9% December June July August September October November
17 Table 2 Vehicle Classification Data Vehicle Class Monthly Average Daily Volume Monthly Total Volume Monthly Total Volume Percentage Monthly Total Overweight TOTAL Monthly Total Overweight Percentage
18 Table 3 Top 10 Gross Vehicle Weight, Class 9 and 10 Date Day of Week Time Vehicle Class Direction GVW (lbs) Monday 15:29:43 9 SB Thursday 07:49:39 9 SB Thursday 13:57:06 10 SB Wednesday 08:18:30 10 SB Wednesday 08:26:22 9 SB Thursday 09:04:39 10 SB Tuesday 14:10:31 9 SB Wednesday 14:02:05 9 SB Wednesday 14:37:54 10 SB Monday 12:04:30 9 SB
19 Table 4 Freight Summary Vehicle Class Direction Weight of Empty Vehicle (Kips) Total Number of Number of Empty Percentage of Empty Total Weight of with Freight (Kips) Total Weight of Empty (Kips) Total Weight of Freight (Tons) 4 NB NB NB NB NB NB NB NB NB NB TOTAL **** **** **** **** Vehicle Class Direction Weight of Empty Vehicle (Kips) Total Number of Number of Empty Percentage of Empty Total Weight of with Freight (Kips) Total Weight of Empty (Kips) Total Weight of Freight (Tons) 4 SB SB SB SB SB SB SB SB SB SB TOTAL **** **** **** **** GRAND TOTAL **** ****
20 Table 5 Gross Vehicle Weight by Class and Vehicle Class NB Driving NB Passing SB Passing SB Driving Total TOTAL GVW/LANE Percentage
21 Table 6 ESALs by Class and and Flexible ESAL Factors Vehicle Class NB Driving NB Passing SB Passing SB Driving Total Percentage Flexible ESAL Factor e TOTAL ESALS/LANE
22 Table 7 Site Summary: Volume and Vehicle Class Month Total Volume Month ly ADT Month ly HCAD T Passenge r Passeng er % Heavy Commerc ial Heavy Commerc ial % Heavy Commerc ial in Driving % Heavy Commerc ial in Passing % Dec Jun Jul Aug Sep Oct Nov TOTAL AVERA GE
23 ESALs Month ESALS NB Passing ESALS NB Driving ESALS SB Driving ESALS SB Passing Total ESALS Driving ESALS % Passing ESALS % Dec Jun Jul Aug Sep Oct Nov TOTAL AVERAGE Pavement Life Decrease Months
24 Gross Vehicle Weight Month GVW NB Passing GVW NB Driving GVW SB Passing GVW SB Driving Total GVW Kips Dec Jun Jul Aug Sep Oct Nov TOTAL AVERAGE
25 Overweight Month Total Number of Overweight Overweight / Total Volume Overweight / Heavy Commercial Volume Number Over 88,000 lbs Number Over 98,000 lbs Dec Jun Jul Aug Sep Oct Nov TOTAL AVERAGE
26 Freight Month NB Freight Tons SB Freight Tons Total Freight NB Freight % SB Freight % Dec Jun Jul Aug Sep Oct Nov TOTAL AVERAGE
WIM #29 was operational for the entire month of October Volume was computed using all monthly data.
 OCTOBER 2015 WIM Site Location WIM #29 is located on US 53 near Cotton in St Louis county. System Operation WIM #29 was operational for the entire month of October 2015. Volume was computed using all monthly
WIM #37 was operational for the entire month of September Volume was computed using all monthly data.
 SEPTEMBER 2016 WIM Site Location WIM #37 is located on I-94 near Otsego in Wright county. The WIM is located only on the westbound (WB) side of I-94, meaning that all data mentioned in this report pertains
WIM #48 is located on CSAH 5 near Storden in Cottonwood county.
 WIM Site Location WIM #48 is located on CSAH 5 near Storden in Cottonwood county. System Operation WIM #48 was operational for the entire month of August 2017. Volume was computed using all monthly data.
WIM #31 US 2, MP 8.0 EAST GRAND FORKS, MN JANUARY 2015 MONTHLY REPORT
 WIM #31 US 2, MP 8.0 EAST GRAND FORKS, MN JANUARY 2015 MONTHLY REPORT WIM #31 EAST GRAND FORKS MONTHLY REPORT - JANUARY 2015 WIM Site Location WIM #31 is located on US 2 at mile post 8.0, southeast of
WIM #41 CSAH 14, MP 14.9 CROOKSTON, MINNESOTA APRIL 2014 MONTHLY REPORT
 WIM #41 CSAH 14, MP 14.9 CROOKSTON, MINNESOTA APRIL 2014 MONTHLY REPORT In order to understand the vehicle classes and groupings, the MnDOT Vehicle Classification Scheme and the Vehicle Classification
WIM #41 CSAH 14, MP 14.9 CROOKSTON, MINNESOTA MAY 2013 MONTHLY REPORT
 WIM #41 CSAH 14, MP 14.9 CROOKSTON, MINNESOTA MAY 2013 MONTHLY REPORT In order to understand the vehicle classes and groupings the Mn/DOT Vehicle Classification Scheme and the Vehicle Classification Groupings
WIM #40 US 52, MP S. ST. PAUL, MN APRIL 2010 MONTHLY REPORT
 WIM #40 US 52, MP 126.8 S. ST. PAUL, MN APRIL 2010 MONTHLY REPORT In order to understand the vehicle classes and groupings the Mn/DOT Vehicle Classification Scheme and the Vehicle Class Groupings for Forecasting
WIM #39 MN 43, MP 45.2 WINONA, MN APRIL 2010 MONTHLY REPORT
 WIM #39 MN 43, MP 45.2 WINONA, MN APRIL 2010 MONTHLY REPORT In order to understand the vehicle classes and groupings the Mn/DOT Vehicle Classification Scheme and the Vehicle Class Groupings for Forecasting
Traffic Reports User Documentation
 Traffic Reports User Documentation Date: 2 April 204 Version:. Prepared by Opus International Consultants ( Canada ) Limited of 42 Table of Contents Introduction... 3 2 Background... 3 3 Traffic Reports
September 2016 Water Production & Consumption Data
 September 2016 Water Production & Consumption Data September 2016 monthly water production (288.48 AF) was lowest in at least 17 years. Monthly water production has increased slightly each month since
SPECIAL HAULING PERMITS
 ODOT PERMITS OMA, NOVEMBER 29, 2017 SPECIAL HAULING PERMITS Mike Moreland Supervisor of Permits, ODOT Special Hauling Permit Section (614) 351-5530 Mike.Moreland2@dot.ohio.gov 2 Ohio Manufacturers Association
Total Production by Month (Acre Feet)
") Production by Month (acre-feet) 2008 2009 2010 2011 2012 2013 2014 2015 2016 January 25 339.10 228.90 249.50 297.99 243.06 327.14 247.66 212.37 February 234.00 218.80 212.10 241.52 245.82 279.08 234.16
Production by Month (acre-feet) 2008 2009 2010 2011 2012 2013 2014 2015 2016 January 25 339.10 228.90 249.50 297.99 243.06 327.14 247.66 212.37 February 234.00 218.80 212.10 241.52 245.82 279.08 234.16
Meter Insights for Downtown Store
 Meter Insights for Downtown Store Commodity: Analysis Period: Prepared for: Report Date: Electricity 1 December 2013-31 December 2014 Arlington Mills 12 February 2015 Electricity use over the analysis
Truck Axle Weight Distributions
 Truck Axle Weight Distributions Implementation Report IR-16-02 Prepared for Texas Department of Transportation Maintenance Division Prepared by Texas A&M Transportation Institute Cesar Quiroga Jing Li
FHWA/IN/JTRP-2000/23. Final Report. Sedat Gulen John Nagle John Weaver Victor Gallivan
 FHWA/IN/JTRP-2000/23 Final Report DETERMINATION OF PRACTICAL ESALS PER TRUCK VALUES ON INDIANA ROADS Sedat Gulen John Nagle John Weaver Victor Gallivan December 2000 Final Report FHWA/IN/JTRP-2000/23 DETERMINATION
FOR IMMEDIATE RELEASE
 Article No. 7761 Available on www.roymorgan.com Roy Morgan Unemployment Profile Monday, 8 October 2018 Unemployment down to 9.4% in September off two-year high Australian employment has grown solidly over
US Rt. 12/20/45 at US Rt. 20 <Westbound and Southbound>
 US Rt. 12/20/45 at US Rt. 20 Village of Stone Park, Illinois R L R F o l l o w - U p E v a l u a t i o n R e p o r t Reference No: 016-43280 December 2010 Table of Contents
Project Manager: Neil Beckett. Prepared by: Bernadette Bañez. Reviewed by: Neil Beckett. Approved for issue by: David Darwin
 Annual Weigh-In-Motion (WiM) Report 2010 This report has been prepared for the benefit of the NZ Transport Agency (NZTA). No liability is accepted by this company or any employee or sub-consultant of this
August ATR Monthly Report
 August ATR Monthly Report Minnesota Department of Transportation Office of Transportation Data and Analysis August 2011 Introduction The purpose of this report is to examine monthly traffic trends on
May ATR Monthly Report
 May ATR Monthly Report Minnesota Department of Transportation Office of Transportation Data and Analysis May 2011 Introduction The purpose of this report is to examine monthly traffic trends on Minnesota
CHARACTERIZATION AND DEVELOPMENT OF TRUCK LOAD SPECTRA FOR CURRENT AND FUTURE PAVEMENT DESIGN PRACTICES IN LOUISIANA
 CHARACTERIZATION AND DEVELOPMENT OF TRUCK LOAD SPECTRA FOR CURRENT AND FUTURE PAVEMENT DESIGN PRACTICES IN LOUISIANA LSU Research Team Sherif Ishak Hak-Chul Shin Bharath K Sridhar OUTLINE BACKGROUND AND
Expansion Projects Description
 Expansion Projects Description The Turnpike expansion program was authorized by the Florida Legislature in 1990 to meet the State s backlog of needed highway facilities. The Legislature set environmental
2017 Adjusted Count Report February 12, 2018
 A statewide multi-use trail user study and volunteer data collection program 2017 Adjusted Count Report February 12, 2018 The following report includes the final adjusted infrared (IR) counter data at
Michigan. Traffic. Profile
 June 2014 Revised 5/11/15 Michigan 2013 Traffic Crash Profile Reporting Criteria Please pay particular attention to the wording when interpreting the three levels of data gathered for this report. Crash
Sound Transit Operations July 2016 Service Performance Report. Ridership
 Ridership Total Boardings by Mode Mode Jul-15 Jul-16 % YTD-15 YTD-16 % ST Express 1,618,779 1,545,852-4.5% 10,803,486 10,774,063-0.3% Sounder 333,000 323,233-2.9% 2,176,914 2,423,058 11.3% Tacoma Link
The impact of electric vehicle development on peak demand and the load curve under different scenarios of EV integration and recharging options
 The impact of electric vehicle development on peak demand and the load curve under different scenarios of EV integration and recharging options Electricity demand in France: a paradigm shift Electricity
FOR IMMEDIATE RELEASE
 Article No. 5842 Available on www.roymorgan.com Roy Morgan Unemployment Profile Thursday, 2 October 2014 Unemployment climbs to 9.9% in September as full-time work lowest since October 2011; 2.2 million
Michigan. Traffic. Profile
 June 2014 Revised 5/11/15 Michigan 2013 Traffic Crash Profile Reporting Criteria Please pay particular attention to the wording when interpreting the three levels of data gathered for this report. Crash
FOR IMMEDIATE RELEASE
 Article No. 7353 Available on www.roymorgan.com Roy Morgan Unemployment Profile Wednesday, 11 October 2017 2.498 million Australians (18.9%) now unemployed or under-employed In September 1.202 million
LARGE TRUCK MONITORING PROGRAM
 LARGE TRUCK MONITORING PROGRAM WIM Station Annual Report for 2008 Prepared for: NEW JERSEY DEPARTMENT OF TRANSPORTATION Bureau of Freight Services Prepared by: LARGE TRUCK MONITORING PROGRAM WIM Station
FOR IMMEDIATE RELEASE
 Article No. 7845 Available on www.roymorgan.com Roy Morgan Unemployment Profile Friday, 18 January 2019 Unemployment in December is 9.7% and under-employment is 8.8% FOR IMMEDIATE RELEASE Australian unemployment
Freight Performance Measures Using Truck GPS Data and the Application of National Performance Measure Research Data Set (NPMRDS)
") Freight Performance Measures Using Truck GPS Data and the Application of National Performance Measure Research Data Set (NPMRDS) Chen-Fu Liao Department of Civil, Environmental, and Geo- Engineering University
Freight Performance Measures Using Truck GPS Data and the Application of National Performance Measure Research Data Set (NPMRDS) Chen-Fu Liao Department of Civil, Environmental, and Geo- Engineering University
FOR IMMEDIATE RELEASE
 Article No. 7433 Available on www.roymorgan.com Roy Morgan Unemployment Profile Friday, 12 January 2018 2.6m Australians unemployed or under-employed in December The latest data for the Roy Morgan employment
Passive Investors and Managed Money in Commodity Futures. Part 2: Liquidity. Prepared for: The CME Group. Prepared by:
 Passive Investors and Managed Money in Commodity Futures Part 2: Liquidity Prepared for: The CME Group Prepared by: October, 2008 Table of Contents Section Slide Number Objectives and Approach 3 Findings
Commercial-in-Confidence Ashton Old Baths Financial Model - Detailed Cashflow
 Year 0 1 2 3 4 5 6 7 8 9 10 11 12 13 Oct-16 Nov-16 Dec-16 Jan-17 Feb-17 Mar-17 Apr-17 May-17 Jun-17 Jul-17 Aug-17 Sep-17 Oct-17 2,038 2,922 4,089 4,349 6,256 7,124 8,885 8,885 8,885 8,885 8,885 8,885 9,107
The Peoples Gas Light and Coke Company
 History of Gas Charges Due to the Operation of Rider 2 (Cents per Therm) Factors for Transportation Customers (Riders FST, SST, P, CFY and AGG) Non- Total Standby Standby Aggregation Commodity Commodity
Journey into quality for traffic monitoring equipment. Short session monitoring operations
 Journey into quality for traffic monitoring equipment Short session monitoring operations Introduction Quality assurance/quality control for short session portable equipment. Historically, quality assurance/quality
Appendix SAN San Diego, California 2003 Annual Report on Freeway Mobility and Reliability
 (http://mobility.tamu.edu/mmp) Office of Operations, Federal Highway Administration Appendix SAN San Diego, California 2003 Annual Report on Freeway Mobility and Reliability This report is a supplement
Michigan State Police (MSP) Post 21 - Metro North
 Post 21 - Metro North") June 2018 Revised 8/3/2018 2017 Reporting Criteria Please pay particular attention to the wording when interpreting the three levels of data gathered for this report. Crash The Crash Level analyzes data
June 2018 Revised 8/3/2018 2017 Reporting Criteria Please pay particular attention to the wording when interpreting the three levels of data gathered for this report. Crash The Crash Level analyzes data
NEW Load Restrictions and Overweight/Oversize Permit Requirements
 NEW Load Restrictions and Overweight/Oversize Permit Requirements Illegaly overweight vehicles damage Minnehaha County roads, shorten road life, and increase costs to both the trucking industry and taxpayers.
Project Title: Using Truck GPS Data for Freight Performance Analysis in the Twin Cities Metro Area Prepared by: Chen-Fu Liao (PI) Task Due: 9/30/2013
 Task Due: 9/30/2013") MnDOT Contract No. 998 Work Order No.47 213 Project Title: Using Truck GPS Data for Freight Performance Analysis in the Twin Cities Metro Area Prepared by: Chen-Fu Liao (PI) Task Due: 9/3/213 TASK #4:
MnDOT Contract No. 998 Work Order No.47 213 Project Title: Using Truck GPS Data for Freight Performance Analysis in the Twin Cities Metro Area Prepared by: Chen-Fu Liao (PI) Task Due: 9/3/213 TASK #4:
GAZIFÈRE INC. Prime Rate Forecasting Process 2017 Rate Case
 Overview A consensus forecast is used to estimate the prime rate charged by commercial banks. As the prime rate is subject to competitive pressures faced by individual lenders and is set on an individual
Michigan State Police (MSP) Post 21 - Metro North
 Post 21 - Metro North") October 2017 2016 Reporting Criteria Please pay particular attention to the wording when interpreting the three levels of data gathered for this report. Crash The Crash Level analyzes data related to crash
October 2017 2016 Reporting Criteria Please pay particular attention to the wording when interpreting the three levels of data gathered for this report. Crash The Crash Level analyzes data related to crash
Traffic Safety Network Huron Valley
 June 2018 Revised 8/3/2018 2017 Reporting Criteria Please pay particular attention to the wording when interpreting the three levels of data gathered for this report. Crash The Crash Level analyzes data
Design Criteria Data
 MINNEAPOLIS-ST PAUL MN Latitude = 44.88 N WMO No. 72658 Longitude = 93.22 W Elevation = 837 feet Period of Record = 1973 to 1996 Average Pressure = 29.7 inches Hg Design Criteria Data Mean Coincident (Average)
Michigan State Police (MSP) Traffic Safety Network Traverse Bay Area
 Traffic Safety Network Traverse Bay Area") June 2016 Revised 2/15/2017 2015 Reporting Criteria Please pay particular attention to the wording when interpreting the three levels of data gathered for this report. Crash The Crash Level analyzes data
June 2016 Revised 2/15/2017 2015 Reporting Criteria Please pay particular attention to the wording when interpreting the three levels of data gathered for this report. Crash The Crash Level analyzes data
Price Category Breakdown - February 2010
 SINGLE FAMILY RESIDENTIAL BREAKDOWN ruary 21 ruary Sales and Average Price Increase Annually TORONTO - Wednesday, March 3, 21 7.3 % 24.6 % 1.8 % 7.3%.2%.1 % Greater Toronto REALTORS reported 7,291 sales
City of Biddeford Solid Waste Management Commission January 10, :00 PM Public Works
 City of Biddeford Solid Waste Management Commission January 10, 2017 7:00 PM Public Works 1. Call to Order 2. Approval of Minutes - December 13, 3. Discussion / Approval 3.1. Food Waste curbside collection
Prepared by: Bernadette Bañez. Reviewed by: Neil Beckett/Philp Blagdon. Approved for issue by: David Darwin
 Annual Weigh-In-Motion (WiM) Report 211 This report has been prepared for the benefit of the NZ Transport Agency (NZTA). No liability is accepted by this company or any employee or sub-consultant of this
Alberta Speeding Convictions and Collisions Involving Unsafe Speed
 Alberta Speeding Convictions and Collisions Involving Unsafe Speed 2004-2008 Overview This document was prepared under the Alberta Traffic Safety Plan, Strategic Research Plan for 2008-2010, with the objective
NEU Electric and Natural Gas Price Update
 $ / MWH Jan-11 May-11 Sep-11 Sep-12 Jan-13 Electric: Short-Term Outlook The NYMEX Northern Illinois Hub 12-month forward price at the end of August 2016 for the September 2016 to August 2017 period was
Van Buren County Traffic Crash Data & Year Trends. Reporting Criteria
 May 2015 Revised 3/16/2016 2014 Reporting Criteria Please pay particular attention to the wording when interpreting the three levels of data gathered for this report. Crash The Crash Level analyzes data
Introduction and Background Study Purpose
 Introduction and Background The Brent Spence Bridge on I-71/75 across the Ohio River is arguably the single most important piece of transportation infrastructure the Ohio-Kentucky-Indiana (OKI) region.
Provisional Review of Fatal Collisions. January to December 31 st 2017
 Provisional Review of Fatal Collisions January to December 31 st 17 2 nd January 18 Review of 17 fatal collision statistics as of 31st December 17 Overview This report summarises the main trends in road
Alberta. Collision Facts. 330 people killed. 17,907 people injured. 140,705 collisions.
 Collision Facts 330 people killed 17,907 people injured 140,705 collisions May 2017 www.transportation.alberta.ca/statistics Collision Facts 330 people killed 17,907 people injured 140,705 collisions Monday
Automated Occupancy Detection October 2015 (Phase I) Demonstration Results Presented by Kathy McCune
 Demonstration Results Presented by Kathy McCune") Automated Occupancy Detection October 2015 (Phase I) Demonstration Results Presented by Kathy McCune 2016 TRB Managed Lanes Conference May 5th, Session 6 Presentation Background Outline Metro ExpressLanes
Automated Occupancy Detection October 2015 (Phase I) Demonstration Results Presented by Kathy McCune 2016 TRB Managed Lanes Conference May 5th, Session 6 Presentation Background Outline Metro ExpressLanes
Impact of Overweight Traffic on Pavement Life Using WIM Data and Mechanistic- Empirical Pavement Analysis
 Impact of Overweight Traffic on Pavement Life Using WIM Data and Mechanistic- Empirical Pavement Analysis HAO WANG, PhD, Assistant Professor JINGNAN ZHAO and ZILONG WANG, Graduate Research Assistant RUTGERS,
FOR IMMEDIATE RELEASE
 Article No. 6928 Available on www.roymorgan.com Roy Morgan Unemployment Profile Wednesday, 17 August 2016 Australian real unemployment jumps to 10.5% (up 0.9%) in July during post-election uncertainty
Presented by Eric Englert Puget Sound Energy September 11, 2002
 Results from PSE s First Year of Time of Use Program Presented by Eric Englert Puget Sound Energy September 11, 2002 Puget Sound Energy Overview 973,489 Total Electric Customers 908,949 are AMR Capable
Speed Limit and Safety Nexus Studies for Automated Enforcement Locations in the District of Columbia 3rd Street Tunnel at Massachusetts Avenue Exit
 Speed Limit and Safety Nexus Studies for Automated Enforcement Locations in the District of Columbia 3rd Street Tunnel at Massachusetts Avenue Exit Study Area and Location District PSA Ward ANC Phase Description
Kent County Traffic Crash Data & Year Trends. Reporting Criteria
 May 2015 Revised 3/16/2016 2014 Reporting Criteria Please pay particular attention to the wording when interpreting the three levels of data gathered for this report. Crash The Crash Level analyzes data
Collision Analysis Safety Tables
 Crash Severity Geography of Geography of Time and Date of Crash Conditions Features Features.. Queries Selected: Town(Hartford), Date(Year:All or //05 to 9/7/06), Severity(All), Route Class(Interstate),
TRAFFIC VOLUME TRENDS
 Page 1 U. S. Department Transportation Federal Highway Administration Office Highway Policy Information TRAFFIC VOLUME TRENDS September Travel on all roads and streets changed by +2.5 (5.8 billion vehicle
Design Criteria Data
 DULUTH MN Latitude = 46.83 N WMO No. 72745 Longitude = 92.18 W Elevation = 1417 feet Period of Record = 1973 to 1996 Average Pressure = 28.43 inches Hg Design Criteria Data Mean Coincident (Average) Values
TRAFFIC VOLUME TRENDS July 2002
 TRAFFIC VOLUME TRENDS July 2002 Travel on all roads and streets changed by +2.3 percent for July 2002 as compared to July 2001. Estimated Vehicle-Miles of Travel by Region - July 2002 - (in Billions) West
COUNT, CLASSIFICATION & SPEED SAMPLE REPORTS
 Connected Solutions for Better Traffic Safety Outcomes COUNT, CLASSIFICATION & SPEED SAMPLE REPORTS AllTrafficSolutions.com Why You Need Traffic Data at Your Fingertips As traffic in your municipality
COMPARISON OF FIXED & VARIABLE RATES (25 YEARS) CHARTERED BANK ADMINISTERED INTEREST RATES - PRIME BUSINESS*
 CHARTERED BANK ADMINISTERED INTEREST RATES - PRIME BUSINESS*") COMPARISON OF FIXED & VARIABLE RATES (25 YEARS) 2 Fixed Rates Variable Rates For Internal Use Only. FIXED RATES OF THE PAST 25 YEARS AVERAGE RESIDENTIAL MORTGAGE LENDING RATE - 5 YEAR* (Per cent) Year
COMPARISON OF FIXED & VARIABLE RATES (25 YEARS) 2 Fixed Rates Variable Rates For Internal Use Only. FIXED RATES OF THE PAST 25 YEARS AVERAGE RESIDENTIAL MORTGAGE LENDING RATE - 5 YEAR* (Per cent) Year
COMPARISON OF FIXED & VARIABLE RATES (25 YEARS) CHARTERED BANK ADMINISTERED INTEREST RATES - PRIME BUSINESS*
 CHARTERED BANK ADMINISTERED INTEREST RATES - PRIME BUSINESS*") COMPARISON OF FIXED & VARIABLE RATES (25 YEARS) 2 Fixed Rates Variable Rates FIXED RATES OF THE PAST 25 YEARS AVERAGE RESIDENTIAL MORTGAGE LENDING RATE - 5 YEAR* (Per cent) Year Jan Feb Mar Apr May Jun
COMPARISON OF FIXED & VARIABLE RATES (25 YEARS) 2 Fixed Rates Variable Rates FIXED RATES OF THE PAST 25 YEARS AVERAGE RESIDENTIAL MORTGAGE LENDING RATE - 5 YEAR* (Per cent) Year Jan Feb Mar Apr May Jun
2013 Operations Statistics Report Triangle Expressway Fourth Quarter
 2013 Operations Statistics Report Fourth Quarter 1 S. Wilmington Street Raleigh, C 27601 2012 Annual Operations Last Updated: Report 1 11, 2014 Table of Contents 2013 Fourth Quarter Operations Statistics
NJ Solar Market Update
 NJ Solar Market Update April 16, 20 Renewable Energy Committee Meeting Trenton, NJ Prepared by Charlie Garrison Solar Installed Capacity Data The preliminary installed solar capacity as of 3/31/ is approximately
NEWS Release. U.S. Manufacturing Technology Orders. Year-to-date U.S. manufacturing technology orders up 4.1% over 2011
 U.S. Manufacturing Technology Orders A statistical program of AMT NEWS Release FOR RELEASE: October 8, 2012 Contact: Pat McGibbon, AMT, 703-827-5255 Year-to-date U.S. manufacturing technology orders up
2016 Community Report Los Alamos County
 6 Los Alamos County Produced for the New Mexico Department of Transportation, Traffic Safety Division, Traffic Records Bureau, Under Contract 58 by the University of New Mexico, Geospatial and Population
DRIVER SPEED COMPLIANCE WITHIN SCHOOL ZONES AND EFFECTS OF 40 PAINTED SPEED LIMIT ON DRIVER SPEED BEHAVIOURS Tony Radalj Main Roads Western Australia
 DRIVER SPEED COMPLIANCE WITHIN SCHOOL ZONES AND EFFECTS OF 4 PAINTED SPEED LIMIT ON DRIVER SPEED BEHAVIOURS Tony Radalj Main Roads Western Australia ABSTRACT Two speed surveys were conducted on nineteen
NJ Solar Market Update As of 6/30/15
 NJ Solar Market Update As of 6/30/ Prepared by Charlie Garrison July 17, 20 SOLAR INSTALLED CAPACITY DATA The preliminary installed solar capacity as of 6/30/ is approximately 1,500.7 MW. Approximately
2015 Community Report White Rock
 5 White Rock Produced for the New Mexico Department of Transportation, Traffic Safety Division, Traffic Records Bureau, Under Contract 58 by the University of New Mexico, Geospatial and Population Studies,
Analysis of Waste & Recyclable Materials Collection Arrangements. Minnesota Pollution Control Agency Presented by Jeff Schneider
 Analysis of Waste & Recyclable Materials Collection Arrangements Minnesota Pollution Control Agency Presented by Jeff Schneider 4-16-2009 Presentation Topics 1. Purpose of Study & Scope of Work 2. Types
Traffic Engineers' Report for Fiscal Year 2017
 Mid-Bay Bridge Authority Traffic Engineers' Report for Fiscal Year 2017 Mid-Bay Bridge Authority Contents Executive Summary... 1 1. Introduction... 2 2. Mid-Bay Bridge Authority System... 3 3. Mid-Bay
Bank of Japan. Research and Statistics Department FOR RELEASE 8:50 A.M. Thursday, October 25, All items
 Bank of Japan Research and Statistics Department FOR RELEASE 8:50 A.M. Thursday, October 25, 2018 Report on the Services Producer Price ( Preliminary Figures for September 2018 ) The Services Producer
2016 Community Report Torrance County
 6 Torrance County Produced for the New Mexico Department of Transportation, Traffic Safety Division, Traffic Records Bureau, Under Contract 58 by the University of New Mexico, Geospatial and Population
2015 Community Report Torrance County
 5 Torrance County Produced for the New Mexico Department of Transportation, Traffic Safety Division, Traffic Records Bureau, Under Contract 58 by the University of New Mexico, Geospatial and Population
2016 Community Report Portales
 6 Portales Produced for the New Mexico Department of Transportation, Traffic Safety Division, Traffic Records Bureau, Under Contract 58 by the University of New Mexico, Geospatial and Population Studies,
Design Criteria Data
 OKLAHOMA CITY OK Latitude = 35.4 N WMO No. 72353 Longitude = 97.6 W Elevation = 133 feet Period of Record = 1973 to 1996 Average Pressure = 28.62 inches Hg Design Criteria Data Mean Coincident (Average)
2016 Community Report De Baca County
 6 De Baca County Produced for the New Mexico Department of Transportation, Traffic Safety Division, Traffic Records Bureau, Under Contract 58 by the University of New Mexico, Geospatial and Population
2015 Community Report Grants
 5 Grants Produced for the New Mexico Department of Transportation, Traffic Safety Division, Traffic Records Bureau, Under Contract 58 by the University of New Mexico, Geospatial and Population Studies,
VEHICLE / PEDESTRIAN COLLISIONS
 Info item No. 1 Crosswalk Safety Advisory Committee March 31, 2016 VEHICLE / PEDESTRIAN COLLISIONS HRM: January December 20 DISCLAIMER: All figures presented in this report reflect the information held
NJ Solar Market Update As of 10/31/15
 NJ Solar Market Update As of 10/31/15 Prepared by Charlie Garrison Renewable Energy Committee Meeting November 10, 2015 SOLAR INSTALLED CAPACITY DATA The preliminary installed solar capacity as of 10/31/15
Design Criteria Data
 MEDFORD/JACKSON CO. OR Latitude = 42.37 N WMO No. 72597 Longitude =122.8 W Elevation = 1329 feet Period of Record = 1973 to 1996 Average Pressure = 28.61 inches Hg Design Criteria Data Mean Coincident
A9 Data Monitoring and Analysis Report. January Content. 1. Executive Summary. 2. Overview. 3. Purpose. 4. Baseline Data Sources
 A9 Data Monitoring and Analysis Report January 2016 Content 1. Executive Summary 2. Overview 3. Purpose 4. Baseline Data Sources 5. Casualty Analysis 6. Vehicle Speed Data 7. Incident Frequency & Impact
Washtenaw County Traffic Crash Data & Year Trends. Reporting Criteria
 June 2018 Revised 8/3/2018 2017 Reporting Criteria Please pay particular attention to the wording when interpreting the three levels of data gathered for this report. Crash The Crash Level analyzes data
2016 Community Report Santa Fe County
 26 Santa Fe County Produced for the New Mexico Department of Transportation, Traffic Safety Division, Traffic Records Bureau, Under Contract 58 by the University of New Mexico, Geospatial and Population
2015 Community Report Las Vegas
 5 Las Vegas Produced for the New Mexico Department of Transportation, Traffic Safety Division, Traffic Records Bureau, Under Contract 58 by the University of New Mexico, Geospatial and Population Studies,
Evaluation of Renton Ramp Meters on I-405
 Evaluation of Renton Ramp Meters on I-405 From the SE 8 th St. Interchange in Bellevue to the SR 167 Interchange in Renton January 2000 By Hien Trinh Edited by Jason Gibbens Northwest Region Traffic Systems
2015 Community Report Tularosa
 5 Tularosa Produced for the New Mexico Department of Transportation, Traffic Safety Division, Traffic Records Bureau, Under Contract 58 by the University of New Mexico, Geospatial and Population Studies,
2016 Community Report San Juan County
 26 San Juan County Produced for the New Mexico Department of Transportation, Traffic Safety Division, Traffic Records Bureau, Under Contract 58 by the University of New Mexico, Geospatial and Population
2015 Community Report San Juan County
 25 San Juan County Produced for the New Mexico Department of Transportation, Traffic Safety Division, Traffic Records Bureau, Under Contract 58 by the University of New Mexico, Geospatial and Population
Washtenaw County Traffic Crash Data & Year Trends. Reporting Criteria
 June 2017 Revised 10/3/17 2016 Reporting Criteria Please pay particular attention to the wording when interpreting the three levels of data gathered for this report. Crash The Crash Level analyzes data
NEU Electric and Natural Gas Price Update
 Exelon s $24 Billion Energy Bill Senate Bill 2814 Short-Term Energy Price Outlook On November 15, 2016, Exelon, through its legislative supporters, introduced Senate Bill 2814, a massive 446 page document
Design Criteria Data
 BURLINGTON VT Latitude = 44.47 N WMO No. 72617 Longitude = 73.15 W Elevation = 341 feet Period of Record = 1973 to 1996 Average Pressure = 29.61 inches Hg Design Criteria Data Mean Coincident (Average)
2015 Community Report Doña Ana County
 25 Doña Ana County Produced for the New Mexico Department of Transportation, Traffic Safety Division, Traffic Records Bureau, Under Contract 58 by the University of New Mexico, Geospatial and Population
Design Criteria Data
 DES MOINES IA Latitude = 41.53 N WMO No. 72546 Longitude = 93.65 W Elevation = 965 feet Period of Record = 1973 to 1996 Average Pressure = 28.96 inches Hg Design Criteria Data Mean Coincident (Average)