Presented by Eric Englert Puget Sound Energy September 11, 2002
|
|
|
- Laurel Kelly
- 5 years ago
- Views:
Transcription

1 Results from PSE s First Year of Time of Use Program Presented by Eric Englert Puget Sound Energy September 11, 2002
2 Puget Sound Energy Overview 973,489 Total Electric Customers 908,949 are AMR Capable Meters 271,556 Electric Customers on Time of Use Rates (29%) 168,933 Electric Customers on TOU Info (17%) 64,540 Total Electric Non-AMR Meters


3 PSE Service Territory Rural 15% Metropolitan 20% Seattle Bellevue 65% Suburban


 Real")
4 Integrated Technology Investments in place Real Time Usage Data ConsumerLinX (Customer Information System) Real Time Pricing Data Portal


5 AMR Deployment AMR Operations Center ConsumerLinX System Controller Control Station Internet Pole Top Processor Customer Meters And Endpoints 10
6 Customer insight: Unaware of: how and why the cost to provide electricity varies during the day, or from time to time how to best change energy usage patterns Interested in: protecting the environment fair rates for all, including dynamic pricing Open to dynamic pricing, IF: the impact on THEM, personally, is clear and simple the community benefits
7 The Phases of Personal Energy Management Phase I: November 2000 Franchise-wide information campaign 400,000+ target customer program Four-period time-of-use framework Phase II: May ,000+ customers receive TOU rate differentials Customers may opt off by calling PSE Phase III: September 2001 Added 20,000 C/I customers Extend Pilot through winter to June 2002


8 Personal Energy Management Bill Supplement

9 Personal Energy Management Web Page
10
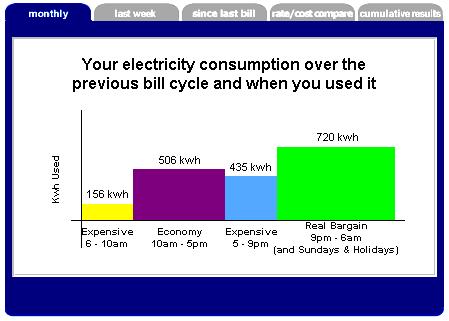
11 Web Capabilities Customers on the pilot get personal online reports of energy use. (Other customers also get information) Usage (KWh) Day Prior Usage Chart Expensive (6am to 10 am ) Economy (10am to 5pm) Expensive (5pm to 9pm) A Bargain (9pm to 6am) Fri Sat Sun Mon Tues Wed Thu But, after a few weeks... Note that this customer s s use is primarily in expensive time periods
12 Web Capabilities This customer has shifted use to a more regular pattern reducing the need for PSE to buy from more expensive, less efficient generation sources Usage (KWh) Day Prior Usage 20 Chart Fri Sat Sun Mon Tues Wed Thu Usage (KWh) Day Prior Usage Chart Fri Sat Sun Mon Tues Wed Thu Expensive (6am to 10 am ) Economy (10am to 5pm) Expensive (5pm to 9pm) A Bargain (9pm to 6am) Expensive (6am to 10 am ) Economy (10am to 5pm) Expensive (5pm to 9pm) A Bargain (9pm to 6am)

13 Personal Energy Management Summer Pricing
14 357 Restaurant Sites on Time of Day Rates in November % 4% Percent of Increase on TOD rates 3% 2% 1% 0% -1% -2% -3% -4% -5% 0 10,000 20,000 30,000 40,000 50,000 60,000 70,000
15 Customers Perceptions About PEM Program Information 100% 87% 90% 85% 99% 80% 60% 40% 20% 0% Meaningful & Useful Easy to Understand Believable Know When TOD Periods Occur
16 Have Customers Taken Action to Alter Energy Use? 100% 91% 80% 80% 60% 40% 20% 20% 9% 0% Taken Action No Action Information TOU Pricing
17 Types of Actions Taken by Customers to Alter Energy Use 100% 89% 80% 60% 40% 43% 41% 49% 20% 0% 4% 8% Shift use Reduce use Buy efficient equipment 1% 1% 1% 2% Install more insulation Use backup heat more Information TOU Pricing
18 Overall Satisfaction With TOD Pricing Program 90% 85% Percent of TOD Pricing Customers 80% 70% 60% 50% 40% 30% 20% 10% 0% 9% Total Satisfied (5-7) Total Dissatisfied (1-3)
19 What steps have you taken to alter energy use at your home? 100% 90% 80% 70% 60% 50% 40% 30% 20% 10% 0% 88% 89% 91% 89% 51% Electric Space & Water Heat 32% 43% 7% 5% 6% Electric Space Only Electric Water Only 51% 9% Electric Lights & Appliances Shift Usage of Appliances Use less, turn off Purchased more Efficient
20 General Residential Customer Reaction 67% - TOU is a good idea 66% - reduces need for power plants 64% - TOU pricing is fair 72% - concept is easy to understand 37% - should pay the same price no matter what time of day they use it
21 How TOD Program Results Were Measured Customer opinions, perceptions, energy-saving actions taken: TOD Pricing customers -- telephone survey in July TOD Information-only customers -- telephone survey in April Load shift impact (switching usage from peak periods to off-peak): Monthly comparison of actual TOD Pricing customer usage by time block with estimated But-for usage (what would have been used in the absence of the TOD program, based on a comparison group of TOD Information-only customers). Controlled for differences in pre-program energy use, housing type, and rate class. Conservation impact (reduction in overall total usage): Calculated as the difference between total monthly energy use in 2001 and weather-adjusted usage for the same month in Total percentage conserved by TOD customers separated into portion attributable to TOD pricing and portion for general conservation that would have happened anyway. General conservation component uses the total percent conserved by Non-TOD customers as a proxy for what TOD Pricing customers would have conserved. Conservation attributed to participation in TOD program is the difference between the total percentage conserved by TOD Pricing customers and by non-tod customers.
22 Sample Size March 2002 Residential Sample Size Load Shift Effect TOU Rate 213,066 Info Only 54,357 Other - Conservation Effect TOU Rate 195,776 Info Only 49,764 Other 196,928
23 Load Shift Impacts by Pricing Blocks 8% Percent of "But-For" Time Block Use Shifted 6% 4% 2% 0% -2% -4% -6% Morning Midday Evening Economy -8% Jun '01 Jul '01 Aug '01 Sep '01 Oct '01 Nov '01 Dec '01 Jan '02 Feb '02 Mar '02 Graph represents TOD Pricing group actual energy use compared to But-For usage based on Information-only comparison group
24 Time-of-Day Rate Customers compared to Info-Only, Percent of Load Shifted out of Morning Peak and Evening Peak Hours 7% 6% 5% 4% 3% 2% 1% 0% Morning Peak Evening Peak June July August September October November December January February March April May June July Time of Day rate customers shifted over 5% of their load out of the Morning and Evening time periods compared to customers who were on the Info-Only program, the shift out the Mid-Day period was over 2.5%.
25 Schedule 17 - Electric Water and Space Heat Morning Mid-day Evening June July August September October November December January February
26 Corresponding Own-Price Elasticities Are Higher (in Absolute Terms) During the Winter Analysis by Charles River Associates Own-Price Elasticity Morning Midday Evening Economy Summer Fall/Spring Winter
27 Shifted out of all On Peak Hours kwh per Residential Customer per month June July May August September October November December January February March April July June
28 TOD Pricing Pilot Conservation Impact -8% Percent of 2000 Total Monthly Use Conserved by TOD Pricing Participants -7% -6% -5% -4% -3% -2% -1% Conservation due to TOD Price Conservation due to Other Factors 0% Jun '01 Jul '01 Aug '01 Sep '01 Oct '01 Nov '01 Dec '01 Jan '02 Feb '02 Mar '02 Graph represents difference between current monthly (post-program) energy use and weatheradjusted 2000 monthly (pre-program) use. Brattle Report.
29 Net Conservation Effect Percentage by Dwelling Type for Schedule 27 - Electric Lights and Appliances 3% 0% MultiFamily Single Family -3% -6% June July August September October November December January February
30 Peak Capacity (MW) Savings from Residential Customers on Time-of-Day Rates resulting from the Shifting and Conservation Effects MW October November December January February March April May
31 Summary of Results Shift Savings 5%-6% shift out of peak Conservation Savings 1% Peak Capacity Savings MW
32 Monthly Residential Customers Leaving TOU Rate Program May July September November January March May
33 Management Benefits Redefine conservation and load management programs Lower turn over, lower training costs & fewer missed days Rallying point for employees Meaningful purpose for change New focus - Customer Experience
Meter Insights for Downtown Store
 Meter Insights for Downtown Store Commodity: Analysis Period: Prepared for: Report Date: Electricity 1 December 2013-31 December 2014 Arlington Mills 12 February 2015 Electricity use over the analysis
Total Production by Month (Acre Feet)
") Production by Month (acre-feet) 2008 2009 2010 2011 2012 2013 2014 2015 2016 January 25 339.10 228.90 249.50 297.99 243.06 327.14 247.66 212.37 February 234.00 218.80 212.10 241.52 245.82 279.08 234.16
Production by Month (acre-feet) 2008 2009 2010 2011 2012 2013 2014 2015 2016 January 25 339.10 228.90 249.50 297.99 243.06 327.14 247.66 212.37 February 234.00 218.80 212.10 241.52 245.82 279.08 234.16
September 2016 Water Production & Consumption Data
 September 2016 Water Production & Consumption Data September 2016 monthly water production (288.48 AF) was lowest in at least 17 years. Monthly water production has increased slightly each month since
Sprinkler System Waiver Application Packet
 Sprinkler System Waiver Application Packet According to the City s municipal code, use of sprinklers is conditional upon use of a water budget and the City continues to discourage customers from irrigating
FOR IMMEDIATE RELEASE
 Article No. 7353 Available on www.roymorgan.com Roy Morgan Unemployment Profile Wednesday, 11 October 2017 2.498 million Australians (18.9%) now unemployed or under-employed In September 1.202 million
2017 Adjusted Count Report February 12, 2018
 A statewide multi-use trail user study and volunteer data collection program 2017 Adjusted Count Report February 12, 2018 The following report includes the final adjusted infrared (IR) counter data at
FOR IMMEDIATE RELEASE
 Article No. 7761 Available on www.roymorgan.com Roy Morgan Unemployment Profile Monday, 8 October 2018 Unemployment down to 9.4% in September off two-year high Australian employment has grown solidly over
FOR IMMEDIATE RELEASE
 Article No. 5842 Available on www.roymorgan.com Roy Morgan Unemployment Profile Thursday, 2 October 2014 Unemployment climbs to 9.9% in September as full-time work lowest since October 2011; 2.2 million
Year to Date Summary. Average and Median Sale Prices
 A Publication of RMLS, The Source for Real Estate Statistics in Your Community Residential Review: Southwest Washington September 2018 Reporting Period September Residential Highlights Southwest Washington
Date Event or Holiday :Sun, 2:Mon North Orchard Delong Preschool North Orchard Delong Preschool
 2018 6 1 1:Sun, 2:Mon 2018-2019 Date Event or Holiday Aug 16 Board Meeting 6pm Aug 23 Open House June 2018 July 2018 August 2018 Sep 06 Board Meeting 6pm Su M Tu W Th F Sa Su M Tu W Th F Sa Su M Tu W Th
FOR IMMEDIATE RELEASE
 Article No. 6928 Available on www.roymorgan.com Roy Morgan Unemployment Profile Wednesday, 17 August 2016 Australian real unemployment jumps to 10.5% (up 0.9%) in July during post-election uncertainty
COMPARISON OF FIXED & VARIABLE RATES (25 YEARS) CHARTERED BANK ADMINISTERED INTEREST RATES - PRIME BUSINESS*
 CHARTERED BANK ADMINISTERED INTEREST RATES - PRIME BUSINESS*") COMPARISON OF FIXED & VARIABLE RATES (25 YEARS) 2 Fixed Rates Variable Rates For Internal Use Only. FIXED RATES OF THE PAST 25 YEARS AVERAGE RESIDENTIAL MORTGAGE LENDING RATE - 5 YEAR* (Per cent) Year
COMPARISON OF FIXED & VARIABLE RATES (25 YEARS) 2 Fixed Rates Variable Rates For Internal Use Only. FIXED RATES OF THE PAST 25 YEARS AVERAGE RESIDENTIAL MORTGAGE LENDING RATE - 5 YEAR* (Per cent) Year
COMPARISON OF FIXED & VARIABLE RATES (25 YEARS) CHARTERED BANK ADMINISTERED INTEREST RATES - PRIME BUSINESS*
 CHARTERED BANK ADMINISTERED INTEREST RATES - PRIME BUSINESS*") COMPARISON OF FIXED & VARIABLE RATES (25 YEARS) 2 Fixed Rates Variable Rates FIXED RATES OF THE PAST 25 YEARS AVERAGE RESIDENTIAL MORTGAGE LENDING RATE - 5 YEAR* (Per cent) Year Jan Feb Mar Apr May Jun
COMPARISON OF FIXED & VARIABLE RATES (25 YEARS) 2 Fixed Rates Variable Rates FIXED RATES OF THE PAST 25 YEARS AVERAGE RESIDENTIAL MORTGAGE LENDING RATE - 5 YEAR* (Per cent) Year Jan Feb Mar Apr May Jun
FOR IMMEDIATE RELEASE
 Article No. 7433 Available on www.roymorgan.com Roy Morgan Unemployment Profile Friday, 12 January 2018 2.6m Australians unemployed or under-employed in December The latest data for the Roy Morgan employment
FOR IMMEDIATE RELEASE
 Article No. 7845 Available on www.roymorgan.com Roy Morgan Unemployment Profile Friday, 18 January 2019 Unemployment in December is 9.7% and under-employment is 8.8% FOR IMMEDIATE RELEASE Australian unemployment
Electric Vehicle Program
 Cause No. 43960 INDIANAPOLIS POWER & LIGHT COMPANY Electric Vehicle Program Year 3 2013 Report May 2, 2014 Contents Background... 2 Project Objectives... 3 Current Status... 3 Significant Milestones...
Demand and Time of Use Rates. Marty Blake The Prime Group LLC
 Demand and Time of Use Rates Marty Blake The Prime Group LLC Factors Affecting Electric Rates Generation plant cost increases Fuel price increases and volatility Carbon and environmental regulations Cost
Provisional Review of Fatal Collisions. January to December 31 st 2017
 Provisional Review of Fatal Collisions January to December 31 st 17 2 nd January 18 Review of 17 fatal collision statistics as of 31st December 17 Overview This report summarises the main trends in road
2016 UC Solar Research Symposium
 2016 UC Solar Research Symposium Beyond UCR s Sustainable Integrated Grid Initiative: Energy Management Projects in Southern California October 7, 2016 Presented by: Alfredo A. Martinez-Morales, Ph.D.
MARKET RATES UPDATE Paula Gold-Williams Cory Kuchinsky
 MARKET RATES UPDATE I N T R O D U C T I O N BY: Paula Gold-Williams President & Chief Executive Officer (CEO) P R E S E N T E D BY: Cory Kuchinsky Interim Vice President, Financial Services September 24,
Commercial-in-Confidence Ashton Old Baths Financial Model - Detailed Cashflow
 Year 0 1 2 3 4 5 6 7 8 9 10 11 12 13 Oct-16 Nov-16 Dec-16 Jan-17 Feb-17 Mar-17 Apr-17 May-17 Jun-17 Jul-17 Aug-17 Sep-17 Oct-17 2,038 2,922 4,089 4,349 6,256 7,124 8,885 8,885 8,885 8,885 8,885 8,885 9,107
JBS Energy, Inc. 311 D Street West Sacramento California, USA tel Prepared by William B. Marcus Greg Ruszovan
 Know Your Customers : A Review of Load Research Data and Economic, Demographic, and Appliance Saturation Characteristics of California Utility Residential Customers Prepared by William B. Marcus Greg Ruszovan
M onthly arket. Jan Table of Contents. Monthly Highlights
 Table of Contents Market Inventory...2 www.gaar.com Monthly Highlights January 2014 had a 12.29% increase in the number of homes sales when compared to same time last year. The average sale price of single-family
VEHICLE / PEDESTRIAN COLLISIONS
 Info item No. 1 Crosswalk Safety Advisory Committee March 31, 2016 VEHICLE / PEDESTRIAN COLLISIONS HRM: January December 20 DISCLAIMER: All figures presented in this report reflect the information held
FOR IMMEDIATE RELEASE
 Article No. 7137 Available on www.roymorgan.com Roy Morgan Unemployment Profile Wednesday, 8 February 2017 Over 12 million Australians have jobs for the first time including over 8 million full-time jobs,
Residential Time-of-Day Service Rate Schedule R-TOD
 I. Applicability This Rate Schedule 1-R-TOD applies to single- and three-phase service for the following types of residential premises: 1. Individual or dual metered residences with digital communicating
Thank you for requesting information on our utility auditing services!
 - EXHIBIT A - ELECTRIC - CLIENT INVOICE: EXAMPLE #1 If we moved a client from an electrical rate 6 to a rate 6L, and, as a result, changed their KWH rate from $.06 per Kilowatt Hour to $.05 per Kilowatt
WIM #37 was operational for the entire month of September Volume was computed using all monthly data.
 SEPTEMBER 2016 WIM Site Location WIM #37 is located on I-94 near Otsego in Wright county. The WIM is located only on the westbound (WB) side of I-94, meaning that all data mentioned in this report pertains
NYSERDA R&D Time-Sensitive Pricing Demonstration: Advanced Metering, TOU Pricing and Technologies for Multifamily Buildings
 NYSERDA R&D Time-Sensitive Pricing Demonstration: Advanced Metering, TOU Pricing and Technologies for Multifamily Buildings Joseph S. Lopes Applied Energy Group, Inc. Herbert E. Hirschfeld, P.E. 1 NYSERDA
Residential Load Profiles
 Residential Load Profiles TABLE OF CONTENTS PAGE 1 BACKGROUND... 1 2 DATA COLLECTION AND ASSUMPTIONS... 1 3 ANALYSIS AND RESULTS... 2 3.1 Load Profiles... 2 3.2 Calculation of Monthly Electricity Bills...
GAZIFÈRE INC. Prime Rate Forecasting Process 2017 Rate Case
 Overview A consensus forecast is used to estimate the prime rate charged by commercial banks. As the prime rate is subject to competitive pressures faced by individual lenders and is set on an individual
NEW HAMPSHIRE GAS CORPORATION WINTER PERIOD ORIGINAL FILING CONTENTS 3. CONVERSION OF GAS COSTS - GALLONS TO THERMS SCHEDULE A
 NEW HAMPSHIRE GAS CORPORATION COST OF GAS RATE FILING - DG 13- WINTER PERIOD 2013-2014 ORIGINAL FILING CONTENTS 1. TARIFF PAGE - COST OF GAS RATE 2. MARKED TARIFF PAGE - COST OF GAS RATE 3. CONVERSION
Economics of Integrating Renewables DAN HARMS MANAGER OF RATE, TECHNOLOGY & ENERGY POLICY SEPTEMBER 2017
 Economics of Integrating Renewables DAN HARMS MANAGER OF RATE, TECHNOLOGY & ENERGY POLICY SEPTEMBER 2017 Presentation Outline Understanding LPEA s expenses and what drives them Economics of net metering
Balance from your previous bill $0.00 Meter # Basic Charge: 17 $ /day 3.23* Energy charge:¹ 2
 11983979 Jun 19, 217 1 124 962 Jul 11, 217 $24.34 Meter Reading Previous Bill. Balance from your previous bill $. Meter # 552711 May 3 19813 Account Account charge 12.4* Charges 17 days 82 Jun 15 19895
NJ Solar Market Update
 NJ Solar Market Update April 16, 20 Renewable Energy Committee Meeting Trenton, NJ Prepared by Charlie Garrison Solar Installed Capacity Data The preliminary installed solar capacity as of 3/31/ is approximately
Operational Overview. Operational Forum, 24 th March 2010
 Operational Overview Operational Forum, 24 th March 21 Weather Weather February 21 The cold weather continued throughout February with all but one day being colder than the 17-year seasonal normal CWV.
increase of over four per cent compared to the average of $409,058 reported in January 2010.
 SINGLE FAMILY RESIDENTIAL BREAKDOWN uary 211 26.8 % 1.7 % 7.%.4%.1 % Good Start to 211 TORONTO - February 4, 211 Greater Toronto REALTORS reported 4,337 transactions through the TorontoMLS system in uary
MISSOURI SERVICE AREA
 MO.P.S.C. SCHEDULE NO. 6 3rd Revised SHEET NO. 54 CANCELLING MO.P.S.C. SCHEDULE NO. 6 2nd Revised SHEET NO. 54 *RATE BASED ON MONTHLY METER READINGS RESIDENTIAL SERVICE RATE Summer Rate (Applicable during
Energy Markets in Turmoil The Consumer Perspective
 Energy Markets in Turmoil The Consumer Perspective Sonny Popowsky Consumer Advocate of Pennsylvania Illinois State University Institute for Regulatory Policy Studies 63682 Springfield, IL May 17, 2001
The impact of electric vehicle development on peak demand and the load curve under different scenarios of EV integration and recharging options
 The impact of electric vehicle development on peak demand and the load curve under different scenarios of EV integration and recharging options Electricity demand in France: a paradigm shift Electricity
DVD Backup Technical Information Web Site Gregg Maroney, Web Master Service Magazines
 DVD Backup Technical Information Web Site Gregg Maroney, Web Master http://www.hudsonterraplane.com/tech/tech_index.htm 1934-1944 Service Magazines 1934 Series Vol. 1, No. 3 - April-July Vol. 1, No. 1
BGE Smart Energy Pricing: Customers are making it work
 BGE Smart Energy Pricing: Customers are making it work Institute for Regulatory Policy Studies Conference April 29,2010 Neel Gulhar Program Manager, Smart Grid Smart Energy Pricing Agenda BGE Smart Grid
Analysis of Impact of Mass Implementation of DER. Richard Fowler Adam Toth, PE Jeff Mueller, PE
 Analysis of Impact of Mass Implementation of DER Richard Fowler Adam Toth, PE Jeff Mueller, PE Topics of Discussion Engineering Considerations Results of Study of High Penetration of Solar DG on Various
Introducing. Smart Energy Pricing
 Introducing Smart Energy Pricing Cheryl Hindes Director of Load Analysis and Settlement August 12, 2009 BGE s 2008 Smart Energy Pricing (SEP) Pilot featured Peak Time Rebate and Critical Peak Pricing Pilot
SALT RIVER PROJECT AGRICULTURAL IMPROVEMENT AND POWER DISTRICT E-27 CUSTOMER GENERATION PRICE PLAN FOR RESIDENTIAL SERVICE
 SALT RIVER PROJECT AGRICULTURAL IMPROVEMENT AND POWER DISTRICT E-27 CUSTOMER GENERATION PRICE PLAN FOR RESIDENTIAL SERVICE Effective: April 2015 Billing Cycle AVAILABILITY: The E-27 Price Plan is subject
Price Category Breakdown - February 2010
 SINGLE FAMILY RESIDENTIAL BREAKDOWN ruary 21 ruary Sales and Average Price Increase Annually TORONTO - Wednesday, March 3, 21 7.3 % 24.6 % 1.8 % 7.3%.2%.1 % Greater Toronto REALTORS reported 7,291 sales
MONTHLY RIDERSHIP AND PERFORMANCE REPORT. August 2018 Monthly Performance Report
 MONTHLY RIDERSHIP AND PERFORMANCE REPORT August 2018 Monthly Performance Report Ridership AUGUST, 2018 MONTHLY PERFORMANCE REPORT Ridership for the month of August decreased 2.6% when compared to August
Commonwealth of the Northern Mariana Islands
 Commonwealth of the Northern Mariana Islands ~ FISCAL YEAR ~ 2017 2018 % change ~ CALENDAR YEAR ~ 2017 2018 % change YTD OCT NOV DEC JAN FEB MAR APR MAY JUN JUL AUG SEP TOTAL 481,793 41,910 47,261 58,558
MONTHLY RIDERSHIP AND PERFORMANCE REPORT. July 2018 Monthly Performance Report
 MONTHLY RIDERSHIP AND PERFORMANCE REPORT July 2018 Monthly Performance Report JULY, 2018 MONTHLY PERFORMANCE REPORT Ridership Ridership for the month of July increased 1% when compared to July of 2017.
Units of Instruction MISD Pacing Guide Days Date Range Test Date
 MISD Pacing Guide Date Range Test Date Introduction: Processes of Investigations (1 day) Aug. 21 Unit 01: Matter (12 days) Aug. 22-Sept. 7 Sep. 10 Unit 02: Atomic Structure and the Periodic Table (15 days)
Docket No. DE Dated: 05/04/2015 Attachment CJG-1 Page 1
 Docket No. DE - Dated: 0/0/0 Attachment CJG- Page 8 9 Summary of Forecasted Energy Service 0 Cost For January 0 Through December 0 TOTAL COST Cents per KWH Reference Fossil energy costs $ 9,9 $. Attachment
SALT RIVER PROJECT AGRICULTURAL IMPROVEMENT AND POWER DISTRICT E-21 PRICE PLAN FOR RESIDENTIAL SUPER PEAK TIME-OF-USE SERVICE
 SALT RIVER PROJECT AGRICULTURAL IMPROVEMENT AND POWER DISTRICT E-21 PRICE PLAN FOR RESIDENTIAL SUPER PEAK TIME-OF-USE SERVICE Effective: April 2015 Billing Cycle Supersedes: November 2012 Billing Cycle
Inventory Levels - All Prices. Inventory Levels - By Price Range
 Inventory Levels - All Prices Idaho Falls Bonneville Total 3-Mar-17 152 108 260 2-Mar-18 109 78 187-28% Inventory Levels - By Price Range 3-Mar-17 2-Mar-18 0-100,000 41 6 100,001-125,000 19 8 125,001-150,000
Design Criteria Data
 OKLAHOMA CITY OK Latitude = 35.4 N WMO No. 72353 Longitude = 97.6 W Elevation = 133 feet Period of Record = 1973 to 1996 Average Pressure = 28.62 inches Hg Design Criteria Data Mean Coincident (Average)
Design Criteria Data
 MEDFORD/JACKSON CO. OR Latitude = 42.37 N WMO No. 72597 Longitude =122.8 W Elevation = 1329 feet Period of Record = 1973 to 1996 Average Pressure = 28.61 inches Hg Design Criteria Data Mean Coincident
CEO PROGRAM September 2018
 CEO PROGRAM September 2018 1 Sept 17th: ALL! CEO High Orientation (Kiva 6pm 7:30pm) 2 3 4 5 6 7 8 Sept 18th: ALL! CEO Orientation (Kiva 6pm 7:30pm) 9 10 11 12 13 14 15 *Parents please drop off/pick up
The London Low Emission Zone. Nick Fairholme Head of the LEZ Transport for London
 The London Low Emission Zone Nick Fairholme Head of the LEZ Transport for London An introduction to the LEZ. Air Quality in London Air pollution is a serious problem in London - 1,000 premature deaths
RE: Advice Schedule 45 Public DC Fast Charger Delivery Service Optional Transitional Rate REPLACEMENT PAGES
 January 31, 2017 VIA ELECTRONIC FILING Public Utility Commission of Oregon 201 High Street SE, Suite 100 Salem, OR 97301-3398 Attn: Filing Center RE: Advice 16-020 Schedule 45 Public DC Fast Charger Delivery
Design Criteria Data
 DES MOINES IA Latitude = 41.53 N WMO No. 72546 Longitude = 93.65 W Elevation = 965 feet Period of Record = 1973 to 1996 Average Pressure = 28.96 inches Hg Design Criteria Data Mean Coincident (Average)
Energy Conservation Efforts
 Hennepin County Property Services Energy Conservation Efforts MEPC Presentation September 2010 HENNEPIN COUNTY PROPERTY SERVICES DEPARTMENT MONTHLY ENERGY COSTS $1,200,000 $1,000,000 Cold 2009 October
PDR Energy Baseline Alternative. Proposal for Discussion October 27, 2015
 PDR Energy Baseline Alternative Proposal for Discussion October 27, 2015 Update Since Last Meeting Since the October 12 th Working Group Meeting Stem, Solar City, AMS and CESA have had over a half-dozen
M o n. a t i s t i c s. M o n t h l y NOVEMBER 2009
 M o n t h l y M o n t S h l t y a t i s t i c s NOVEMBER 29 For Immediate Release December 7, 29 CONTACT: Kimberly Clifton, President (52) 954-8 Wes Wiggins Vice President, MLS (52) 82-8792 Cheri Meadows
Design Criteria Data
 LAS VEGAS/MCCARRAN NV Latitude = 36.8 N WMO No. 72386 Longitude =115.1 W Elevation = 2179 feet Period of Record = 1973 to 1996 Average Pressure = 27.67 inches Hg Design Criteria Data Mean Coincident (Average)
Design Criteria Data
 PHOENIX/SKY HARBOR AZ Latitude = 33.43 N WMO No. 72278 Longitude =112. W Elevation = 116 feet Period of Record = 1973 to 1996 Average Pressure = 28.72 inches Hg Design Criteria Data Mean Coincident (Average)
Per Meter, Per Month. Effective July 1, 2018 Customer Charge Flat Charge $8.86
 SCHEDULE D TOU TIERED DOMESTIC TIME OF USE SERVICE TIERED (This rate schedule is closed to new customers as of July 1, 2018. On July 1, 2019, existing customers will be transitioned to their otherwise
Inventory Levels - All Prices. Inventory Levels - By Price Range
 Inventory Levels - All Prices Idaho Falls Bonneville Total 3-Nov-17 198 128 326 2-Nov-18 155 134 289-11% Inventory Levels - By Price Range 3-Nov-17 2-Nov-18 0-100,000 17 11 100,001-125,000 15 9 125,001-150,000
ANCR CRU Statistics February 2007 to December 2007
 ANCR CRU Statistics February 2007 to December 2007 o Jan/07 Feb/07* Mar/07 Apr/07 May/07 Jun/07 Jul/07 Aug/07 Sep/07 Oct/07 Nov/07 Dec/07 Total notes data from Perimeter phone system unavailable prior
The Peoples Gas Light and Coke Company
 History of Gas Charges Due to the Operation of Rider 2 (Cents per Therm) Factors for Transportation Customers (Riders FST, SST, P, CFY and AGG) Non- Total Standby Standby Aggregation Commodity Commodity
City of Howell - January 2019 Sun Mon Tue Wed Thu Fri Sat 1
 City of Howell - January 2019 Sun Mon Tue Wed Thu Fri Sat 1 2 3 4 5 New Year s Day No Rubbish Collection 6 7 8 9 10 11 12 Christmas Tree Pick-up Christmas Tree Pick-up 13 14 15 16 17 18 19 /Recycle Christmas
Manager of Market Strategy and Planning September 22, 2008
 One Utility s Perspective on Investment in Clean Energy Frederick Lynk Manager of Market Strategy and Planning September 22, 2008 6,400 employees N W 2.1M electric customers S 1.7M gas customers 24/7 operation
IOWA MOLD TOOLING CO., INC. BOX 189, GARNER, IA TEL: IMT PART NUMBER
 CRANE LOG CALENDAR YEAR CRANE MODEL Daily Inspections Weekly Inspections Monthly Inspections Lubrication Record Maintenance Record Damage & Repair Record Modification Record Reference Specifications CRANE
NEU Electric and Natural Gas Price Update
 $ / MWH Jan-11 May-11 Sep-11 Sep-12 Jan-13 Electric: Short-Term Outlook The NYMEX Northern Illinois Hub 12-month forward price at the end of August 2016 for the September 2016 to August 2017 period was
Methodology of Cost Allocation
 Methodology of Cost Allocation Robin Kliethermes May 17, 2013 1 Purpose of Cost Allocation Determine whether each class of customers is providing the utility with a reasonable level of revenue necessary
Energy Saving Campaign and Its Effect After Fukushima Disaster in Japan Aya Mikami Osaka Gas Co., Ltd.
 Energy Saving Campaign and Its Effect After Fukushima Disaster in Japan Aya Mikami Osaka Gas Co., Ltd. BECC Conference 2012, Sacramento, CA 14 November 2012 1 Background Damage by Tsunami Fukushima nuclear
BrightRidge Large Commercial and Industrial Rates October 2017 Billing Cycle All Rates Subject to TVA s Fuel Cost Adjustment (separate schedule)
") KEY RATE DEFINITIONS Seasonal Rate Periods (applicable to all rates) Billing Months are defined as June, July, August, and September. Billing Months are defined as December, January, February, and March.
KEY RATE DEFINITIONS Seasonal Rate Periods (applicable to all rates) Billing Months are defined as June, July, August, and September. Billing Months are defined as December, January, February, and March.
Appendix E Water Supply Modeling
 Supply Modeling Modesto Irrigation District Treatment Plant Expansion Project Modeling I. Introduction The Modesto Irrigation District (MID) is situated adjacent to and north of the Tuolumne River. Over
Past Due. Account Charges. Contract Charges Security Deposit Due - Jun 09, , Customer Service. Jun 19, PAST DUE $1,693.
 11983978 Jun 19, 217 1 124 958 PAST DUE $1,693.97 Meter Reading Information Meter # 55271 May 3 655 Jun 15 6642 17 days 1397 on or about Aug 15 82 Past Due Balance payable includes an amount which is payable
Macroeconomic Outlook. Presented by Dr. Bruce A. Scherr Chairman of the Board Chief Executive Officer Emeritus
 Macroeconomic Outlook Presented by Dr. Bruce A. Scherr Chairman of the Board Chief Executive Officer Emeritus Waterways Symposium Cincinnati, OH November 15-17, 2016 Topics Energy Macro Implications Inflation
FEB 2018 DEC 2017 JAN 2018 HOEP*
 Ontario Energy Report Q3 Electricity July September Electricity Prices Commodity Commodity cost comprises two components, the wholesale price (the Hourly Ontario Energy Price) and the Global Adjustment.
Flexible Capacity Needs and Availability Assessment Hours Technical Study for 2020
 Flexible Capacity Needs and Availability Assessment Hours Technical Study for 2020 Clyde Loutan Principal, Renewable Energy Integration Hong Zhou Market Development Analyst, Lead Amber Motley Manager,
STAR Report Add-ons. Want more from your STAR Report? Check out our great add-ons:
 STAR Report Add-ons Want more from your STAR Report? Check out our great add-ons: Segmentation (free to add): Details the impact of transient, group and contract guests for your property as well as your
COMPILED BY GLASS S. Auction Report - LCV November 2013
 GLASS S Auction Report - LCV November 2013 Contents Market Commentary Page 3 Whole Market Summary Page 8 Average Sales Price Year on Year Page 9 Sales Price Compared to Number of Entries (all ages) Page
MONTHLY PERFORMANCE DASHBOARD
 AUSTIN ENERGY MARCH 21 MONTHLY PERFORMANCE DASHBOARD A report highlighting key Austin Energy metrics for uary FY 21 FINANCIAL HEALTH Standard and Poor s Bond Rating Current AA AA Budget Based Revenues
NEU Electric and Natural Gas Price Update
 Exelon s $24 Billion Energy Bill Senate Bill 2814 Short-Term Energy Price Outlook On November 15, 2016, Exelon, through its legislative supporters, introduced Senate Bill 2814, a massive 446 page document
January Manufacturing Technology Orders Off After a Strong December
 Contact: Bonnie Gurney, AMT, 703-827-5277 bgurney@amtonline.org For Release: March 9, 2015 January Manufacturing Technology Orders Off After a Strong December January U.S. manufacturing technology orders
Regulated Price Plan (RPP) - Tiered Prices Prices effective May 1, 2011 (per kwh)
 - Tiered Prices Prices effective May 1, 2011 (per kwh)") Page 1 of 5 Electricity Prices Electricity Prices at a Glance OEB's Role in Electricity Prices Regulated Price Plan (RPP) - Tiered Prices Regulated Price Plan - Time-of-use (TOU) Prices for Smart Meters
Page 1 of 5 Electricity Prices Electricity Prices at a Glance OEB's Role in Electricity Prices Regulated Price Plan (RPP) - Tiered Prices Regulated Price Plan - Time-of-use (TOU) Prices for Smart Meters
LOCAL CLIMATOLOGICAL DATA
 ILLINOIS STATE WATER SURVEY DIVISION URBANA, ILLINOIS ISWS MP-21 Archive SWS0964 Illinois State Water Survey LOCAL CLIMATOLOGICAL DATA FDR HILLSBORO, IL. 1901-1962 LOCAL CLIMATOLOGICAL DATA 1901-1962 HILLSBORO
2018 CALENDAR DASHBOARD
 DASHBOARD January Go 2018 February Go 2018 March Go 2018 April Go 2018 Sun Mon Tue Wed Thu Fri Sat Sun Mon Tue Wed Thu Fri Sat Sun Mon Tue Wed Thu Fri Sat Sun Mon Tue Wed Thu Fri Sat 1 2 3 4 5 6 1 2 3
MONTHLY PERFORMANCE DASHBOARD
 AUSTIN ENERGY JULY MONTHLY PERFORMANCE DASHBOARD A report highlighting key Austin Energy metrics for e FY FINANCIAL HEALTH Standard and Poor s Bond Rating Austin Energy Rating AA AA Budget Based Revenues
TECHNICAL SERVICE BULLETIN
 TECHNICAL SERVICE BULLETIN To: Minuteman Dealers and Customers From: Minuteman Technical Support Date: 1/12/2011 Subject: TSB for the KIT # K-FRSPEEDSWT. For the FR17115, FR17220, FR20115 and FR20220 models.
Multiple Listing Service
 For Immediate Release: January 7, 21 CONTACT: Dan Santa Maria MLS President (52) 795-1492 Wes Wiggins Vice President, MLS (52) 382-8792 Cheri Meadows Senior Vice President, TAR (52) 327-4218 For Tucson
Wheat Marketing Situation
 Wheat Marketing Situation Prepared by: Darrell L. Hanavan Executive Director Colorado Wheat Administrative Committee If you would like to receive an email when this report is updated, email gmostek@coloradowheat.org
Effect of DG Installation on Customer Load Shapes
 Effect of DG Installation on Customer Load Shapes P R E S E N T E D T O Westar Energy P R E S E N T E D B Y The Brattle Group J u n e 2 3, 2017 Copyright 2017 The Brattle Group, Inc. Characteristics of
ELECTRIC SERVICE RATE SCHEDULES. Effective November 1, 2017
 ELECTRIC SERVICE RATE SCHEDULES Effective November 1, 2017 SCHEDULE 100 RESIDENTIAL SERVICE Residential Customers for all domestic uses. CHARACTER OF SERVICE: Alternating current, sixty-hertz 120/240 volts
Regulation Update. Operating Committee September 12, PJM 2017
 Regulation Update Operating Committee September 12, 2017 Regulation Market Clearing Price *Data up to Aug 22 2 Mileage Ratio Mileage Ratio has increased since the new signal implementation Larger Utilization
Design Criteria Data
 BURLINGTON VT Latitude = 44.47 N WMO No. 72617 Longitude = 73.15 W Elevation = 341 feet Period of Record = 1973 to 1996 Average Pressure = 29.61 inches Hg Design Criteria Data Mean Coincident (Average)
SUNDAY MONDAY TUESDAY WEDNESDAY THURSDAY FRIDAY SATURDAY
 2018 August 29 30 31 01 02 03 04 05 06 07 08 09 10 11 12 13 14 15 16 17 18 Feast of the Assumption of Mary- Staff Retreat - 19 20 21 22 23 24 25 2yr. Conf. Parent & Teen Orientation at 10:15am & 1:15pm
2014 Meteorological and Oceanographic Summary for the Bocas del Toro Research Station. Prepared by: Steven Paton
 0 2014 Meteorological and Oceanographic Summary for the Bocas del Toro Research Station Prepared by: Steven Paton 1 Introduction This is the second of a series of yearly reports summarising the past year
Design Criteria Data
 RAPID CITY SD Latitude = 44.5 N WMO No. 72662 Longitude =3. W Elevation = 3169 feet Period of Record = 1973 to 1996 Average Pressure = 26.67 inches Hg Design Criteria Data Mean Coincident (Average) Values
D G A G R I D A S H B O A R D : T O M A T O E S Last update: EU AVG PRICES
 tonnes Weightedaverages by volume of production per MS Ongoing adjustments on weights by variety group 000 tonnes D G A G R I D A S H B O A R D : T O M A T O E S Last update: 20.04.2018 EU AVG PRICES MS