MECHANISMS OF SPRAY FORMATION AND COMBUSTION FROM A MULTI-HOLE INJECTOR WITH E85 AND GASOLINE
|
|
|
- Dwayne Beasley
- 6 years ago
- Views:
Transcription
1 MECHANISMS OF SPRAY FORMATION AND COMBUSTION FROM A MULTI-HOLE INJECTOR WITH E85 AND GASOLINE P.G. Aleiferis*, J. Serras-Pereira, Z. van Romunde Department of Mechanical Engineering, University College London, UK J. Caine Ford Motor Company, Dunton, UK M. Wirth Ford Motor Company, Cologne, Germany *Author for Correspondence: Dr. Pavlos Aleiferis University College London Department of Mechanical Engineering Torrington Place, London WC1E 7JE, UK Tel: +44-(0) , Fax: +44-(0) p_aleiferis@meng.ucl.ac.uk Full length article accepted for publication in Combustion and Flame.
2 ABSTRACT The spray formation and combustion characteristics of gasoline and E85 (85% ethanol, 15% gasoline) have been investigated using a multi-hole injector with asymmetric nozzle-hole arrangement. Experiments were carried out in a quiescent optical chamber using high-speed shadowgraphy (9 khz) to characterise the spray sensitivity to both injector temperature and ambient pressure in the range of C and 0.5, 1.0 bar. Spray tip penetrations and umbrella spray cone angles were calculated for all conditions. Phase Doppler anemometry was also used to measure droplet sizes in the core of one of the spray plumes, 25 mm below the injector tip. To study the effect of fuel properties on vaporisation and mixture preparation under realistic operating conditions, a separate set of experiments was carried out in a direct-injection spark-ignition optical engine. The engine was run at 1500 RPM under cold and fully warmed-up conditions (20 C and 90 C) at part load and full load (0.5 and 1.0 bar intake pressure). Floodlit laser Mie-scattering images of the sprays on two orthogonal planes corresponding to the swirl and tumble planes of in-cylinder flow motion were acquired to study the full injection event and post-injection mixing stage. These were used to make comparisons with the static chamber sprays and to quantify the liquid-to-vapour phase evaporation process for both fuels by calculating the projected footprint of the sprays at different conditions. Analysis of the macroscopic structure and turbulent primary break-up properties of the sprays was undertaken in light of jet exit conditions described in terms of non-dimensional numbers. The effects on stoichiometric combustion were investigated by imaging the natural flame chemiluminescence through the engine s piston crown (swirl plane) and by post-processing to derive flame growth rates and trajectories of flame motion.
3 NOMENCLATURE AFR Air-to-Fuel Ratio ASOI After Start of Injection ATDC After Top Dead Centre BDC Bottom Dead Centre CA Crank Angle d Nozzle Diameter DISI Direct Injection Spark Ignition EOI End of Injection L Length MFB Mass Fraction Burned μ Dynamic Viscosity Oh Ohnesorge Number PDA Phase Doppler Anemometry Re Reynolds Number RON Research Octane Number RPM Revolutions Per Minute ρ Density SI Spark Ignition SMD Sauter Mean Diameter (D 3,2 ) SOI Start of Injection Surface Tension TDC Top Dead Centre u Velocity W Width We G Weber Number, Gas Phase We L Weber Number, Liquid Phase
4 INTRODUCTION Background The gasoline Direct-Injection Spark-Ignition (DISI) engine has many well-known practical advantages over the port-fuel injected engine, such as the greater precision in fuel metering and significant potential fuel economy benefits. Other advantages, such as greater charge cooling potential allow higher engine compression ratios to be used, increasing the thermal efficiency. However over the last 10 years it has become clear that the successful implementation of all of these benefits has been more difficult to achieve than previously expected. The main reason has been the inadequate design and performance of the directinjection systems, as well as the engine calibration strategies used, which have not delivered the level of improvements in power, fuel economy and emissions promised by manufacturers. For example, first generation side-injection systems relied on a piston-bowl to achieve the stratified charge concept, but were plagued by pool fires on the piston as the fuel failed to evaporate fully in the time available before ignition, thus producing unacceptable levels of particulate emissions and unburned hydrocarbons [1]. Latest design spray-guided multi-hole injectors located in close spacing arrangement with the spark plug aim to resolve these issues by providing accurate spray directionality as a result of the number of nozzle holes which can be designed to target the fuel delivery where necessary and by full flexibility of when and how fuel is injected into the cylinder i.e. independence over piston position and use of multiple split fuel injection strategies [2 4]. The majority of work published to date on multi-hole injectors concerns Diesel nozzle geometries, with particular experimental features and analysis targeted at this combustion system. The sensitivities to geometrical differences of the injector nozzles and piston design, the varied operating conditions for the DISI combustion system and its particular mixture preparation requirements merit specific attention and are the motives behind continued research in this field. Because of the ability of multi-hole injectors to target fuel directly to the spark-plug for stratified operation and to different areas around the cylinder for robust mixture formation under early injection homogeneous mode, it is important to understand whether strict design criteria are maintained when fluids other than those used to test the injectors at design and optimisation stage are employed in real engines. These requirements are further emphasised by the trend towards using sustainable renewable fuels such as ethanol in increasing proportions with gasoline. One of the drawbacks of ethanol as an automotive fuel is its lower energy density compared to gasoline and lower stoichiometric Air/Fuel Ratio (AFR) which increases the fuel mass that must be injected per cycle to achieve the same fuel equivalence ratio (typical AFR at stoichiometry for gasoline is 14.7, for pure ethanol 9.0). To deal with these issues, either the flow rate of injectors has to be increased, which may reduce the accurate fuel metering capabilities required for split injection strategies and stratified operation, or standard injectors are typically used and the fuel is injected over a longer period of time during the cycle, increasing the probability of wall-wetting and reducing the effective time available for mixing and evaporation before ignition. There is also a limited understanding about the role that liquid transport properties such as surface tension ( ), viscosity ( ), density ( ), boiling point and vapour pressure (p v ) have
5 on overall spray development, and how these are affected by the wide operating envelope of DISI engine injectors; e.g. DISI injectors must inject fuel into ambient pressures from ~0.2 bar to ~5 bar or more and with liquid temperatures of -10 C or lower, to over 150 C at the injector tip under high-load firing conditions. Present Contribution The current study presents macroscopic imaging of spray structure and quantification of spray properties, including spray tip penetration, cone angles and droplet sizes from tests carried out in a static pressure chamber with a multi-hole injector and two multi-components fuels, namely standard commercial grade gasoline (RON 95) and a commercial grade of E85 (85% ethanol mixture with 15% gasoline) at bar gas pressure and C injector temperature conditions. Spray images are also presented for the same injector and fuel types in a single-cylinder optical engine under motoring condition with injection in the intake stroke to promote homogeneous mixture formation under 0.5 bar and 1.0 bar intake pressure with 20 and 90 C engine coolant temperature. The evaporation history of the two fuels was also tracked by monitoring the scattering intensity during and after the injection period. Finally combustion data, such as incylinder pressure history and Mass Fraction Burned (MFB), as well as flame-kernel radius growth and motion from image processing, are presented for the same engine operating conditions in order to compare the high-ethanol content fuel with gasoline. A set of experiments is also presented with iso-octane, a singlecomponent fuel with known properties typically used in engine testing, spray experiments and modelling. The work is believed to contribute significantly towards a comprehensive database of spray development data which are essential for developing our knowledge of the underlying mechanisms responsible for atomisation under realistic engine conditions. Such a database will also assist spray modellers because accurate simulation of spray break-up mechanisms from first principles is very challenging. The discussion also makes an attempt to review fundamental theories and non-dimensional numbers from established background literature and to link these to practical combustion systems with different fuels. To the best of our knowledge, currently there is no other major optical study in the literature presenting and discussing spray formation and combustion phenomena with E85 and gasoline from a multi-hole injector both in a quiescent injection environment and in a firing engine under a range of operating conditions. EXPERIMENTAL APPARATUS AND PROCEDURES Fuels Standard commercial grade gasoline (RON95) and a commercial grade of E85 (85% ethanol mixture with 15% gasoline) were used for the present study. Table 1 shows a number of selected properties which are relevant to the analysis of spray formation, evaporation and combustion of the fuels used; they are given for 1.0 bar ambient pressure. The properties of E85 were obtained from the fuel supplier specification sheet, except for the latent heat of vaporization which was estimated on the basis of values for pure ethanol (0.925 MJ/kg) and those of gasoline (0.360 MJ/kg). Figure 1 shows typical distillation curves of gasoline and E85 at 1.0 bar pressure. The distillation curve of ethanol is also shown in Figure 1 by a vertical line on the assumption of 100% purity and, thus, a fixed boiling temperature is indicated. It needs to be noted here that
6 although the E85 data in Figure 1 correspond to the exact fuel used in the current study, the gasoline curve does not correspond to the exact gasoline type used in this study but it has been reproduced from a previous publication to aid visual interpretation of data in Table 1 [5]. A standard commercial grade European gasoline contains several hydrocarbons, typically ~35 40% C5 or lower, similar levels of C6 C8 and the remainder C9 C10 hydrocarbon chains. On the basis of these fractions, it was also decided to select specific single components to aid the discussion and provide some interpretation of the results to be presented in later sections. From typical gas-chromatography analysis data, the reference single-component fuels were chosen to be n-pentane, iso-octane, and o-xylene, as also shown in Figure 1. The first one, n-pentane, is a typical low boiling point component found in gasoline, with boiling temperature 36.1 C. The second one, iso-octane, is a mid-range boiling point component with boiling temperature 99 C and finally o-xylene is a heavier gasoline component with boiling temperature 144 C. These together with similar components like isopentane, n-octane, heptanes, p-xylene, etc. account for over 95% of the constituents by volume. A small set of spray imaging data was also acquired with pure iso-octane (typical single-component fuel used in engine research) to be studied as a benchmark set against the data acquired with the two multi-component fuels. Injector Geometry The multi-hole injector produced six spray plumes or jets in a ¾ moon pattern as shown in the schematic illustration of Figure 2. The injector has been designed for vertical installation in the engine and in close spacing arrangement with the spark plug. The six nozzle holes have different angles to direct fuel to different areas of the combustion chamber. It can be seen that there is one line of symmetry in the spray pattern in the axis perpendicular to the engine crossflow axis, i.e. intake to exhaust side, with plumes 1 and 6 directing the fuel towards the spark plug, as shown in Figure 2(a). Two nominally identical injectors of this type were used for the purposes of the present study; one for experiments in a quiescent optical chamber and the other one for motoring and firing tests in an optical engine. In both rigs the injector was operated with 150 bar fuel pressure and the fuel was provided by a pneumatic piston ram pump which avoided pressure fluctuations in the fuel rail. The injector used in the engine was also checked in the quiescent chamber to ensure consistent operation. Quiescent Chamber A pressure chamber was used to de-couple the effects of engine intake flow on spray break-up. The octagonal shape of the chamber allowed simultaneous multi-technique characterisation, in this case imaging and off-axis Phase Doppler Anemometry (PDA). More details about the chamber can be found in [6]. Imaging The injector was mounted at 19 to the vertical in order to optimise the imaging arrangement (in contrast to the vertical engine mounting shown earlier). Figure 2(b) shows a schematic of this arrangement with the two imaging views adopted. The spray was recorded at a frame rate of 9,000 frames per second, equivalent to one spray image at each Crank Angle degree ( CA) for an engine running at 1500 RPM. The camera allowed a maximum spatial resolution of pixels at this frame rate (160 m/pixel). The shutter was set to 1 μs.
7 Illumination was achieved with backlighting using a Multiblitz Variolite 500 photographic flash-lamp diffused through a semi opaque Perspex sheet. As a result, each imaged jet was the superposition of two liquid jets for the side view, and three for the end view, as shown in Figure 2(b). The image was a shadowgraph of the spray, therefore only the liquid phase was visualised with this technique. 100 injection events and an average background image were captured. The background image for each time interval in the imaging sequence was removed from the spray images to account for differences in lighting over each run. Each corrected image was then thresholded at a value based on the mean of background pixels to leave a binary image. The image was then rotated to align each plume pair with the vertical axis and each plume pair was scanned to find the plume tip. The distance from the plume tip to the nozzle was scaled to calculate a plume pair length. To determine the optimum threshold for automated processing, detailed sensitivity analysis was carried out on the penetration based on different threshold levels and the uncertainty in the calculated values was found to be better than 4%. A similar methodology was used to calculate overall spray umbrella cone angles. Droplet Sizing Droplet sizing of the spray was carried out using a TSI Phase Doppler Anemometry system consisting of a Coherent Innova 70C Argon-Ion laser (5 W) coupled to a TSI beam splitter and Bragg cell. Both the transmitter and receiver had an optical focal length of 250 mm. The forward scattering angle was set to 40. Droplet measurements were recorded 25 mm downstream from the injector tip, along the chamber s central axis. Measurements were taken in the centre of plume 2, which was the central plume nearest the camera as the spray was seen from the side view in Figure 2(b). Droplet size measurements were taken over 200 injections for all conditions. The total number of samples collected for each injection event was of the order of 25 samples per millisecond for each of the measured injections, resulting in more than 7500 valid droplet size and velocity measurements over the duration of the injection event for each test condition. The effect of temperature dependence of the refractive index of the fuels was also considered on the basis of previously published work in this area, e.g. [7, 8]. Test Conditions To mimic the conditions of the injector body when mounted in an engine, the injector body mounting was heated to temperatures of 20, 50, 80, 100 and 120 C and its temperature was monitored by a thermocouple embedded into the housing of the injector. A settling time of at least 30 min and an injection frequency of less than 1 Hz was used to allow the fuel inside the injector to reach similar temperatures to that of the surrounding injector body. Therefore, in this paper, the term fuel temperature corresponds to the temperature reading of this thermocouple, i.e., the temperature of the injector as close to the injector tip as possible, not the temperature of the fuel itself [5, 6]. In-cylinder engine gas pressures at time of injection were replicated by inducing a vacuum (0.5 bar absolute for early injection strategies at part-load homogeneous charge operation). Tests were also carried out at atmospheric pressure (nominally 1.0 bar). Previous tests have shown little deviation in the global spray form
8 for different multi-hole injectors at elevated gas pressures [5, 9], except the expected decrease in plume tip penetration due to increased drag, therefore, the tests presented here were carried out at ambient and reduced gas pressures, where the greatest differences in spray development were observed. Injection timing and duration was held constant at 1.5 ms pulse-width for all conditions, with the camera recording for 2.5 ms each injection to capture initial, steady-state, end of injection and post injection spray characteristics. Due to obscuration of the spray tips by the pressure chamber windows, it was only possible to measure spray tip penetrations until approximately 1.0 ms After the Start Of Injection (ASOI, i.e. the time period following the rising edge of the trigger pulse sent to the injector driver unit). The average driver delay from the start of the injection pulse (Start of Injection, SOI) to fuel seen at the injector tip was of the order 300 s, as has been quantified in detail for a similar system in [5]. Single-Cylinder Optical Engine Engine Installation A single-cylinder optical engine was used to investigate the spray behaviour under realistic operating conditions. The flexible optical access allowed imaging through a piston crown window (swirl plane) and through a full-stroke quartz liner (tumble plane). Table 2 summarises details of the engine set-up; valve timings are given with respect to intake Top Dead Centre (TDC) as CA After TDC (ATDC). More details about the engine can be found in [3, 4]. The engine was motored at part load or full load (0.5 bar or 1.0 intake pressure, respectively) and fired at part load continuously, i.e. with no skip-firing. A piezo-resistive absolute pressure transducer was installed in the inlet plenum to set the engine load by adjusting the throttle. An AFR meter was used in the exhaust to measure oxygen content and set the correct fuelling. The engine was run with stoichiometric AFR for all the tests presented in this paper. 100 consecutive cycles of incylinder pressure data were acquired after the engine was fired and had been allowed to stabilise for s. The influence of fuel temperature was observed by using engine head coolant temperature of 20 C and 90 C. It should be noted that the engine coolant temperature is not an exact measure of fuel temperature but is relevant for practical comparisons of real-world engine operating conditions and for direct comparison with the injector heating arrangement in the quiescent chamber. Enough heat-soak time (30 40 min) was allowed at 90 C so that the engine head components acquired enough thermal inertia to simulate fully warmed-up conditions. Synchronization of various control triggers for ignition, injection and camera/laser systems was achieved using an AVL engine timing unit and an optical encoder with 1800 pulses per revolution on the crankshaft. The in-cylinder pressure was also logged; then processing was carried out to calculate combustion statistics for each cycle using LABVIEW and MATLAB based software. Injection Strategies The injection timing was set for homogeneous mixture preparation mode, i.e. early in the intake stroke, with Start of Injection (SOI) set to 80 CA ATDC. This was done after initial tests and on the basis of recent results from injection sweeps and wall wetting studies in the same engine with a similar injection system [3, 4]. The different injection pulse-widths needed for the two fuels, with E85 requiring a longer pulse length
9 due to its lower AFR ratio at stoichiometry (14.7 for gasoline, 9.0 for pure ethanol), also meant that in order to compare the evaporation histories of the two fuels, tests were first carried out under motoring conditions with 0.5 bar intake pressure using the same injection pulse widths (0.8 ms). By monitoring the scattering intensity in the images after the end of injection it was possible to gain information about the evaporation process. The effects of realistic pulse widths on liquid wall-wetting and evaporation at the same load were also investigated (1.25 ms for gasoline, 1.6 ms for E85) and spray areas were calculated to confirm whether evaporation rates changed due to potential vapour saturation effects. Image Acquisition Spray imaging was performed on two orthogonal planes in the engine. A vertical plane, termed tumble plane in Figure 2(a), captured the spray as it penetrated the cylinder, allowing comparisons to be made with the chamber s end view spray development in Figure 2(b). A horizontal plane, termed swirl plane in Figure 2(a), imaged the projected footprint of all the spray plumes and flame images, viewed through the piston crown. Flood lighting illumination with a high-repetition rate Nd:YLF laser was achieved using a series of divergent lenses. The same high-speed camera used in the pressure chamber was also employed for the engine study at a frame rate of 9 khz (swirl plane) and 5 khz (tumble plane), corresponding to 1 CA and 1.8 CA between frames at 1500 RPM. This was possible with an image resolution of pixels and pixels, respectively. The lower temporal resolution in the tumble plane was necessary to increase the spatial resolution in order to capture the full spray development and post-injection mixing stage from injection timing to close to Bottom Dead Centre (BDC). At this resolution the on-board camera memory allowed just over 100 cycles to be imaged consecutively before data-download to the hard disk was necessary. Flame images were acquired at a frame rate of 9 khz in the swirl plane, i.e. at 1º CA separation between frames at 1500 RPM. The combustion process was visualised by imaging the natural light flame chemiluminescence on a cycle-by-cycle basis for 100 consecutive cycles. Simultaneous acquisition of incylinder pressure data allowed mass fraction data to be directly compared to the imaging data on a cycle-bycycle basis in order to extract information about specific flame growth characteristics, like the evolution of an equivalent flame radius and the flame s centroid trajectory. RESULTS AND DISCUSSION Spray Development in Quiescent Environment Figure 3 shows a direct comparison between the spray development of gasoline and E85 at conditions of 1.0 bar and 20 C, as imaged from the side and end views from first fuel seen out of the injector at 333 μs ASOI up to the end of injection at 1888 μs ASOI. Figures 4 and 5 illustrate spray images of gasoline and E85, respectively, at fixed exposure timing, namely 777 μs ASOI, for pressures 0.5 bar and 1.0 bar, with the injector temperature increasing gradually from 20 C to 120 C. The sprays are shown for both side and end views of imaging. Iso-octane was only imaged through the side view as it did not form an integral part of the
10 work, but was included as a model single-component fuel with fixed boiling point (99 C at 1.0 bar) for comparison with the multi-components fuels (Figure 6). Although difficult to present in the hardcopy format of Figure 3, the analysis of high-speed video imaging revealed significant transient characteristics in the injection process. Over an injection duration of 1.5 ms (corresponding to 13.5 CA at 1500 RPM), the injection event could be described by two or three different stages. First, spray plume formation straight out of the nozzle when the flow field is still forming inside the nozzle and gradually stabilises (see first 3 rows of images in Figure 3, i.e s ASOI). Second, a pseudo steady-state stage, where the spray is stable with defined cone angles, but noticeable periodicity within the inner core spray (typically s ASOI). In the final stage the spray undergoes significant distortion starting from the near-nozzle region, setting up large scale oscillations which put the spray into crossflow ( s ASOI). The effects can be seen in the images (e.g. at 1222 s ASOI) as curved plumes close to the nozzle and areas of darker spray which may indicate either regions of droplet clustering or ligaments. The effect was repeatable from shot-to-shot and was seen with both E85 and gasoline at all operating conditions. Effects of Fuel Properties and Conditions Observation of the injection process in Figure 3 further revealed that under certain conditions most noticeable at 20 C fuel temperature and 1.0 bar or 0.5 bar gas pressure there were some fundamental differences in the way E85 and gasoline sprays disintegrated outside the nozzle. The macroscopic characteristics were clearer from the end view which allowed the six individual plumes to be seen (in contrast to the side view which shows three plume pairs). The first frame where fuel was imaged showed that the gasoline spray was substantially more developed than the E85 spray, with nearly twice its penetration (as quantified in the penetration graphs shown later). Despite this, two frames later the penetrations of both fuels are very similar and at 555 µs ASOI in the end view (or after 777 µs ASOI in the side view), the penetration of E85 has overtaken that of gasoline. At higher fuel temperatures this trend nearly disappears (Figure 4 and 5); the same effect was seen in the spray images from the optical engine as will be discussed in the relevant section later. This clear trend has also been noticed in other recent measurements by some of the current authors using pure alcohol fuels (ethanol and butanol) with a similar injector of different nozzle-hole geometry [10]. Interestingly, analysis of spray images under similar operating conditions from a different study [11] with E85 and an 8-hole injector appear to show similar trends of smaller early penetration for E85 compared to indolene, although this detail was not mentioned by the authors of that study. The finding therefore appears to suggest that this is certainly not a hardware-related issue but one that originates from differences in the liquid transport properties of alcohol fuels compared to the hydrocarbons typically found in gasoline. For example, E85 has a viscosity close to that of pure ethanol, which at 20 C is more than double, on average, when compared to the main gasoline hydrocarbon components such as pentanes, octanes and xylenes (fuel properties from Yaws, 2003); the viscosity decreases rapidly with increasing temperature however, and at C the difference is only ~40% higher for pure ethanol. The much lower absolute values of viscosity at high temperatures are predicted to reduce the impact of this fluid property on initial
11 spray development and the sprays can be seen to behave more similarly straight out of the nozzle than at 20 C. Such strong trends support hypotheses involving fluid properties in explaining this subtle, yet consistent, difference in the initial stage of spray formation immediately after needle lift. For all fuels, the spray geometry is clearly affected by changes in fuel temperature, especially at the low gas pressure of 0.5 bar. The effect of high temperature is seen to change the spray pattern from clearly identifiable and directed spray plume pairs (side view) to a gradual merging of the three plume pairs at the highest injector temperature, eventually producing a single plume along the injector axis as the outer plumes are drawn together. This is the typical collapsed spray form which occurs due to flash-boiling ; as the fuel exits the nozzle it is rapidly depressurised to a pressure sufficiently below its saturated vapour pressure and the vapour generated is drawn towards the central low pressure regions, overcoming the radial momentum of the injected droplets. However, it is clear that pure flashing does not occur and other mechanisms are involved with respect to transient heat and mass transfer phenomena. Results also showed that with iso-octane there was no such collapse at these conditions and the three plume pairs remain clearly defined even at 120 C. As the ambient pressure was increased from 0.5 bar to 1.0 bar, this effect gradually disappeared due to the increase in the liquid fuel boiling point and the spray plumes regained their original directionality. The geometry of the E85 sprays was clearly less sensitive to temperature than gasoline; although E85 was more sensitive than iso-octane. These characteristics were particularly noticeable in the range C and for the end view which shows the six individual spray plumes (see Figures 3, 4 and 5). It is clear that at 20 C the plumes for E85 were noticeably thinner and more defined than those of gasoline and it can be said that the break-up efficiency was clearly much better for gasoline at these low temperatures; it is expected that an intact core would be longer for E85 because evidence of large scale plume distortion was more difficult to find than for gasoline. These differences were maintained as the liquid temperature was increased to 50 C; at 80 C however, the E85 spray plumes lost some of their previous definition and penetrated less with the overall spray appearance resembling that of gasoline. At this temperature and 1.0 bar, the E85 spray resembles gasoline at 20 C at 0.5 bar or to some extent 50 C at 1.0 bar, exhibiting better spray break-up and presumably smaller liquid core lengths (this can be seen from the absence of a dark spine ). This 80 C is a critical temperature for E85 because of its distillation characteristics which tend towards a near-single boiling point around 78 C; see Figure 1. It is also particularly clear from the spray development images in Figure 3 that E85 sprays are pointy from the outset and that they retain this feature for the full duration of the injection event. The differences in spray shape between different fuels and conditions were quantified from the calculation of the umbrella spray cone angle, i.e. the overall external cone angle as measured between 2 and 22 mm from the injector tip. This demonstrates the extent of convergence of all spray plumes, as shown in Figures 7 and 8. At 1.0 bar gas pressure the cone angle initially increases with temperature due to better atomisation which swells the spray plumes. For gasoline the effect of collapse can be seen from 100 C onwards in contrast to
12 E85 where this characteristic is seen only from 120 C fuel temperature. At 0.5 bar gas pressure the same trend is seen but the decrease in cone angle happens even earlier, at 80 C for gasoline and between 100 C and 120 C for E85. The single component iso-octane shows a more consistent transitional behaviour at both 0.5 bar and 1.0 bar gas pressures as the boiling temperature is approached. Break-up Regimes and Non-Dimensional Numbers The atomisation process can be described by the liquid Weber number We L = L u 2 d/, the Reynolds number Re= L ud/ L and the Ohnesorge number Oh=We 0.5 L /Re which incorporates all the main fluid properties. Calculation of the Weber and Ohnesorge numbers for a multi-component fuel is not trivial, particularly at varied temperature/pressure conditions necessary for constructive analysis. Therefore, it was decided to select specific single components to aid the discussion and provide some interpretation of the results. The reference single-component fuels were chosen to be n-pentane, iso-octane and o-xylene (Figure 1). Additionally, pure ethanol was considered for comparison. The non-dimensional parameters were calculated for these single components using a nozzle diameter of 0.3 mm and a nominal jet velocity through the nozzle of 60 m/s estimated from the images. All fuel property data were obtained from [12]. Analysis of the nondimensional numbers for ethanol and the equivalent light, medium and heavy gasoline fractions revealed that there were differences in the parameter space that could explain the different behaviour of E85. Figures 9 and 10 present the calculated Re and We L numbers, respectively, for the single components selected and for temperatures from 280 K (i.e. 7 C) up to 458 K (i.e. 185 C). The Ohnesorge [13] diagram is shown in Figure 11 for the same components, with the Reitz and Bracco [14] break-up regimes superimposed. At 20 C (293 K) ethanol had Oh ~ , but gasoline s components (iso-octane, n-pentane and o-xylene) had Oh numbers lower than about half that of ethanol. At higher temperatures, Oh converged to similar values for all fuels, typically ~ at 120 C (393 K). Together, these figures confirmed that with the fuels and experimental conditions used in this study, the jet break-up regime is generally in the atomisation regime. The values calculated for the coldest temperature (7 C, 280 K) though are close to the boundaries of the second wind induced regime for most fuels. For ethanol, in particular, at cold conditions, the calculated values have crossed into the second wind induced regime and this is quite interesting in its own right considering the implications for engine cold-start conditions. In Figure 10, the Weber numbers for ethanol were found to be We L =35,000 at 20 C and We L =50,000 at 80 C, compared to iso-octane s We L ~40,000 and We L ~55,000 at the respective temperatures. However, all the values fell within the same atomisation regime, typically defined as We L >30,000 by Sallam et al. [15]. Transition criteria based on Re or We L numbers are not easy to find in the literature for similar jet and operating conditions, particularly with real fuels. Some experiments with similar magnitudes of Re and We L to those of the current study were performed by Suh and Lee [16] on two-dimensional nozzles with length to width ratios (L/W) of 1.8 and 2.7 using Diesel fuel but critically under turbulent to cavitating transition conditions. In the current study from the external dimensions of the injector and other studies using similar hardware, e.g. [17, 18], L/W was estimated to be in the range Transition criteria were established in
13 [16] for turbulent to cavitating conditions defined by Re>17,000 19,000 and We L >35,000 39,000 and this is the only such study that was found where transitions from turbulent to cavitating flows were a) imaged, b) comparable in macroscopic appearance to those in the current study and c) matched Re and We L in regions where the current authors are also reporting clear macroscopic differences in the break-up mechanism, albeit between two fuels at exact initial states. The results suggest that it may be possible to relate the thin/compact spray features observed for E85 at 20 C to the lower Re of E85 relative to gasoline s components at 20 C. This is predicted to fall below the Re~19,000 transition point for cavitation reported in [16]. Indeed, ethanol at 20 C has a Re~13,000, compared to Re~25,000 for iso-octane in Figure 9, placing iso-octane clearly in the cavitating regime, based on Re. A similar trend was seen for We L (Figure 10). The importance of aerodynamic effects on primary break-up has been a topic of debate. Whereas initial work by Miesse [19] implied that the gas phase Weber number We G = G u 2 d/ could be used as a criterion for delimiting the second wind-induced to atomisation regimes (We G >40), the consensus at this time is that they are not the dominant mechanism in primary atomisation, e.g. see [20]. Aerodynamic interactions can contribute to the droplet formation at the liquid interface (via droplet pinching resulting from high energy small eddies) and droplet transport away from the interface (via large-scale recirculating vortices), particularly for ρ L /ρ G < 500 [21], i.e. typically applicable to gas pressures in excess of 1.5 bar for most fuels. The values of We G at 0.5 bar for C are in the range for ethanol and for gasoline s medium fraction, iso-octane, whilst at 1.0 bar We G is in the range for ethanol and for isooctane. Using the definition of Faeth et al. [22] for the secondary droplet break-up regimes which were calculated on the basis of We G, transitions in the relevant regions occur at We G =13 (bag break-up), We G =35 (multimode break-up) and We G =80 (shear break-up). The differences in We G between the fuels at 0.5 and 1.0 bar are perhaps manifested by the observed differences in the spray images when considering the limits of We G =35 and We G =80. Spray Penetration and Break-up Length For quantitative comparison between fuels and conditions, the spray-tip penetration was measured from acquired images by automated image processing. The results are shown in Figures for all the test fuels at each of the temperature conditions for 0.5 and 1.0 bar gas pressure. The plume tip penetration is presented for the left plume pair (plumes 1, 6) due to the differing absolute lengths of the plume pairs. However, all plume pairs illustrated the same penetration trends in relation to the conditions. For gasoline at 1.0 bar in Figure 13, i.e. representative of high-load conditions (wide-open throttle), a reduction in spray tip penetration was observed with increased temperature. The effect of temperature on spray tip penetration was much smaller at 0.5 bar ambient pressure (Figure 12) showing a lower penetration range between 20 C and 120 C than at 1.0 bar gas pressure. Spray plume penetrations were larger at high temperatures and low gas pressures (condition of spray collapse) due to the contraction of the spray plumes in the axis of the injector, which increased the spray downward momentum relative to the non-collapsed condition. For E85 at 1.0 bar gas pressure (Figure 15), the range of penetration was similar to gasoline for
14 both gas pressures; spray-tip penetrations however were larger in magnitude for E85, although at 0.5 bar and 120 C they were very similar as a result of both sprays experiencing comparable levels of spray collapse (Figure 14). There was also a more gradual distribution in penetration values for E85 with respect to temperature than for gasoline, probably as a result of its bias towards a single chemical component (ethanol) thereby exhibiting a more gradual response to fuel temperature as it approached its boiling point. Figures 16 and 17 show the spray-tip penetration calculated for iso-octane. From these, it can be immediately observed that the difference between the extremes of the presented curves is much narrower than for gasoline and E85. No major attempt was made to calculate break-up lengths from the images of the current study. One of the reasons is that a recent study with a laser induced fluorescence technique that illuminated the liquid jet core through the jet nozzle showed that the liquid core lengths were significantly shorter than any surface length imaged by shadowgraphs or Mie-scattering, typically by 30% or more [23]. Nevertheless, an effort was made to link correlations from the literature to observations of the current study. The idea of an intact liquid core for engine sprays was initially applied in [24] to characterise the inner structure of Diesel sprays; most subsequent work on engine combustion systems also focused on Diesel injectors. Although some reports have tried to relate features of the spray penetration curves to break-up lengths, usually by analysing the change in gradient seen when aerodynamic drag begins to affect the penetration velocity significantly [25], no major reports with empirical correlations were found that could be applied to DISI systems, especially obtained with fuel as the working fluid instead of water. However, Sallam et al. [15] has shown that for turbulent flow at the jet exit for water and ethanol with properties of turbulent primary break-up as discussed above, the non-dimensional break up length L c /d first increased with We L and then became independent of We L at large values at conditions specifically governed by liquid-gas density ratio L / G as follows: L c C b 1 2 d (1) where C b is an empirical parameter that describes the nozzle flow conditions and other effects. In the literature C b takes values typically in the range [26]. In particular, Sallam et al. [15] identified a value of C b =11.0 for shear-type break-up of a liquid-ethanol jet in stagnant air, as derived from a best-fit correlation and showed break-up lengths of L c /d in the range for the We L values of interest in the present study. This results in break-up lengths of ~75 90 mm for the present study which are clearly not realistic. Most probably this is due to the presence of cavitation in the nozzle under study, as estimated from experiments with a similar injector in [5, 17, 18]. For pure substances with known fluid properties, the static pressure relative to the vapour pressure within the nozzle hole will define the inception of cavitation. However, for multi-component fuels, the combination of different chemical components and vapour pressures requires another measure to be used which accounts for this complexity, the bubble point pressure. The bubble point is indicative of conditions under which lower boiling components i.e. those with high vapour pressures, begin to evaporate or bubble within a multi-component liquid, thus inducing cavitation. At 20 C gasoline has a typical bubble pressure of ~0.3 bar [6]. This is much larger compared to ethanol s or iso-octane s vapour pressure of ~0.1 bar at the same temperature. At 90 C the difference between gasoline s bubble point and ethanol s vapour pressure is lower (percentage-wise) than at 20 C, L G
15 namely 2.4 bar bubble pressure for gasoline and 2.0 bar vapour pressure for ethanol, whilst iso-octane s vapour pressure is 0.8 bar. These trends are also reflected in the observed spray images (see side views) where E85 behaves much more like gasoline at high temperatures but it is closer to iso-octane at low temperatures (Figures 4 6). Droplet Sizes In order to investigate further the link between the spray development and atomisation, droplet sizing was carried out in the chamber for a range of gas pressures and injector temperatures. Figures 18 and 19 show the Sauter Mean Diameter (SMD, D 3,2 ) measured 25 mm below the injector tip for plume 2 using gasoline and E85. Droplet sizes were found to decrease with both a reduction in gas pressure (for a given injector temperature) and an increase in injector temperature (for a given gas pressure), ranging from ~22 to 8 μm for gasoline and ~27 to 10 μm for E85. E85 always showed larger droplets than gasoline by ~25 30% with the highest differences found at low temperatures. This may well be due to a smaller degree of cavitation from ethanol s lower vapour pressure, as well as from the higher surface tension and viscosity of ethanol. A different mechanism involved may stem from E85 s higher latent heat of vaporisation, cooling locally the gas temperature and reducing the droplet evaporation rates. At higher temperatures, particularly with high levels of superheat for both fuels, the differences became smaller, namely ~15 25% higher droplet sizes were measured for E85. Analysis of We G indicated that secondary atomisation of E85 fell into a different droplet break-up regime compared to gasoline which predicts larger droplet size distributions. The higher surface tension of ethanol at 20 C appears to explain why the differences existed mainly at cold conditions since at 90 C the surface tensions of E85 and gasoline are comparable. In the range C, droplets were larger at 1.0 bar by ~10% than at 0.5 bar for both fuels. At 20 C, however, the droplets were measured to be smaller at 1.0 bar than at 0.5 bar and this may be associated with the particular nature of the spray development and break-up, e.g. very dense spray and presence of large non-spherical ligaments, thus only the smaller spherical droplets were picked up and validated by the instrument. The values of droplet sizes measured in the current work are comparable to values that have been recently reported from different multi-hole injectors at similar operating conditions by other authors. In particular, Marriott et al. [11] reported droplet sizes with gasoline and E85 in the range m using an 8-hole injector with injection pressures 110 bar and 200 bar, fuel temperatures 20 C and 90 C, as well as gas pressures 0.6 to 2.25 bar. They too found larger droplet sizes for E85. Mitroglou et al. [9] measured values for iso-octane in the range m during the injection event with 120 and 200 bar injection pressure at 1.0 bar backpressure and ambient temperature; higher values of ~40 m and 25 m were measured at the start and end of injection phases though. They also predicted that their injector was cavitating and suggested that these phenomena were mostly responsible for the disintegration of the liquid jet. It should be added that the values reported in the current study are averages over the full injection event and therefore include any transient effects occurring inside the nozzle during this period which affect the spray formation and break-up process. Thus it is encouraging that values were found to be so low on average. On the other hand the combined effect with flash-boiling at 100 C was shown to result in nearly a 30 40% reduction in the SMD,
16 with gasoline experiencing the largest droplet size reduction as a result of the low boiling point fractions such as pentanes. These effects will be elaborated further in the next section when spray areas are quantified in the engine over the injection and post injection period. For completeness, it may be pointed out here that there are some limited empirical correlations in the literature for droplet sizes from multi-hole injectors, incorporating Re and We L numbers. Laser diffraction droplet sizing on Diesel spays by Hiroyasu and co-workers [27, 28] gives the following relation for the SMD, based on experiments with 900 bar injection pressure and 30 bar gas pressure: SMD 0. 38Re d We L Values of droplets calculated from this relation for all fuel components and conditions of the current study have shown that these follow the correct trend with temperature and pressure, as well as with fuel type (predicting slightly larger ethanol droplets), but the absolute values are ~50% smaller than those measured in the current study. This means that the correlation perhaps can be applied to DISI mixture formation studies, but certain tuning of the constants would be necessary. L G L G (3) In-Cylinder Effects on Spray Formation and Break-up The engine sprays were initially imaged under static engine conditions to confirm the findings found in the quiescent chamber. Then two injection durations were used under motoring conditions. The smallest (0.8 ms) was employed to keep engine surfaces relatively dry and improve image quality for continuous testing, as well as to allow comparison between the fuels at nominally identical conditions. The second duration was the correct one for stoichiometric firing at 1500 RPM, namely 1.25 ms for gasoline and 1.6 ms for E85 at part load (0.5 bar intake pressure), 2.5 ms for gasoline and 3.5 ms for E85 at full load (1.0 bar intake pressure). Intake Pressure and Fuel Temperature Effects Figure 20 shows spray development images on the tumble plane at part load, whilst Figure 21 presents spray development images on the swirl plane at the same condition. On the tumble plane, clear interactions between the spray and the in-cylinder flow can be observed. Spray motion is also affected by direct interactions with cylinder/piston walls as the sprays penetrate into the combustion chamber, pushing the spray towards the centre of the cylinder and establishing recirculation zones or vortices close to the piston surface. Spray-valve interactions are also clear as a result of the particular valve-timing used on this engine and act to concentrate some of the spray momentum in a downward direction i.e. towards the piston crown. The overall effect of in-cylinder flow on spray development and mixing in Figure 20 can be compared directly to the static sprays shown earlier. It is clear from the outset that the spray plumes cannot be picked individually due to strong interactions with the intake flow. These interactions lead to enhanced spray breakup and dispersion compared to the static condition. The flow also improves evaporation and entrains the spray within the flow thus keeping it away from direct impingement onto cylinder surfaces. Full-load operation (1.0 bar intake pressure) resulted in shorter penetration, different levels of impingement on the piston crown and improved spray break-up due to stronger in-cylinder flow. At high engine temperature (90
17 C) the gasoline spray is seen to collapse, as also observed in the pressure chamber. There is a partial loss of directionality for all plumes, which are drawn together resulting in a vertical spray momentum chasing the downward moving piston. However, the differences between the spray collapse of E85 and gasoline on the tumble plane are small and less obvious than those in the quiescent chamber for equivalent views. The E85 spray on the swirl plane was observed to collapse to a lesser extent than gasoline. This is visible immediately in the first frame in Figure 21, when fuel is first seen exiting the nozzle and the gasoline plumes are already expanded significantly, in contrast to E85, where the individual plumes are still clearly identifiable. Following this period, the footprint of the spray at the end of injection seems less concentrated below the injector for E85 than for gasoline; the results are thus consistent with observations from the pressure chamber. For 90 C, as in the tumble views, post-injection evaporation was improved, as observed by quickly reducing light scattering in the spray movies. The spray/valve interactions for the current injection timing and valve phasing resulted in large droplets/ligaments seen shredding off the left intake valve after the end of injection. Tests with the actual stoichiometric firing pulse widths showed that the longer duration necessary for E85 resulted in significantly increased interactions with the intake valves, which had the effect of pushing fuel up the intake manifold as the spray jet ski ramped off the back of the valves. This effect was again reduced at high engine coolant temperatures as the spray plumes collapsed towards the centre of the combustion chamber therefore avoiding the intake valve to some extent. These interactions resulted in a clear bias of the initial liquid fuel distribution towards the exhaust side of the combustion chamber which should be kept in mind when analysing the flame images in later sections. Spray Area Quantification In order to compare the evaporation process of gasoline and E85 in the engine, spray areas were calculated from the swirl plane images and averaged for 100 cycles, to quantify the projected spray footprint and demonstrate the temporal behaviour of liquid fuel in the cylinder e.g. the 'tails' after the end of injection indicate rate of fuel evaporation. This was done using the same injection pulsewidth initially (0.8 ms) in order to directly compare the two fuels and then using their correct pulsewidths for stoichiometric firing operation (1.25 ms for gasoline and 1.6 ms for E85). Calculated average spray areas are plotted in Figures 22 and 23. These have been normalised to the piston crown area such that 0.7 on the graph y-axis refers to 70% of the piston crown window area; the ratio of visible window area to the full cylinder bore area is ~0.55, with the window diameter corresponding to 0.73 of full bore diameter, i.e. 70% of the piston-crown window area corresponds to ~40% of the engine full bore area. Spray images have been superimposed at specific crankangle degrees after the start of injection to aid interpretation. These show representative sprays at cold and hot conditions for both fuels at different stages in the injection and post-injection periods. The End of injection (EOI) point is also shown for each case in Figures 22 and 23 (by vertical lines) to put spray timings into context. The RMS of the spray areas was similar for both fuels, with values of less than 5% during injection and of the order 20 25% after the end of injection when the collected Mie scattering was tailing off.
18 The average spray area for E85 is smaller than for gasoline at 20 C engine-coolant temperature from the start of injection, reflecting the earlier start of fuel seen for gasoline (which begins to contribute to the area earlier) and the fact that the individual plumes of E85 are more compact and break up slower than those of gasoline. This is also clear from Figure 21 where gasoline is seen earlier at the injector tip and is therefore more developed by 5 CA ASOI. The rate of rise in spray areas is very similar for both fuels during the injection period for 20 C coolant temperature, highlighting the small differences in individual plume widths or cone angles. After the end of injection the E85 spray areas quickly decrease, reaching a transition point at 20 CA ASOI where there is a slowdown in the light scattering level detected. This level then tapers off gradually until the background noise levels are reached after 55 CA ASOI. By the end of the injection period gasoline has a higher peak spray area reflecting the more efficient spray break-up which widens the plumes. Immediately after the end of injection the rates of evaporation are comparable but gasoline then also makes a transition to a much lower rate of evaporation at ~22 CA ASOI. The intensity levels of light scattering as the organised spray structure breaks up and droplets become entrained in the engine flow remains higher than for E85 however. This is an interesting observation that can have two explanations. The first relates to the proportion of heavy components in gasoline with high boiling points which will reduce the droplet evaporation rates for gasoline as the light fractions evaporate preferentially from the droplet surface. These smaller droplets that remain will take a longer time to evaporate at low temperatures and will therefore continue to participate in the Mie-scattering process. The second reason relates to spatial variations in the droplet field resulting from the injection event; this will be affected by the geometric break-up process of the spray which for E85 was observed to be less efficient, resulting in higher levels of impingement on the piston crown. If more of the fuel volume injected has not been atomised because of surface impingement, then the final droplet field will be less populated resulting in lower Mie-scattering intensities. The differences seen between E85 and gasoline are likely to be a combination of both these factors. At 90 C coolant temperature the change in the macroscopic spray structure as a result of spray collapse dictates that it is not meaningful to compare absolute levels of measured spray areas to the 20 C condition, during the injection period. Once the spray structure has broken up and only the droplet field remains, then comparisons can be made but the effects of spray collapse on the 3-D droplet field should be carefully assessed before general conclusions are made. For example, it has been shown that the effect of spray collapse is to concentrate the six spray plumes below the central axis of the injector i.e. in the centre of the piston window. Any change in the level of spray collapse will thus affect the projected spray area or footprint, since this is measured as a 2-D parameter. This explains why spray areas remain higher for longer for E85 compared to gasoline, since E85 spray collapses to a lesser extent and therefore maintains more of a radial component, which fills the piston window even after the end of injection. The spray areas for gasoline decrease rapidly after the end of injection at a constant rate before slowing down at around 30 CA ASOI and approaching the background level close to zero. E85 shows similar rates of evaporation to gasoline at this temperature, which may be explained by the similar mean boiling points of the two fuels.
19 When the injection pulsewidths are adjusted to reflect their true stoichiometric values, the longer injection duration needed for E85 stoichiometric operation (1.6 ms compared to 1.25 ms for gasoline) naturally results in larger peak spray areas. The initial spray area at 20 C can again be seen to be smaller for E85 due to the longer delay in seeing fuel at the injector tip as mentioned earlier; however, by ~7.5 CA ASOI they are very close to the gasoline line indicating a marginally faster rate of penetration for E85, a characteristic which was also seen in the quiescent chamber. They remain very similar until the end of the injection of gasoline, the thinner plumes of E85 making up the loss in area with their higher plume penetrations. The tail of the area curve for gasoline is similar to begin with when compared to the shorter injection pulse in Figure 22, suggesting similar rates of evaporation which would be expected; however, the tail tapers off much more gradually which potentially indicates local vapour saturation reducing the evaporation rates. A similar trend is shown for E85. At 90 C the gasoline spray collapses and concentrates the spray in the centre of the piston window thus reducing the peak areas calculated. However, the higher temperatures are reflected in the much steeper tail of the curve indicating more rapid evaporation. The longer length of the injection event for E85 means that both at 20 and 90 C the window is completely filled with liquid spray. The evaporation rates are again comparable to those of gasoline and more gradual relative to the shorter injection event, potentially indicating again vapour saturation, or simply being the result of a more populated droplet field. The difference between E85 and gasoline is relatively small at 55 CA ASOI for cold conditions, ~7%, but it is larger for fully warm conditions, ~13% higher for E85. This compares quite well with the increase in the fuel pulsewidth used for E85; the discrepancy between cold and hot conditions could be attributed to fuel impingement, given that that some fuel is expected to have impinged on the engine surfaces at 20 C and thus would not contribute to the spray area calculation. Flame Growth and Combustion Pressure In order to study the observed spray effects with respect to combustion for the two fuels, an imaging study of in-cylinder flame development was carried out for a batch of 100 consecutive cycles. The engine was run at 1500 RPM with 0.5 bar intake pressure. All firing tests were carried out at the same ignition timing (35 CA bef6re TDC) in order to compare flame growth under the same average flowfield and nominal conditions of pressure and temperature. Such observations must be put in context since the ignition timing could be advanced to improve the performance of E85 by taking advantage of its higher octane number, i.e. antiknock potential, and benefit from ethanol s higher laminar flame speed at stoichiometry [29 32]. Time-resolved images of flame growth are shown in Figure 24 for both E85 and gasoline and for several crank angle degrees After Ignition Timing ( CA AIT) with engine coolant temperature 20 C and 90 C (head and liner). The flames are presented with optimised contrast levels such that they are more easily seen on printed paper. However, they were enhanced by the same amounts to allow comparisons of luminosity across fuels for each crank angle set shown. Some clear differences can be seen in terms of presence of bright spots for gasoline flames, highlighting potential droplet burning in diffusion mode. There are also noticeable differences in the actual texture and average luminosity of the flames for E85 compared to gasoline for which no single cause can be attributed. E85 shows a more opaque appearance, with less
20 contrast within the flame and less evident spotty burning. Certainly no reports have been found in the literature that describe visual characteristics of natural light chemiluminescence of ethanol-based versus gasoline turbulent premixed flames in other optical engines or combustion bombs and therefore it is difficult to propose a strong hypothesis for these observations. Other parallel studies by some of the current authors with different injector geometries [10, 33] have shown that similar visual characteristics were seen for pure ethanol and other higher C-chain alcohols such as butanol. Current work in the same engine, as yet unpublished, has also revealed that methane flames have similar attributes in the same engine under the same operating conditions. The link to carbon chain length is one possible mechanism as is the type and levels of particulate matter generated during combustion. Further study of the visual appearance of the flames is needed, including spectroscopy and Laser-sheet imaging to look into the local flame structure. Combustion performance was very similar for gasoline and E85 at hot engine conditions as shown by the average in-cylinder pressure traces and mass fraction burned in Figure 25 and 26, respectively. Slower combustion development for E85, especially at 20 C, indicated the potential effect of increased charge cooling and the necessity of advancing ignition timing to match gasoline performance. Specifically, the pressure traces of Figure 25 revealed that at ignition timing the average in-cylinder pressure for E85 was lower by ~0.2 bar, most probably as a result of lower in-cylinder temperatures from ethanol s greater cooling capacity. However, after ignition the pressure rise was faster than that of gasoline. The phasing of combustion defined by the location of peak pressure was very similar but the peak pressure was lower by ~2 bar for E85. The poor atomisation and higher levels of fuel impingement observed visually with E85 may have also contributed to a leaner mixture at the spark plug and thus to a slower flame growth. At 90 C both fuels produced very similar pressure and MFB curves with comparable levels of cycle-to-cycle variation in peak pressure. A recent study of direct injection of gasoline and E85 with a different multi-hole injector in a different engine has shown higher peak pressures and faster burning rates with E85 in comparison to gasoline at optimised ignition timings for the two fuels [34]. E85 has also been faster than gasoline with a side pressure-swirl atomiser in an optical engine of similar geometry to that used in the present study [33]. Pure ethanol has also been marginally faster than gasoline in the same engine of the current study and at similar conditions but with different multi-hole injector geometry [10]. This shows that there is great sensitivity of ethanol s combustion development to the injection system and mixture formation. In order to assess the average time-resolved rate of flame growth and the direction of flame propagation for each fuel, flame areas were obtained on a cycle-by-cycle basis via binarisation of each flame image. Since no image intensifier was used for the current study, flame chemiluminescence intensities were quite low during the initial phase of combustion (0 15 CA AIT). Extensive analysis of thresholding techniques revealed that image processing with changing threshold values to reflect changes in the mean flame intensity was not very reliable for automated analysis, mainly due to random localised areas of image saturation (from droplet burning as discussed earlier) which elevated the automatically identified threshold value to levels above the true mean and did not reproduce the flame outline accurately. However, as a result of the low levels of background noise, i.e. the good contrast between the flames and the background, it was possible to enhance
21 the images to improve contrast. This process also resulted in reducing the sensitivity of the intensity value used in the thresholding operation which effectively standardised the processing methodology for all flames. The methodology was visually checked on-line for each flame to ensure that no overestimation of the flame areas was occurring during the whole period of flame growth. It also needs to be noted that typically flames were clipped by the boundaries of the optical piston crown from ~25 CA AIT onwards (Figure 24). The following discussion should therefore bear in mind that a degree of masking will be introduced in the quantification of the flames which get convected towards the exhaust-side cylinder walls by the tumble. The growth in flame size is plotted for all fuels in terms of an equivalent radius in Figure 27, calculated from the flame areas of all individual cycles on the basis of a circle with the same area to that of each flame. The flame radius is used here as an additional metric to the MFB since it can reveal details about flame growth phenomena immediately after ignition, a period which is not resolved well by thermodynamically derived MFB data. It should be pointed out that the maximum flame radius shown corresponds to the edge of the optical piston crown which was 65 mm in diameter. In order to provide a link between Figure 27 and the MFB traces shown in Figure 26, the flame radius was used to estimate the burned gas volume on the basis of an equivalent sphere. For a flame radius of 15 mm, which corresponded on average to CA AIT, the mass fraction burned was calculated from the volume fraction to be of the order 5 10%. This is in agreement with Figure 26 and highlights that flame radii in Figure 27 demonstrate phenomena very early in the cycle. Specifically, the flame radius evolution in Figure 27 shows that E85 and gasoline have very similar rates of flame growth at hot and cold engine operating conditions, however E85 was always marginally slower. The fact that Figure 26 and Figure 27 show the exact same trends between gasoline and E85, suggests that the mechanism of combustion during the early kernel growth of 10% MFB is carried over to the full duration of the combustion event. The flame growth speed (calculated by the gradient of the flame radius curve using a central differencing approach) is shown specifically in Figure 28. In the first 5 7 CA AIT (corresponding to values below 0.5% MFB), the rate of flame growth goes down from high values imposed by the initial expansion of the spark. Once this effect has ended, the flame growth speed increases steadily from values of the order 1 2 m/s for 20 C and 2 3 m/s 90 C to about m/s at CA AIT as masking by the optical bore starts affecting the images (with the cold conditions peaking about 5 CA later). Previous studies of ethanol s laminar burning at conditions relevant to engines [29 32] have shown values of flame speeds of the order 2 m/s which are in accordance with those quantified in Figure 28. E85 shows generally a lower flame speed than gasoline, starting from levels that are lower by ~1 m/s at 5 CA AIT, but at CA AIT E85 s speed has approached that of gasoline. The laminar flame speed of ethanol is greater than iso-octane s at stoichiometry [29 32], but the current study s results may also suggest that the flame speed of the gasoline fuel employed was much larger than iso-octane s, and potentially greater than pure ethanol s as well, thus the trends observed. However, the trends largely disappear if flame speed is plotted against flame size in Figure 29. E85 shows faster growth for the same size to gasoline for both hot and cold conditions when the flame radius is smaller than ~15 mm, leading to different levels of strech. The reduction in flame growth speed for E85 after ~20 mm flame radius relative to gasoline is a result of E85 s faster large-scale convection
22 towards the exhaust side up until this point; at 20 mm radius, or ~28 CA AIT, some clipping of the flame area (as dictated by the optical access) is already occurring for E85, whereas for gasoline this occurs later. Early kernel growth is generally affected by two main features of the flow-field: large-scale convection by bulk motion and small-scale turbulence. In practice, and from the experimentalist s point of view, it is very difficult to decouple these effects reliably and consistently on a cycle-by-cycle basis; the flame sees increasing number of sizes and frequencies of turbulent scales as it grows. The flame centroid displacement can reveal information about the level of interactions with the surrounding flow field and/or potential temperature and concentration gradients experienced by the flame as it grows. The flame centroid was calculated from the images of the current study by taking the geometric centroid of each flame and obtaining the ensemble average of 100 cycles. Figure 30 shows the calculated flame centroid co-ordinates from 3 60 CA AIT for both gasoline and E85 at engine coolant temperatures of 20 C and 90 C. The (0, 0) point represents the spark-plug electrode point just below the platinum tip as superimposed on the graph. The end centroid points are the same for all fuels as the flame fills the whole window and this point is directly equivalent to the centre of the piston crown. There are subtle differences in the average flame motion between E85 and gasoline. The E85 flame centroid trajectory is biased to the right side of the combustion chamber and also shows that E85 flames travel further towards the exhaust side than gasoline flames. The flame trajectories for both fuels are not affected significantly by engine coolant temperature. However, at the cold operating condition it appears that E85 follows a different path to that followed at hot conditions. At high temperatures, the increased levels of evaporation and therefore mixture homogeneity may bias the sensitivity of flame motion toward dependency on the local velocity flow field, over the concentration field. This would explain to some extent the greater similarity of the flame motion for the two fuels at high temperatures. Particle Image Velocimetry (PIV) has shown that the mean flow-field on the swirl plane for this engine is nearly symmetrical between the left and right side of the combustion chamber, with a central channel running through the centre of the combustion chamber from intake to exhaust side [35, 36]. On the assumption of same average in-cylinder flowfield at ignition timing for both fuels, different trajectories can be an indication of different fuel and temperature distribution of the unburned mixture. In order to add a temporal dimension to the trends presented in Figure 30, Figure 31 quantifies the flame centroid displacement along the path of movement in time; Figure 32 shows the same relationship relative to flame size. It is clear that E85 is associated with much larger centroid displacement for the same flames size to gasoline s throughout its flame growth. A global centroid speed is calculated by taking the flame displacement at any crank angle and dividing it by the time elapsed after ignition at that crank angle. As such it probably presents a centroid speed biased towards bulk movement and essentially filters the effects of local smaller scale flow effects. This is shown in Figures 33 and 34 where the global centroid speed starts from levels of 6 8 m/s; this is higher for E85 than that for gasoline, by about 3 4 m/s. However, the centroid speed drops to values of the order 2 4 m/s at about 25 CA AIT before starting to increase again gradually at ~30 CA AIT (corresponding to the mean duration of θ Xb10% ) as the flame starts to move from the exhaust side to the intake side; for E85 the levels are always higher than for gasoline. Flow velocities measured by
23 PIV just below the spark plug in an identical engine at the same operating point have shown mean bulk flow velocities of 2 4 m/s in the direction from the intake to the exhaust side [36]. The magnitude of the centroid speed shown in Figure 33 (~3 m/s) is therefore consistent with mean flow velocities. The higher centroid speeds of E85 may suggest that the different characteristics and timescales of spray formation, impingement and evaporation with E85 may have affected either the bulk flowfield, or the final concentration field, or indeed both, at the time of ignition, leading to differences in the directionality and speed of flame motion. By calculating the change in flame centroid displacement with time using a local central differencing approach for every crank angle that the flame images were acquired at, a local centroid speed is also obtained from Figure 30; this now reveals in Figure 35 an estimate of previously masked effects of smaller scales on flame motion, especially at the early stages of flame growth. The early flame growth phase 0 20 CA AIT is characterised by small changes in the local displacement speeds, with E85 and gasoline showing similar trends, albeit E85 starting from much higher values and dropping to lower values than gasoline at hot conditions. The subsequent increase in centroid displacement speeds after about 25 CA AIT is a result of the flames expanding into the unburned regions on the intake side of the engine; E85 moves across the bore towards the intake side earlier than gasoline, just before 25 CA AIT, with gasoline lagging by ~2 5 CA. Plotting the local flame centroid speed versus flame radius in Figure 36 shows that E85 and gasoline flames are subjected to different stresses during flame growth. The local flame centroid speed is much smaller for gasoline than that of E85 after ~15 mm in radius, whilst E85 has lower centroid speed for flame radius in the range 5 15 mm. It is worth noting that it was only in the latter size range where the flame growth speed was found to be higher for E85 than for gasoline in Figure 29. Therefore, periods of lower local flame centroid displacement speed were associated with faster combustion for both fuels. SUMMARY AND CONCLUSIONS Spray and combustion characteristics of E85 and gasoline from a multi-hole injector were investigated using high-speed imaging and droplet sizing in a quiescent chamber and in an optical DISI engine. The effects of fuel temperature ( C) and gas pressure (0.5 and 1.0 bar) were studied and linked to well-known nondimensional numbers, along with flame growth and motion speeds. The main findings are: E85 spray formation was more insensitive to changes in temperature and pressure when in combination compared to gasoline. Specifically, E85 was relatively insensitive to changes in pressure for a given temperature but showed a gradual decrease in penetration with increasing fuel temperatures. This was particularly evident at low gas pressures and led to E85 spray collapse at more severe combinations of pressure and temperature than gasoline s. E85 spray plumes were thinner and more compact at low temperatures and this was reflected in higher spray penetration. Gasoline s penetration was more insensitive to changes in temperature. Droplet sizes were larger for E85 than gasoline at all conditions. Analysis of the gas phase Weber number indicated that secondary atomisation of E85 fell into a different droplet break-up regime
24 compared to gasoline which predicts larger droplet size distributions. The higher surface tension of ethanol at 20 C appears to explain why the differences existed mainly at cold conditions. The lower vapour pressure of ethanol at 20 C also indicated that in-nozzle cavitation phenomena would be more severe with gasoline, probably also contributing to the smaller droplet sizes measured. Estimated liquid core break-up lengths from correlations in the literature were unrealistically long, most probably due to the transient nature of injection and the presence of in-nozzle cavitation phenomena. At high values of the liquid Weber number, the Reynolds number and the Ohnesorge numbers were probably better able to differentiate between different atomisation characteristics of fuels. The Oh number for ethanol was more than twice that of gasoline s components at standard temperature and pressure. The results highlight the importance of the fuel viscosity on atomisation and break-up efficiency and its particular relevance in light of the increased use of alcohols in gasoline blends. Furthermore, at cold conditions (7 C), the calculated values of the Oh vs. Re crossed from the atomisation regime into the second wind induced regime and this has certain implications for engine cold-start conditions. In the engine, the sprays showed the same trends to those observed in the chamber. The effect of incylinder engine flow on spray formation was observed and showed the spray envelope to be very robust to cyclic variations in the flowfield. However, flowfield interactions were helpful in breaking up the spray and also controlled the levels of fuel impinging on the piston crown. In-cylinder wetted footprint spray areas showed that initial evaporation rates were similar for E85 and gasoline. In particular, similar trends were observed for the two fuels with the same injection duration (0.8 ms), but E85 showed larger differences between 20 C and 90 C engine coolant temperature than gasoline. In fact, gasoline and E85 exhibited close evaporation characteristics at 90 C but gasoline was quite slower in evaporating at 20 C. For injection durations corresponding to stoichiometry for the two fuels, E85 exhibited longer evaporation time at 90 C than gasoline due to the longer injection duration that was required, but at 20 C the respective differences between E85 and gasoline were much smaller. The E85 flames exhibited lower contrast and a smaller number of bright spots than those seen for gasoline. The latter may be associated with lower levels of soot. The poorer atomisation and break-up efficiency indicated from droplet sizing and spray imaging for E85 could have contributed to the lower peak combustion pressures, marginally slower mass fraction burned curves and slower equivalent flame radius growth observed for E85 at 20 C engine coolant temperature. However, the combustion performance of E85 at 90 C was very similar to that of gasoline; the greater similarity between E85 and gasoline in terms of non-dimensional break-up parameters, macroscopic spray characteristics and average droplet sizes at 90 C, all suggested small differences in mixture preparation quality at high engine coolant temperatures which were reflected in the combustion process. The laminar flame speed of ethanol is greater than iso-octane s at stoichiometry, but the current study s results may also suggest that the flame speed of the gasoline fuel employed was larger than pure iso-
25 octane s, and potentially greater than pure ethanol s as well, thus the trends observed. However, E85 had larger flame growth speed than gasoline for flame radius smaller than 15 mm, suggesting different levels of stretch for the same flame size. Additionally, the average in-cylinder pressure for E85 at ignition timing was lower by ~0.2 bar, probably as a result of lower in-cylinder temperatures from greater charge cooling capacity; this combination could also be associated with slower initial flame kernel growth. Average flame-centroid motion paths indicated tendency for flames to grow towards the exhaust side in the early stages of flame-kernel growth for both fuels. However, for E85 the flame centroid path was strongly biased towards one side of the combustion chamber compared to gasoline which showed a more circular flame centroid motion. This suggests that the different characteristics and timescales of spray formation, impingement and mixing observed with E85 may have affected either the bulk flowfield, or the final concentration field, or indeed both, at the time of ignition, leading to differences in the directionality of flame development. The mean global flame centroid displacement speed generally agreed with the expected mean flow velocity field around ignition timing (~3 m/s). E85 flames showed longer displacement path from the spark plug, as well as larger global flame centroid displacement speed. However, on a local scale, E85 showed slower centroid displacement speed for flame radii smaller than 15 mm in comparison to gasoline and much larger displacement speed after that size; this was found to correlate with those sizes where E85 had faster flame growth. Current work is focused on studies of in-nozzle cavitation and transition to flash boiling upon spray formation. The fuel matrix has been expanded by other alcohols with different properties to ethanol, like butanol. E10 is also studied since previous work has shown that when ethanol is added to gasoline in small percentages, it alters significantly the distillation curve of gasoline [37 38]. The combustion study is being expanded by laser-sheet imaging to identify more detailed differences in the flame fronts of those fuels. REFERENCES 1. Zhao, F., Lai, M.C. and Harrington, D.L., Automotive Spark-Ignition Direct-Injection Gasoline Engines, Progress in Energy and Combustion Science, Vol. 25, pp , Stach, T., Schlerfer, J. and Vorbach, M., New Generation Multi-Hole Injector for Direct-Injection SI Engines, SAE Paper , Serras-Pereira, J., Aleiferis, P.G., Richardson, D. and Wallace, S., Mixture Formation and Combustion Variability in a Spray-Guided DISI Engine, SAE Transactions, Journal of Engines, Vol. 116, No 3, pp , Paper , Serras-Pereira, J., Aleiferis, P.G., Richardson, D. and Wallace, S., Spray Development, Flow Interactions and Wall Impingement in a DISI Engine, SAE Paper , van Romunde, Z. and Aleiferis, P.G., Effect of Operating Conditions and Fuel Volatility on Development and Variability of Sprays from Gasoline Direct-Injection Multihole Injectors, Atomisation and Sprays, Vol. 19, pp , 2009.
26 6. van Romunde, Z., Aleiferis, P.G., Cracknell, R.F. and Walmsley, H.L., Effect of Fuel Properties on Spray Development from a Multi-Hole DISI Engine Injector, SAE Transactions, Journal of Engines, Vol. 116, No 3, pp , Paper , Pitcher, G., Wigley, G. and Saffman, M., Velocity and Drop size Measurements in Fuel Sprays in a DI Diesel Engine, Particle and Particle Systems Characterisation, Vol. 7, pp , Albrecht, H.-E., Damaschke, N., Borys, M. and Tropea, C., Laser Doppler and Phase Doppler Measurement Techniques, Springer-Verlag, Mitroglou, N., Nouri, J.M., Gavaises, M. and Arcoumanis, C., Spray Characteristics of a Multi-Hole Injector for Direct-Injection Gasoline Engines, International Journal of Engine Research, Vol. 7, pp , Serras-Pereira, J., Aleiferis, P.G., Richardson, D. and Wallace, S., Characteristics of Ethanol, Butanol, Iso-Octane and Gasoline Sprays and Combustion from a Multi-Hole Injector in a DISI Engine, SAE Transactions, Journal of Fuels and Lubricants, Vol. 117, No 4, pp , Paper , Marriott, C.D., Wiles, M., Gwidt, M. and Parrish, S.E., Development of a Naturally Aspirated Spark- Ignition Direct Injected Flex Fuel Engine, SAE Paper , Yaws, C.L., Yaws Handbook of Thermodynamic and Physical Properties of Chemical Compounds, Knovel, Ohnesorge, W., Die Bildung von Tropfen an Dusen und die Auflosung Flussiger Strahlen, Zeitschrift fur Angewandte Mathematic und Mechanic, Bd. 16, Heft 6, pp , Reitz, R.D. and Bracco, F.V., Mechanisms of Atomization of a Liquid Jet, Physics of Fluids, Vol. 25, pp , Sallam, K.A., Dai, Z. and Faeth, G.M., Liquid Break-up at the Surface of Turbulent Round Liquid Jets in Still Gases, International Journal of Multiphase Flow, Vol. 28, pp , Suh, H.K. and Lee, C.S., Effect of Cavitation in Nozzle Orifice on the Diesel Fuel Atomization Characteristics, International Journal of Heat and Fluid Flow, Vol. 29, pp , Gilles-Birth, I., Bernhardt, S., Spicher, U. and Rechs, M., A Study of the In-Nozzle Flow Characteristic of Valve Covered Orifice Nozzles for Gasoline Direct Injection, SAE Paper , Gilles-Birth, I., Rechs, M., Spicher, U. and Bernhardt, S., Experimental Investigation of the In-Nozzle Flow of Valve Covered Orifice Nozzles for Gasoline Direct Injection, 7 th International Symposium on Internal Combustion Engine Diagnostics, 18 th May 2006, Kurhaus, Baden-Baden. 19. Miesse, C.C., Correlation of Experimental Data on the Disintegration of Liquid Jets, Industrial and Engineering Chemistry, Vol. 47, pp , Hiroyasu, H., Spray Break-up Mechanism from the Hole-Type Nozzle and its Applications, Atomization and Sprays, Vol. 10, pp , Wu, P.K. and Faeth, G.M., Aerodynamic Effects on Primary Break-up of Turbulent Liquids, Atomization and Sprays, Vol. 3, pp , Faeth, G.M., Hsiang, L.P. and Wu, P.K., Structure and Break-up Properties of Sprays, International Journal of Multiphase Flow, Vol. 21, Suppl., pp , 1995.
27 23. Charalampous, G., Hardalupas, Y. and Taylor, A., 3-Dimensional Structure of the Intact Liquid Jet Core during Coaxial Air-Blast Atomisation, 6 th ICMF, Leipzig, Germany, July 9 13, Hiroyasu, H., Shimizu, M. and Arai, M., Break-up Length of a Liquid Jet and Internal Flow in a Nozzle, Proceedings of 5 th ICLASS, pp , Yule, A.J. and Salters, D.G., A Conductivity Probe Technique for Investigating the Breakup of Diesel Sprays, Atomization and Sprays, Vol. 4, pp , Baumgarten, C., Mixture Formation in Internal Combustion Engines, Springer, Hiroyasu, H. and Arai, M., Structure of Fuel Sprays in Diesel Engines, SAE Paper , Hiroyasu, H., Arai, M. and Tabata, M., Empirical Equations for the Sauter Mean Diameter of a Diesel Spray, SAE Paper , Gülder, Ö.L., Correlations of Laminar Combustion Data for Alternative SI Engine Fuels, SAE Paper , Gülder, Ö.L., Burning Velocities of Ethanol-Isooctane Blends, Combustion and Flame, Vol. 56, pp , Bradley, D., Lawes, M. and Mansour, M.S., Explosion Bomb Measurements of Ethanol-Air Laminar Gaseous Flame Characteristics at Pressures up to 1.4 MPa, Combustion and Flame, Vol. 156, pp , Beeckmann, J., Röhl, O. and Peters, N., Experimental and Numerical Investigation of Iso-Octane, Methanol and Ethanol Regarding Laminar Burning Velocity at Elevated Pressure and Temperature, SAE Paper , Aleiferis, P.G., Malcolm, J.S., Todd, A.R., Cairns, A. and Hoffmann, H., An Optical Study of Spray Development and Combustion of Ethanol, Iso-Octane and Gasoline in a DISI Engine, SAE Paper , Zhu, G., Stuecken, T., Schock, H., Yang, X., Hung, D.L.S. and Fedewa, A., Combustion Characteristics of a Single-Cylinder Engine Equipped with Gasoline and Ethanol Dual-Fuel Systems, SAE Paper , Jarvis, S., Justham, T., Clarke, A., Garner, C.P., Hargrave, G.K. and Richardson, D., Motored SI IC Engine In-Cylinder Flow Field Measurement Using time Resolved Digital PIV for Characterisation of Cyclic Variation, SAE Paper , Justham, T., Cyclic Variability of Engine Intake and In-Cylinder Flows PhD Thesis, Loughborough University, Wolfson School of Mechanical and Manufacturing Engineering, UK, in Preparation, Balabin, R.M., Syunyaev, R.Z. and Karpov, S.A., Quantitative Measurement of Ethanol Distribution over Fractions of Ethanol-Gasoline Fuel, Energy and Fuels, Vol. 21, pp , Kar, K., Last, T., Haywood, C. and Raine, R.R., Measurement of Vapour Pressures and Enthalpies of Vaporisation of Gasoline and Ethanol Blends and their Effects on Mixture Preparation in an SI Engine, SAE Paper , 2008.
28 LIST OF FIGURES Figure 1. Fuel Distilation Curves. Figure 2. Nominal Spray Pattern of the Injector Used: (a) Engine Views, (b) Pressure Chamber Views. Figure 3. Spray Development, 20 C (293 K), 1.0 bar (Injection Pulse 1.5 ms): Column 1 Gasoline Side View; Column 2 E85 Side View; Column 3, Gasoline End View; Column 4 E85 End View. Figure 4. Spray Images at 777 μs ASOI: Gasoline. Figure 5. Spray Images at 777 μs ASOI: E85. Figure 6. Spray Images at 777 μs ASOI: Iso-Octane. Figure 7. Spray Cone Angle: All Fuels, 0.5 bar Gas Pressure. Figure 8. Spray Cone Angle: All Fuels, 1.0 bar Gas Pressure. Figure 9. Reynolds Number. Figure 10. Liquid Weber Number. Figure 11. Ohnesorge Diagram. Figure 12. Spray Penetration: Gasoline, 0.5 bar Gas Pressure. Figure 13. Spray Penetration: Gasoline, 1.0 bar Gas Pressure. Figure 14. Spray Penetration: E85, 0.5 bar Gas Pressure. Figure 15. Spray Penetration: E85, 1.0 bar Gas Pressure. Figure 16. Spray Penetration: Iso-Octane, 0.5 bar Gas Pressure. Figure 17. Spray Penetration: Iso-Octane, 0.5 bar Gas Pressure. Figure 18. Droplet Sizes, 0.5 bar Gas Pressure. Figure 19. Droplet Sizes, 1.0 bar Gas Pressure. Figure 20. Spray Development, Tumble Plane, 0.5 bar, SOI 80 CA ATDC (Injection Pulse 1.2 ms for Gasoline, 1.6 ms for E85): Column 1 Gasoline, 20 C; Column 2 E85, 20 C; Column 3 Gasoline, 90 C; Column 4 E85, 90 C. Figure 21. Spray Development, Swirl Plane, 0.5 bar, SOI 80 CA ATDC (Injection Pulse 0.8 ms): Column 1 Gasoline, 20 C; Column 2 E85, 20 C; Column 3 Gasoline, 90 C; Column 4 E85, 90 C. Figure 22. Spray Areas, 0.5 bar, Injection Pulse 0.8 ms. Figure 23. Spray Areas, 0.5 bar, Injection Pulse 1.2 ms for Gasoline, 1.6 ms for E85. Figure 24. Flame Growth, Ignition Timing 325 CA ATDC (35 CA BTDC): Column 1 E85, 20 C; Column 2 E85, 90 C; Column 3 Gasoline, 20 C; Gasoline, 90 C. Figure 25. In-Cylinder Pressure, Ignition Timing 325 CA ATDC. Figure 26. Mass Fraction Burnt, Ignition Timing 325 CA ATDC. Figure 27. Flame Radius, Ignition Timing 325 CA ATDC (0 50 CA AIT CA ATDC). Figure 28. Flame Growth Speed. Figure 29. Flame Growth Speed versus Flame Radius. Figure 30. Flame Centroids: Engine Heat 20 C (top), 90 C (bottom). Figure 31. Flame Centroid Displacement (Path Length). Figure 32. Flame Centroid Displacement (Path Length) versus Flame Radius. Figure 33. Global Flame Centroid Displacement Speed. Figure 34. Global Flame Centroid Displacement Speed versus Flame Radius. Figure 35. Local Flame Centroid Displacement Speed. Figure 36. Local Flame Centroid Displacement Speed versus Flame Radius.

![Temperature [ C] Figure 1. Fuel Distilation Curves.](/docs-images/76/73939629/images/29-1.jpg "3 Intake Side Intake Side Exhaust Side 2 1 1 6 2 5 3 4 4 5 6")
 (Swirl")
 Engine")
29 Gasoline iso-octane n-pentane o-xylene Ethanol E % Evaporated Temperature [ C] Figure 1. Fuel Distilation Curves. 3 Intake Side Intake Side Exhaust Side Exhaust Side 1,6 2,5 3, Pentroof Window View Piston Crown View Side View End View (Tumble Plane) (Swirl Plane) (Intake Side) (Tumble Plane) (a) (b) Figure 2. Nominal Spray Pattern of the Injector Used: (a) Engine Views, (b) Pressure Chamber Views.


30 μs ASOI Figure 3. Spray Development, 20 C (293 K), 1.0 bar (Injection Pulse 1.5 ms): Column 1 Gasoline Side View; Column 2 E85 Side View; Column 3, Gasoline End View; Column 4 E85 End View.

31 20 C (293 K) 50 C (323 K) 80 C (353 K) 100 C (373 K) 120 C (393 K) 0.5 bar Side View 1.0 bar Side View 0.5 bar End View 1.0 bar End View Figure 4. Spray Images at 777 μs ASOI: Gasoline.

32 20 C (293 K) 50 C (323 K) 80 C (353 K) 100 C (373 K) 120 C (393 K) 0.5 bar Side View 1.0 bar Side View 0.5 bar End View 1.0 bar End View Figure 5. Spray Images at 777 μs ASOI: E85.
33 20 C (293 K) 50 C (323 K) 80 C (353 K) 100 C (373 K) 120 C (393 K) 0.5 bar Side View 1.0 bar Side View Figure 6. Spray Images at 777 μs ASOI: Iso-Octane.
34 bar Gasoline E85 Iso-Octane Cone Angle [ ] Injector Body Temperature [ C] Figure 7. Spray Cone Angle: All Fuels, 0.5 bar Gas Pressure bar Gasoline E85 Iso-Octane Cone Angle [ ] Injector Body Temperature [ C] Figure 8. Spray Cone Angle: All Fuels, 1.0 bar Gas Pressure. 34
35 Reynolds Number, Re 140, , ,000 80,000 60,000 40,000 20,000 Ethanol n-pentane iso-octane o-xylene Temperature [K] Figure 9. Reynolds Number. Liquid Weber Number, WeL 100,000 90,000 80,000 70,000 60,000 50,000 40,000 30,000 20,000 10,000 Ethanol n-pentane iso-octane o-xylene Temperature [K] Figure 10. Liquid Weber Number. 35
36 Ohnesorge Number, Oh 1.E-01 1.E-02 1.E-03 Rayleigh Regime First Wind Induced Regime Second Wind Induced Regime 1.E+03 1.E+04 1.E+05 Reynolds Number, Re Atomisation Regime Ethanol n-pentane iso-octane o-xylene Figure 11. Ohnesorge Diagram. 36
37 Penetration [mm] C 50 C 80 C 100 C 120 C Gasoline 0.5 bar Time After Start of Injection [μs] Figure 12. Spray Penetration: Gasoline, 0.5 bar Gas Pressure. Penetration [mm] C 50 C 80 C 100 C 120 C Gasoline 1.0 bar Time After Start of Injection [μs] Figure 13. Spray Penetration: Gasoline, 1.0 bar Gas Pressure. 37
38 Penetration [mm] C 50 C 80 C 100 C 120 C E bar Time After Start of Injection [μs] Figure 14. Spray Penetration: E85, 0.5 bar Gas Pressure. Penetration [mm] C 50 C 80 C 100 C 120 C E bar Time After Start of Injection [μs] Figure 15. Spray Penetration: E85, 1.0 bar Gas Pressure. 38
39 Penetration [mm] C 50 C 80 C 100 C 120 C Iso -Octane 0.5 bar Time After Start of Injection [μs] Figure 16. Spray Penetration: Iso-Octane, 0.5 bar Gas Pressure. Penetration [mm] C 50 C 80 C 100 C 120 C Iso -Octane 1.0 bar Time After Start of Injection [μs] Figure 17. Spray Penetration: Iso-Octane, 0.5 bar Gas Pressure. 39
40 bar Gasoline E85 SMD [μm] Injector Temperature [ C] Figure 18. Droplet Sizes, 0.5 bar Gas Pressure bar Gasoline E85 20 SMD [μm] Injector Temperature [ C] Figure 19. Droplet Sizes, 1.0 bar Gas Pressure. 40


41 CA ASOI 3.6 Intake Exhaust Figure 20. Spray Development, Tumble Plane, 0.5 bar, SOI 80 CA ATDC (Injection Pulse 1.2 ms for Gasoline, 1.6 ms for E85): Column 1 Gasoline, 20 C; Column 2 E85, 20 C; Column 3 Gasoline, 90 C; Column 4 E85, 90 C. 41


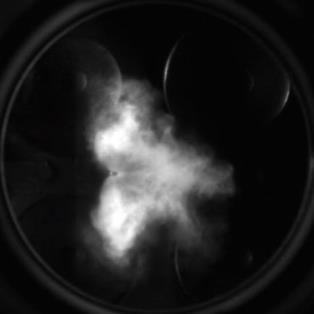


42 CA ASOI Intake 3.0 Exhaust Figure 21. Spray Development, Swirl Plane, 0.5 bar, SOI 80 CA ATDC (Injection Pulse 0.8 ms): Column 1 Gasoline, 20 C; Column 2 E85, 20 C; Column 3 Gasoline, 90 C; Column 4 E85, 90 C. 42


43 90 C 90 C 90 C 20 C 20 C EOI 20 C 90 C 20 C 20 C 90 C Figure 22. Spray Areas, 0.5 bar, Injection Pulse 0.8 ms. 20 C 20 C 20 C EOI E85 20 C EOI RON95 90 C 90 C 20 C 20 C 20 C 90 C 90 C Figure 23. Spray Areas, 0.5 bar, Injection Pulse 1.2 ms for Gasoline, 1.6 ms for E85. 43

:")

44 CA AIT Intake 20 Exhaust Figure 24. Fame Growth, Ignition Timing 325 CA ATDC (35 CA BTDC): Column 1 E85, 20 C; Column 2 E85, 90 C; Column 3 Gasoline, 20 C; Gasoline, 90 C. 44
P.G. Aleiferis*, J. Serras-Pereira and A. Augoye Department of Mechanical Engineering, University College London, UK
 EFFECT OF FUEL TEMPERATURE ON IN-NOZZLE CAVITATION AND SPRAY FORMATION OF LIQUID HYDROCARBONS AND ALCOHOLS FROM A REAL-SIZE OPTICAL INJECTOR FOR DIRECT-INJECTION SPARK-IGNITION ENGINES P.G. Aleiferis*,
Figure 1: The spray of a direct-injecting four-stroke diesel engine
 MIXTURE FORMATION AND COMBUSTION IN CI AND SI ENGINES 7.0 Mixture Formation in Diesel Engines Diesel engines can be operated both in the two-stroke and four-stroke process. Diesel engines that run at high
Module7:Advanced Combustion Systems and Alternative Powerplants Lecture 32:Stratified Charge Engines
 ADVANCED COMBUSTION SYSTEMS AND ALTERNATIVE POWERPLANTS The Lecture Contains: DIRECT INJECTION STRATIFIED CHARGE (DISC) ENGINES Historical Overview Potential Advantages of DISC Engines DISC Engine Combustion
CAVITATION, PRIMARY BREAK-UP AND FLASH BOILING OF GASOLINE, ISO-OCTANE AND N-PENTANE WITH A REAL-SIZE OPTICAL DIRECT-INJECTION NOZZLE
 CAVITATION, PRIMARY BREAK-UP AND FLASH BOILING OF GASOLINE, ISO-OCTANE AND N-PENTANE WITH A REAL-SIZE OPTICAL DIRECT-INJECTION NOZZLE J. Serras-Pereira, Z. van Romunde and P.G. Aleiferis* Department of
The Effects of Chamber Temperature and Pressure on a GDI Spray Characteristics in a Constant Volume Chamber
 한국동력기계공학회지제18권제6호 pp. 186-192 2014년 12월 (ISSN 1226-7813) Journal of the Korean Society for Power System Engineering http://dx.doi.org/10.9726/kspse.2014.18.6.186 Vol. 18, No. 6, pp. 186-192, December 2014
Spray Development, Flow Interactions and Wall Impingement in a Direct-Injection Spark-Ignition Engine
 2007-01-2712 Spray Development, Flow Interactions and Wall Impingement in a Direct-Injection Spark-Ignition Engine Copyright 2007 Society of Automotive Engineers, Inc J. Serras-Pereira and P.G. Aleiferis
Downloaded from SAE International by Brought To You Michigan State Univ, Thursday, April 02, 2015
 High-Speed Flow and Combustion Visualization to Study the Effects of Charge Motion Control on Fuel Spray Development and Combustion Inside a Direct- Injection Spark-Ignition Engine 2011-01-1213 Published
HEAT FLUX CHARACTERISTICS OF SPRAY WALL IMPINGEMENT WITH ETHANOL, BUTANOL, ISO-OCTANE, GASOLINE AND E10 FUELS
 HEAT FLUX CHARACTERISTICS OF SPRAY WALL IMPINGEMENT WITH ETHANOL, BUTANOL, ISO-OCTANE, GASOLINE AND E10 FUELS J. Serras-Pereira and P.G. Aleiferis* Department of Mechanical Engineering, University College
COMPARISON OF BREAKUP MODELS IN SIMULATION OF SPRAY DEVELOPMENT IN DIRECT INJECTION SI ENGINE
 Journal of KONES Powertrain and Transport, Vol. 17, No. 4 2010 COMPARISON OF BREAKUP MODELS IN SIMULATION OF SPRAY DEVELOPMENT IN DIRECT INJECTION SI ENGINE Przemys aw wikowski, Piotr Jaworski, Andrzej
Internal Combustion Optical Sensor (ICOS)
") Internal Combustion Optical Sensor (ICOS) Optical Engine Indication The ICOS System In-Cylinder Optical Indication 4air/fuel ratio 4exhaust gas concentration and EGR 4gas temperature 4analysis of highly
Internal Combustion Optical Sensor (ICOS) Optical Engine Indication The ICOS System In-Cylinder Optical Indication 4air/fuel ratio 4exhaust gas concentration and EGR 4gas temperature 4analysis of highly
Comparison of Gasoline and Butanol Spray Characteristics in Low Pressure Port Fuel Injector
 ILASS Americas, 25 th Annual Conference on Liquid Atomization and Spray Systems, Pittsburgh, PA, May 2013 Comparison of Gasoline and Butanol Spray Characteristics in Low Pressure Port Fuel Injector Balram
Module 3: Influence of Engine Design and Operating Parameters on Emissions Lecture 14:Effect of SI Engine Design and Operating Variables on Emissions
 Module 3: Influence of Engine Design and Operating Parameters on Emissions Effect of SI Engine Design and Operating Variables on Emissions The Lecture Contains: SI Engine Variables and Emissions Compression
Simulation of the Mixture Preparation for an SI Engine using Multi-Component Fuels
 ICE Workshop, STAR Global Conference 2012 March 19-21 2012, Amsterdam Simulation of the Mixture Preparation for an SI Engine using Multi-Component Fuels Michael Heiss, Thomas Lauer Content Introduction
EFFECT OF INJECTION ORIENTATION ON EXHAUST EMISSIONS IN A DI DIESEL ENGINE: THROUGH CFD SIMULATION
 EFFECT OF INJECTION ORIENTATION ON EXHAUST EMISSIONS IN A DI DIESEL ENGINE: THROUGH CFD SIMULATION *P. Manoj Kumar 1, V. Pandurangadu 2, V.V. Pratibha Bharathi 3 and V.V. Naga Deepthi 4 1 Department of
Optical Techniques in Gasoline Engine Performance and Emissions Development Injector Spray Visualisation
 Injector Spray Visualisation Denis Gill, Wolfgang Krankenedl, DEC Ernst Winklhofer 20.03.15 Emissions Development Injector Spray Visualisation Contents Introduction Spray Box Direct Injection (GDI) Spray
Foundations of Thermodynamics and Chemistry. 1 Introduction Preface Model-Building Simulation... 5 References...
 Contents Part I Foundations of Thermodynamics and Chemistry 1 Introduction... 3 1.1 Preface.... 3 1.2 Model-Building... 3 1.3 Simulation... 5 References..... 8 2 Reciprocating Engines... 9 2.1 Energy Conversion...
Increased efficiency through gasoline engine downsizing
 Loughborough University Institutional Repository Increased efficiency through gasoline engine downsizing This item was submitted to Loughborough University's Institutional Repository by the/an author.
High Pressure Spray Characterization of Vegetable Oils
 , 23rd Annual Conference on Liquid Atomization and Spray Systems, Brno, Czech Republic, September 2010 Devendra Deshmukh, A. Madan Mohan, T. N. C. Anand and R. V. Ravikrishna Department of Mechanical Engineering
Proposal to establish a laboratory for combustion studies
 Proposal to establish a laboratory for combustion studies Jayr de Amorim Filho Brazilian Bioethanol Science and Technology Laboratory SCRE Single Cylinder Research Engine Laboratory OUTLINE Requirements,
Internal Combustion Engines
 Emissions & Air Pollution Lecture 3 1 Outline In this lecture we will discuss emission control strategies: Fuel modifications Engine technology Exhaust gas aftertreatment We will become particularly familiar
CHAPTER 8 EFFECTS OF COMBUSTION CHAMBER GEOMETRIES
 112 CHAPTER 8 EFFECTS OF COMBUSTION CHAMBER GEOMETRIES 8.1 INTRODUCTION Energy conservation and emissions have become of increasing concern over the past few decades. More stringent emission laws along
A Study of EGR Stratification in an Engine Cylinder
 A Study of EGR Stratification in an Engine Cylinder Bassem Ramadan Kettering University ABSTRACT One strategy to decrease the amount of oxides of nitrogen formed and emitted from certain combustion devices,
INFLUENCE OF THE NUMBER OF NOZZLE HOLES ON THE UNBURNED FUEL IN DIESEL ENGINE
 INFLUENCE OF THE NUMBER OF NOZZLE HOLES ON THE UNBURNED FUEL IN DIESEL ENGINE 1. UNIVERSITY OF RUSE, 8, STUDENTSKA STR., 7017 RUSE, BULGARIA 1. Simeon ILIEV ABSTRACT: The objective of this paper is to
Timing is everything with internal combustion engines By: Bernie Thompson
 Timing is everything with internal combustion engines By: Bernie Thompson As one goes through life, it is said that timing is everything. In the case of the internal combustion engine, this could not be
FUEL IMPINGEMENT ANALYSIS OF FLASH-BOILING SPRAY IN A SPARK-IGNITION DIRECT-INJECTION ENGINE
 FUEL IMPINGEMENT ANALYSIS OF FLASH-BOILING SPRAY IN A SPARK-IGNITION DIRECT-INJECTION ENGINE Hao CHEN 1, Min XU 1, David L.S. HUNG 1, 2, Jie YANG 1, Hanyang ZHUANG 2 1 School of Mechanical Engineering,
APPLICATION OF LDA AND PIV TECHNIQUES TO THE VALIDATION OF VECTIS USING BOUNDARY MESH MOTION
 APPLICATION OF LDA AND PIV TECHNIQUES TO THE VALIDATION OF VECTIS USING BOUNDARY MESH MOTION S M Sapsford Ricardo Consulting Engineers Ltd. Computational fluid dynamics (CFD) is being increasingly used
University of Huddersfield Repository
 University of Huddersfield Repository Stetsyuk, V., Crua, C., Pearson, R. and Gold, M. Direct imaging of primary atomisation in the near-nozzle region of diesel sprays Original Citation Stetsyuk, V., Crua,
Module 2:Genesis and Mechanism of Formation of Engine Emissions Lecture 9:Mechanisms of HC Formation in SI Engines... contd.
 Mechanisms of HC Formation in SI Engines... contd. The Lecture Contains: HC from Lubricating Oil Film Combustion Chamber Deposits HC Mixture Quality and In-Cylinder Liquid Fuel HC from Misfired Combustion
Rapid Meshing and Advanced Physical Modeling for Gasoline DI Engine Application
 Rapid Meshing and Advanced Physical Modeling for Gasoline DI Engine Application R. Tatschl, H. Riediger, Ch. v. Künsberg Sarre, N. Putz and F. Kickinger AVL LIST GmbH A-8020 Graz AUSTRIA Gasoline direct
Combustion Equipment. Combustion equipment for. Solid fuels Liquid fuels Gaseous fuels
 Combustion Equipment Combustion equipment for Solid fuels Liquid fuels Gaseous fuels Combustion equipment Each fuel type has relative advantages and disadvantages. The same is true with regard to firing
Spray Imaging and Droplet Sizing of Spark-Eroded and Laser-Drilled Injectors with Gasoline-Butanol and Gasoline-Ethanol Blends
 Spray Imaging and Droplet Sizing of Spark-Eroded and Laser-Drilled Injectors with Gasoline-Butanol and Gasoline-Ethanol Blends P.G. Aleiferis and M.K. Behringer Department of Mechanical Engineering, University
Gas exchange and fuel-air mixing simulations in a turbocharged gasoline engine with high compression ratio and VVA system
 Third Two-Day Meeting on Internal Combustion Engine Simulations Using the OpenFOAM technology, Milan 22 nd -23 rd February 2018. Gas exchange and fuel-air mixing simulations in a turbocharged gasoline
Institut für Thermische Strömungsmaschinen. PDA Measurements of the Stationary Reacting Flow
 Institut für Thermische Strömungsmaschinen Dr.-Ing. Rainer Koch Dipl.-Ing. Tamas Laza DELIVERABLE D2.2 PDA Measurements of the Stationary Reacting Flow CONTRACT N : PROJECT N : ACRONYM: TITLE: TASK 2.1:
Marc ZELLAT, Driss ABOURI and Stefano DURANTI CD-adapco
 17 th International Multidimensional Engine User s Meeting at the SAE Congress 2007,April,15,2007 Detroit, MI RECENT ADVANCES IN DIESEL COMBUSTION MODELING: THE ECFM- CLEH COMBUSTION MODEL: A NEW CAPABILITY
SWIRL MEASURING EQUIPMENT FOR DIRECT INJECTION DIESEL ENGINE
 SWIRL MEASURING EQUIPMENT FOR DIRECT INJECTION DIESEL ENGINE G.S.Gosavi 1, R.B.Solankar 2, A.R.Kori 3, R.B.Chavan 4, S.P.Shinde 5 1,2,3,4,5 Mechanical Engineering Department, Shivaji University, (India)
Flash Boiling Sprays produced by a 6-hole GDI Injector
 Flash Boiling Sprays produced by a 6-hole GDI Injector Andrew Wood 1*, Graham Wigley 1, Jerome Helie 2 1: Aeronautical and Automotive Engineering, Loughborough University, Loughborough, UK 3: Continental
Marc ZELLAT, Driss ABOURI, Thierry CONTE and Riyad HECHAICHI CD-adapco
 16 th International Multidimensional Engine User s Meeting at the SAE Congress 2006,April,06,2006 Detroit, MI RECENT ADVANCES IN SI ENGINE MODELING: A NEW MODEL FOR SPARK AND KNOCK USING A DETAILED CHEMISTRY
HERCULES-2 Project. Deliverable: D8.8
 HERCULES-2 Project Fuel Flexible, Near Zero Emissions, Adaptive Performance Marine Engine Deliverable: D8.8 Study an alternative urea decomposition and mixer / SCR configuration and / or study in extended
P.G. Aleiferis* and M.K. Behringer Department of Mechanical Engineering, University College London, UK
 FLAME FRONT ANALYSIS OF ETHANOL, BUTANOL, ISO-OCTANE AND GASOLINE IN A SPARK-IGNITION ENGINE USING LASER TOMOGRAPHY AND INTEGRAL LENGTH SCALE MEASUREMENTS P.G. Aleiferis* and M.K. Behringer Department
Analysis of Pre-ignition Initiation Mechanisms using a Multi-Cycle CFD-Simulation
 International Multidimensional Engine Modeling User's Group Meeting 2014 April 7, 2014, Detroit Analysis of Pre-ignition Initiation Mechanisms using a Multi-Cycle CFD-Simulation Michael Heiss, Thomas Lauer
OPTICAL ANALYSIS OF A GDI SPRAY WALL-IMPINGEMENT FOR S.I. ENGINES. Istituto Motori CNR, Napoli Italy
 OPTICAL ANALYSIS OF A GDI SPRAY WALL-IMPINGEMENT FOR S.I. ENGINES A. Montanaro, L. Allocca, S. Alfuso Istituto Motori CNR, Napoli Italy XV National Meeting, Milano 29-30 Novembre 2007 GENERAL CONSIDERATIONS
Simulation Analysis Spray of the Butanol and Diesel Fuel Mixed with Injection Pressure and Air Flow Intensity
 Asia-Pacific Energy Equipment Engineering Research Conference (AP3ER 2015) Simulation Analysis Spray of the Butanol and Diesel Fuel Mixed with Injection Pressure and Air Flow Intensity Jian Wu e-mail:
Cold Flow PIV and Spray Visualization Experiments Applied to the Development of ALSTOM Dual Fuel Gas Turbine Burners
 Cold Flow PIV and Spray Visualization Experiments Applied to the Development of ALSTOM Dual Fuel Gas Turbine Burners Stefano Bernero *, Adrian Glauser, Martin Zajadatz ALSTOM (Switzerland) Ltd., Brown-Boveri-Str.
Comparison of Velocity Vector Components in a Di Diesel Engine: Analysis through Cfd Simulation
 IOSR Journal of Mechanical and Civil Engineering (IOSR-JMCE) e-issn: 2278-1684,p-ISSN: 2320-334X PP. 55-60 www.iosrjournals.org Comparison of Velocity Vector Components in a Di Diesel Engine: Analysis
B. von Rotz, A. Schmid, S. Hensel, K. Herrmann, K. Boulouchos. WinGD/PSI, 10/06/2016, CIMAC Congress 2016 / B. von Rotz
 Comparative Investigation of Spray Formation, Ignition and Combustion for LFO and HFO at Conditions relevant for Large 2-Stroke Marine Diesel Engine Combustion Systems B. von Rotz, A. Schmid, S. Hensel,
Emissions predictions for Diesel engines based on chemistry tabulation
 Emissions predictions for Diesel engines based on chemistry tabulation C. Meijer, F.A. Tap AVL Dacolt BV (The Netherlands) M. Tvrdojevic, P. Priesching AVL List GmbH (Austria) 1. Introduction It is generally
An Experimental and Numerical Investigation on Characteristics of Methanol and Ethanol Sprays from a Multi-hole DISI Injector
 An Experimental and Numerical Investigation on Characteristics of Methanol and Ethanol Sprays from a Multi-hole DISI Injector Yajia E 1, Min Xu 1, Wei Zeng 1, Yuyin Zhang 1, David J. Cleary 2 1 Inst. of
Cavitating Flow in a Model Diesel Injector Return Valve
 Introduction Cavitating Flow in a Model Diesel Injector Return Valve 1 Alberto Bonifacio; 1 Russel Lockett*, Richard Price 1 Department of Mechanical Engineering & Aeronautics, City, University of London,
EEN-E2002 Combustion Technology 2017 LE 3 answers
 EEN-E2002 Combustion Technology 2017 LE 3 answers 1. Plot the following graphs from LEO-1 engine with data (Excel_sheet_data) attached on my courses? (12 p.) a. Draw cyclic pressure curve. Also non-fired
PIV ON THE FLOW IN A CATALYTIC CONVERTER
 PIV ON THE FLOW IN A CATALYTIC CONVERTER APPLICATION NOTE PIV-016 The study and optimization of the flow of exhaust through a catalytic converter is an area of research due to its potential in increasing
Lecture 5. Abnormal Combustion
 Lecture 5 Abnormal Combustion Abnormal Combustion The Abnormal Combustion:- When the combustion gets deviated from the normal behavior resulting loss of performance or damage to the engine. It is happened
MODERN OPTICAL MEASUREMENT TECHNIQUES APPLIED IN A RAPID COMPRESSION MACHINE FOR THE INVESTIGATION OF INTERNAL COMBUSTION ENGINE CONCEPTS
 MODERN OPTICAL MEASUREMENT TECHNIQUES APPLIED IN A RAPID COMPRESSION MACHINE FOR THE INVESTIGATION OF INTERNAL COMBUSTION ENGINE CONCEPTS P. Prechtl, F. Dorer, B. Ofner, S. Eisen, F. Mayinger Lehrstuhl
Stability Limits and Fuel Placement in Carbureted Fuel Injection System (CFIS) Flameholder. Phase I Final Report
 Flameholder. Phase I Final Report") Stability Limits and Fuel Placement in Carbureted Fuel Injection System (CFIS) Flameholder Phase I Final Report Reporting Period Start Date: 15 March 2007 Reporting Period End Date: 31 August 2007 PDPI:
Stability Limits and Fuel Placement in Carbureted Fuel Injection System (CFIS) Flameholder Phase I Final Report Reporting Period Start Date: 15 March 2007 Reporting Period End Date: 31 August 2007 PDPI:
POSIBILITIES TO IMPROVED HOMOGENEOUS CHARGE IN INTERNAL COMBUSTION ENGINES, USING C.F.D. PROGRAM
 POSIBILITIES TO IMPROVED HOMOGENEOUS CHARGE IN INTERNAL COMBUSTION ENGINES, USING C.F.D. PROGRAM Alexandru-Bogdan Muntean *, Anghel,Chiru, Ruxandra-Cristina (Dica) Stanescu, Cristian Soimaru Transilvania
Paper ID ICLASS EXPERIMENTAL INVESTIGATION OF SPRAY IMPINGEMENT ON A RAPIDLY ROTATING CYLINDER WALL
 ICLASS-26 Aug.27-Sept.1, 26, Kyoto, Japan Paper ID ICLASS6-142 EXPERIMENTAL INVESTIGATION OF SPRAY IMPINGEMENT ON A RAPIDLY ROTATING CYLINDER WALL Osman Kurt 1 and Günther Schulte 2 1 Ph.D. Student, University
Spray characterization of a piezo pintle-type injector for gasoline direct injection engines
 Journal of Physics: Conference Series Spray characterization of a piezo pintle-type injector for gasoline direct injection engines To cite this article: J M Nouri et al 2007 J. Phys.: Conf. Ser. 85 012037
Validation and Verification of ANSYS Internal Combustion Engine Software. Martin Kuntz, ANSYS, Inc.
 Validation and Verification of ANSYS Internal Combustion Engine Software Martin Kuntz, ANSYS, Inc. Contents Definitions Internal Combustion Engines Demonstration example Validation & verification Spray
Effects of Dilution Flow Balance and Double-wall Liner on NOx Emission in Aircraft Gas Turbine Engine Combustors
 Effects of Dilution Flow Balance and Double-wall Liner on NOx Emission in Aircraft Gas Turbine Engine Combustors 9 HIDEKI MORIAI *1 Environmental regulations on aircraft, including NOx emissions, have
Numerical simulation of detonation inception in Hydrogen / air mixtures
 Numerical simulation of detonation inception in Hydrogen / air mixtures Ionut PORUMBEL COMOTI Non CO2 Technology Workshop, Berlin, Germany, 08.03.2017 09.03.2017 Introduction Objective: Development of
Variable Intake Manifold Development trend and technology
 Variable Intake Manifold Development trend and technology Author Taehwan Kim Managed Programs LLC (tkim@managed-programs.com) Abstract The automotive air intake manifold has been playing a critical role
Smoke Reduction Methods Using Shallow-Dish Combustion Chamber in an HSDI Common-Rail Diesel Engine
 Special Issue Challenges in Realizing Clean High-Performance Diesel Engines 17 Research Report Smoke Reduction Methods Using Shallow-Dish Combustion Chamber in an HSDI Common-Rail Diesel Engine Yoshihiro
SPRAY INTERACTION AND DROPLET COALESCENCE IN TURBULENT AIR-FLOW. AN EXPERIMENTAL STUDY WITH APPLICATION TO GAS TURBINE HIGH FOGGING
 ILASS-Europe 2002 Zaragoza 9 11 September 2002 SPRAY INTERACTION AND DROPLET COALESCENCE IN TURBULENT AIR-FLOW. AN EXPERIMENTAL STUDY WITH APPLICATION TO GAS TURBINE HIGH FOGGING S. Savic*, G. Mitsis,
Mechanical Engineering Design of a Split-Cycle Combustor. Experimental Fluid-Mechanics Research Group
 Mechanical Engineering Design of a Split-Cycle Combustor Dr Daniel D Coren Dr Nicolas D D Miché Experimental Fluid-Mechanics Research Group University of Brighton, March 2015 mechanical design considerations
Crankcase scavenging.
 Software for engine simulation and optimization www.diesel-rk.bmstu.ru The full cycle thermodynamic engine simulation software DIESEL-RK is designed for simulating and optimizing working processes of two-
Spray Characteristics of Diesel Fuel from Non - Circular Orifices
 ILASS Americas, 25 th Annual Conference on Liquid Atomization and Spray Systems, Pittsburgh, PA, May 13 Spray Characteristics of Diesel Fuel from Non - Circular Orifices P. Sharma, T. Fang * Department
Paper ID ICLASS The Spray Nozzle Geometry Design on the Spray Behavior Including Spray Penetration and SMD Distribution
 Paper ID ICLASS06-145 The Spray Nozzle Geometry Design on the Spray Behavior Including Spray Penetration and SMD Distribution Leonard Kuo-Liang Shih 1, Tien-Chiu Hsu 2 1 Associate Professor, Department
Chapter 4 ANALYTICAL WORK: COMBUSTION MODELING
 a 4.3.4 Effect of various parameters on combustion in IC engines: Compression ratio: A higher compression ratio increases the pressure and temperature of the working mixture which reduce the initial preparation
Port Fuel Injection (PFI) Strategies for Lean Burn in Small Capacity Spark Ignition Engines
 Strategies for Lean Burn in Small Capacity Spark Ignition Engines") ISSN 2395-1621 Port Fuel Injection (PFI) Strategies for Lean Burn in Small Capacity Spark Ignition Engines #1 Shailendra Patil, #2 Santosh Trimbake 1 shailendrapatil7592@gmail.com 2 santoshtrimbake@yahoo.co.in
ISSN 2395-1621 Port Fuel Injection (PFI) Strategies for Lean Burn in Small Capacity Spark Ignition Engines #1 Shailendra Patil, #2 Santosh Trimbake 1 shailendrapatil7592@gmail.com 2 santoshtrimbake@yahoo.co.in
Recent Advances in DI-Diesel Combustion Modeling in AVL FIRE A Validation Study
 International Multidimensional Engine Modeling User s Group Meeting at the SAE Congress April 15, 2007 Detroit, MI Recent Advances in DI-Diesel Combustion Modeling in AVL FIRE A Validation Study R. Tatschl,
R&D on a Medium-speed, Four-cycle Diesel Engine Using Heavy fuel oil
 1999C.4.1.11 R&D on a Medium-speed, Four-cycle Diesel Engine Using Heavy fuel oil 1. R&D contents 1.1 Background and R&D objectives In order to meet increasing demand for light oil and intermediate fraction,
Combustion. T Alrayyes
 Combustion T Alrayyes Fluid motion with combustion chamber Turbulence Swirl SQUISH AND TUMBLE Combustion in SI Engines Introduction The combustion in SI engines inside the engine can be divided into three
Comparison of Measured PFI Spray Characterizations of E85 and N-heptane Fuels for a Flex-Fuel Vehicle
 ILASS Americas, 21st Annual Conference on Liquid Atomization and Spray Systems, Orlando, Florida, May 18-21 2008 Comparison of Measured PFI Spray Characterizations of E85 and N-heptane Fuels for a Flex-Fuel
Plasma Assisted Combustion in Complex Flow Environments
 High Fidelity Modeling and Simulation of Plasma Assisted Combustion in Complex Flow Environments Vigor Yang Daniel Guggenheim School of Aerospace Engineering Georgia Institute of Technology Atlanta, Georgia
Normal vs Abnormal Combustion in SI engine. SI Combustion. Turbulent Combustion
 Turbulent Combustion The motion of the charge in the engine cylinder is always turbulent, when it is reached by the flame front. The charge motion is usually composed by large vortexes, whose length scales
TOWARDS CONTROLLED LIQUID ATOMIZATION. E.C. Fernandes, M.V. Heitor and V. Sivadas
 TOWARDS CONTROLLED LIQUID ATOMIZATION E.C. Fernandes, M.V. Heitor and V. Sivadas Center for Innovation Technology and Policy Research Laboratory of Thermo-fluids, Combustion and Environmental Systems Instituto
DIESEL SPRAY DEVELOPMENT FROM VCO NOZZLES WITH COMMON-RAIL
 DIESEL SRAY DEVELOMENT FROM VCO NOZZLES WITH COMMON-RAIL CHOONGSIK BAE, JINSUK KANG AND HANG-KYUNG LEE Department of Mechanical Engineering, Korea Advanced Institute of Science and Technology 373-1, Kusong-dong,
Simulating Gas-Air Mixture Formation for Dual-Fuel Applications
 Simulating Gas-Air Mixture Formation for Dual-Fuel Applications Karri Keskinen, Ossi Kaario, Mika Nuutinen, Ville Vuorinen, Zaira Künsch and Martti Larmi Thermodynamics and Combustion Technology Research
ENGINES ENGINE OPERATION
 ENGINES ENGINE OPERATION Because the most widely used piston engine is the four-stroke cycle type, it will be used as the example for this section, Engine Operation and as the basis for comparison in the
Influence of Micro-Bubbles within Ejected Liquid on Behavior of Cavitating Flow inside Nozzle Hole and Liquid Jet Atomization
 Influence of Micro-Bubbles within Ejected Liquid on Behavior of Cavitating Flow inside Nozzle Hole and Liquid Jet Atomization T. Oda 1*, K. Takata 2, Y. Yamamoto 1, K. Ohsawa 1 1 Department of Mechanical
Development, Implementation, and Validation of a Fuel Impingement Model for Direct Injected Fuels with High Enthalpy of Vaporization
 Development, Implementation, and Validation of a Fuel Impingement Model for Direct Injected Fuels with High Enthalpy of Vaporization (SAE Paper- 2009-01-0306) Craig D. Marriott PE, Matthew A. Wiles PE,
UNIT IV INTERNAL COMBUSTION ENGINES
 UNIT IV INTERNAL COMBUSTION ENGINES Objectives After the completion of this chapter, Students 1. To know the different parts of IC engines and their functions. 2. To understand the working principle of
Combustion characteristics of n-heptane droplets in a horizontal small quartz tube
 Combustion characteristics of n-heptane droplets in a horizontal small quartz tube Junwei Li*, Rong Yao, Zuozhen Qiu, Ningfei Wang School of Aerospace Engineering, Beijing Institute of Technology,Beijing
Fuel-Spray Characteristics of High Pressure Gasoline Injection in Flowing Fields*
 Fuel-Spray Characteristics of High Pressure Gasoline Injection in Flowing Fields* Jaejoon CHOI**, Seokhwan LEE**, Hyundong SHIN** and Choongsik BAE** The direct injection into the cylinders has been regarded
The Influence of Port Fuel Injection on Combustion Stability
 28..9 Technical The Influence of Port Fuel Injection on Combustion Stability Shoichi Kato, Takanori Hayashida, Minoru Iida Abstract The demands on internal combustion engines for low emissions and fuel
Theoretical Study of the effects of Ignition Delay on the Performance of DI Diesel Engine
 Theoretical Study of the effects of Ignition Delay on the Performance of DI Diesel Engine Vivek Shankhdhar a, Neeraj Kumar b a M.Tech Scholar, Moradabad Institute of Technology, India b Asst. Proff. Mechanical
Experimental Investigation of Hot Surface Ignition of Hydrocarbon-Air Mixtures
 Paper # 2D-09 7th US National Technical Meeting of the Combustion Institute Georgia Institute of Technology, Atlanta, GA Mar 20-23, 2011. Topic: Laminar Flames Experimental Investigation of Hot Surface
Droplet size development in a DISI injector fuel spray
 Loughborough University Institutional Repository Droplet size development in a DISI injector fuel spray This item was submitted to Loughborough University's Institutional Repository by the/an author. Citation:
Confirmation of paper submission
 Dr. Marina Braun-Unkhoff Institute of Combustion Technology DLR - German Aerospace Centre Pfaffenwaldring 30-40 70569 Stuttgart 28. Mai 14 Confirmation of paper submission Name: Email: Co-author: 2nd co-author:
Experimental Investigation of Acceleration Test in Spark Ignition Engine
 Experimental Investigation of Acceleration Test in Spark Ignition Engine M. F. Tantawy Basic and Applied Science Department. College of Engineering and Technology, Arab Academy for Science, Technology
Paper ID ICLASS EVALUATION OF IN-CYLINDER FLOW STRUCTURES AND GDI SPRAY PROPAGATION OVER A RANGE OF ENGINE SPEEDS AND INJECTION TIMING
 ICLASS-2006 Aug.27-Sept.1, 2006, Kyoto, Japan Paper ID ICLASS06-074 EVALUATION OF IN-CYLINDER FLOW STRUCTURES AND GDI SPRAY PROPAGATION OVER A RANGE OF ENGINE SPEEDS AND INJECTION TIMING P. Stansfield
Control of PCCI Combustion using Physical and Chemical Characteristics of Mixed Fuel
 Doshisha Univ. - Energy Conversion Research Center International Seminar on Recent Trend of Fuel Research for Next-Generation Clean Engines December 5th, 27 Control of PCCI Combustion using Physical and
Combustion PVM-MF. The PVM-MF model has been enhanced particularly for dualfuel
 Contents Extensive new capabilities available in STAR-CD/es-ice v4.20 Combustion Models see Marc Zellat presentation Spray Models LES New Physics Developments in v4.22 Combustion Models PVM-MF Crank-angle
Cyclic Fluctuations of Charge Motion and Mixture Formation in a DISI Engine in Stratified Operation
 ABSTRACT Cyclic Fluctuations of Charge Motion and Mixture Formation in a DISI Engine in Stratified Operation The processes of an internal combustion engine are subject to cyclic fluctuations, which have
INFLUENCE OF FUEL TYPE AND INTAKE AIR PROPERTIES ON COMBUSTION CHARACTERISTICS OF HCCI ENGINE
 ENGINEERING FOR RURAL DEVELOPMENT Jelgava, 23.-24.5.213. INFLUENCE OF FUEL TYPE AND INTAKE AIR PROPERTIES ON COMBUSTION CHARACTERISTICS OF HCCI ENGINE Kastytis Laurinaitis, Stasys Slavinskas Aleksandras
IC Engines Roadmap. STAR-CD/es-ice v4.18 and Beyond. Richard Johns
 IC Engines Roadmap STAR-CD/es-ice v4.18 and Beyond Richard Johns Strategy es-ice v4.18 2D Automated Template Meshing Spray-adapted Meshing Physics STAR-CD v4.18 Contents Sprays: ELSA Spray-Wall Impingement
Singh Groove Concept Combustion Analysis using Ionization Current By: Garrett R. Herning AutoTronixs, LLC. October 2007
 Singh Groove Concept Combustion Analysis using Ionization Current By: Garrett R. Herning AutoTronixs, LLC. October 2007 Ionization Current: Ionization current is a method devised of using the spark plug
City, University of London Institutional Repository
 City Research Online City, University of London Institutional Repository Citation: Marchi, A., Nouri, J. M., Yan, Y. & Arcoumanis, C. (2010). Spray stability of outwards opening pintle injectors for stratified
INVESTIGATION OF FLOW PATTERNS INSIDE NOZZLE AND SPRAY CHARACTERISTICS OF R134A FLASHING SPRAY
 Proceedings of the Asian Conference on Thermal Sciences 2017, 1st ACTS March 26-30, 2017, Jeju Island, Korea ACTS-P00097 INVESTIGATION OF FLOW PATTERNS INSIDE NOZZLE AND SPRAY CHARACTERISTICS OF R134A
1. INTRODUCTION 2. EXPERIMENTAL INVESTIGATIONS
 HIGH PRESSURE HYDROGEN INJECTION SYSTEM FOR A LARGE BORE 4 STROKE DIESEL ENGINE: INVESTIGATION OF THE MIXTURE FORMATION WITH LASER-OPTICAL MEASUREMENT TECHNIQUES AND NUMERICAL SIMULATIONS Dipl.-Ing. F.
The influence of thermal regime on gasoline direct injection engine performance and emissions
 IOP Conference Series: Materials Science and Engineering PAPER OPEN ACCESS The influence of thermal regime on gasoline direct injection engine performance and emissions To cite this article: C I Leahu