Alcohol Related Accidents in Mahoning County:
|
|
|
- Elwin Walton
- 5 years ago
- Views:
Transcription
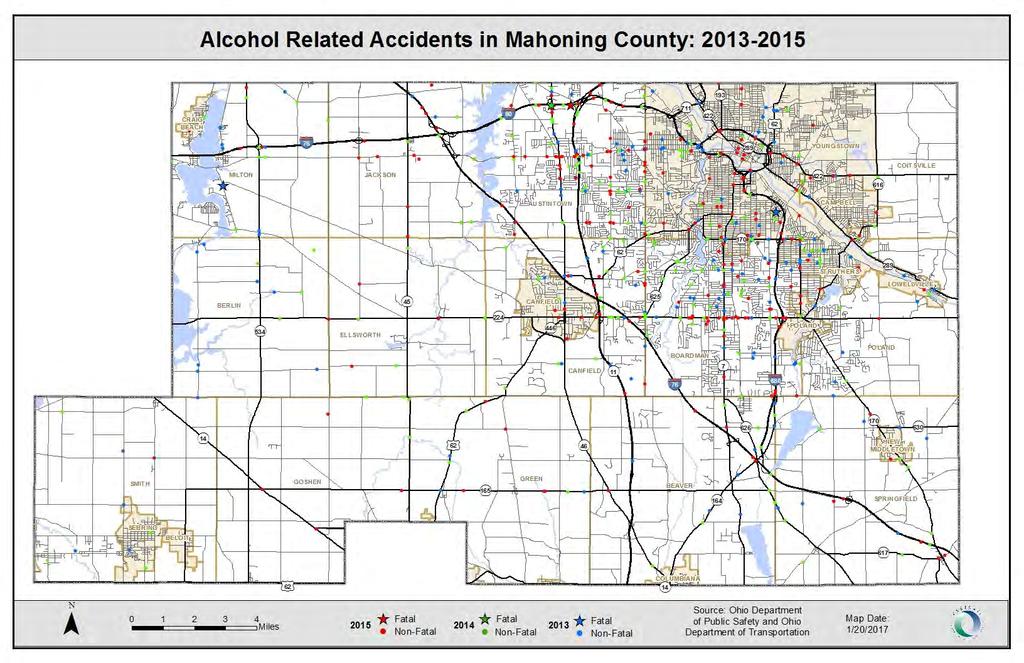
1 Alcohol Related Accidents in Mahoning County:


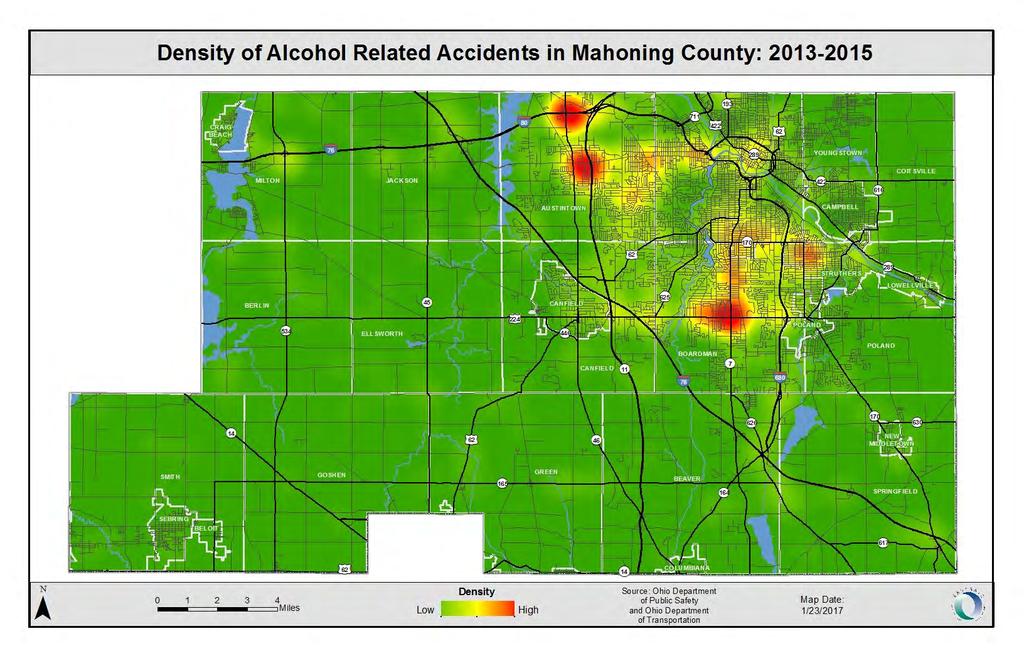
2 Alcohol Related Accidents in Mahoning County: Each year the Eastgate Regional Council of Governments collects crash data from the Ohio Department of Public Safety to aid in evaluating the safety of our region s roadways. Eastgate works with the Ohio Department of Transportation and the County Engineers to verify and map the location of crashes and analyze current trends in the data. The statistics help local transportation planners, engineers and law enforcement make informed decisions on where to install signage and signals, change roadway geometry, increase enforcement, set up checkpoints and how to target education. Standard crash analysis topics include driver age, motorcycle involvement and helmet use, pedestrian and bicycle involvement, speed, commercial vehicle involvement, seatbelt use, weather conditions, road conditions, injury and fatality rates, distracted driving and of course alcohol use. The data shows over and over again that most accidents can be prevented through safe and attentive driving. This particularly means avoiding any alcohol use before getting behind the wheel! Nights and weekends are prime time for alcoholrelated accidents, but they can and do happen at all hours. Alcohol was a factor in 614 accidents in Mahoning County from 2013 to 2015, that represents 7 less accidents than the previous reporting period from It was also factor in 7% of the county s traffic fatalities and 8% of serious injuries. The majority of alcohol-related accidents occurs on heavily traveled corridors, but can occur anywhere. The road with the highest number of alcohol-related accidents was US 224, with a total of 40 accidents.

3 Alcohol Related Accidents in Mahoning County:
4 Alcohol Related Accidents in Mahoning County: Traffic Controls and Contributing Factors Crashes Percent Pavement Markings % Failure To Control % Improper Lane Change/Passing/Offroad % Followed Too Closely/ACDA % Unsafe Speed % Left Of Center % None % Failure To Yield % Other % No Controls % Failure To Control % Failure To Yield % Followed Too Closely/ACDA % Operating Vehicle In Negligent Manner % None % Improper Backing % Improper Lane Change/Passing/Offroad % Left Of Center % Unknown % Unsafe Speed % Other % Traffic Signal % Followed Too Closely/ACDA % Failure To Yield % Ran Red Light % Failure To Control % Unknown % Other % Stop Sign % Failure To Yield % Ran Stop Sign % Failure To Control % Other % Other % Grand Total % Year Crashes Percent % % % Grand Total % Crash Severity Crashes Percent Fatal Crash % Injury Crash % Property Damage Crash % Grand Total % Youth Related? Crashes Percent No % Yes % Grand Total % Age Group Crashes Percent 16 to % 25 to % 35 to % 45 to % 55 to % 65 to % 75 and over % Unknown % Grand Total %

5 Alcohol Related Accidents in Mahoning County: Hour of the Day Sun Mon Tues Wed Thurs Fri Sat Grand Total Grand Total
6
7
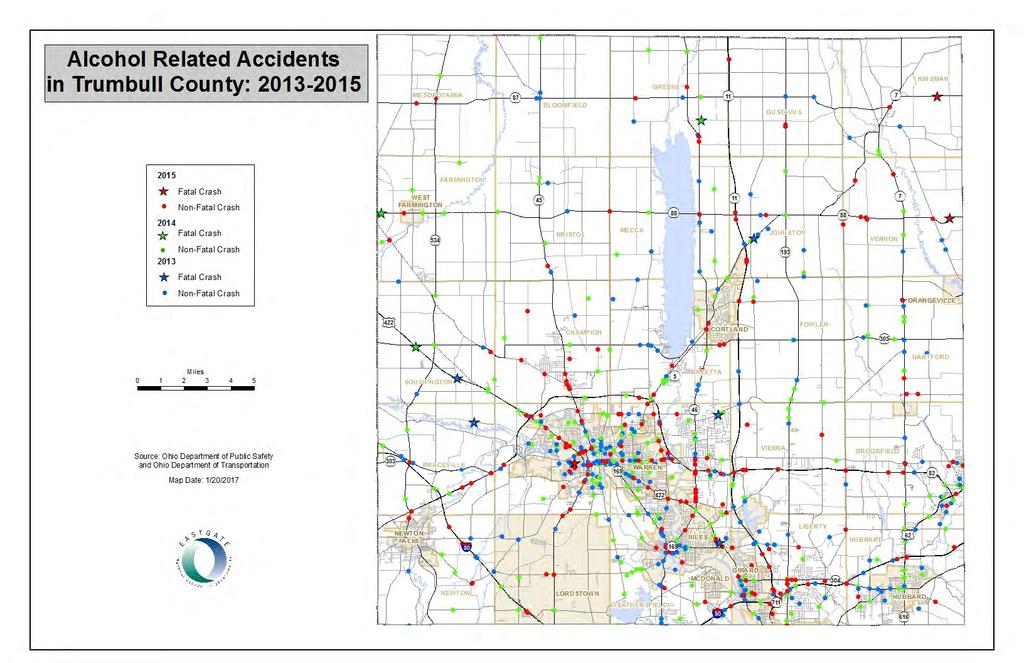
8 Alcohol Related Accidents in Trumbull County:


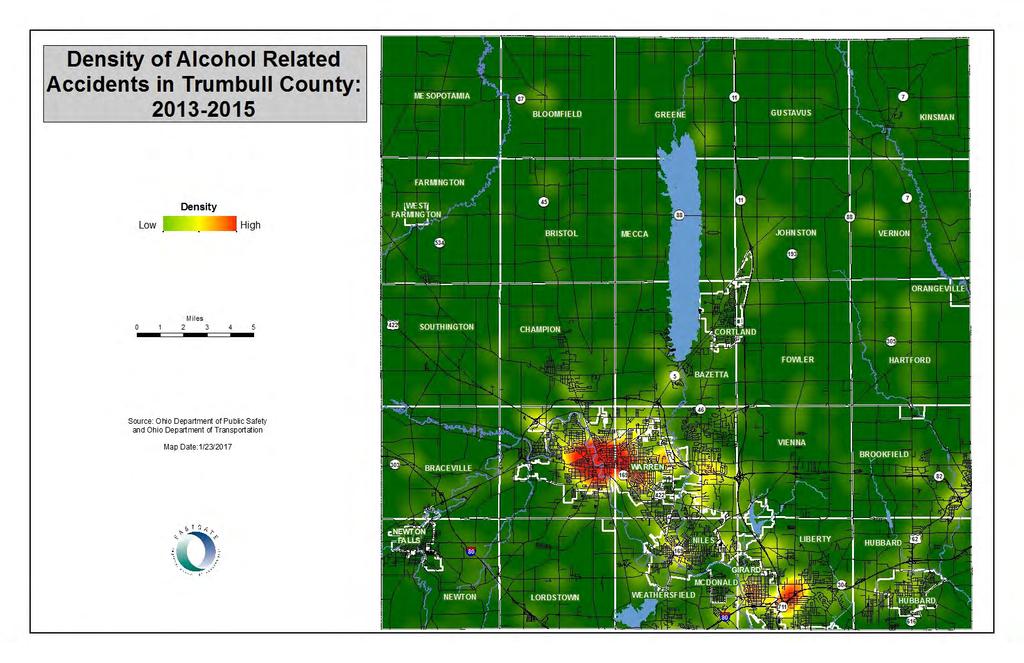
9 Alcohol Related Accidents in Trumbull County: Each year the Eastgate Regional Council of Governments collects crash data from the Ohio Department of Public Safety to aid in evaluating the safety of our region s roadways. Eastgate works with the Ohio Department of Transportation and the County Engineers to verify and map the location of crashes and analyze current trends in the data. The statistics help local transportation planners, engineers and law enforcement make informed decisions on where to install signage and signals, change roadway geometry, increase enforcement, set up checkpoints and how to target education. Standard crash analysis topics include driver age, motorcycle involvement and helmet use, pedestrian and bicycle involvement, speed, commercial vehicle involvement, seatbelt use, weather conditions, road conditions, injury and fatality rates, distracted driving and of course alcohol use. The data shows over and over again that most accidents can be prevented through safe and attentive driving. This particularly means avoiding any alcohol use before getting behind the wheel! Nights and weekends are prime time for alcoholrelated accidents, but they can and do happen at all hours. Alcohol was a factor in 732 accidents in Trumbull County from 2013 to This represents a reduction in the number of alcohol related crashes since the reporting period which had 805 crashes. Alcohol was factor in 24% of the county s fatalities and 17% of serious injuries. The majority of alcohol-related accidents occurs on heavily traveled corridors, but can occur anywhere. The road with the highest number of alcohol-related accidents was US 422 with a total of 56 accidents.


10 Alcohol Related Accidents in Trumbull County:
11 Alcohol Related Accidents in Trumbull County: Traffic Controls and Contributing Factors Crashes Percent Pavement Markings % Failure To Control % Improper Lane Change/Passing/Offroad % Followed Too Closely/ACDA % Unsafe Speed % None % Left Of Center % Failure To Yield % Operating Vehicle In Negligent Manner % Improper Turn % Improper Backing % Other % No Controls % Failure To Control % Followed Too Closely/ACDA % Failure To Yield % Improper Backing % None % Improper Lane Change/Passing/Offroad % Unsafe Speed % Other % Traffic Signal % Followed Too Closely/ACDA % Failure To Yield % Failure To Control % Ran Red Light % Other % Stop Sign % Ran Stop Sign % Failure To Yield % Failure To Control % Followed Too Closely/ACDA % Other % Other % Grand Total % Year Crashes Percent % % % Grand Total % Crash Severity Crashes Percent Fatal Crash % Injury Crash % Property Damage Crash % Grand Total % Youth Related? Crashes Percent No % Yes % Grand Total % Age Groups Crashes Percent 16 to % 25 to % 35 to % 45 to % 55 to % 65 to % 75 and over % Unknown % Grand Total %

12 Alcohol Related Accidents in Trumbull County: Hour of the Day Sun Mon Tues Wed Thur Fri Sat Grand Total Grand Total
13
14
ROADWAY INJURY EXPERIENCE FOR PERSONS WHO HAD BEEN DRINKING AND/OR USING DRUGS
 ROADWAY INJURY EXPERIENCE FOR PERSONS WHO HAD BEEN DRINKING AND/OR USING DRUGS Vehicle Severity Total Crashes involving drinking, not drugs Crashes involving drugs, not drinking Crashes involving drinking
Austin Police Department. An Analysis of Traffic Fatalities 2015
 Austin Police Department An Analysis of Traffic Fatalities Prepared by the Austin Police Department Research and Planning Unit April Table of Contents Background... Overview... Terminology... Notes about
Michigan State Police (MSP) Post 21 - Metro North
 Post 21 - Metro North") June 2018 Revised 8/3/2018 2017 Reporting Criteria Please pay particular attention to the wording when interpreting the three levels of data gathered for this report. Crash The Crash Level analyzes data
June 2018 Revised 8/3/2018 2017 Reporting Criteria Please pay particular attention to the wording when interpreting the three levels of data gathered for this report. Crash The Crash Level analyzes data
LARGE TRUCKS, 2010 JUNE 2011 ISSUE 11-C04
 JUNE 211 ISSUE 11-C4 LARGE TRUCKS, 21 Summary In 21, a of 192,89 traffic collisions were reported in Indiana by law enforcement. Of those, 6.2 percent involved a large truck (Table 1). Nationally in 29
Michigan State Police (MSP) Post 21 - Metro North
 Post 21 - Metro North") October 2017 2016 Reporting Criteria Please pay particular attention to the wording when interpreting the three levels of data gathered for this report. Crash The Crash Level analyzes data related to crash
October 2017 2016 Reporting Criteria Please pay particular attention to the wording when interpreting the three levels of data gathered for this report. Crash The Crash Level analyzes data related to crash
Traffic Safety Network Huron Valley
 June 2018 Revised 8/3/2018 2017 Reporting Criteria Please pay particular attention to the wording when interpreting the three levels of data gathered for this report. Crash The Crash Level analyzes data
ITSMR Research Note. Motorcyclists and Impaired Driving ABSTRACT INTRODUCTION KEY FINDINGS. September 2013
 September 2013 KEY FINDINGS F&PI CRASHES INVOLVING IMPAIRED MOTORCYCLISTS 27% of the fatal MC crashes over the five year period, 2008-2012, were alcohol-related. 48% of the alcohol-related F&PI MC crashes
Unit 1 - Driving, Mobility and Laws. Chapter 1 - Driving and Mobility
 The outline listed below is meant to be used as a reference for the placement of The Driving Zone 2 DVD clips into Responsible Driving text book where they may provide benefit and talking points for the
Traffic Accident Statistics
 2000 Missouri State Highway System Traffic Accident Statistics Missouri State Highway System Traffic Accident Statistics Table of Contents Subject Chapter 1: Statewide Traffic Accident Statistics, Introduction
Fatal Crashes and Fatalities : Easter 2005
 Fatal Crashes and Fatalities : Easter The number of fatal crashes and fatalities during Easter in comparison with 4, as well as the severity of crashes for the 2 years, is given in the tables below. Crashes
LARGE TRUCKS May 2010
 May 2010 A collision produces three levels of data: collision, unit (vehicles), and individual. For this reason, readers should pay particular attention to the wording of statements about the data to avoid
Florida Strategic Highway Safety Planning Florida Strategic Highway Safety Plan (SHSP) Update and Performance Overview
 Update and Performance Overview") Session 1 Florida Strategic Highway Safety Planning Florida Strategic Highway Safety Plan (SHSP) Update and Performance Overview Joe Santos, PE, FDOT, State Safety Office October, 23, 2013 Florida Statistics
Session 1 Florida Strategic Highway Safety Planning Florida Strategic Highway Safety Plan (SHSP) Update and Performance Overview Joe Santos, PE, FDOT, State Safety Office October, 23, 2013 Florida Statistics
Market Safety in ASEAN Region
 Market Safety in ASEAN Region SHOGO SAKAI Project General Manager Toyota Daihatsu Engineering & Manufacturing 15 th May,2017 1 Table of contents Traffic accident situation in ASEAN Toyota s Safety Approach
Crash Contributing Factors 2016
 s 2016 RURAL ANIMAL ON ROAD- DOMESTIC ANIMAL ON ROAD- WILD BACKED WITHOUT SAFETY USE - OTHER USE - TALKING USE - TEXTING USE - UNKNOWN CHANGED LANE WHEN UNSAFE HEADLAMPS STOP LAMPS TAIL LAMPS TURN SIGNAL
Crash Contributing Factors 2015
 s 2015 RURAL ANIMAL ON ROAD- DOMESTIC ANIMAL ON ROAD- WILD BACKED WITHOUT SAFETY USE - OTHER USE - TALKING USE - TEXTING USE - UNKNOWN CHANGED LANE WHEN UNSAFE HEADLAMPS STOP LAMPS TAIL LAMPS TURN SIGNAL
 1 of 7 9/23/2015 5:23 PM Demographics In 2008, there were 12,286 licensed drivers in Socorro County. Of these, there were 5,872 females and 6,414 males. The population of Socorro County was 18,180. The
Study Area and Location District PSA Ward ANC Phase Description B Existing 3700 Block Massachusetts Avenue Southeast Southeast-bound
 Speed Limit and Safety Nexus Studies for Automated Enforcement Locations in the District of Columbia 37 Block Massachusetts Avenue SE Study Area and Location District PSA Ward ANC Phase Description 6 65
Washtenaw County Traffic Crash Data & Year Trends. Reporting Criteria
 June 2018 Revised 8/3/2018 2017 Reporting Criteria Please pay particular attention to the wording when interpreting the three levels of data gathered for this report. Crash The Crash Level analyzes data
Washtenaw County Traffic Crash Data & Year Trends. Reporting Criteria
 June 2017 Revised 10/3/17 2016 Reporting Criteria Please pay particular attention to the wording when interpreting the three levels of data gathered for this report. Crash The Crash Level analyzes data
REAL-TIME ELECTRONIC SPEED FEEDBACK DISPLAYS EVALUATION:
 REAL-TIME ELECTRONIC SPEED FEEDBACK DISPLAYS EVALUATION: SHORE DRIVE TEST CASE Virginia Beach Traffic Engineering April 3, 2018 Introduction Safety is the most important aspect of our transportation system.
Driving Safely in Maryland
 Maryland Department of Transportation State Highway Administration Office of Traffic and Safety Driving Safely in Maryland In 2008, there were 141 fatal speeding crashes, accounting for 28% of all fatal
2019 VIRGINIA LAW ENFORCEMENT CHALLENGE APPLICATION
 2019 VIRGINIA LAW CHALLENGE APPLICATION Applications are due to VLEC@vachiefs.org by SATURDAY, MAY 11, 2019, by 11:59 PM Click here for a copy of the LEC How-To Guide: https://bit.ly/2mc8rfn Agency Name
RTCSNV CRASH ANALYSIS REPORT
 2011-2015 RTCSNV CRASH ANALYSIS REPORT TABLE OF CONTENTS Summary... 3 Crash Types... 4 Time and Day of Crashes... 7 Crash Factors... 9 Fatalities... 10 Driver s Behavior... 11 Crash Locations... 15 Non-Motorized
Disclaimer. Additional information. Crash fact sheets. Travel survey fact sheets
 Trucks 2017 Disclaimer All reasonable endeavours are made to ensure the accuracy of the information in this report. However, the information is provided without warranties of any kind including accuracy,
1999 Missouri State Highway System. Missouri Department of Transportation - Transportation Management Systems
 1999 Missouri State Highway System Traffic Accident Statistics - Transportation Management Systems Missouri State Highway System Traffic Accident Statistics Table of Contents Subject Chapter 1: Statewide
Contributory factors of powered two wheelers crashes
 Contributory factors of powered two wheelers crashes Pierre Van Elslande, IFSTTAR George Yannis, NTUA Veronique Feypell, OECD/ITF Eleonora Papadimitriou, NTUA Carol Tan, FHWA Michael Jordan, NHTSA Research
Study Area and Location District PSA Ward ANC Phase Description C Existing 100 Block Michigan Avenue Northeast Westbound
 Speed Limit and Safety Nexus Studies for Automated Enforcement Locations in the District of Columbia 1 Block Michigan Avenue NE W/B Study Area and Location District PSA Ward ANC Phase Description 5 45
Study Area and Location District PSA Ward ANC Phase Description C Proposed 2600 Block Lincoln Road Northeast Northbound
 Speed Limit and Safety Nexus Studies for Automated Enforcement Locations in the District of Columbia 2600 Block Lincoln Road NE Study Area and Location District PSA Ward ANC Phase Description 5 502 5 5C
Speed Limit and Safety Nexus Studies for Automated Enforcement Locations in the District of Columbia 3rd Street Tunnel at Massachusetts Avenue Exit
 Speed Limit and Safety Nexus Studies for Automated Enforcement Locations in the District of Columbia 3rd Street Tunnel at Massachusetts Avenue Exit Study Area and Location District PSA Ward ANC Phase Description
Regional Safety Action Plan and Safety Investigation Program
 Regional Safety Action Plan and Safety Investigation Program Technical Advisory Committee Meeting #3 Insert image credit here (or delete) April 17, 2018 Number of Serious Injuries New York State Serious
New York City Motorcycle Safety Study ALLEN MALLS: BEFORE, TEMPORARY MATERIALS, AFTER (CAPITAL): CHINATOWN (MANHATTAN)
: CHINATOWN (MANHATTAN)") New York City Motorcycle Safety Study 2014 Chris Brunson, Project Manager, Research Implementation and Safety Alicia Posner, Project Manager, Research Implementation and Safety New York City Department
New York City Motorcycle Safety Study 2014 Chris Brunson, Project Manager, Research Implementation and Safety Alicia Posner, Project Manager, Research Implementation and Safety New York City Department
Study Area and Location District PSA Ward ANC Phase Description B Existing 600 Block New York Avenue Northeast Westbound
 Speed Limit and Safety Nexus Studies for Automated Enforcement Locations in the District of Columbia 6 Block New York Avenue NE Study Area and Location District PSA Ward ANC Phase Description 5 55 5 5B
Speed Limit and Safety Nexus Studies for Automated Enforcement Locations in the District of Columbia 3600 Block Martin Luther King, Jr.
 Speed Limit and Safety Nexus Studies for Automated Enforcement Locations in the District of Columbia 36 Block Martin Luther King, Jr. Avenue SE Study Area and Location District PSA Ward ANC Phase Description
 1 of 7 9/23/2015 5:20 PM Demographics In 2008, there were 91,559 licensed drivers in Sandoval County. Of these, there were 46,678 females and 44,881 males. The population of Sandoval County was 122,298.
Doña Ana County Report, 2001
 Doña Ana County Report, 1 Demographics In 1, there were 7,7 licensed drivers in Doña Ana County. Of these, there were 17,15 females and,115 males. The population in Doña Ana County was 87,1. The total
USE RESTRICTED 23 USC 409
 Study Map & Totals Legend Fatality Injury Property Damage Remarks: NONE Date Range: 01-01-2010 thru 12-31-2014 2010 2011 2012 Fat Incap Inj Non-Incap Inj Poss Inj PD Tot Fat Incap Inj Non-Incap Inj Poss
DRIVER CONTRIBUTING CIRCUMSTANCES
 DRIVER CONTRIBUTING CIRCUMSTANCES Primary Driver Contributing Circumstances Frequency Coded % of Total Failed to Give Full Time and Attention 3,943 4.4% Failed to Yield RightofWay 1,346 13.5% Too Fast
Delaware Information and Analysis Center
 Delaware Information and Analysis Center 2015 DELAWARE THERE WERE 684,731 LICENSED DRIVERS, 892,508 REGISTERED MOTOR VEHICLES, AND 9,761,000,000 VEHICLE MILES DRIVEN*. THERE WERE 24,066 TRAFFIC CRASHES
ODOT Transportation Safety. It All Starts With Crash Data
 ODOT Transportation Safety Programs It All Starts With Crash Data Robin Ness, Mgr. Crash Analysis & Reporting Unit Oregon Department of Transportation (ODOT) 17 th Annual Northwest Tribal Symposium Red
Motorcyclist Deaths Jan Jul. 2018
 Motorcyclist Deaths Jan. 2008 Jul. 2018 This report summarizes all accidental deaths of motorcyclists in traffic-related motor vehicle incidents (MVIs) between January 1, 2008 and July 30, 2018. Inclusion
Rio Arriba County Report, 2007
 Rio Arriba County Report, 7 Demographics In 7, there were 3,748 licensed drivers in Rio Arriba County. Of these, there were,68 females and,63 males. The population in Rio Arriba County was 4,87. The total
Study Area and Location District PSA Ward ANC Phase Description C Planned Suitland Parkway Westbound at Stanton Road Southeast
 Speed Limit and Safety Nexus Studies for Automated Enforcement Locations in the District of Columbia Suitland Parkway at Stanton Road SE Study Area and Location District PSA Ward ANC Phase Description
Michigan. Traffic. Profile
 June 2014 Revised 5/11/15 Michigan 2013 Traffic Crash Profile Reporting Criteria Please pay particular attention to the wording when interpreting the three levels of data gathered for this report. Crash
Collision Analysis Safety Tables
 Crash Severity Geography of Geography of Time and Date of Crash Conditions Features Features.. Queries Selected: Town(Hartford), Date(Year:All or //05 to 9/7/06), Severity(All), Route Class(Interstate),
Study Area and Location District PSA Ward ANC Phase Description A Proposed Monroe Street Northeast Eastbound at Rhode Island Avenue
 Speed Limit and Safety Nexus Studies for Automated Enforcement Locations in the District of Columbia Monroe Street NE and Rhode Island Avenue NE Study Area and Location District PSA Ward ANC Phase Description
Analysis of Road Crash Statistics Western Australia 1990 to Report. December Project: Transport/21
 Analysis of Road Crash Statistics Western Australia 1990 to 1999 Report December 2000 Project: Transport/21 Analysis of Road Crash Statistics Western Australia 1990 to 1999 December 2000 Client: Transport
Michigan. Traffic. Profile
 June 2014 Revised 5/11/15 Michigan 2013 Traffic Crash Profile Reporting Criteria Please pay particular attention to the wording when interpreting the three levels of data gathered for this report. Crash
DRIVER EDUCATION FORUM 5/10/2007 SFC. T. ARCARO
 DRIVER EDUCATION FORUM 5/10/2007 SFC. T. ARCARO CRASHES Motor vehicle crashes are the leading cause of death for people ages 16 through 24 years old. The fatality rate for young drivers 16 through 19 years
Motorcycle Safety A Single Point of Truth
 Motorcycle Safety A Single Point of Truth Bringing together motorcycle safety information from the different data sources into one document Data sources include ACC, Ministry of Transport, NZ Transport
Lane Closure Manual. Route Report Index: US12-A US12-03 (WB) US12-01 (EB WB) US12-02 (EB)
 US12-01 (EB WB) US12-02 (EB)") Route Report Index: US1-A?A@ 15 %&'( 94?A@ 5?A@?A@ 95 +, 16 9?A@?A@ 47 %&'( 95 5?A@ 65 +, 8 +, 1 5 %&'( 94 %&'( 69 4 %&'( 5 W %&'( 5 E +, 61?A@ 95 %&'( %&'( 69 4 9 4 %&'( 94 %&'( 49 4 NOTE: Lane closures
Route Report Index: US1-A?A@ 15 %&'( 94?A@ 5?A@?A@ 95 +, 16 9?A@?A@ 47 %&'( 95 5?A@ 65 +, 8 +, 1 5 %&'( 94 %&'( 69 4 %&'( 5 W %&'( 5 E +, 61?A@ 95 %&'( %&'( 69 4 9 4 %&'( 94 %&'( 49 4 NOTE: Lane closures
W District Department of Transportation 55 M Street, SE, Suite 400 Washington, DC 20003
 Speed Limit and Safety Nexus Studies for Automated Enforcement Locations in the District of Columbia 35 Block Martin Luther King, Jr. Avenue SE SW/B Study Area and Location District PSA Ward ANC Phase
Michigan State Police (MSP) Traffic Safety Network Traverse Bay Area
 Traffic Safety Network Traverse Bay Area") June 2016 Revised 2/15/2017 2015 Reporting Criteria Please pay particular attention to the wording when interpreting the three levels of data gathered for this report. Crash The Crash Level analyzes data
June 2016 Revised 2/15/2017 2015 Reporting Criteria Please pay particular attention to the wording when interpreting the three levels of data gathered for this report. Crash The Crash Level analyzes data
USE RESTRICTED 23 USC 409
 Created: 04/29/2016 by Randy Woods Study Map & Totals Legend Fatality Injury Property Damage Remarks: NONE Date Range: 01-01-2006 thru 12-31-2015 2006 2007 2008 Fat Incap Inj Non-Incap Inj Poss Inj PD
Rio Arriba County Report, 2002
 Rio Arriba County Report, Demographics In, there were,8 licensed drivers in Rio Arriba County. Of these, there were 8,8 females and 8,8 males. The population in Rio Arriba County was,9. The total number
Speed Limit and Safety Nexus Studies for Automated Enforcement Locations in the District of Columbia 400 Block 14th Street SW
 Speed Limit and Safety Nexus Studies for Automated Enforcement Locations in the District of Columbia 4 Block 4th Street SW Study Area and Location District PSA Ward ANC Phase Description 27 6 6D Existing
Collect and analyze data on motorcycle crashes, injuries, and fatalities;
 November 2006 Highway Safety Program Guideline No. 3 Motorcycle Safety Each State, in cooperation with its political subdivisions and tribal governments and other parties as appropriate, should develop
Road Safety. Background Information. Motor Vehicle Collisions
 Background Information Motor Vehicle Collisions For many Canadians, the riskiest part of their job is their time spent on the road driving. Motor vehicle collisions are the leading cause of injury and
Speed Limit Study: Traffic Engineering Report
 Speed Limit Study: Traffic Engineering Report This report documents the engineering and traffic investigation required by Vermont Statutes Annotated Title 23, Chapter 13 1007 for a municipal legislative
Understanding Traffic Data: How To Avoid Making the Wrong Turn
 Traffic Records Forum 2011 Understanding Traffic Data: How To Avoid Making the Wrong Turn Presenter: Marc Starnes (202) 366-2186 marc.starnes@dot.gov August 3rd, 2011 1 Summary of Topics Police Crash Reports
Motorcycle Accident Causation and Identification of Countermeasures in Thailand Summary of Findings - Bangkok
 Motorcycle Accident Causation and Identification of Countermeasures in Thailand Summary of Findings - Bangkok The data obtained from all 723-on scenes, in-depth accident investigation cases reveal several
NEW JERSEY LAW ENFORCEMENT LIAISON NEWSLETTER
 NEW JERSEY LAW ENFORCEMENT LIAISON NEWSLETTER MAY 2018/20 WWW.NJSACOP.ORG NJ DIVISION OF HIGHWAY TRAFFIC SAFETY 2017 Click It Or Ticket & Border 2 Border Seatbelt Mobilizations The mission of the Division
2017 MDTSEA Manual - How it Corresponds to the ADTSEA 3.0 Curriculum for Segment 1 and 2 Classroom Education
 2017 MDTSEA - How it Corresponds to the ADTSEA 3.0 Curriculum for Segment 1 and 2 Classroom Education Section 5A Segment 1 Classroom Content, Objectives, and Resources 1 Introduction to Novice Driver Responsibilities
University of Central Florida Police Department. Traffic Statistical Report
 University of Central Florida Police Department Traffic Statistical Report 213-215 Richard Beary, Chief of Police Report completed January 5, 216 The University of Central Florida, home to the UCF Knights,
New Mexico Motorcycle. Crash Data. Safety Program Committee Meeting
 New Mexico Motorcycle Crash Data New Mexico Motorcycle Safety Program Committee Meeting Prepared for the NMDOT Traffic Safety Division Under Contract 5801 Jessica Bloom, Research Scientist III David Jacobs,
Van Buren County Traffic Crash Data & Year Trends. Reporting Criteria
 May 2015 Revised 3/16/2016 2014 Reporting Criteria Please pay particular attention to the wording when interpreting the three levels of data gathered for this report. Crash The Crash Level analyzes data
PASSENGER DEMAND WEST CHECKPOINT November 2018 Scheduled Departing Passengers & Seats
 26,000 24,000 22,000 20,000 18,000 16,000 14,000 12,000 10,000 8,000 6,000 4,000 2,000 0 PASSENGER DEMAND WEST CHECKPOINT Scheduled Departing Passengers & Seats Estimated Passengers per Week Scheduled
TABLE OF CONTENTS CRASHES.. VI TRENDS. VII
 TABLE OF CONTENTS Introduction. I Letter from the Governor II Executive Summary of this Report. III-IV 1998 Nevada Quick Collision Facts V CRASHES.. VI a. Statewide Total Crashes by Severity... 1 b. Statewide
University of Central Florida Police Department. Traffic Statistical Report
 University of Central Florida Police Department Traffic Statistical Report 214-216 Richard Beary, Chief of Police Report completed January 11, 216 The University of Central Florida, home to the UCF Knights,
Agenda. Puerto Rico s Highway System. An Overview of Puerto Rico
 Motorcycle Crashes and its Implications to Local Roads Dr. Alberto Figueroa Dr. Benjamin Colucci University of Puerto Rico at Mayagüez Puerto Rico LTAP Southeast Local Roads Conference (SELRC) Orange Beach,
Demographics An updated licensed driver count is not available for Navajo Nation for The total number of crashes in 2008 was 95.
 1 of 6 9/23/2015 4:57 PM Demographics An updated licensed driver count is not available for Navajo Nation for 2008. The total number of crashes in 2008 was 95. General Crash Information From 1999 to 2008
2016 Community Report Los Alamos County
 6 Los Alamos County Produced for the New Mexico Department of Transportation, Traffic Safety Division, Traffic Records Bureau, Under Contract 58 by the University of New Mexico, Geospatial and Population
2015 Community Report White Rock
 5 White Rock Produced for the New Mexico Department of Transportation, Traffic Safety Division, Traffic Records Bureau, Under Contract 58 by the University of New Mexico, Geospatial and Population Studies,
2014 Community Report Luna County
 4 Luna County Produced for the New Mexico Department of Transportation, Traffic Safety Division, Traffic Records Bureau, Under Contract 58 by the University of New Mexico, Geospatial and Population Studies,
2014 Community Report Portales
 4 Portales Produced for the New Mexico Department of Transportation, Traffic Safety Division, Traffic Records Bureau, Under Contract 58 by the University of New Mexico, Geospatial and Population Studies,
2016 Community Report Torrance County
 6 Torrance County Produced for the New Mexico Department of Transportation, Traffic Safety Division, Traffic Records Bureau, Under Contract 58 by the University of New Mexico, Geospatial and Population
2015 Community Report Torrance County
 5 Torrance County Produced for the New Mexico Department of Transportation, Traffic Safety Division, Traffic Records Bureau, Under Contract 58 by the University of New Mexico, Geospatial and Population
2016 Community Report De Baca County
 6 De Baca County Produced for the New Mexico Department of Transportation, Traffic Safety Division, Traffic Records Bureau, Under Contract 58 by the University of New Mexico, Geospatial and Population
2016 Community Report Portales
 6 Portales Produced for the New Mexico Department of Transportation, Traffic Safety Division, Traffic Records Bureau, Under Contract 58 by the University of New Mexico, Geospatial and Population Studies,
Table of Contents. Introduction...3. Fatality Trend Analysis...5. Enhanced Arizona Emphasis Areas...5. Goal...5
 Executive Summary The Governor of Arizona, through Executive Order 2004-18, established a Traffic Safety Advisory Council and charged the Council with bold responsibilities "to develop more effective strategies
2015 Community Report Grants
 5 Grants Produced for the New Mexico Department of Transportation, Traffic Safety Division, Traffic Records Bureau, Under Contract 58 by the University of New Mexico, Geospatial and Population Studies,
TARGET ZERO TEAM PROJECT DUI ZONE IDENTIFICATION AND BASELINE DATA SNOHOMISH COUNTY
 TARGET ZERO TEAM PROJECT DUI ZONE IDENTIFICATION AND BASELINE DATA 2005 2009 SNOHOMISH COUNTY TABLE OF CONTENTS COUNTY CHARACTERISTICS AND SUMMARY... TOTAL FATAL COLLISIONS 4 DUI ZONE IDENTIFICATION...
1 of 7 9/22/2015 1:20 PM
 1 of 7 9/22/2015 1:20 PM Demographics In 2009, there were 27,245 licensed drivers in Alamogordo. Of these, there were 13,674 females and 13,571 males. The population of Alamogordo was 35,984. The total
Kent County Traffic Crash Data & Year Trends. Reporting Criteria
 May 2015 Revised 3/16/2016 2014 Reporting Criteria Please pay particular attention to the wording when interpreting the three levels of data gathered for this report. Crash The Crash Level analyzes data
2016 Community Report Santa Fe County
 26 Santa Fe County Produced for the New Mexico Department of Transportation, Traffic Safety Division, Traffic Records Bureau, Under Contract 58 by the University of New Mexico, Geospatial and Population
2015 Community Report Las Vegas
 5 Las Vegas Produced for the New Mexico Department of Transportation, Traffic Safety Division, Traffic Records Bureau, Under Contract 58 by the University of New Mexico, Geospatial and Population Studies,
2014 Community Report Las Vegas
 4 Las Vegas Produced for the New Mexico Department of Transportation, Traffic Safety Division, Traffic Records Bureau, Under Contract 58 by the University of New Mexico, Geospatial and Population Studies,
2014 Community Report Truth or Consequences
 4 Truth or Consequences Produced for the New Mexico Department of Transportation, Traffic Safety Division, Traffic Records Bureau, Under Contract 58 by the University of New Mexico, Geospatial and Population
2016 Community Report San Juan County
 26 San Juan County Produced for the New Mexico Department of Transportation, Traffic Safety Division, Traffic Records Bureau, Under Contract 58 by the University of New Mexico, Geospatial and Population
2015 Community Report San Juan County
 25 San Juan County Produced for the New Mexico Department of Transportation, Traffic Safety Division, Traffic Records Bureau, Under Contract 58 by the University of New Mexico, Geospatial and Population
2015 Community Report Tularosa
 5 Tularosa Produced for the New Mexico Department of Transportation, Traffic Safety Division, Traffic Records Bureau, Under Contract 58 by the University of New Mexico, Geospatial and Population Studies,
2014 Community Report Tularosa
 4 Tularosa Produced for the New Mexico Department of Transportation, Traffic Safety Division, Traffic Records Bureau, Under Contract 8 by the University of New Mexico, Geospatial and Population Studies,
2015 Community Report Doña Ana County
 25 Doña Ana County Produced for the New Mexico Department of Transportation, Traffic Safety Division, Traffic Records Bureau, Under Contract 58 by the University of New Mexico, Geospatial and Population
2016 Community Report New Mexico
 216 Produced for the Department of Transportation, Traffic Safety Division, Traffic Records Bureau, Under Contract 581 by the University of, Geospatial and Population Studies, Traffic Research Unit Distributed
2015 Community Report Chaparral
 5 Chaparral Produced for the New Mexico Department of Transportation, Traffic Safety Division, Traffic Records Bureau, Under Contract 58 by the University of New Mexico, Geospatial and Population Studies,
2016 Community Report Aztec
 Aztec Produced for the New Mexico Department of Transportation, Traffic Safety Division, Traffic Records Bureau, Under Contract 58 by the University of New Mexico, Geospatial and Population Studies, Traffic
2015 Community Report Aztec
 25 Aztec Produced for the New Mexico Department of Transportation, Traffic Safety Division, Traffic Records Bureau, Under Contract 58 by the University of New Mexico, Geospatial and Population Studies,
ITSMR Research Note. Young Drivers on New York Roadways:
 January 2019 KEY FINDINGS In 2017: 113 persons were killed in motor vehicle crashes involving young drivers, compared to 139 in 2013. 22,485 persons were injured in young driver crashes, down 5% from 2013.
2014 Community Report Aztec
 Aztec Produced for the New Mexico Department of Transportation, Traffic Safety Division, Traffic Records Bureau, Under Contract 58 by the University of New Mexico, Geospatial and Population Studies, Traffic
SHARE THE ROAD SAFELY WITH TRUCKS!
 SAFETY MEETING PLANNER & AGENDA SHARE THE ROAD SAFELY WITH TRUCKS! Meeting Leader: Prepare in advance to make this meeting effective. Go to the Thinking Driver website for instructions on how to best use
Course Syllabus. Time Requirements. Course Timeline. Grading Policy. Contact Information Online classroom Instructor: Kyle Boots
 Course Syllabus Course Overview This course is designed to meet the classroom requirement of your driver s education experience. It is approved by the State of Indiana. Time Requirements The State of Indiana